u.s. office market statistics (q4 2014) and 2015 outlook
TRANSCRIPT
Expansionary leasing activity
driving growth across markets
United States Office Review Q4 2014
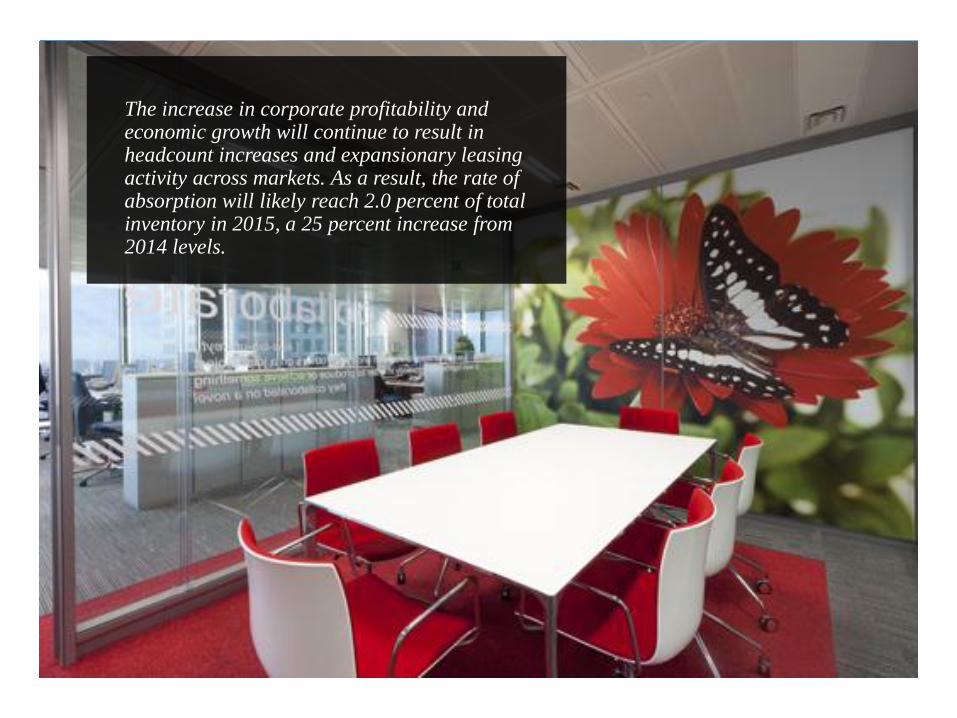
The increase in corporate profitability and economic growth will continue to result in headcount increases and expansionary leasing activity across markets. As a result, the rate of absorption will likely reach 2.0 percent of total inventory in 2015, a 25 percent increase from 2014 levels.
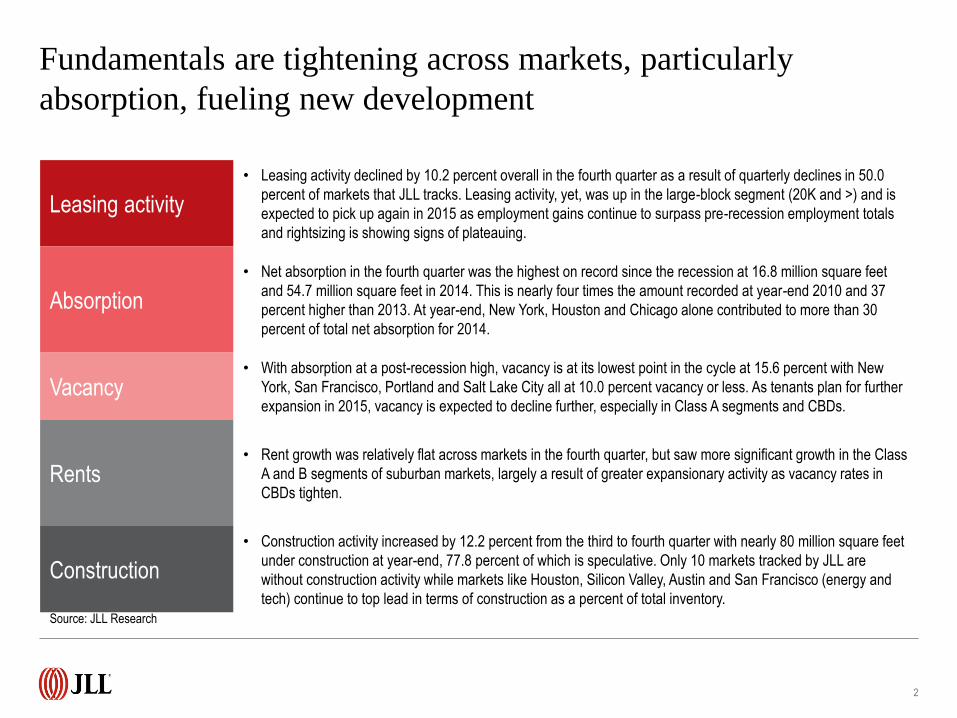
Fundamentals are tightening across markets, particularly
absorption, fueling new development
2
Source: JLL Research
Leasing activity
• Leasing activity declined by 10.2 percent overall in the fourth quarter as a result of quarterly declines in 50.0
percent of markets that JLL tracks. Leasing activity, yet, was up in the large-block segment (20K and >) and is
expected to pick up again in 2015 as employment gains continue to surpass pre-recession employment totals
and rightsizing is showing signs of plateauing.
Absorption
• Net absorption in the fourth quarter was the highest on record since the recession at 16.8 million square feet
and 54.7 million square feet in 2014. This is nearly four times the amount recorded at year-end 2010 and 37
percent higher than 2013. At year-end, New York, Houston and Chicago alone contributed to more than 30
percent of total net absorption for 2014.
Vacancy • With absorption at a post-recession high, vacancy is at its lowest point in the cycle at 15.6 percent with New
York, San Francisco, Portland and Salt Lake City all at 10.0 percent vacancy or less. As tenants plan for further
expansion in 2015, vacancy is expected to decline further, especially in Class A segments and CBDs.
Rents • Rent growth was relatively flat across markets in the fourth quarter, but saw more significant growth in the Class
A and B segments of suburban markets, largely a result of greater expansionary activity as vacancy rates in
CBDs tighten.
Construction
• Construction activity increased by 12.2 percent from the third to fourth quarter with nearly 80 million square feet
under construction at year-end, 77.8 percent of which is speculative. Only 10 markets tracked by JLL are
without construction activity while markets like Houston, Silicon Valley, Austin and San Francisco (energy and
tech) continue to top lead in terms of construction as a percent of total inventory.

Leasing activity
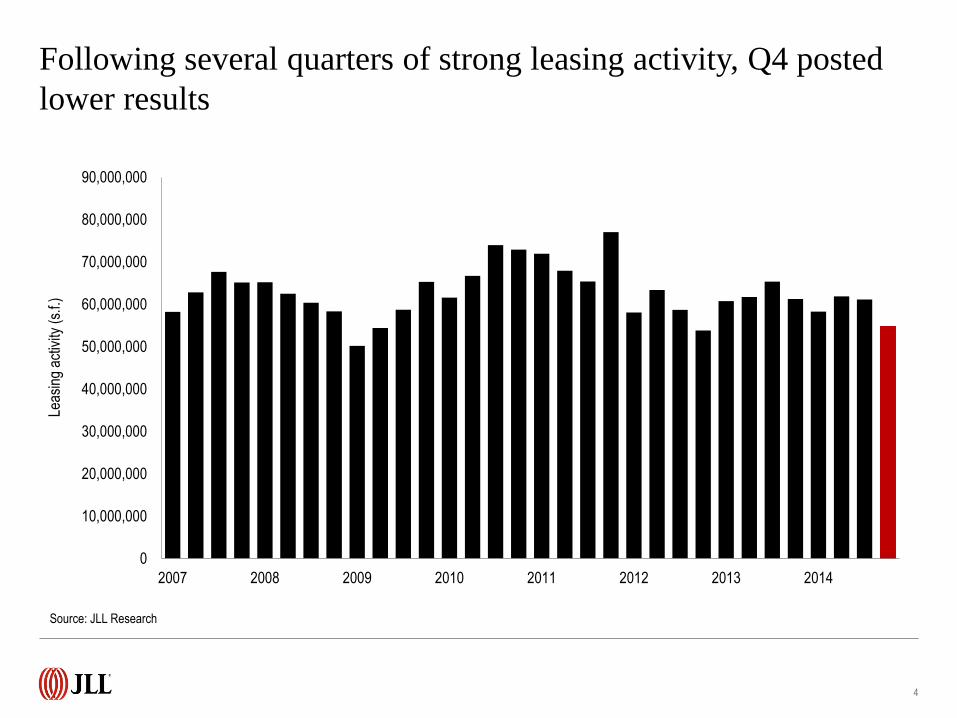
Following several quarters of strong leasing activity, Q4 posted
lower results
4
0
10,000,000
20,000,000
30,000,000
40,000,000
50,000,000
60,000,000
70,000,000
80,000,000
90,000,000
2007 2008 2009 2010 2011 2012 2013 2014
Leas
ing
activ
ity (
s.f.)
Source: JLL Research
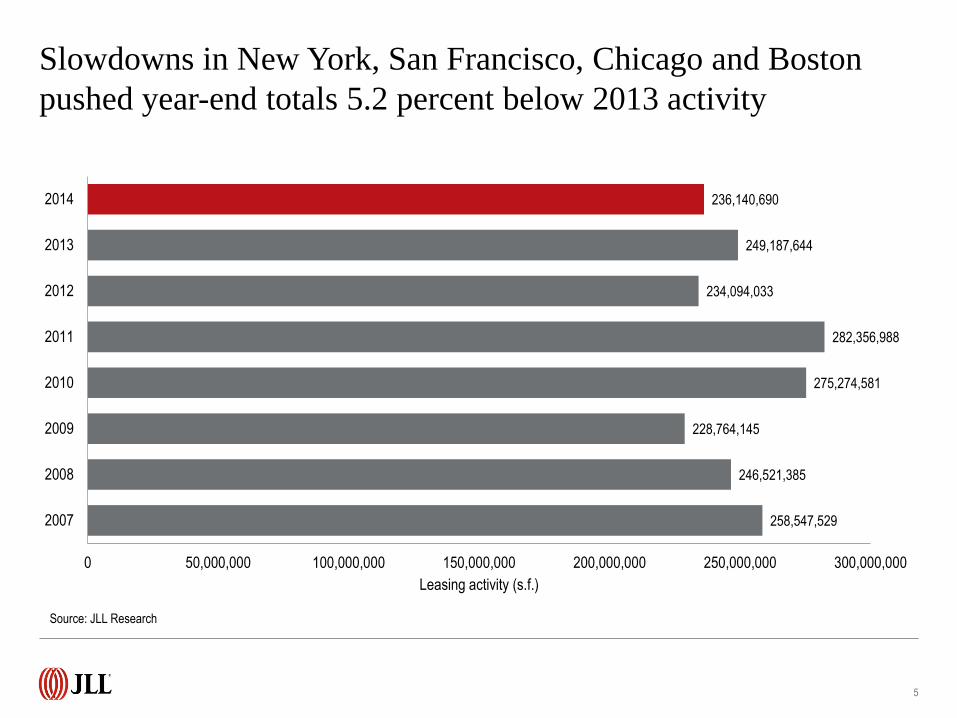
Slowdowns in New York, San Francisco, Chicago and Boston
pushed year-end totals 5.2 percent below 2013 activity
5
258,547,529
246,521,385
228,764,145
275,274,581
282,356,988
234,094,033
249,187,644
236,140,690
0 50,000,000 100,000,000 150,000,000 200,000,000 250,000,000 300,000,000
2007
2008
2009
2010
2011
2012
2013
2014
Leasing activity (s.f.)
Source: JLL Research
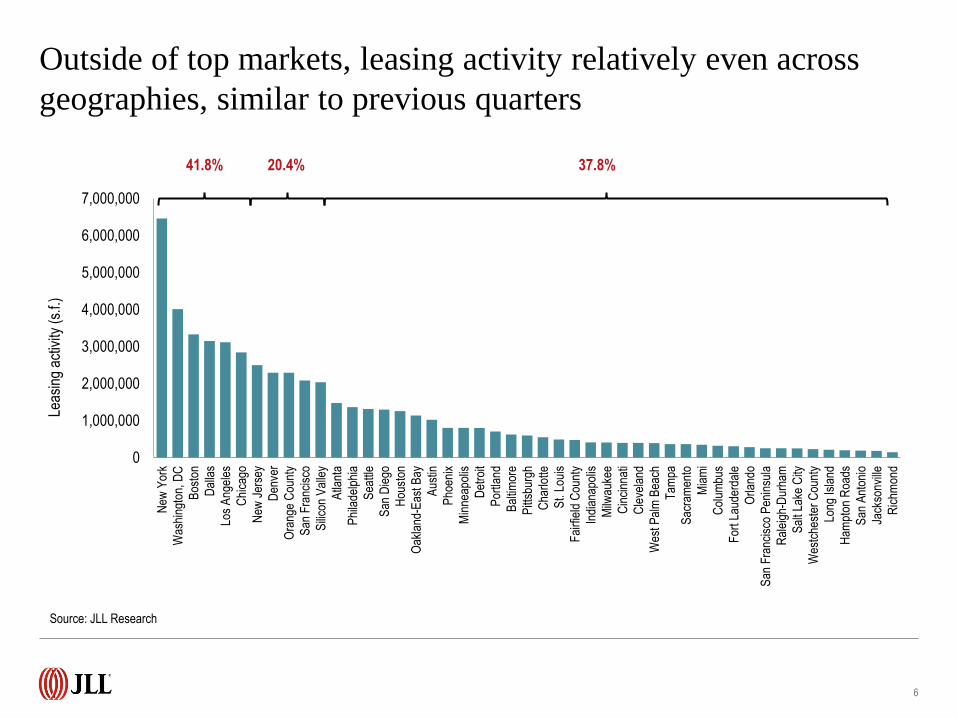
Outside of top markets, leasing activity relatively even across
geographies, similar to previous quarters
6
0
1,000,000
2,000,000
3,000,000
4,000,000
5,000,000
6,000,000
7,000,000
New
Yor
k
Was
hing
ton,
DC
Bos
ton
Dal
las
Los
Ang
eles
Chi
cago
New
Jer
sey
Den
ver
Ora
nge
Cou
nty
San
Fra
ncis
co
Sili
con
Val
ley
Atla
nta
Phi
lade
lphi
a
Sea
ttle
San
Die
go
Hou
ston
Oak
land
-Eas
t Bay
Aus
tin
Pho
enix
Min
neap
olis
Det
roit
Por
tland
Bal
timor
e
Pitt
sbur
gh
Cha
rlotte
St.
Loui
s
Fai
rfie
ld C
ount
y
Indi
anap
olis
Milw
auke
e
Cin
cinn
ati
Cle
vela
nd
Wes
t Pal
m B
each
Tam
pa
Sac
ram
ento
Mia
mi
Col
umbu
s
For
t Lau
derd
ale
Orla
ndo
San
Fra
ncis
co P
enin
sula
Ral
eigh
-Dur
ham
Sal
t Lak
e C
ity
Wes
tche
ster
Cou
nty
Long
Isla
nd
Ham
pton
Roa
ds
San
Ant
onio
Jack
sonv
ille
Ric
hmon
d
Leas
ing
activ
ity (
s.f.)
Source: JLL Research
41.8% 20.4% 37.8%
7
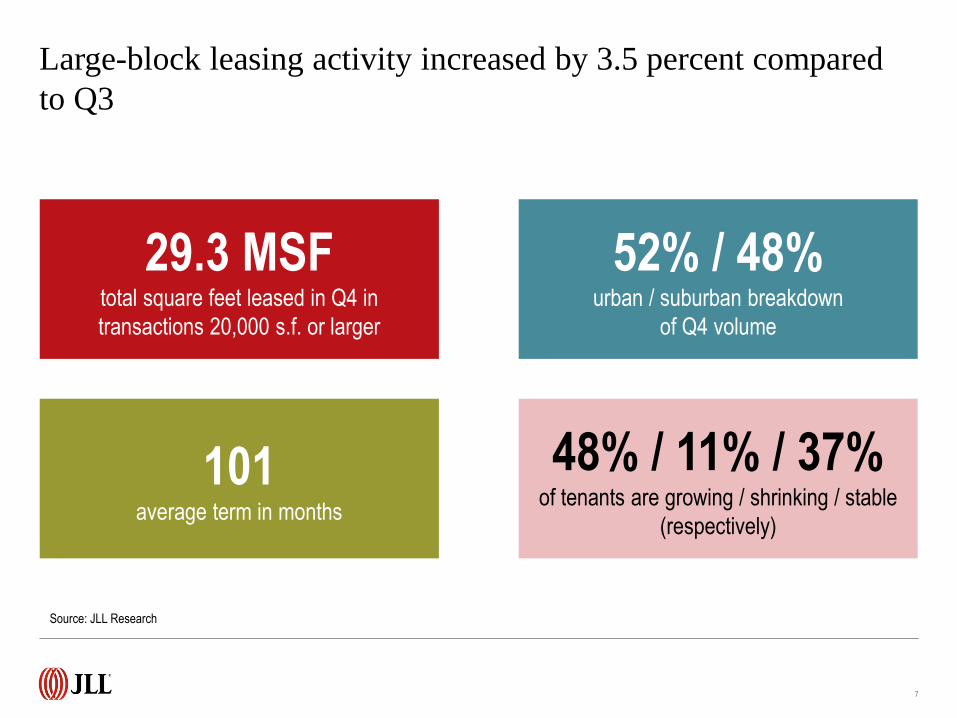
29.3 MSF total square feet leased in Q4 in
transactions 20,000 s.f. or larger
101 average term in months
48% / 11% / 37% of tenants are growing / shrinking / stable
(respectively)
52% / 48% urban / suburban breakdown
of Q4 volume
Large-block leasing activity increased by 3.5 percent compared
to Q3
Source: JLL Research
8
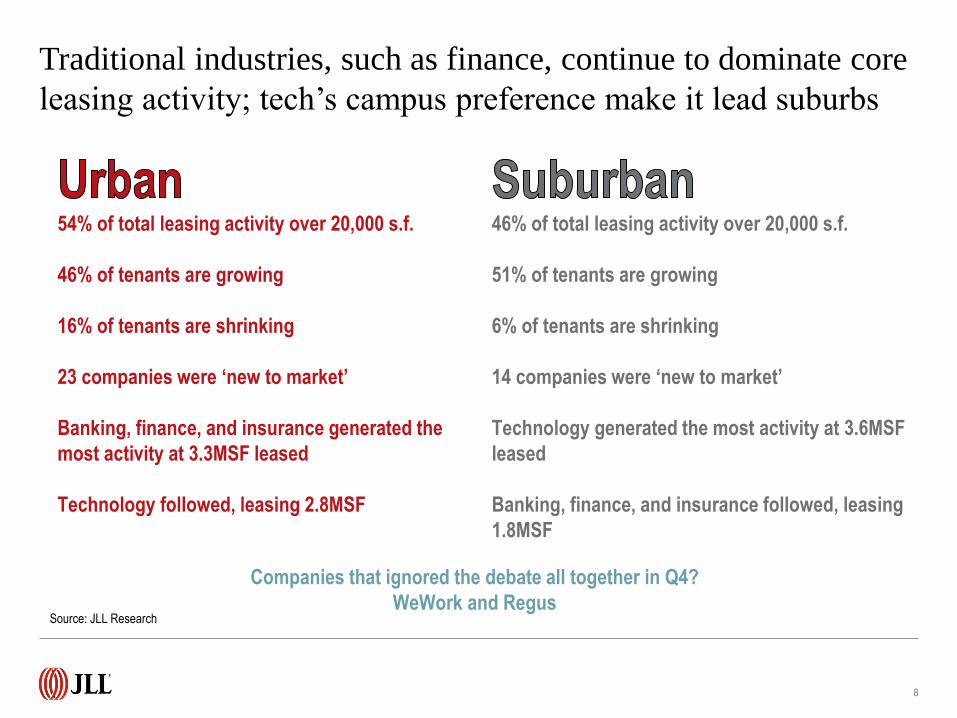
54% of total leasing activity over 20,000 s.f.
46% of tenants are growing
16% of tenants are shrinking
23 companies were ‘new to market’
Banking, finance, and insurance generated the
most activity at 3.3MSF leased
Technology followed, leasing 2.8MSF
46% of total leasing activity over 20,000 s.f.
51% of tenants are growing
6% of tenants are shrinking
14 companies were ‘new to market’
Technology generated the most activity at 3.6MSF
leased
Banking, finance, and insurance followed, leasing
1.8MSF
Companies that ignored the debate all together in Q4?
WeWork and Regus
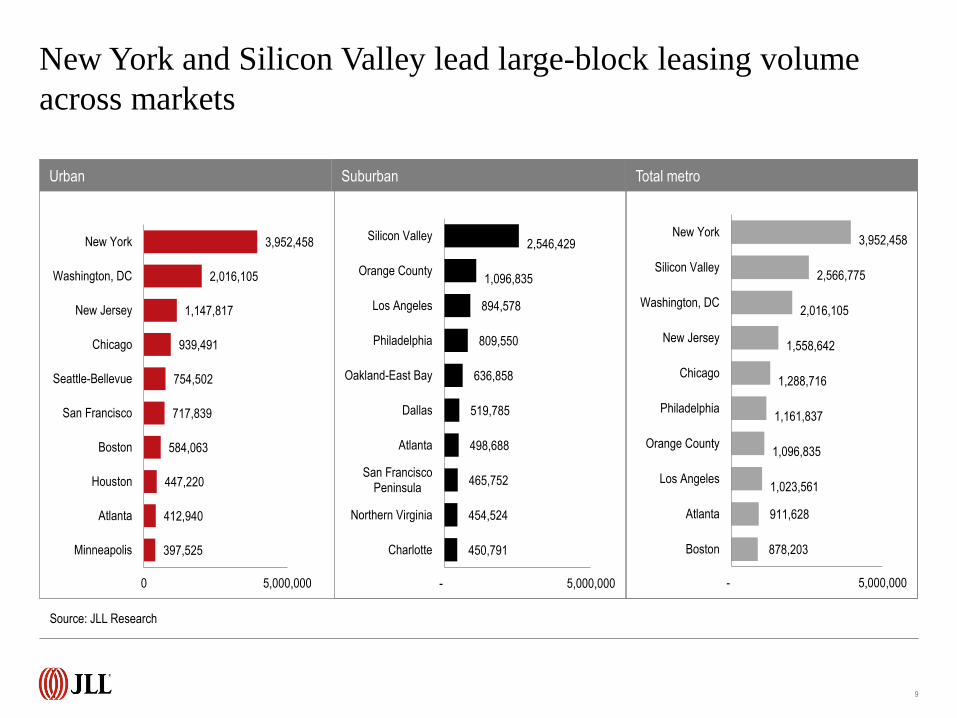
Traditional industries, such as finance, continue to dominate core
leasing activity; tech’s campus preference make it lead suburbs
Source: JLL Research
9
Urban Suburban Total metro
397,525
412,940
447,220
584,063
717,839
754,502
939,491
1,147,817
2,016,105
3,952,458
0 5,000,000
Minneapolis
Atlanta
Houston
Boston
San Francisco
Seattle-Bellevue
Chicago
New Jersey
Washington, DC
New York
450,791
454,524
465,752
498,688
519,785
636,858
809,550
894,578
1,096,835
2,546,429
- 5,000,000
Charlotte
Northern Virginia
San FranciscoPeninsula
Atlanta
Dallas
Oakland-East Bay
Philadelphia
Los Angeles
Orange County
Silicon Valley
878,203
911,628
1,023,561
1,096,835
1,161,837
1,288,716
1,558,642
2,016,105
2,566,775
3,952,458
- 5,000,000
Boston
Atlanta
Los Angeles
Orange County
Philadelphia
Chicago
New Jersey
Washington, DC
Silicon Valley
New York
New York and Silicon Valley lead large-block leasing volume
across markets
Source: JLL Research
10
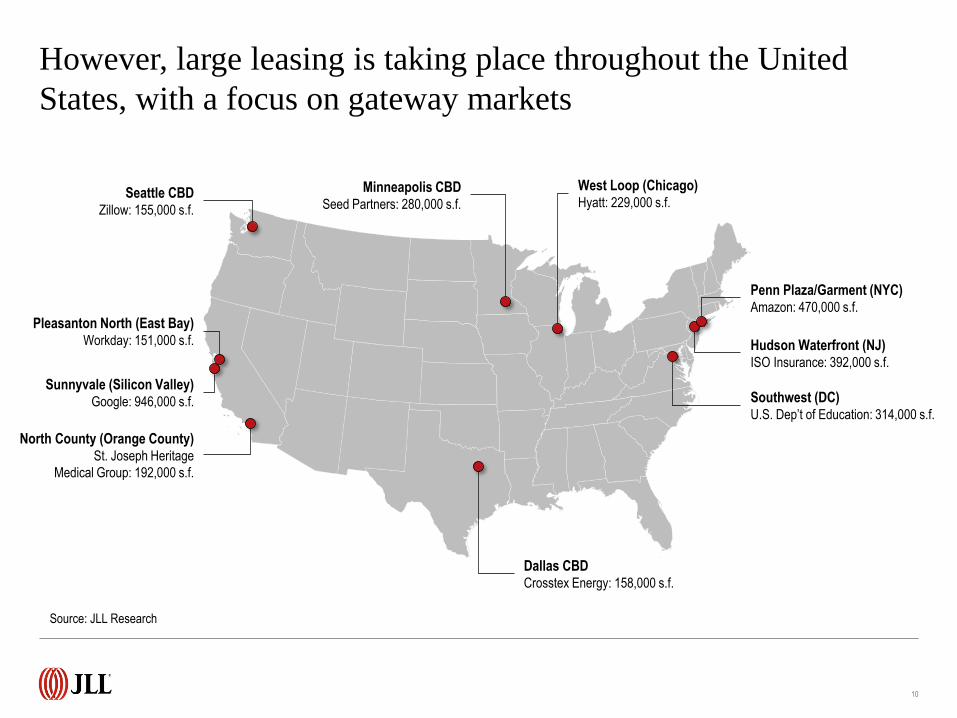
However, large leasing is taking place throughout the United
States, with a focus on gateway markets
Seattle CBD Zillow: 155,000 s.f.
Pleasanton North (East Bay) Workday: 151,000 s.f.
Sunnyvale (Silicon Valley) Google: 946,000 s.f.
North County (Orange County) St. Joseph Heritage
Medical Group: 192,000 s.f.
Dallas CBD Crosstex Energy: 158,000 s.f.
Minneapolis CBD Seed Partners: 280,000 s.f.
West Loop (Chicago) Hyatt: 229,000 s.f.
Hudson Waterfront (NJ) ISO Insurance: 392,000 s.f.
Penn Plaza/Garment (NYC) Amazon: 470,000 s.f.
Southwest (DC) U.S. Dep’t of Education: 314,000 s.f.
Source: JLL Research
Month 00, 2014 11
Unknown
Creative
Consumer-oriented
Non-profit
Professional and business services
Finance
Scientific & technical
- 5,000,000 10,000,000 15,000,000
Unknown
Manufacturing & distribution
Retail & hospitality
Marketing, advertising,…
Media & entertainment
Association, non-profit, union
Education
Government
Accounting, consulting, research,…
Other professional and business…
Law firm
Real estate
Banking, finance, insurance
Aerospace, defense, transportation
Energy & utilities
Architecture, engineering,…
Life sciences
Telecom/Mobile
Healthcare
Technology
- 2,000,000 4,000,000 6,000,000
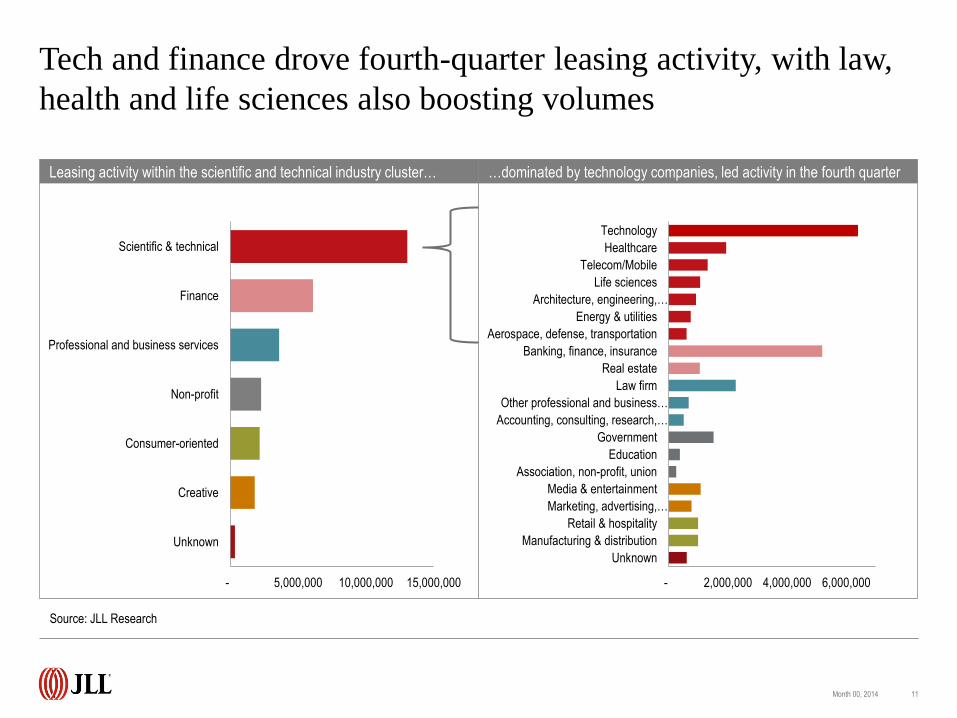
Leasing activity within the scientific and technical industry cluster… …dominated by technology companies, led activity in the fourth quarter
Tech and finance drove fourth-quarter leasing activity, with law,
health and life sciences also boosting volumes
Source: JLL Research
Month 00, 2014 12
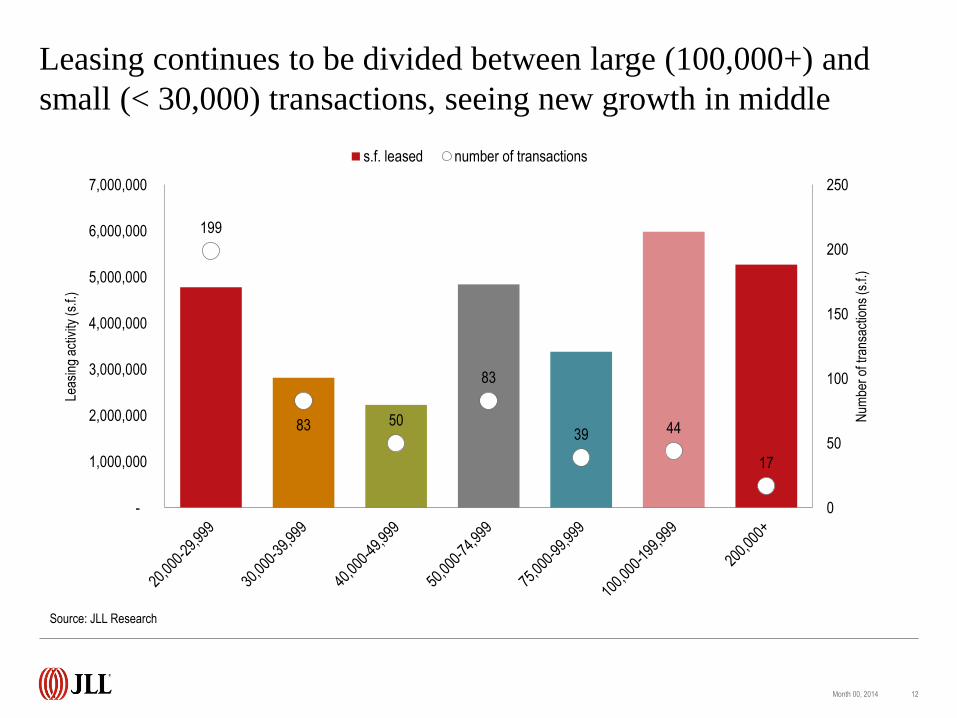
199
83 50
83
39 44
17
0
50
100
150
200
250
-
1,000,000
2,000,000
3,000,000
4,000,000
5,000,000
6,000,000
7,000,000
Num
ber
of tr
ansa
ctio
ns (s
.f.)
Leas
ing
activ
ity (
s.f.)
s.f. leased number of transactions
Leasing continues to be divided between large (100,000+) and
small (< 30,000) transactions, seeing new growth in middle
Source: JLL Research
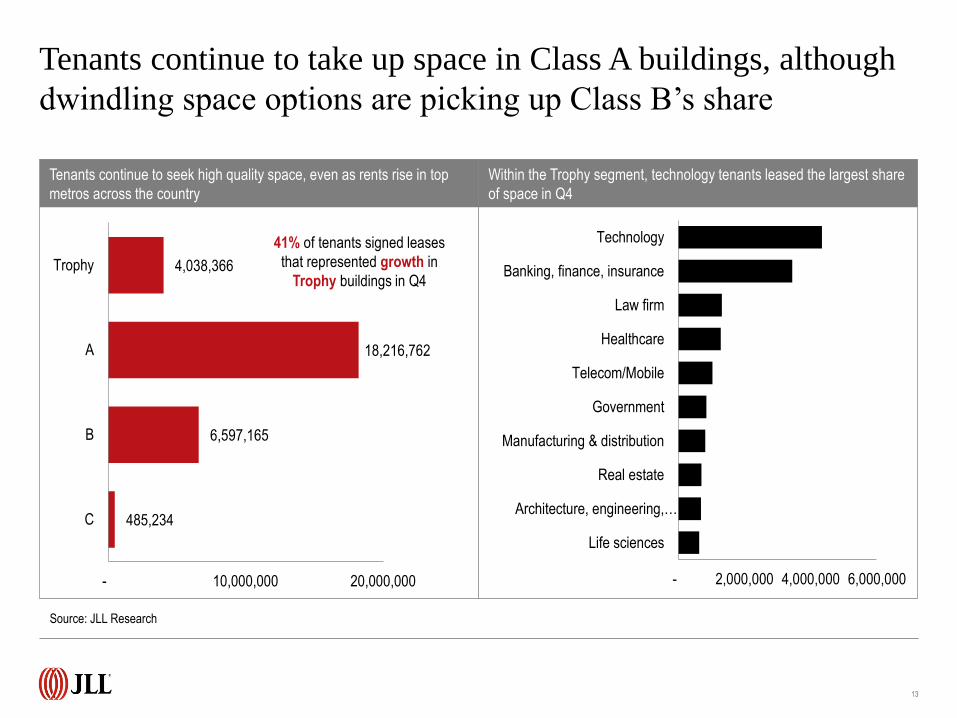
13
485,234
6,597,165
18,216,762
4,038,366
- 10,000,000 20,000,000
C
B
A
Trophy
41% of tenants signed leases
that represented growth in
Trophy buildings in Q4
Life sciences
Architecture, engineering,…
Real estate
Manufacturing & distribution
Government
Telecom/Mobile
Healthcare
Law firm
Banking, finance, insurance
Technology
- 2,000,000 4,000,000 6,000,000
Tenants continue to seek high quality space, even as rents rise in top
metros across the country
Within the Trophy segment, technology tenants leased the largest share
of space in Q4
Tenants continue to take up space in Class A buildings, although
dwindling space options are picking up Class B’s share
Source: JLL Research
14
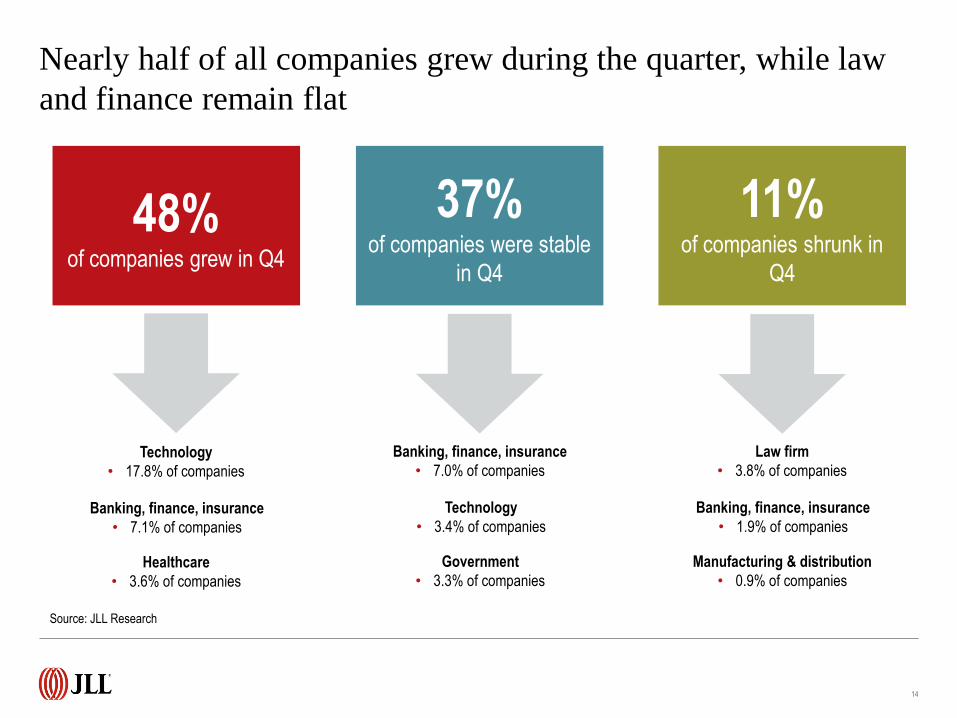
48% of companies grew in Q4
11% of companies shrunk in
Q4
37% of companies were stable
in Q4
Technology
• 17.8% of companies
Banking, finance, insurance
• 7.1% of companies
Healthcare
• 3.6% of companies
Banking, finance, insurance
• 7.0% of companies
Technology
• 3.4% of companies
Government
• 3.3% of companies
Law firm
• 3.8% of companies
Banking, finance, insurance
• 1.9% of companies
Manufacturing & distribution
• 0.9% of companies
Nearly half of all companies grew during the quarter, while law
and finance remain flat
Source: JLL Research

Absorption
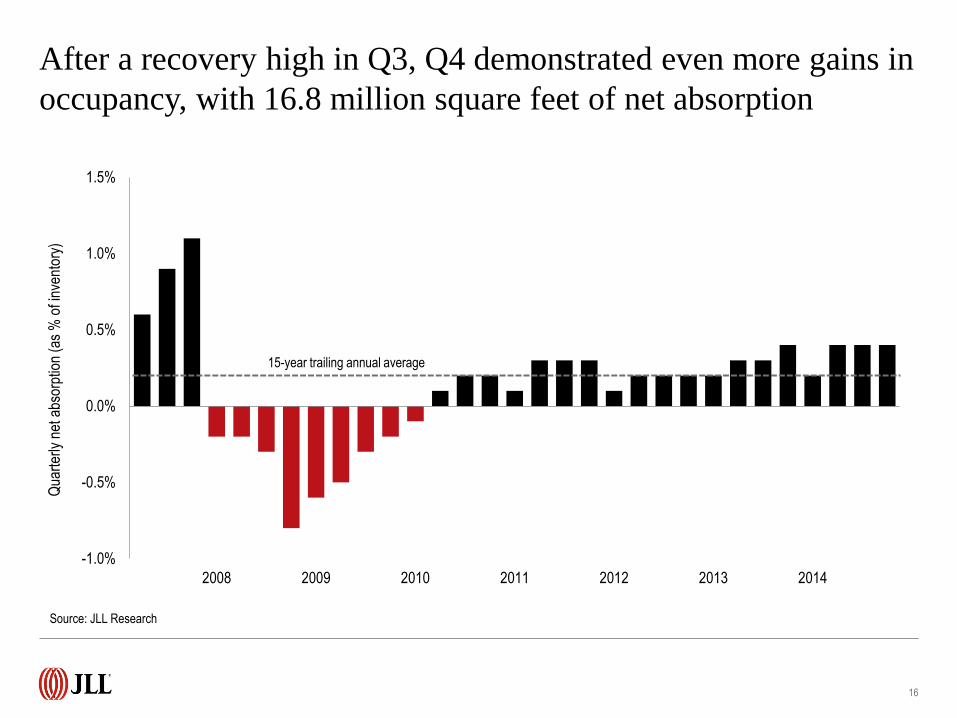
After a recovery high in Q3, Q4 demonstrated even more gains in
occupancy, with 16.8 million square feet of net absorption
16
-1.0%
-0.5%
0.0%
0.5%
1.0%
1.5%
2008 2009 2010 2011 2012 2013 2014
Qua
rter
ly n
et a
bsor
ptio
n (a
s %
of i
nven
tory
)
Source: JLL Research
15-year trailing annual average
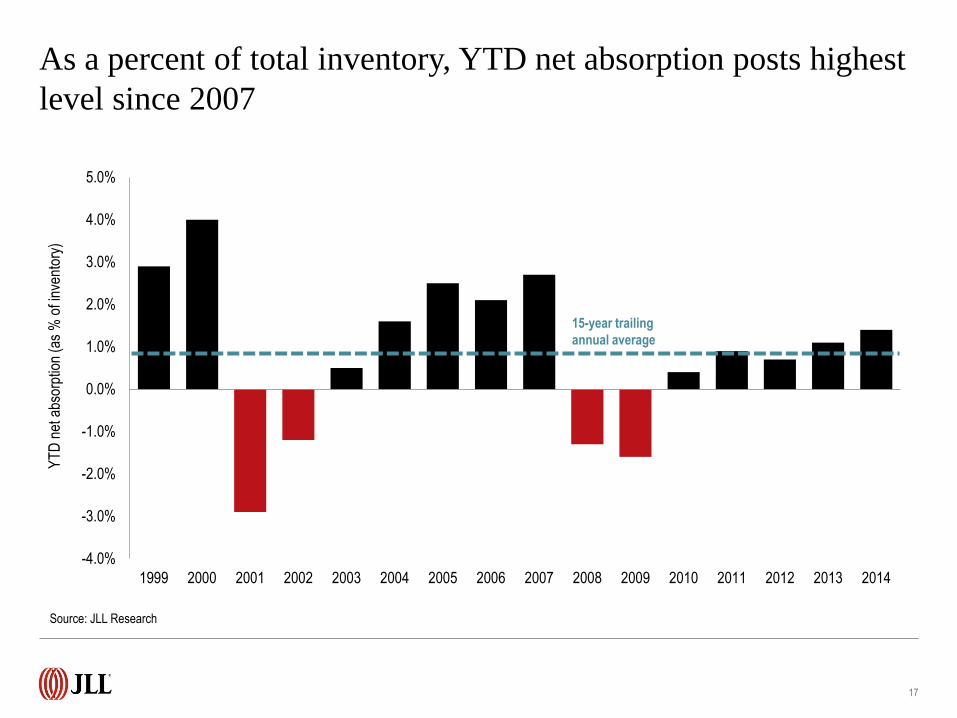
As a percent of total inventory, YTD net absorption posts highest
level since 2007
17
-4.0%
-3.0%
-2.0%
-1.0%
0.0%
1.0%
2.0%
3.0%
4.0%
5.0%
1999 2000 2001 2002 2003 2004 2005 2006 2007 2008 2009 2010 2011 2012 2013 2014
YT
D n
et a
bsor
ptio
n (a
s %
of i
nven
tory
)
Source: JLL Research
15-year trailing
annual average
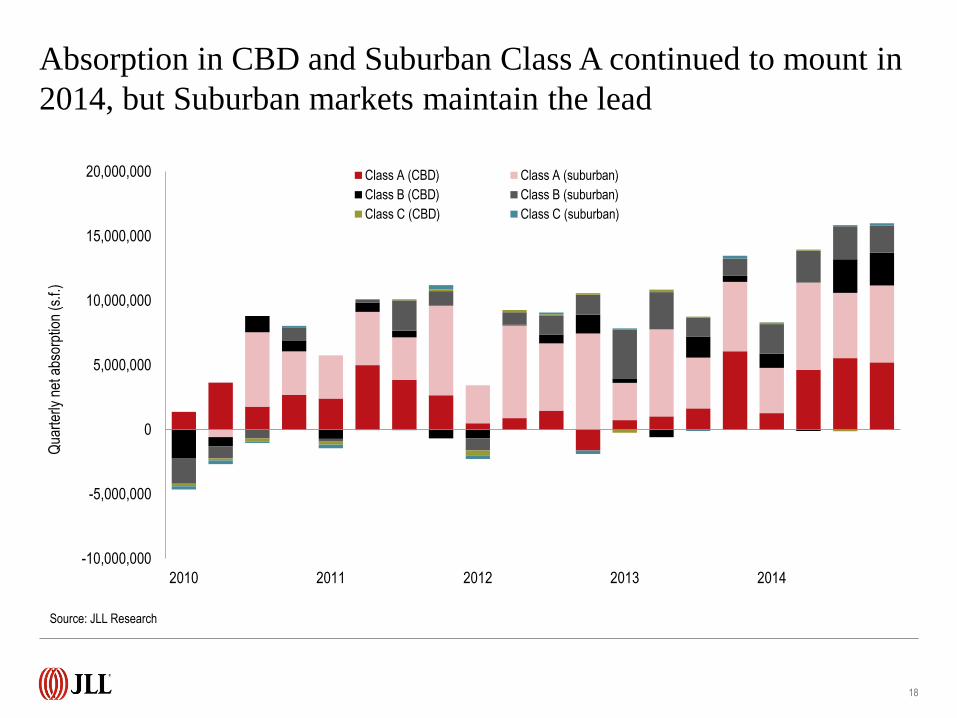
Absorption in CBD and Suburban Class A continued to mount in
2014, but Suburban markets maintain the lead
18
-10,000,000
-5,000,000
0
5,000,000
10,000,000
15,000,000
20,000,000
2010 2011 2012 2013 2014
Qua
rter
ly n
et a
bsor
ptio
n (s
.f.)
Class A (CBD) Class A (suburban)
Class B (CBD) Class B (suburban)
Class C (CBD) Class C (suburban)
Source: JLL Research
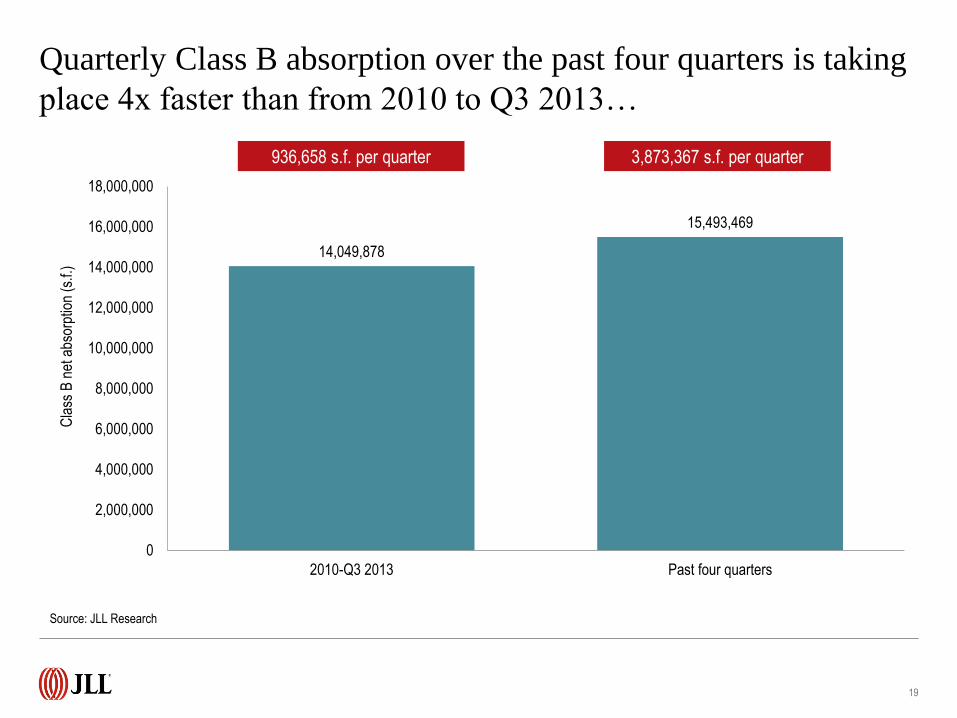
Quarterly Class B absorption over the past four quarters is taking
place 4x faster than from 2010 to Q3 2013…
19
Source: JLL Research
14,049,878
15,493,469
0
2,000,000
4,000,000
6,000,000
8,000,000
10,000,000
12,000,000
14,000,000
16,000,000
18,000,000
2010-Q3 2013 Past four quarters
Cla
ss B
net
abs
orpt
ion
(s.f.
)
936,658 s.f. per quarter 3,873,367 s.f. per quarter
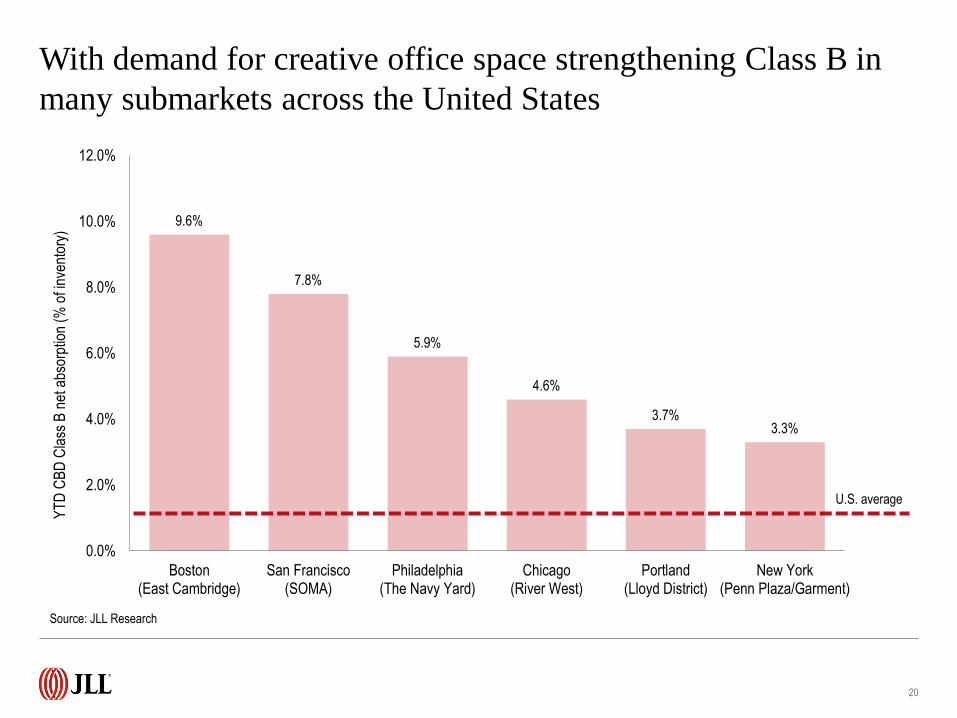
With demand for creative office space strengthening Class B in
many submarkets across the United States
20
9.6%
7.8%
5.9%
4.6%
3.7% 3.3%
0.0%
2.0%
4.0%
6.0%
8.0%
10.0%
12.0%
Boston(East Cambridge)
San Francisco(SOMA)
Philadelphia(The Navy Yard)
Chicago(River West)
Portland(Lloyd District)
New York(Penn Plaza/Garment)
YT
D C
BD
Cla
ss B
net
abs
orpt
ion
(% o
f inv
ento
ry)
Source: JLL Research
U.S. average
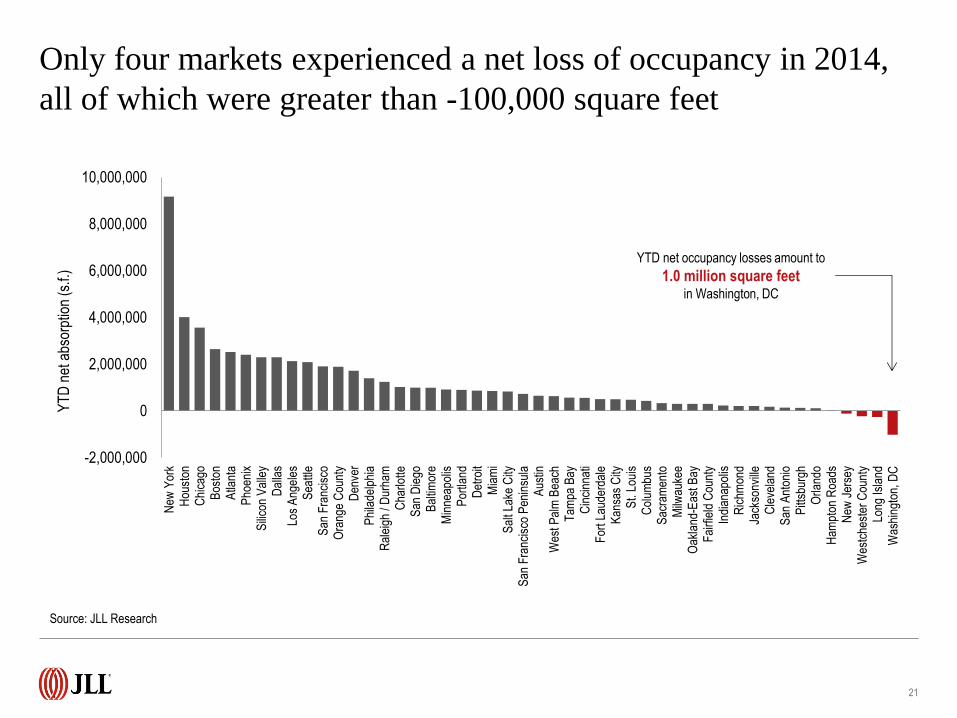
Only four markets experienced a net loss of occupancy in 2014,
all of which were greater than -100,000 square feet
21
-2,000,000
0
2,000,000
4,000,000
6,000,000
8,000,000
10,000,000N
ew Y
ork
Hou
ston
Chi
cago
Bos
ton
Atla
nta
Pho
enix
Sili
con
Val
ley
Dal
las
Los
Ang
eles
Sea
ttle
San
Fra
ncis
coO
rang
e C
ount
yD
enve
rP
hila
delp
hia
Ral
eigh
/ D
urha
mC
harlo
tteS
an D
iego
Bal
timor
eM
inne
apol
isP
ortla
ndD
etro
itM
iam
iS
alt L
ake
City
San
Fra
ncis
co P
enin
sula
Aus
tinW
est P
alm
Bea
chT
ampa
Bay
Cin
cinn
ati
For
t Lau
derd
ale
Kan
sas
City
St.
Loui
sC
olum
bus
Sac
ram
ento
Milw
auke
eO
akla
nd-E
ast B
ayF
airf
ield
Cou
nty
Indi
anap
olis
Ric
hmon
dJa
ckso
nvill
eC
leve
land
San
Ant
onio
Pitt
sbur
ghO
rland
oH
ampt
on R
oads
New
Jer
sey
Wes
tche
ster
Cou
nty
Long
Isla
ndW
ashi
ngto
n, D
C
YT
D n
et a
bsor
ptio
n (s
.f.)
Source: JLL Research
YTD net occupancy losses amount to
1.0 million square feet in Washington, DC
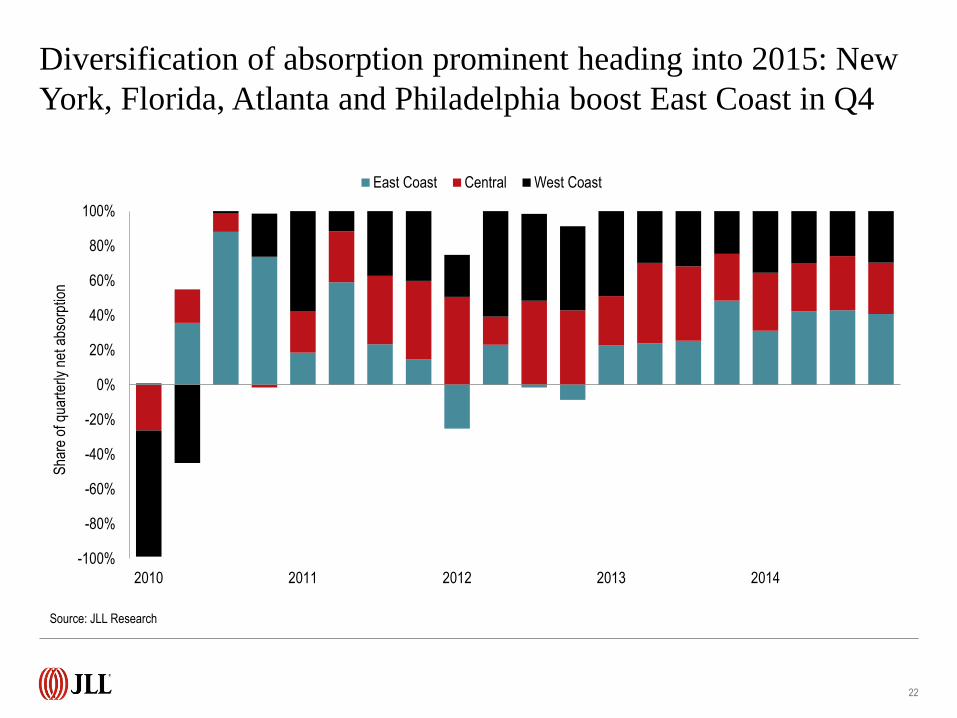
Diversification of absorption prominent heading into 2015: New
York, Florida, Atlanta and Philadelphia boost East Coast in Q4
22
-100%
-80%
-60%
-40%
-20%
0%
20%
40%
60%
80%
100%
2010 2011 2012 2013 2014
Sha
re o
f qua
rter
ly n
et a
bsor
ptio
n
East Coast Central West Coast
Source: JLL Research
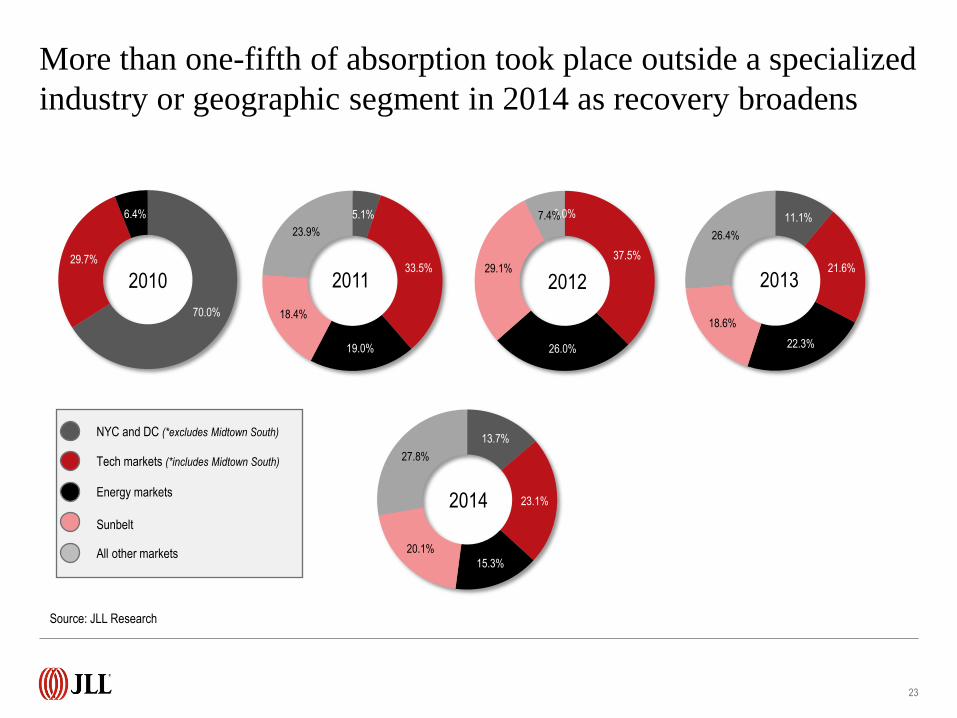
More than one-fifth of absorption took place outside a specialized
industry or geographic segment in 2014 as recovery broadens
23
Source: JLL Research
NYC and DC (*excludes Midtown South)
Tech markets (*includes Midtown South)
Energy markets
Sunbelt
All other markets
70.0%
29.7%
6.4%
2010
5.1%
33.5%
19.0%
18.4%
23.9%
2011
0.0%
37.5%
26.0%
29.1%
7.4%
2012
11.1%
21.6%
22.3%
18.6%
26.4%
2013
13.7%
23.1%
15.3%
20.1%
27.8%
2014
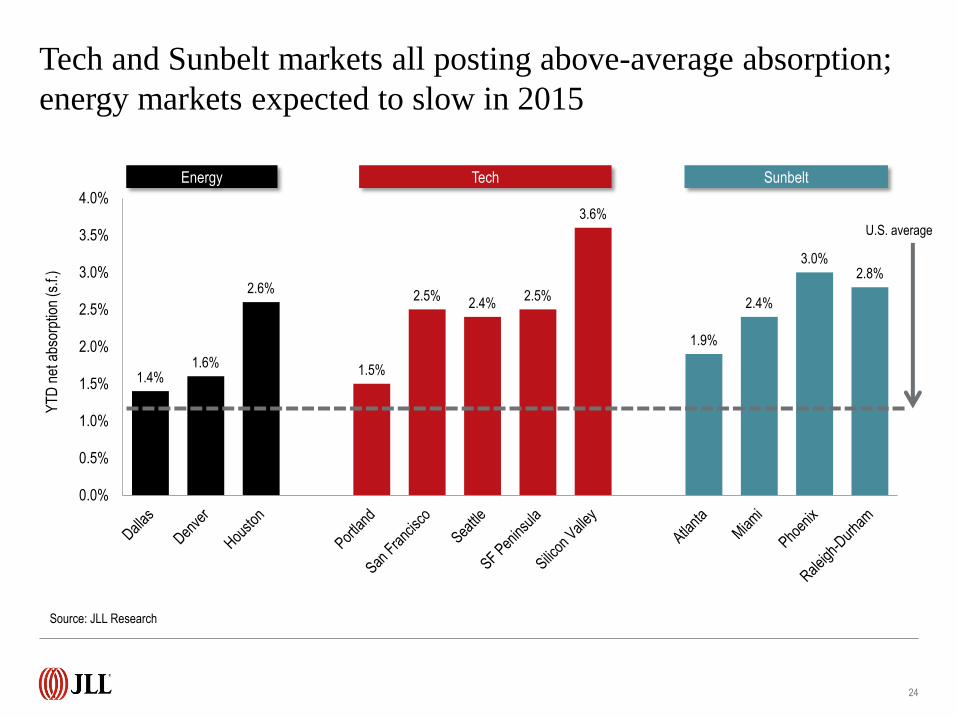
Tech and Sunbelt markets all posting above-average absorption;
energy markets expected to slow in 2015
24
1.4% 1.6%
2.6%
1.5%
2.5% 2.4%
2.5%
3.6%
1.9%
2.4%
3.0% 2.8%
0.0%
0.5%
1.0%
1.5%
2.0%
2.5%
3.0%
3.5%
4.0%
YT
D n
et a
bsor
ptio
n (s
.f.)
Source: JLL Research
Energy Tech Sunbelt
U.S. average
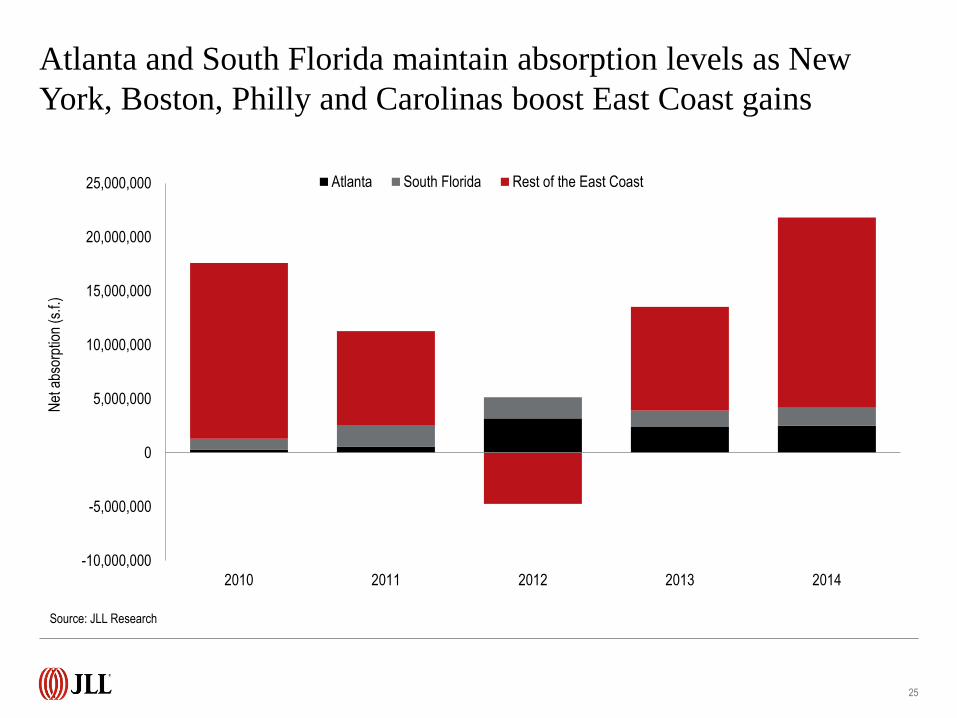
Atlanta and South Florida maintain absorption levels as New
York, Boston, Philly and Carolinas boost East Coast gains
25
Source: JLL Research
-10,000,000
-5,000,000
0
5,000,000
10,000,000
15,000,000
20,000,000
25,000,000
2010 2011 2012 2013 2014
Net
abs
orpt
ion
(s.f.
)
Atlanta South Florida Rest of the East Coast
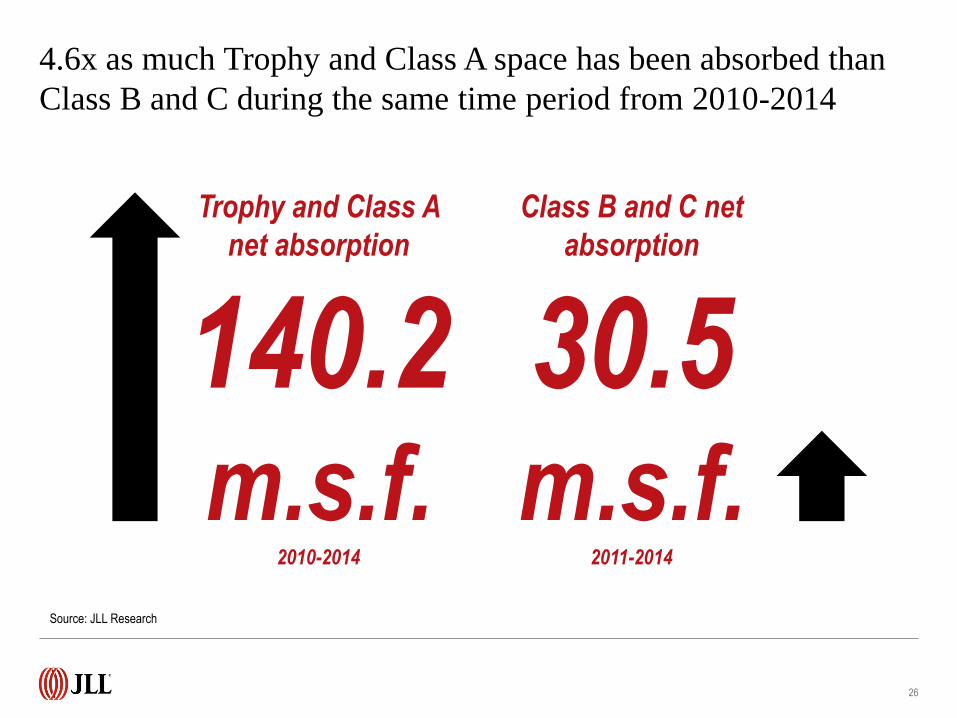
4.6x as much Trophy and Class A space has been absorbed than
Class B and C during the same time period from 2010-2014
26
Source: JLL Research
Trophy and Class A
net absorption
140.2 m.s.f.
2010-2014
Class B and C net
absorption
30.5 m.s.f.
2011-2014
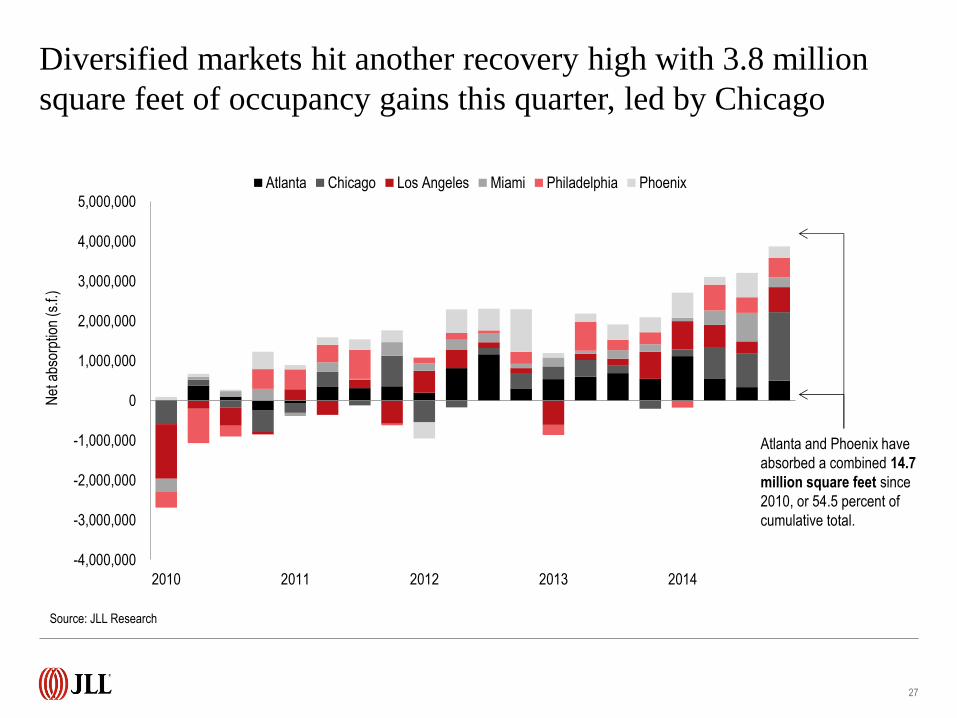
-4,000,000
-3,000,000
-2,000,000
-1,000,000
0
1,000,000
2,000,000
3,000,000
4,000,000
5,000,000
2010 2011 2012 2013 2014
Net
abs
orpt
ion
(s.f.
)
Atlanta Chicago Los Angeles Miami Philadelphia Phoenix
Diversified markets hit another recovery high with 3.8 million
square feet of occupancy gains this quarter, led by Chicago
27
Source: JLL Research
Atlanta and Phoenix have
absorbed a combined 14.7
million square feet since
2010, or 54.5 percent of
cumulative total.
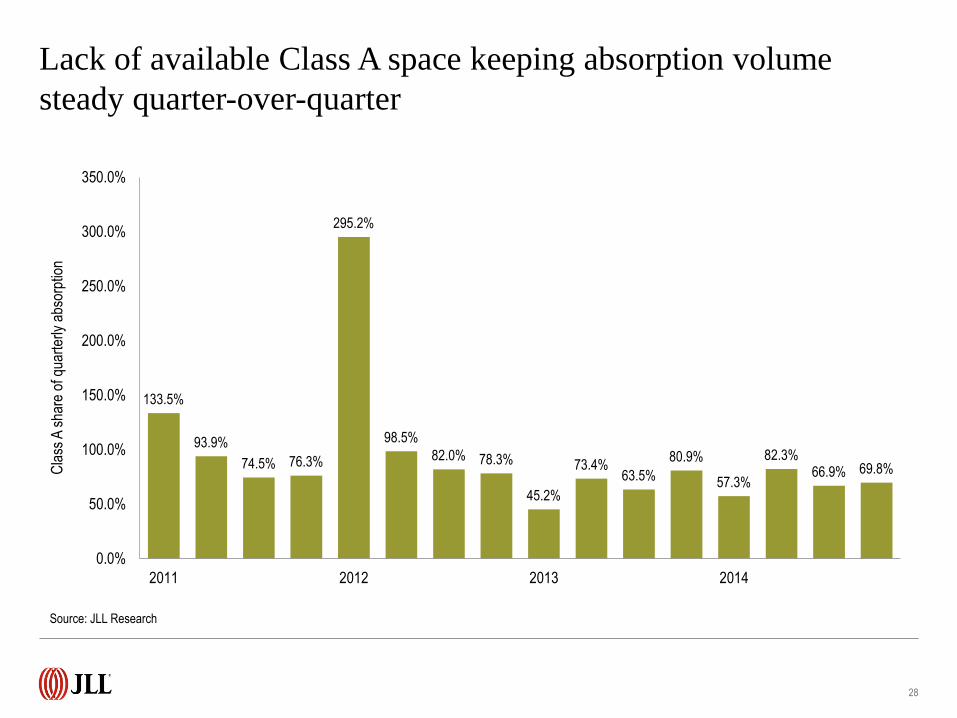
Lack of available Class A space keeping absorption volume
steady quarter-over-quarter
28
133.5%
93.9%
74.5% 76.3%
295.2%
98.5%
82.0% 78.3%
45.2%
73.4% 63.5%
80.9%
57.3%
82.3% 66.9% 69.8%
0.0%
50.0%
100.0%
150.0%
200.0%
250.0%
300.0%
350.0%
2011 2012 2013 2014
Cla
ss A
sha
re o
f qua
rter
ly a
bsor
ptio
n
Source: JLL Research
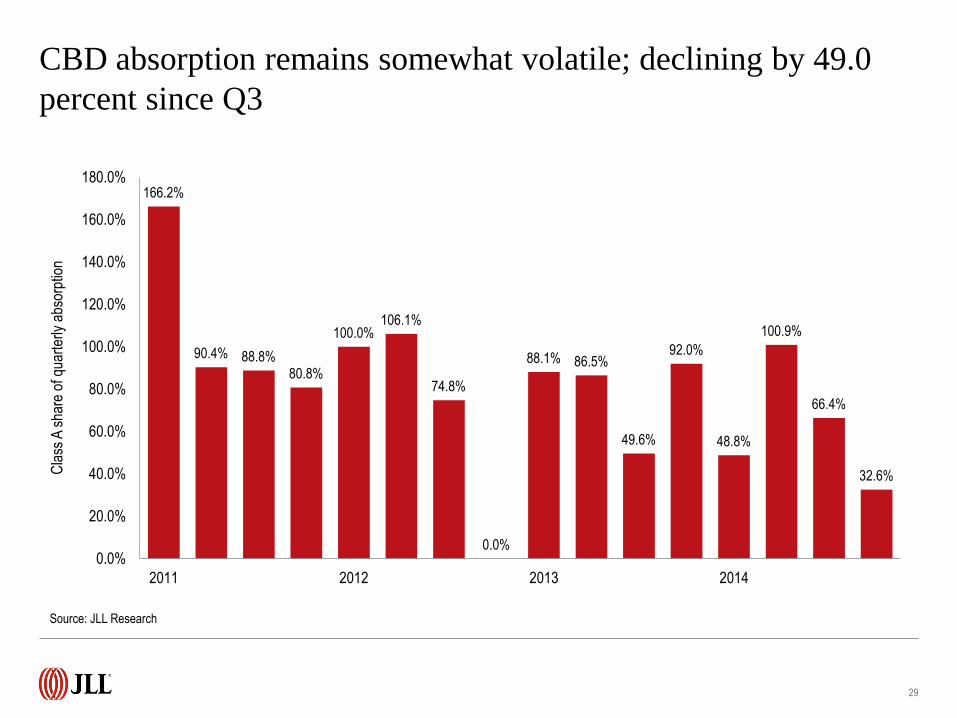
CBD absorption remains somewhat volatile; declining by 49.0
percent since Q3
29
166.2%
90.4% 88.8% 80.8%
100.0% 106.1%
74.8%
0.0%
88.1% 86.5%
49.6%
92.0%
48.8%
100.9%
66.4%
32.6%
0.0%
20.0%
40.0%
60.0%
80.0%
100.0%
120.0%
140.0%
160.0%
180.0%
2011 2012 2013 2014
Cla
ss A
sha
re o
f qua
rter
ly a
bsor
ptio
n
Source: JLL Research
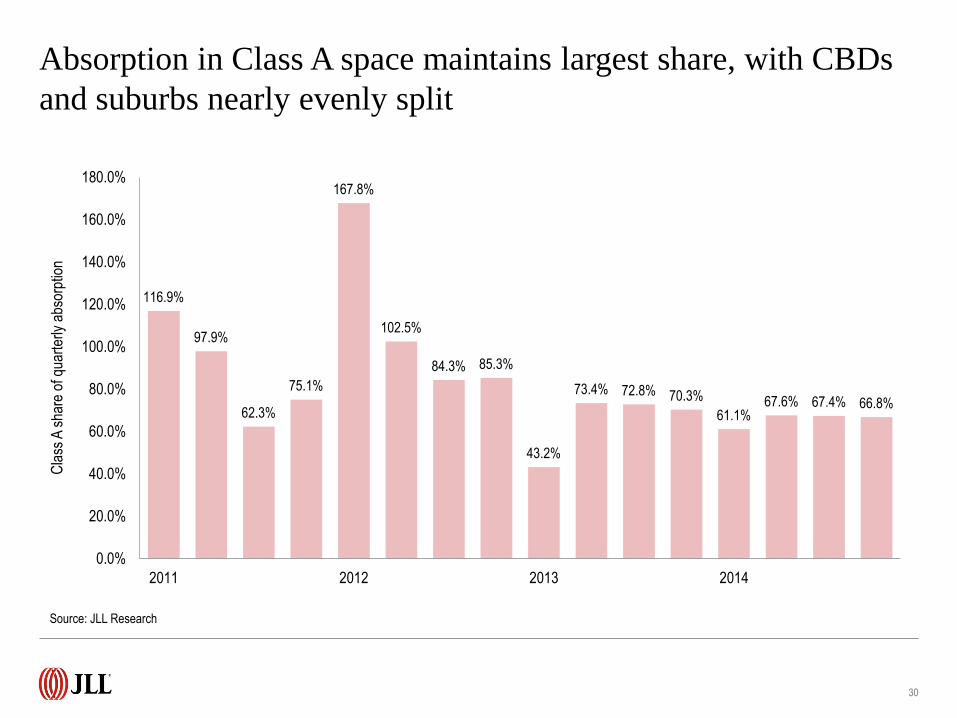
Absorption in Class A space maintains largest share, with CBDs
and suburbs nearly evenly split
30
116.9%
97.9%
62.3%
75.1%
167.8%
102.5%
84.3% 85.3%
43.2%
73.4% 72.8% 70.3%
61.1% 67.6% 67.4% 66.8%
0.0%
20.0%
40.0%
60.0%
80.0%
100.0%
120.0%
140.0%
160.0%
180.0%
2011 2012 2013 2014
Cla
ss A
sha
re o
f qua
rter
ly a
bsor
ptio
n
Source: JLL Research
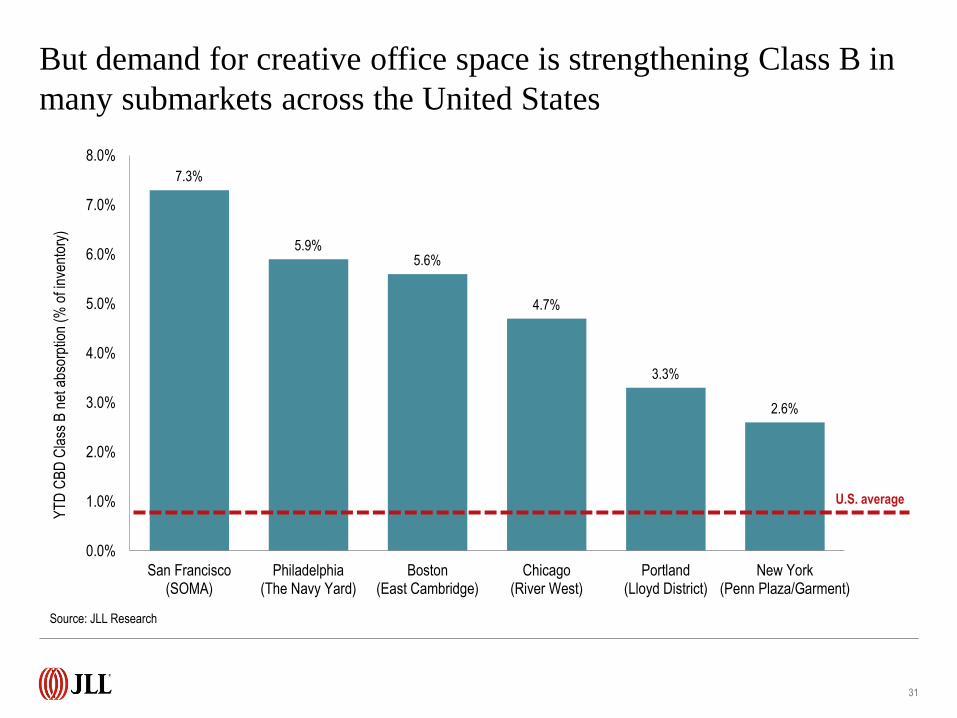
But demand for creative office space is strengthening Class B in
many submarkets across the United States
31
7.3%
5.9% 5.6%
4.7%
3.3%
2.6%
0.0%
1.0%
2.0%
3.0%
4.0%
5.0%
6.0%
7.0%
8.0%
San Francisco(SOMA)
Philadelphia(The Navy Yard)
Boston(East Cambridge)
Chicago(River West)
Portland(Lloyd District)
New York(Penn Plaza/Garment)
YT
D C
BD
Cla
ss B
net
abs
orpt
ion
(% o
f inv
ento
ry)
Source: JLL Research
U.S. average
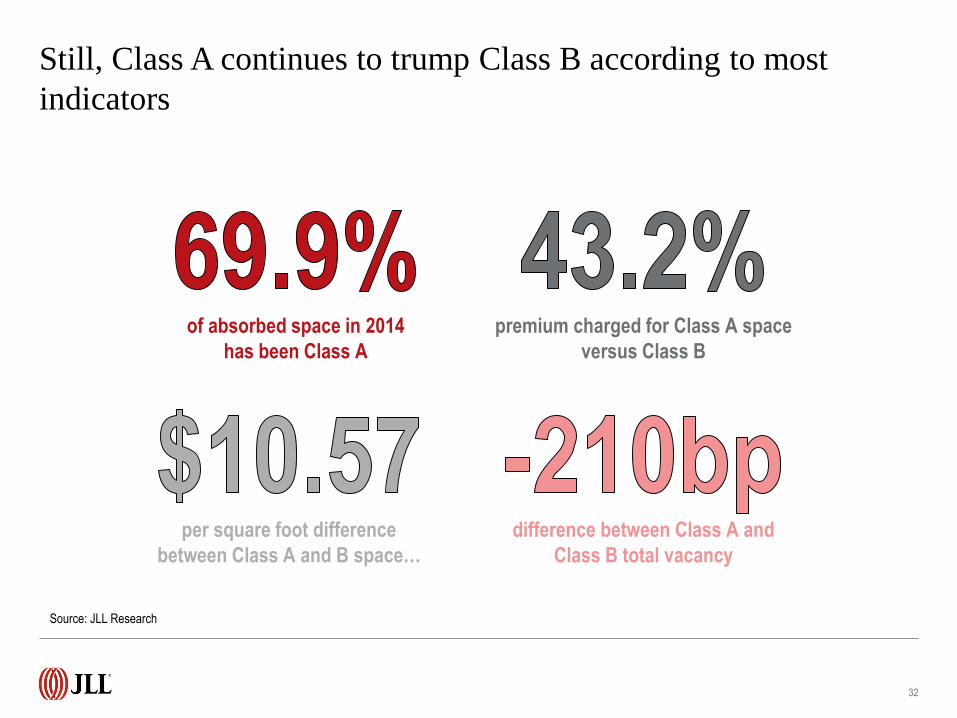
Still, Class A continues to trump Class B according to most
indicators
32
Source: JLL Research
of absorbed space in 2014
has been Class A
per square foot difference
between Class A and B space…
premium charged for Class A space
versus Class B
difference between Class A and
Class B total vacancy
Vacancy
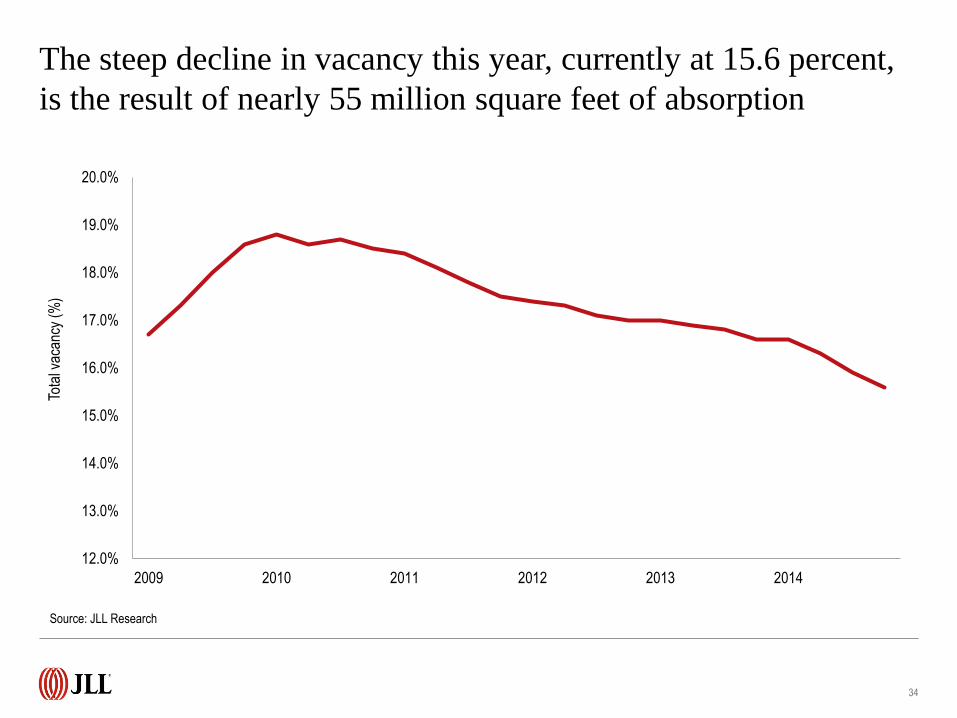
The steep decline in vacancy this year, currently at 15.6 percent,
is the result of nearly 55 million square feet of absorption
34
12.0%
13.0%
14.0%
15.0%
16.0%
17.0%
18.0%
19.0%
20.0%
2009 2010 2011 2012 2013 2014
Tota
l vac
ancy
(%
)
Source: JLL Research
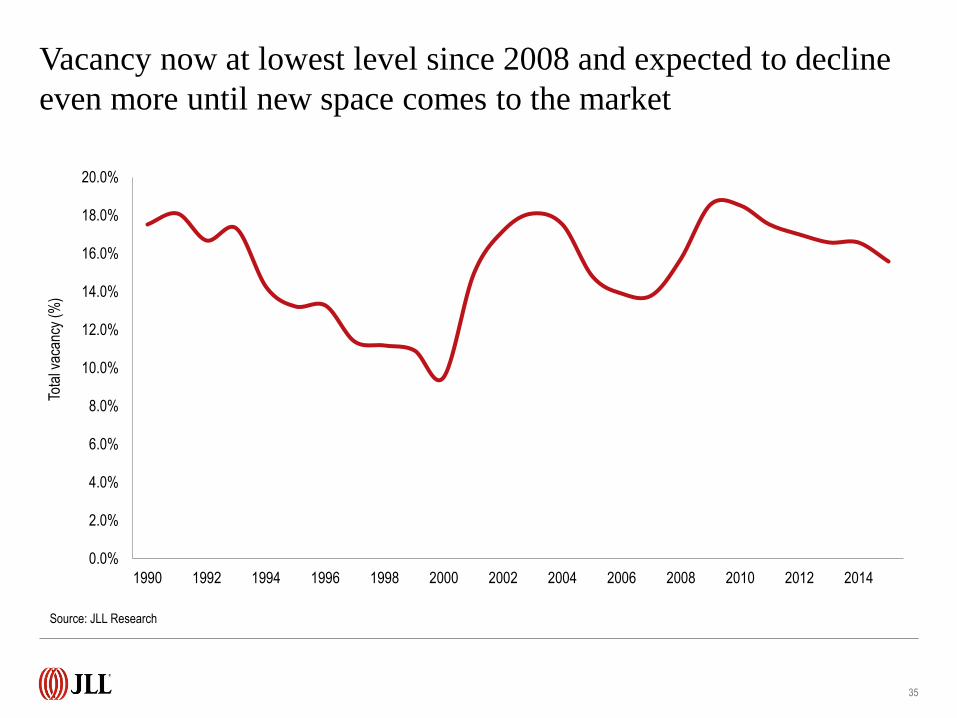
Vacancy now at lowest level since 2008 and expected to decline
even more until new space comes to the market
35
0.0%
2.0%
4.0%
6.0%
8.0%
10.0%
12.0%
14.0%
16.0%
18.0%
20.0%
1990 1992 1994 1996 1998 2000 2002 2004 2006 2008 2010 2012 2014
Tota
l vac
ancy
(%
)
Source: JLL Research
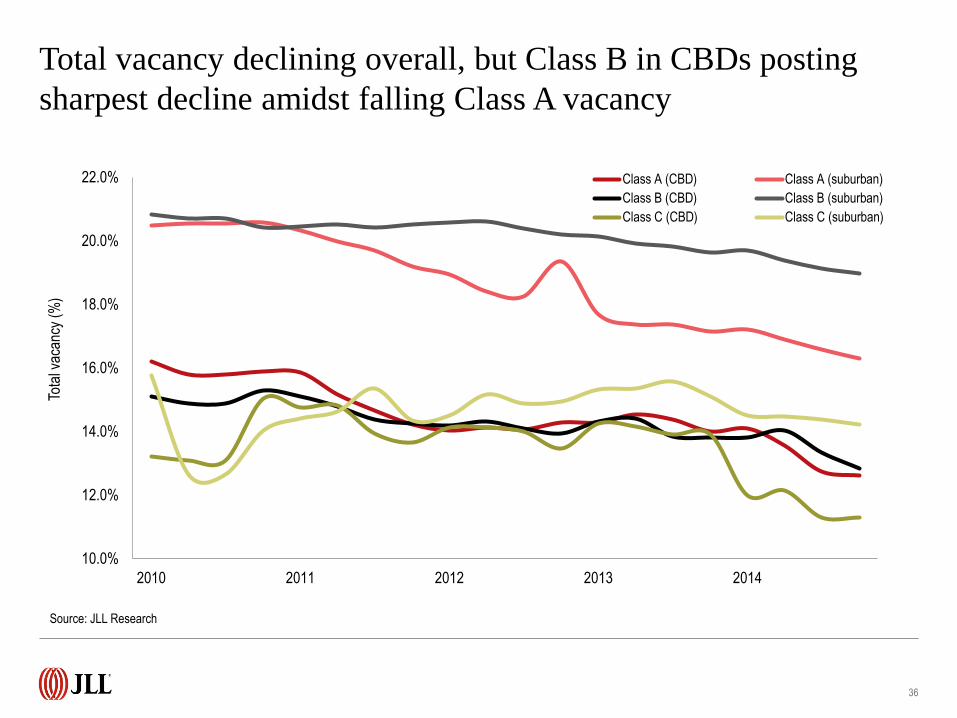
Total vacancy declining overall, but Class B in CBDs posting
sharpest decline amidst falling Class A vacancy
36
10.0%
12.0%
14.0%
16.0%
18.0%
20.0%
22.0%
2010 2011 2012 2013 2014
Tota
l vac
ancy
(%
)
Class A (CBD) Class A (suburban)
Class B (CBD) Class B (suburban)
Class C (CBD) Class C (suburban)
Source: JLL Research
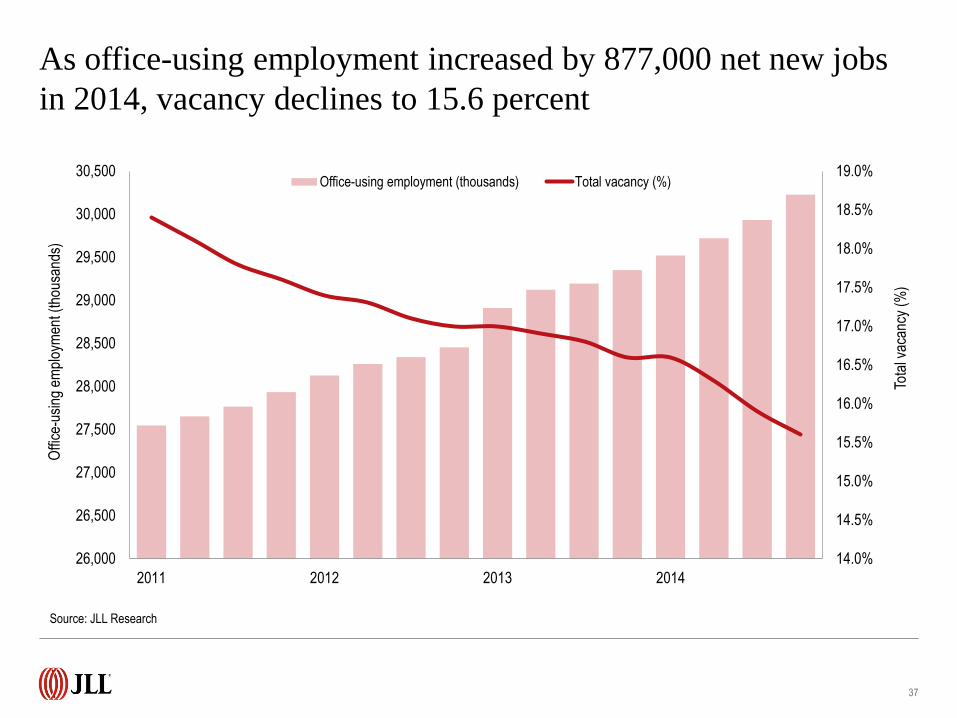
As office-using employment increased by 877,000 net new jobs
in 2014, vacancy declines to 15.6 percent
37
14.0%
14.5%
15.0%
15.5%
16.0%
16.5%
17.0%
17.5%
18.0%
18.5%
19.0%
26,000
26,500
27,000
27,500
28,000
28,500
29,000
29,500
30,000
30,500
2011 2012 2013 2014
Tota
l vac
ancy
(%
)
Offi
ce-u
sing
em
ploy
men
t (th
ousa
nds)
Office-using employment (thousands) Total vacancy (%)
Source: JLL Research
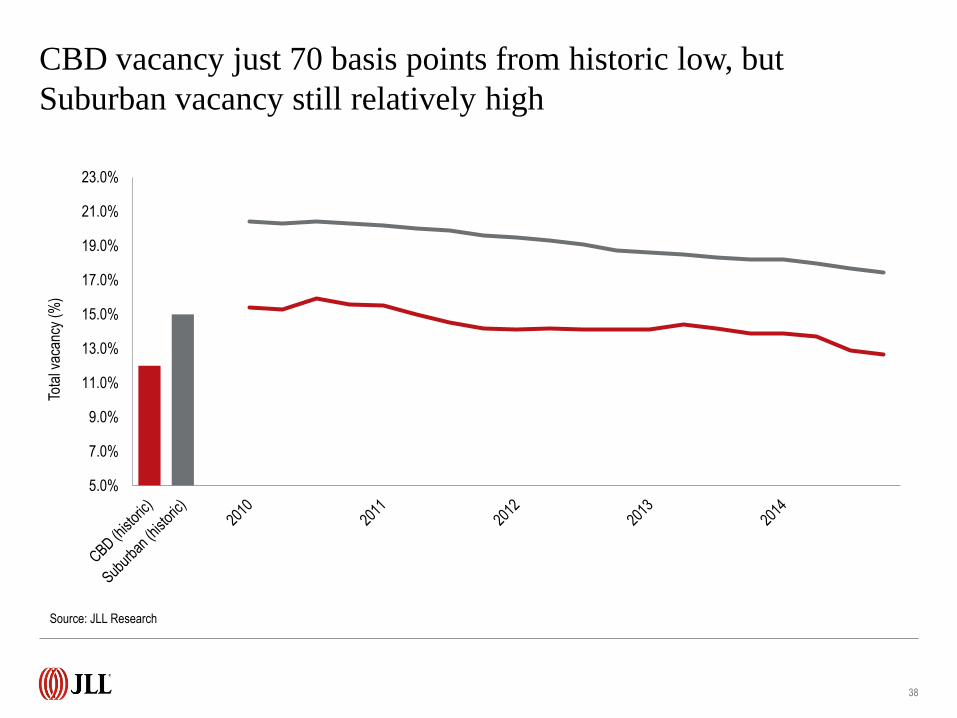
CBD vacancy just 70 basis points from historic low, but
Suburban vacancy still relatively high
38
5.0%
7.0%
9.0%
11.0%
13.0%
15.0%
17.0%
19.0%
21.0%
23.0%
Tota
l vac
ancy
(%
)
Source: JLL Research
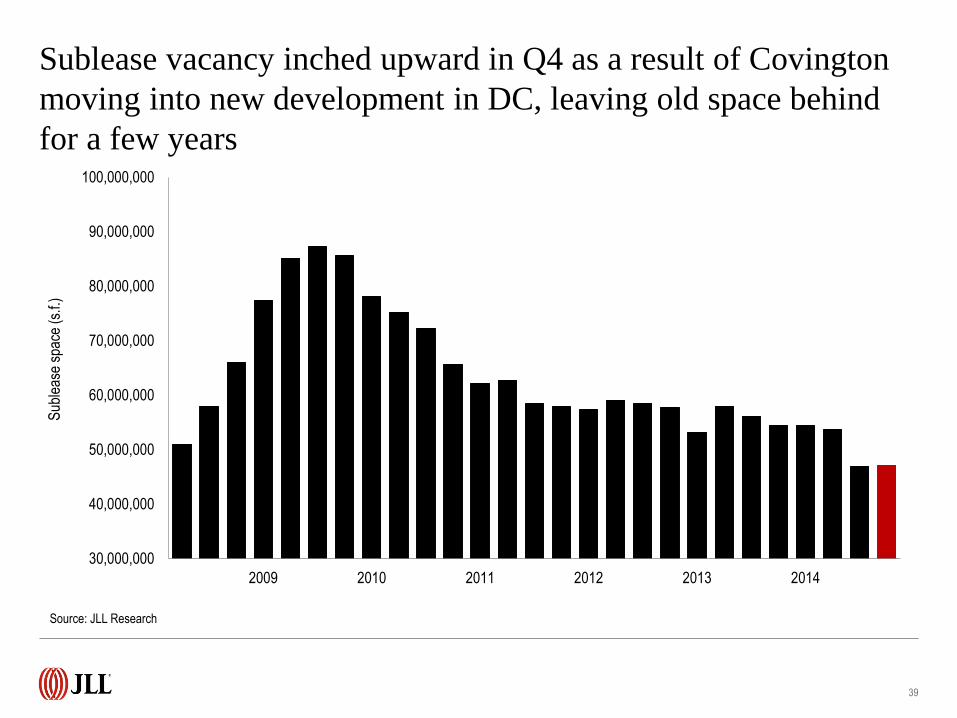
Sublease vacancy inched upward in Q4 as a result of Covington
moving into new development in DC, leaving old space behind
for a few years
39
30,000,000
40,000,000
50,000,000
60,000,000
70,000,000
80,000,000
90,000,000
100,000,000
2009 2010 2011 2012 2013 2014
Sub
leas
e sp
ace
(s.f.
)
Source: JLL Research

Rents
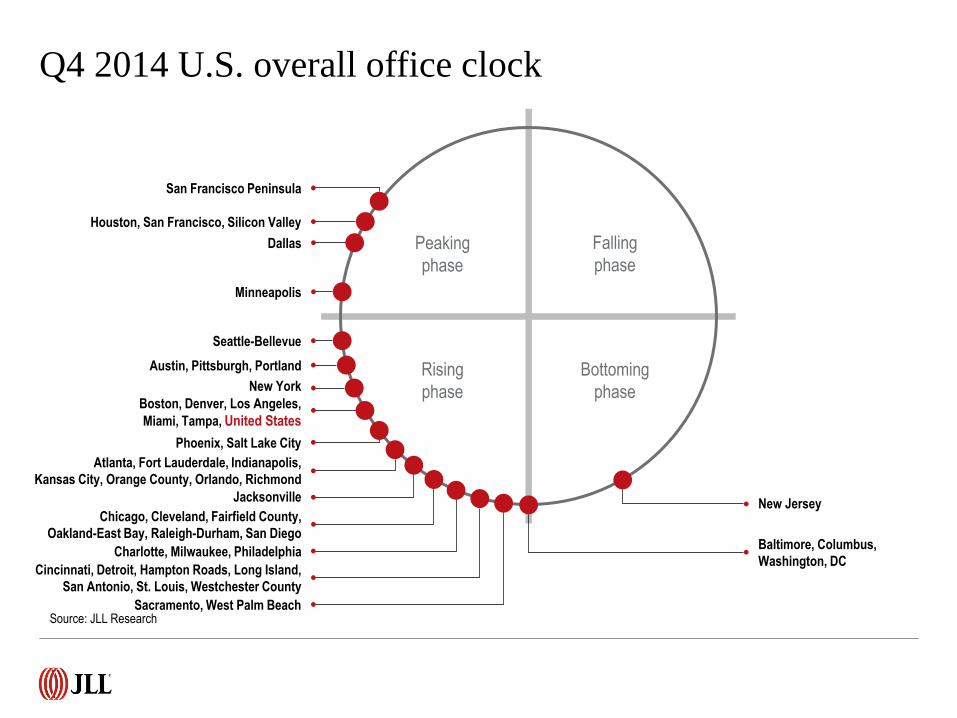
Q4 2014 U.S. overall office clock
Peaking
phase
Falling
phase
Rising
phase
Bottoming
phase
Houston, San Francisco, Silicon Valley
Boston, Denver, Los Angeles,
Miami, Tampa, United States
Cincinnati, Detroit, Hampton Roads, Long Island,
San Antonio, St. Louis, Westchester County
Phoenix, Salt Lake City
Atlanta, Fort Lauderdale, Indianapolis,
Kansas City, Orange County, Orlando, Richmond
Sacramento, West Palm Beach
Baltimore, Columbus,
Washington, DC
Dallas
Austin, Pittsburgh, Portland
San Francisco Peninsula
Jacksonville New Jersey
Chicago, Cleveland, Fairfield County,
Oakland-East Bay, Raleigh-Durham, San Diego
New York
Charlotte, Milwaukee, Philadelphia
Seattle-Bellevue
Minneapolis
Source: JLL Research
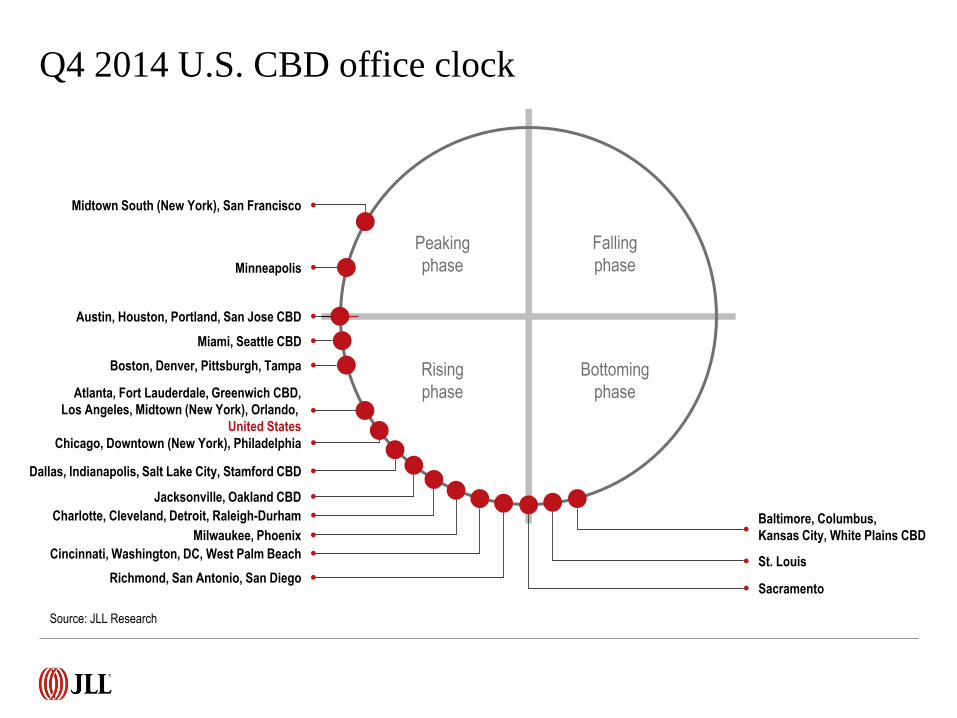
Q4 2014 U.S. CBD office clock
Peaking
phase
Falling
phase
Rising
phase
Bottoming
phase
Austin, Houston, Portland, San Jose CBD
Miami, Seattle CBD
Dallas, Indianapolis, Salt Lake City, Stamford CBD
Atlanta, Fort Lauderdale, Greenwich CBD,
Los Angeles, Midtown (New York), Orlando,
United States
Cincinnati, Washington, DC, West Palm Beach
Boston, Denver, Pittsburgh, Tampa
Richmond, San Antonio, San Diego
Baltimore, Columbus,
Kansas City, White Plains CBD
Jacksonville, Oakland CBD
Midtown South (New York), San Francisco
Chicago, Downtown (New York), Philadelphia
Charlotte, Cleveland, Detroit, Raleigh-Durham
St. Louis
Milwaukee, Phoenix
Sacramento
Minneapolis
Source: JLL Research
Peaking
phase
Falling
phase
Rising
phase
Bottoming
phase
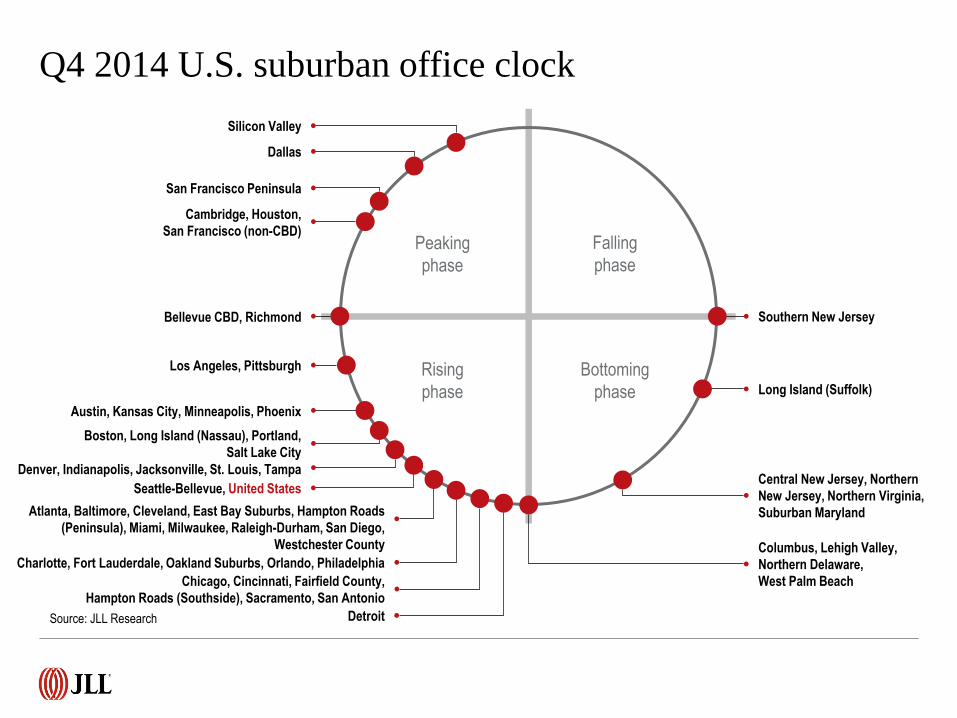
Q4 2014 U.S. suburban office clock
Atlanta, Baltimore, Cleveland, East Bay Suburbs, Hampton Roads
(Peninsula), Miami, Milwaukee, Raleigh-Durham, San Diego,
Westchester County
Boston, Long Island (Nassau), Portland,
Salt Lake City
Long Island (Suffolk)
Charlotte, Fort Lauderdale, Oakland Suburbs, Orlando, Philadelphia Columbus, Lehigh Valley,
Northern Delaware,
West Palm Beach
Central New Jersey, Northern
New Jersey, Northern Virginia,
Suburban Maryland
Dallas
Denver, Indianapolis, Jacksonville, St. Louis, Tampa
Chicago, Cincinnati, Fairfield County,
Hampton Roads (Southside), Sacramento, San Antonio
Bellevue CBD, Richmond
Austin, Kansas City, Minneapolis, Phoenix
Cambridge, Houston,
San Francisco (non-CBD)
San Francisco Peninsula
Silicon Valley
Southern New Jersey
Los Angeles, Pittsburgh
Seattle-Bellevue, United States
Detroit Source: JLL Research
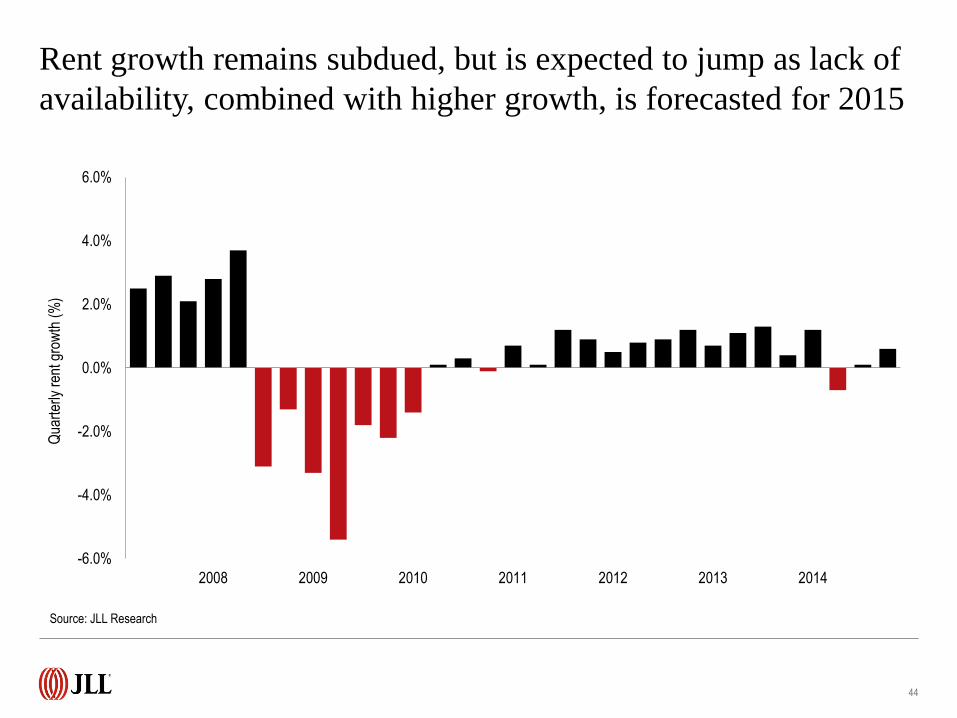
Rent growth remains subdued, but is expected to jump as lack of
availability, combined with higher growth, is forecasted for 2015
44
-6.0%
-4.0%
-2.0%
0.0%
2.0%
4.0%
6.0%
2008 2009 2010 2011 2012 2013 2014
Qua
rter
ly r
ent g
row
th (
%)
Source: JLL Research
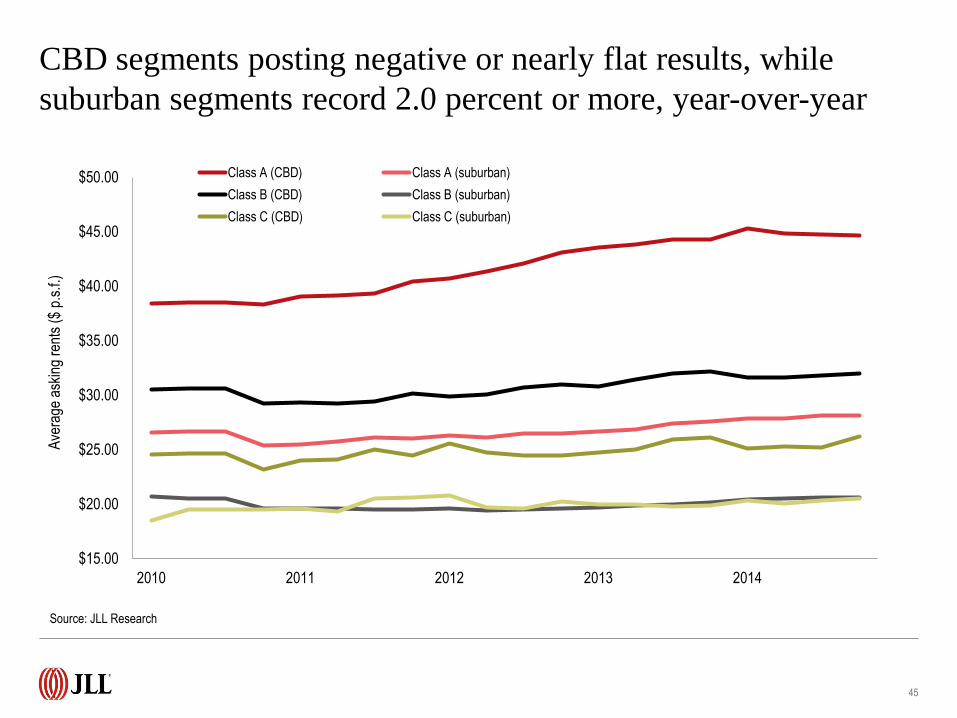
CBD segments posting negative or nearly flat results, while
suburban segments record 2.0 percent or more, year-over-year
45
$15.00
$20.00
$25.00
$30.00
$35.00
$40.00
$45.00
$50.00
2010 2011 2012 2013 2014
Ave
rage
ask
ing
rent
s ($
p.s
.f.)
Class A (CBD) Class A (suburban)
Class B (CBD) Class B (suburban)
Class C (CBD) Class C (suburban)
Source: JLL Research
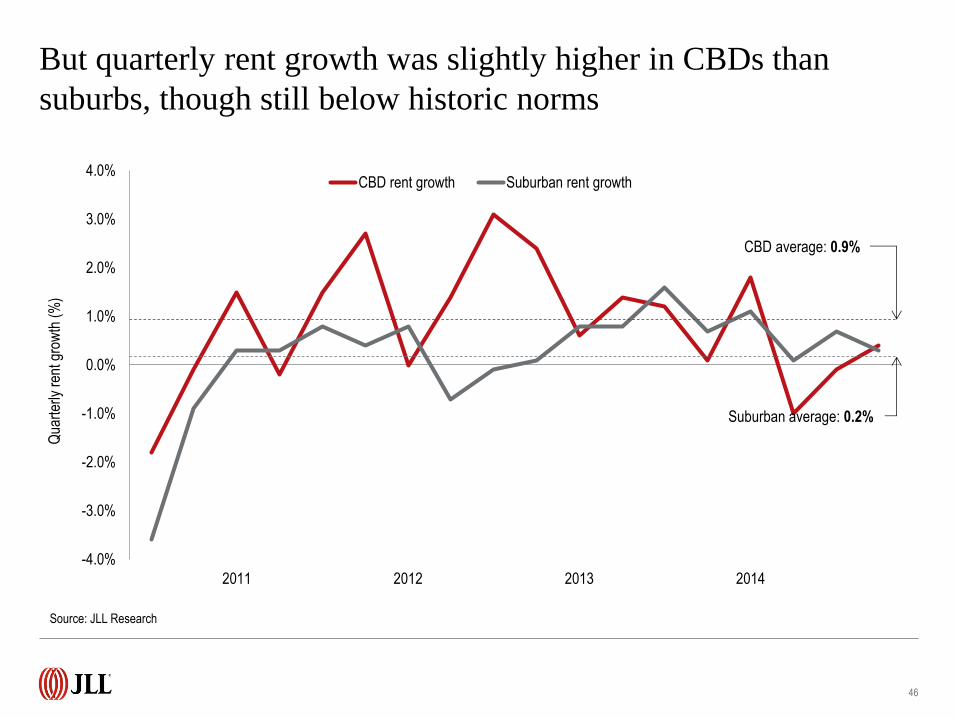
But quarterly rent growth was slightly higher in CBDs than
suburbs, though still below historic norms
46
-4.0%
-3.0%
-2.0%
-1.0%
0.0%
1.0%
2.0%
3.0%
4.0%
2011 2012 2013 2014
Qua
rter
ly r
ent g
row
th (
%)
CBD rent growth Suburban rent growth
Source: JLL Research
CBD average: 0.9%
Suburban average: 0.2%
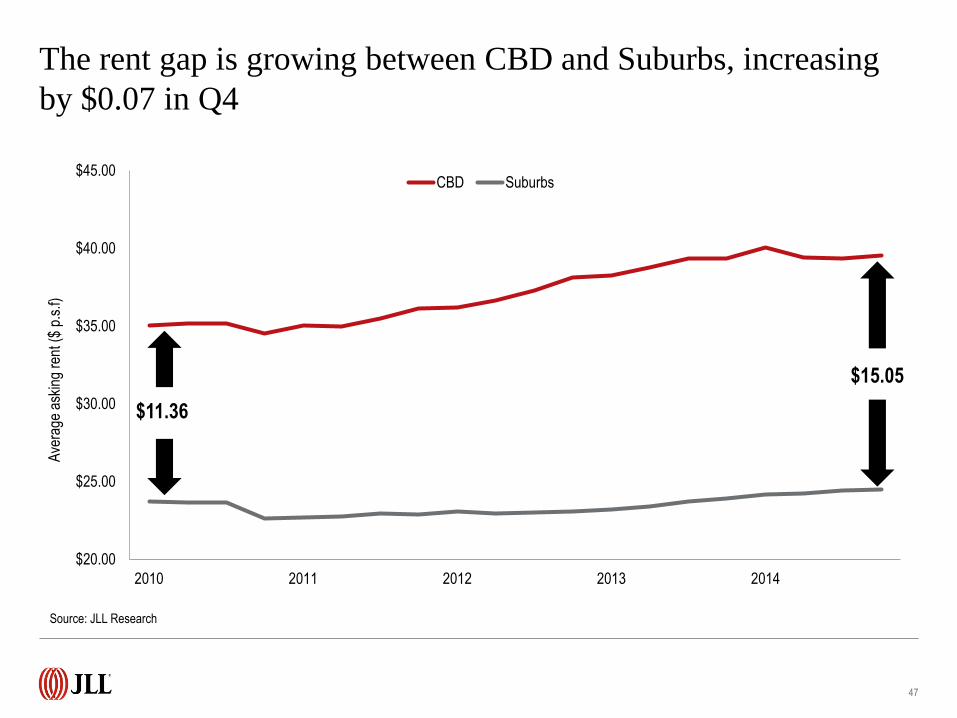
The rent gap is growing between CBD and Suburbs, increasing
by $0.07 in Q4
47
$20.00
$25.00
$30.00
$35.00
$40.00
$45.00
2010 2011 2012 2013 2014
Ave
rage
ask
ing
rent
($
p.s.
f)
CBD Suburbs
Source: JLL Research
$11.36
$15.05
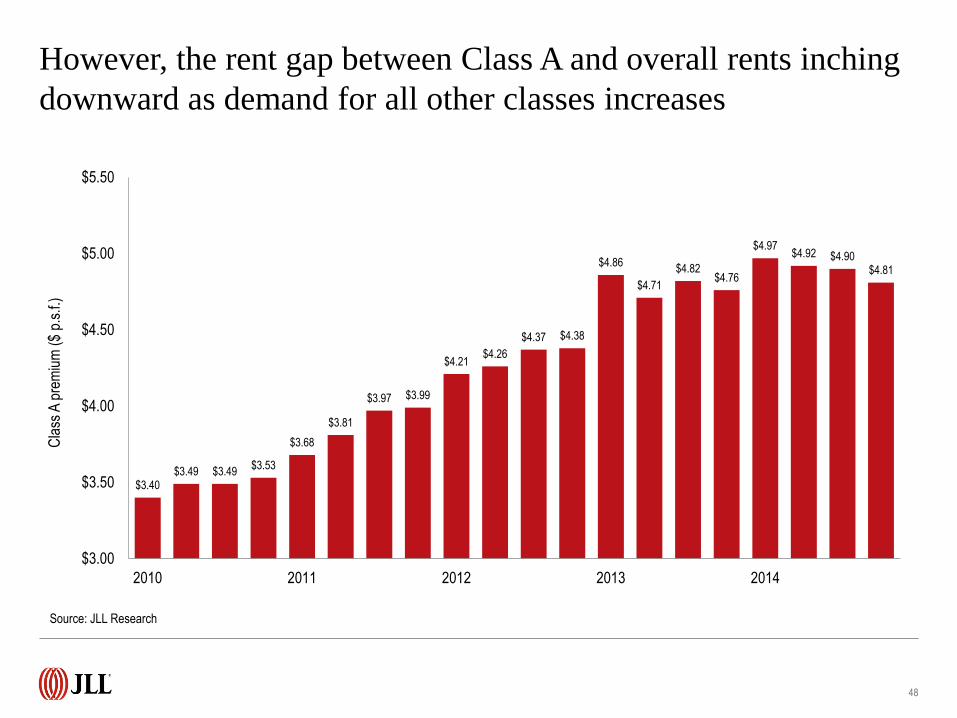
However, the rent gap between Class A and overall rents inching
downward as demand for all other classes increases
48
$3.40 $3.49 $3.49
$3.53
$3.68
$3.81
$3.97 $3.99
$4.21 $4.26
$4.37 $4.38
$4.86
$4.71
$4.82 $4.76
$4.97 $4.92 $4.90
$4.81
$3.00
$3.50
$4.00
$4.50
$5.00
$5.50
2010 2011 2012 2013 2014
Cla
ss A
pre
miu
m (
$ p.
s.f.)
Source: JLL Research
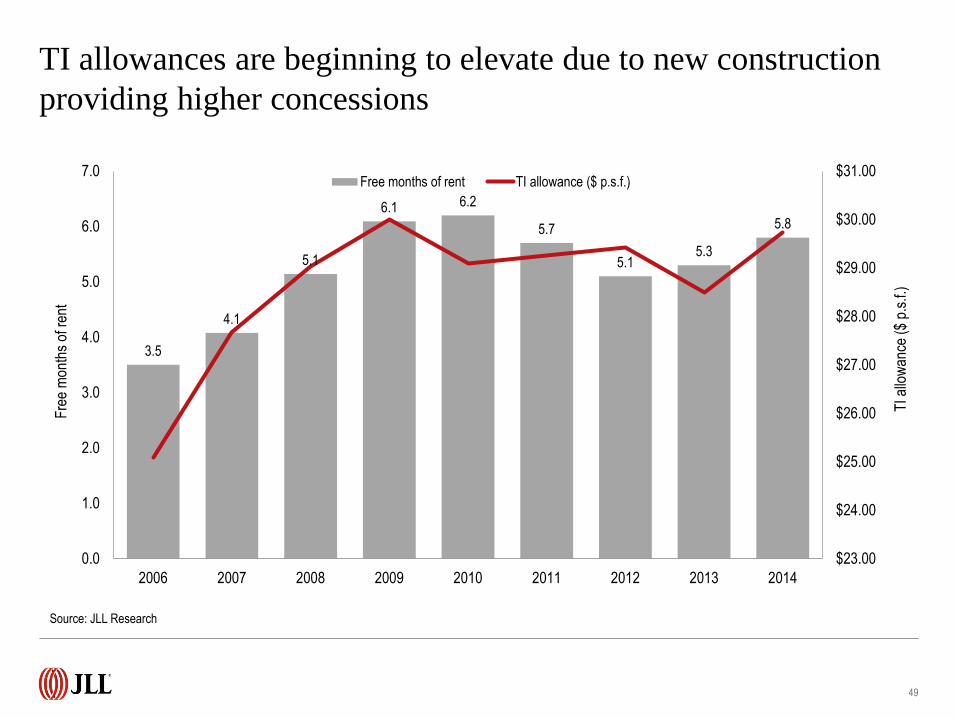
TI allowances are beginning to elevate due to new construction
providing higher concessions
49
3.5
4.1
5.1
6.1 6.2
5.7
5.1 5.3
5.8
$23.00
$24.00
$25.00
$26.00
$27.00
$28.00
$29.00
$30.00
$31.00
0.0
1.0
2.0
3.0
4.0
5.0
6.0
7.0
2006 2007 2008 2009 2010 2011 2012 2013 2014
TI a
llow
ance
($
p.s.
f.)
Fre
e m
onth
s of
ren
t
Free months of rent TI allowance ($ p.s.f.)
Source: JLL Research
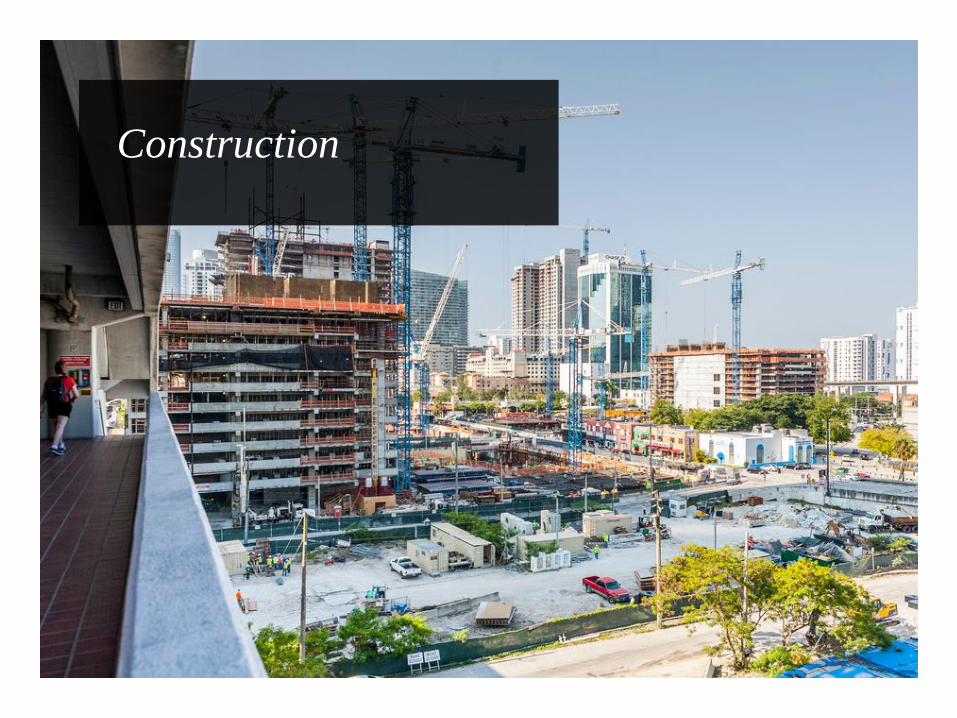
Construction
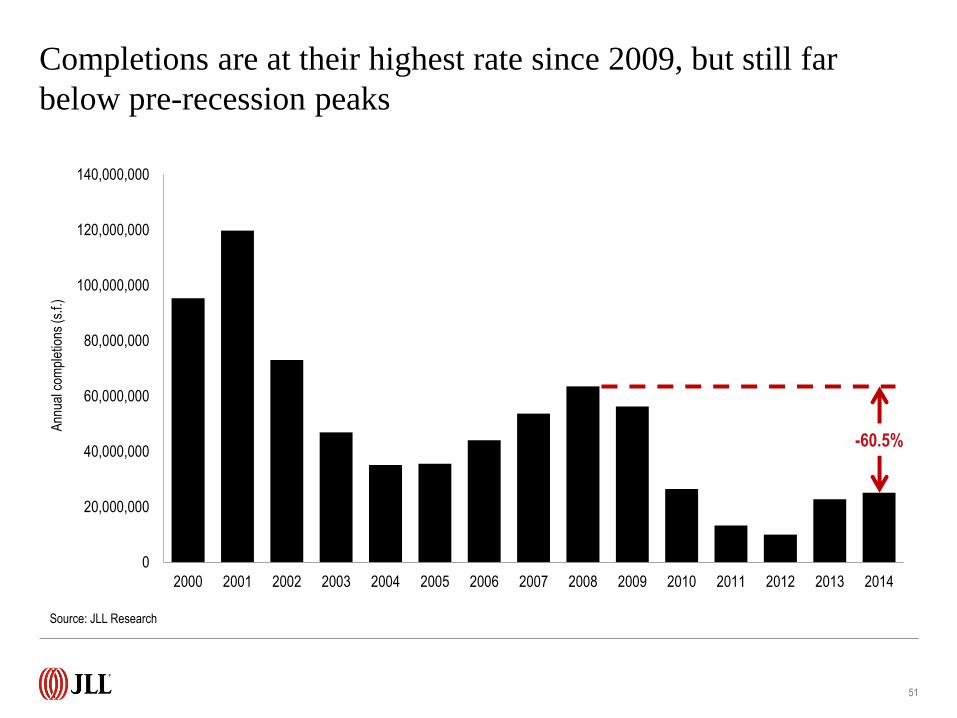
Completions are at their highest rate since 2009, but still far
below pre-recession peaks
0
20,000,000
40,000,000
60,000,000
80,000,000
100,000,000
120,000,000
140,000,000
2000 2001 2002 2003 2004 2005 2006 2007 2008 2009 2010 2011 2012 2013 2014
Ann
ual c
ompl
etio
ns (s
.f.)
51
Source: JLL Research
-60.5%
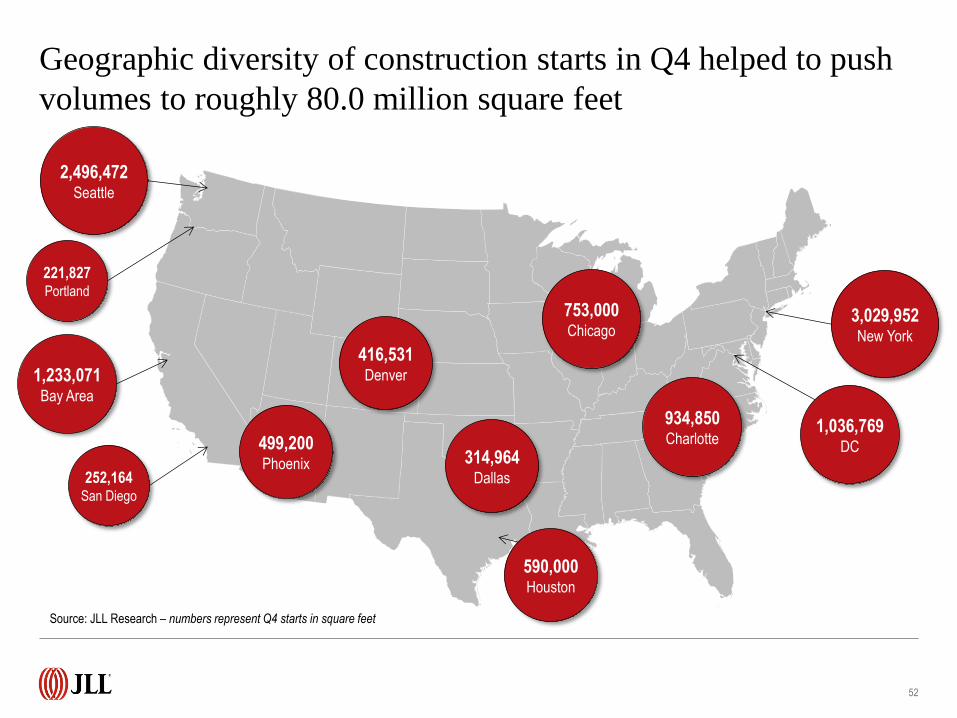
Geographic diversity of construction starts in Q4 helped to push
volumes to roughly 80.0 million square feet
52
Source: JLL Research – numbers represent Q4 starts in square feet
2,496,472 Seattle
221,827 Portland
1,233,071 Bay Area
252,164 San Diego
499,200 Phoenix
416,531 Denver
590,000 Houston
314,964 Dallas
1,036,769 DC
3,029,952 New York
934,850 Charlotte
753,000 Chicago
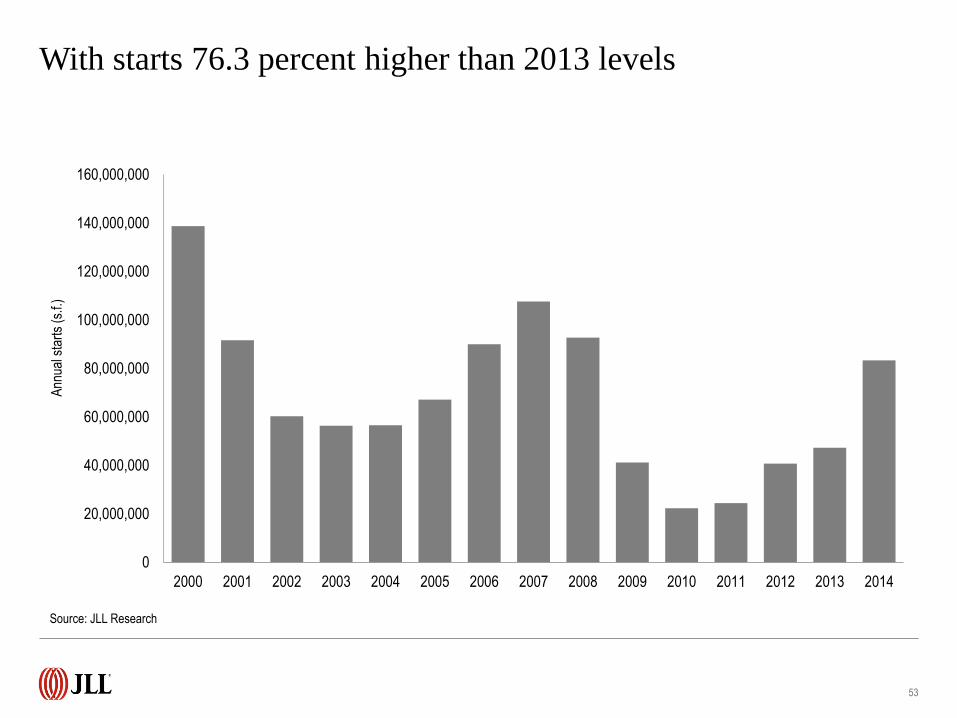
With starts 76.3 percent higher than 2013 levels
0
20,000,000
40,000,000
60,000,000
80,000,000
100,000,000
120,000,000
140,000,000
160,000,000
2000 2001 2002 2003 2004 2005 2006 2007 2008 2009 2010 2011 2012 2013 2014
Ann
ual s
tart
s (s
.f.)
53
Source: JLL Research
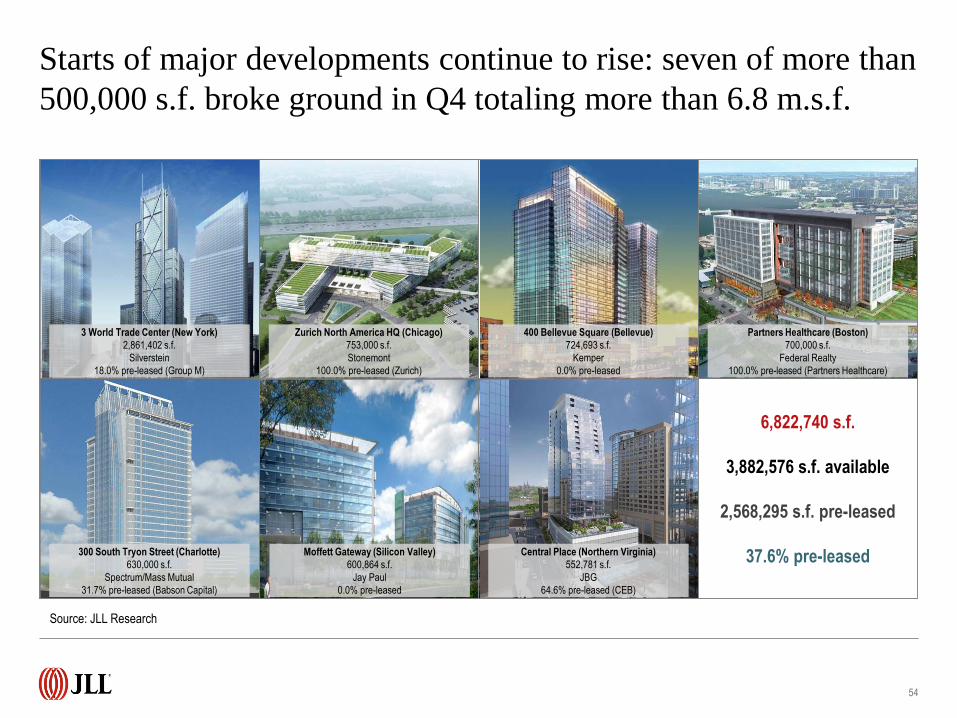
Starts of major developments continue to rise: seven of more than
500,000 s.f. broke ground in Q4 totaling more than 6.8 m.s.f.
54
Source: JLL Research
3 World Trade Center (New York)
2,861,402 s.f.
Silverstein
18.0% pre-leased (Group M)
Central Place (Northern Virginia)
552,781 s.f.
JBG
64.6% pre-leased (CEB)
Zurich North America HQ (Chicago)
753,000 s.f.
Stonemont
100.0% pre-leased (Zurich)
400 Bellevue Square (Bellevue)
724,693 s.f.
Kemper
0.0% pre-leased
Partners Healthcare (Boston)
700,000 s.f.
Federal Realty
100.0% pre-leased (Partners Healthcare)
300 South Tryon Street (Charlotte)
630,000 s.f.
Spectrum/Mass Mutual
31.7% pre-leased (Babson Capital)
Moffett Gateway (Silicon Valley)
600,864 s.f.
Jay Paul
0.0% pre-leased
6,822,740 s.f.
3,882,576 s.f. available
2,568,295 s.f. pre-leased
37.6% pre-leased
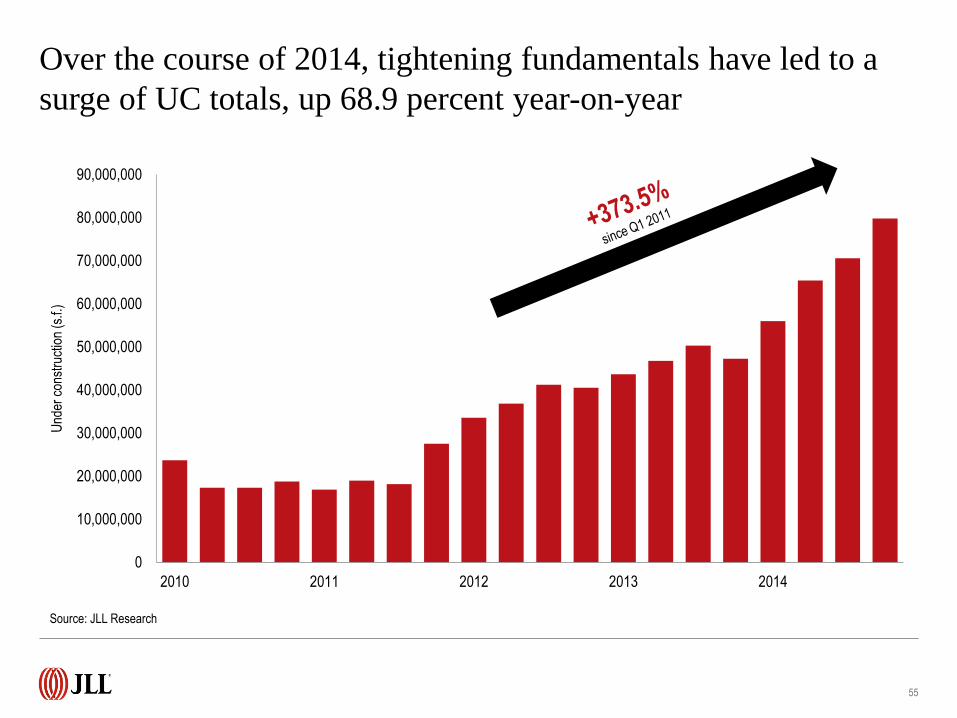
Over the course of 2014, tightening fundamentals have led to a
surge of UC totals, up 68.9 percent year-on-year
0
10,000,000
20,000,000
30,000,000
40,000,000
50,000,000
60,000,000
70,000,000
80,000,000
90,000,000
2010 2011 2012 2013 2014
Und
er c
onst
ruct
ion
(s.f.
)
55
Source: JLL Research
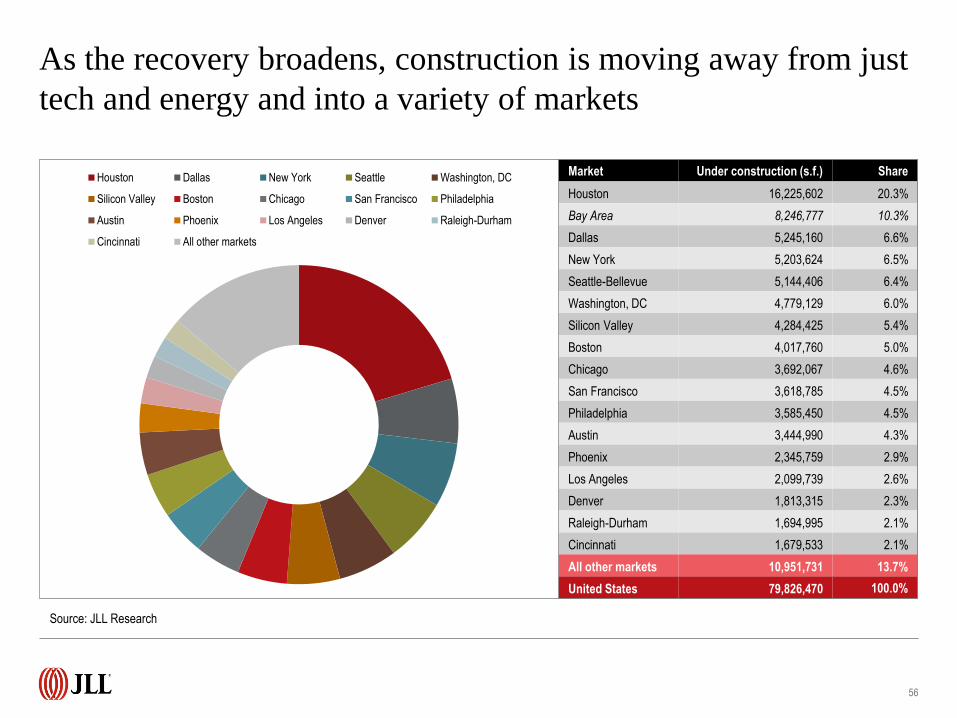
Market Under construction (s.f.) Share
Houston 16,225,602 20.3%
Bay Area 8,246,777 10.3%
Dallas 5,245,160 6.6%
New York 5,203,624 6.5%
Seattle-Bellevue 5,144,406 6.4%
Washington, DC 4,779,129 6.0%
Silicon Valley 4,284,425 5.4%
Boston 4,017,760 5.0%
Chicago 3,692,067 4.6%
San Francisco 3,618,785 4.5%
Philadelphia 3,585,450 4.5%
Austin 3,444,990 4.3%
Phoenix 2,345,759 2.9%
Los Angeles 2,099,739 2.6%
Denver 1,813,315 2.3%
Raleigh-Durham 1,694,995 2.1%
Cincinnati 1,679,533 2.1%
All other markets 10,951,731 13.7%
United States 79,826,470 100.0%
As the recovery broadens, construction is moving away from just
tech and energy and into a variety of markets
Houston Dallas New York Seattle Washington, DC
Silicon Valley Boston Chicago San Francisco Philadelphia
Austin Phoenix Los Angeles Denver Raleigh-Durham
Cincinnati All other markets
56
Source: JLL Research
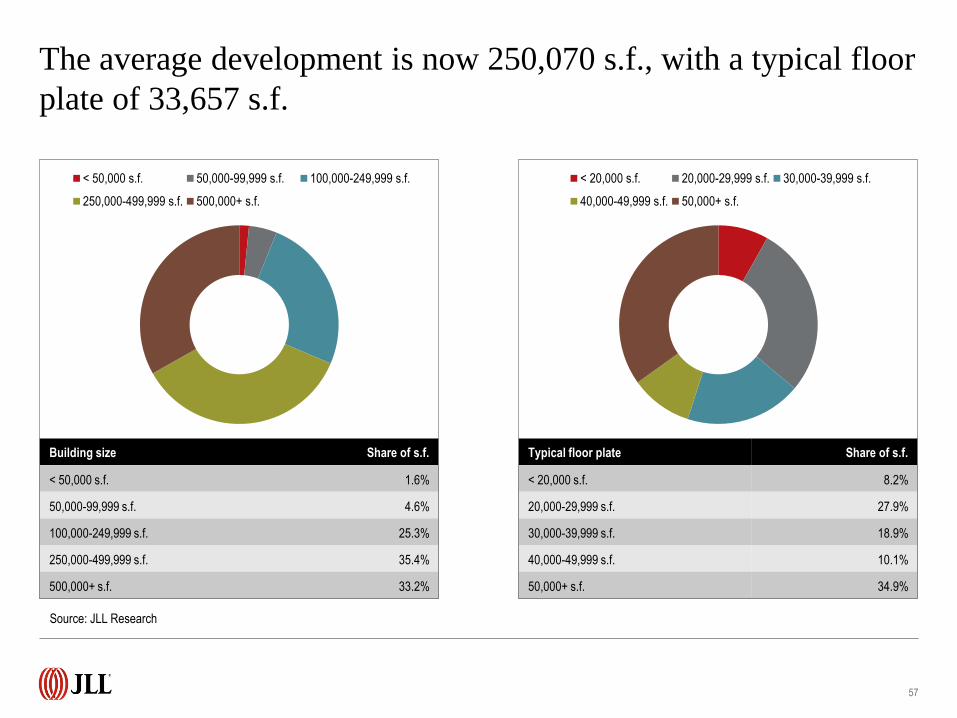
Typical floor plate Share of s.f.
< 20,000 s.f. 8.2%
20,000-29,999 s.f. 27.9%
30,000-39,999 s.f. 18.9%
40,000-49,999 s.f. 10.1%
50,000+ s.f. 34.9%
< 50,000 s.f. 50,000-99,999 s.f. 100,000-249,999 s.f.
250,000-499,999 s.f. 500,000+ s.f.
Building size Share of s.f.
< 50,000 s.f. 1.6%
50,000-99,999 s.f. 4.6%
100,000-249,999 s.f. 25.3%
250,000-499,999 s.f. 35.4%
500,000+ s.f. 33.2%
The average development is now 250,070 s.f., with a typical floor
plate of 33,657 s.f.
57
< 20,000 s.f. 20,000-29,999 s.f. 30,000-39,999 s.f.
40,000-49,999 s.f. 50,000+ s.f.
Source: JLL Research
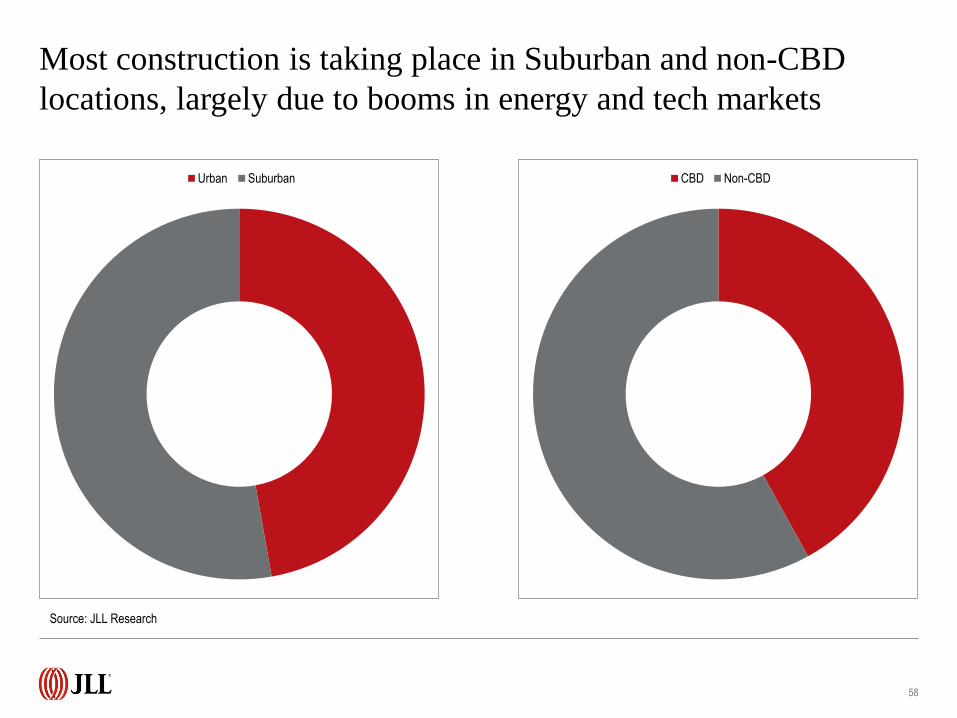
Urban Suburban
Most construction is taking place in Suburban and non-CBD
locations, largely due to booms in energy and tech markets
58
CBD Non-CBD
Source: JLL Research
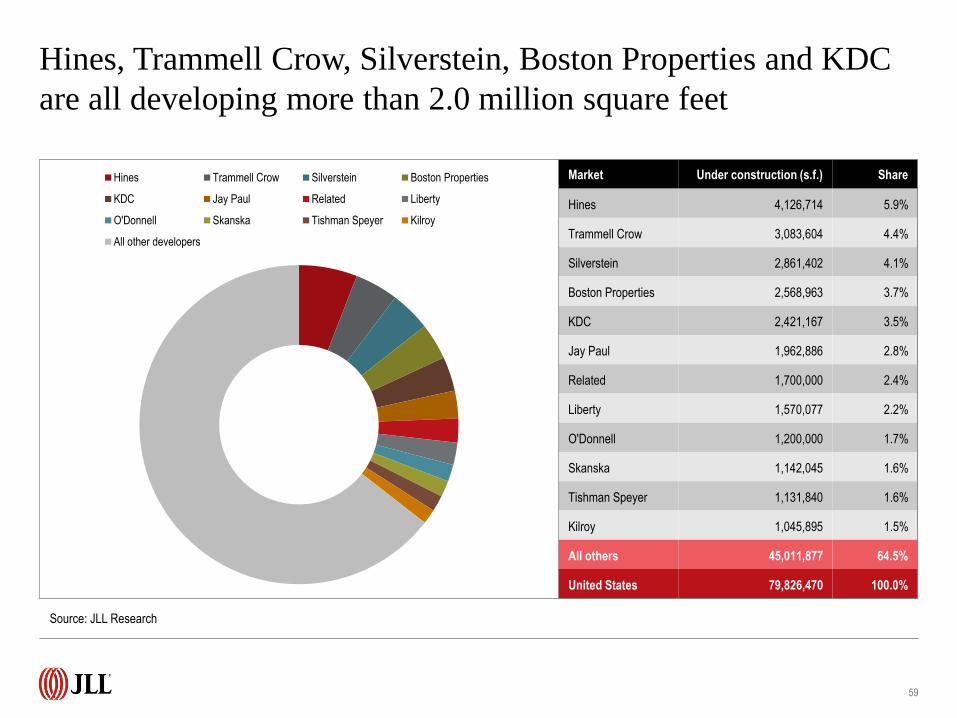
Market Under construction (s.f.) Share
Hines 4,126,714 5.9%
Trammell Crow 3,083,604 4.4%
Silverstein 2,861,402 4.1%
Boston Properties 2,568,963 3.7%
KDC 2,421,167 3.5%
Jay Paul 1,962,886 2.8%
Related 1,700,000 2.4%
Liberty 1,570,077 2.2%
O'Donnell 1,200,000 1.7%
Skanska 1,142,045 1.6%
Tishman Speyer 1,131,840 1.6%
Kilroy 1,045,895 1.5%
All others 45,011,877 64.5%
United States 79,826,470 100.0%
Hines, Trammell Crow, Silverstein, Boston Properties and KDC
are all developing more than 2.0 million square feet
Hines Trammell Crow Silverstein Boston Properties
KDC Jay Paul Related Liberty
O'Donnell Skanska Tishman Speyer Kilroy
All other developers
59
Source: JLL Research
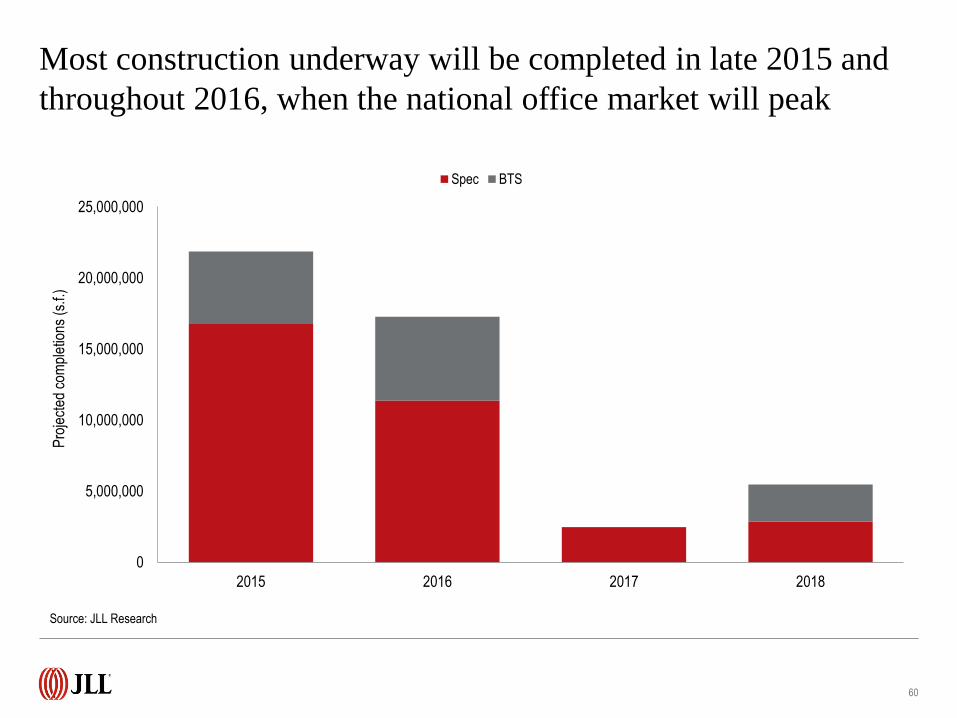
Most construction underway will be completed in late 2015 and
throughout 2016, when the national office market will peak
0
5,000,000
10,000,000
15,000,000
20,000,000
25,000,000
2015 2016 2017 2018
Pro
ject
ed c
ompl
etio
ns (
s.f.)
Spec BTS
60
Source: JLL Research
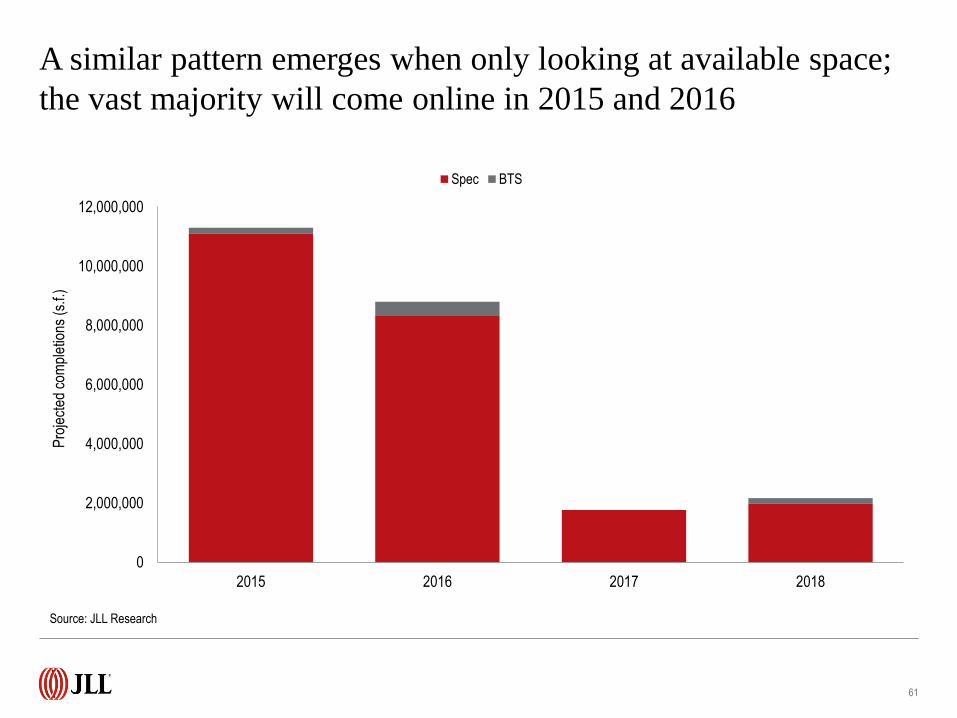
A similar pattern emerges when only looking at available space;
the vast majority will come online in 2015 and 2016
0
2,000,000
4,000,000
6,000,000
8,000,000
10,000,000
12,000,000
2015 2016 2017 2018
Pro
ject
ed c
ompl
etio
ns (
s.f.)
Spec BTS
61
Source: JLL Research

Investment sales
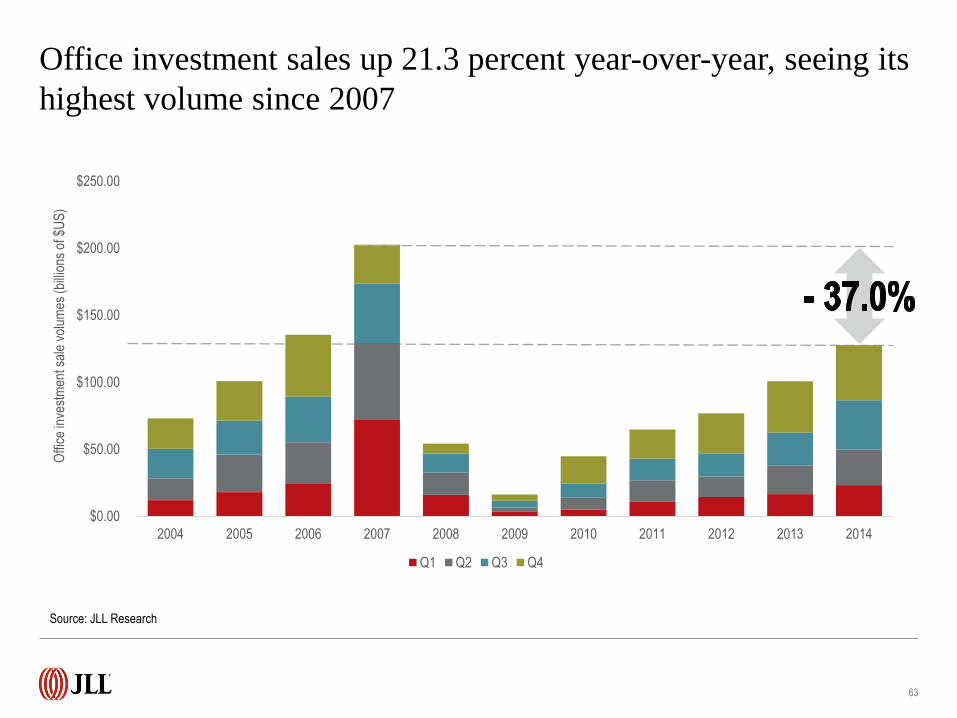
Office investment sales up 21.3 percent year-over-year, seeing its
highest volume since 2007
63
$0.00
$50.00
$100.00
$150.00
$200.00
$250.00
2004 2005 2006 2007 2008 2009 2010 2011 2012 2013 2014
Offi
ce in
vest
men
t sal
e vo
lum
es (b
illio
ns o
f $U
S)
Q1 Q2 Q3 Q4
Source: JLL Research
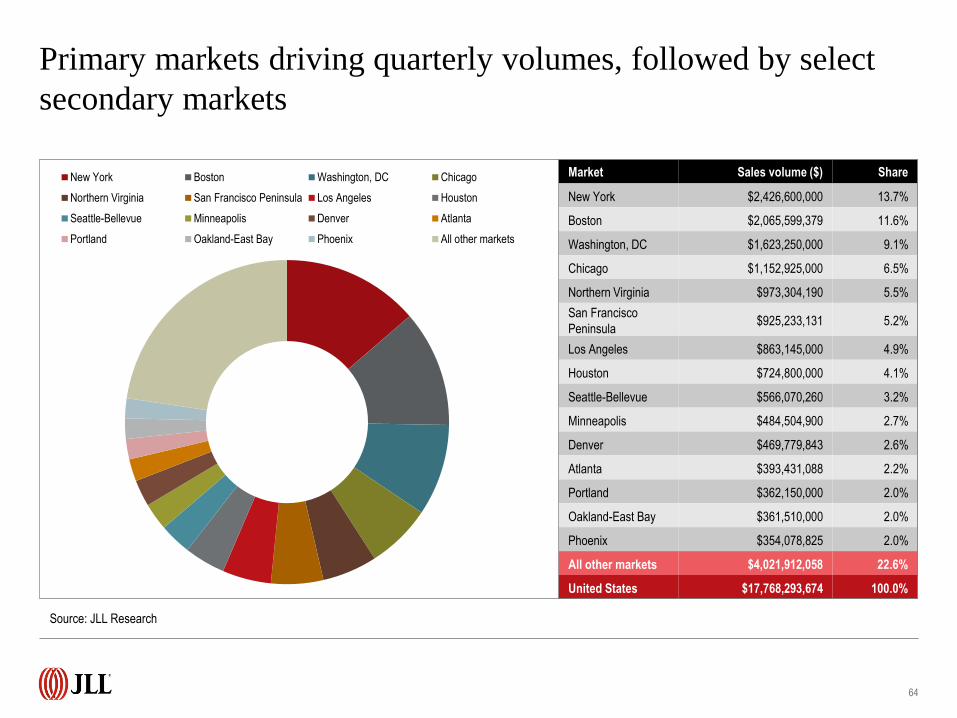
Market Sales volume ($) Share
New York $2,426,600,000 13.7%
Boston $2,065,599,379 11.6%
Washington, DC $1,623,250,000 9.1%
Chicago $1,152,925,000 6.5%
Northern Virginia $973,304,190 5.5%
San Francisco
Peninsula $925,233,131 5.2%
Los Angeles $863,145,000 4.9%
Houston $724,800,000 4.1%
Seattle-Bellevue $566,070,260 3.2%
Minneapolis $484,504,900 2.7%
Denver $469,779,843 2.6%
Atlanta $393,431,088 2.2%
Portland $362,150,000 2.0%
Oakland-East Bay $361,510,000 2.0%
Phoenix $354,078,825 2.0%
All other markets $4,021,912,058 22.6%
United States $17,768,293,674 100.0%
Primary markets driving quarterly volumes, followed by select
secondary markets
New York Boston Washington, DC Chicago
Northern Virginia San Francisco Peninsula Los Angeles Houston
Seattle-Bellevue Minneapolis Denver Atlanta
Portland Oakland-East Bay Phoenix All other markets
64
Source: JLL Research
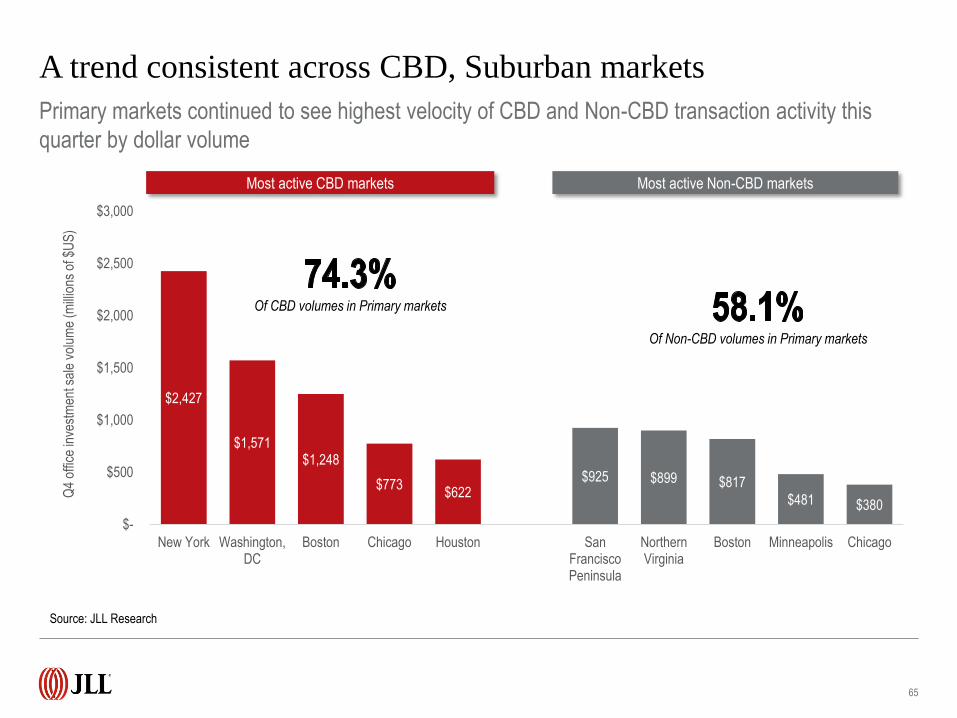
A trend consistent across CBD, Suburban markets
Primary markets continued to see highest velocity of CBD and Non-CBD transaction activity this
quarter by dollar volume
65
$2,427
$1,571 $1,248
$773 $622
$925 $899 $817
$481 $380
$-
$500
$1,000
$1,500
$2,000
$2,500
$3,000
New York Washington,DC
Boston Chicago Houston SanFranciscoPeninsula
NorthernVirginia
Boston Minneapolis Chicago
Q4
offic
e in
vest
men
t sal
e vo
lum
e (m
illio
ns o
f $U
S)
Most active CBD markets Most active Non-CBD markets
Of CBD volumes in Primary markets
Of Non-CBD volumes in Primary markets
Source: JLL Research
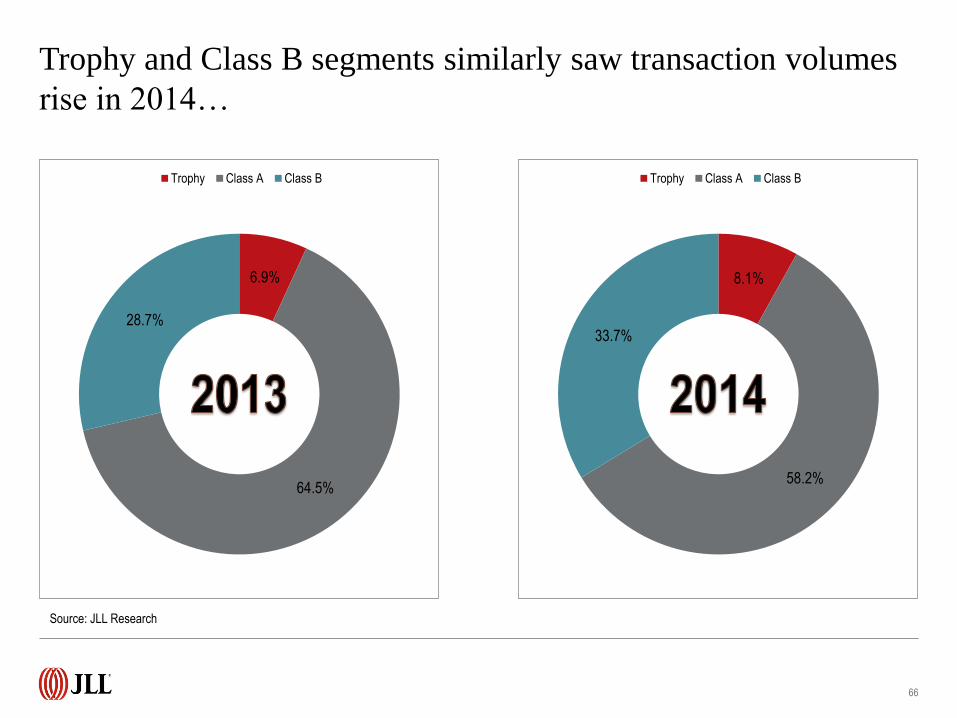
6.9%
64.5%
28.7%
Trophy Class A Class B
Trophy and Class B segments similarly saw transaction volumes
rise in 2014…
66
8.1%
58.2%
33.7%
Trophy Class A Class B
Source: JLL Research
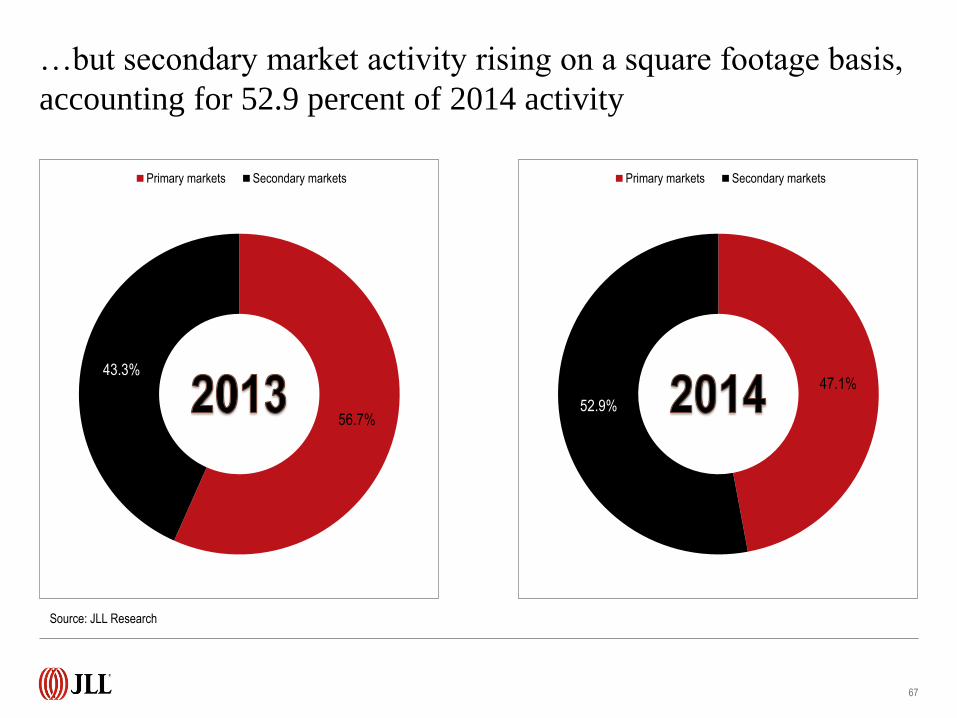
56.7%
43.3%
Primary markets Secondary markets
…but secondary market activity rising on a square footage basis,
accounting for 52.9 percent of 2014 activity
67
47.1%
52.9%
Primary markets Secondary markets
Source: JLL Research
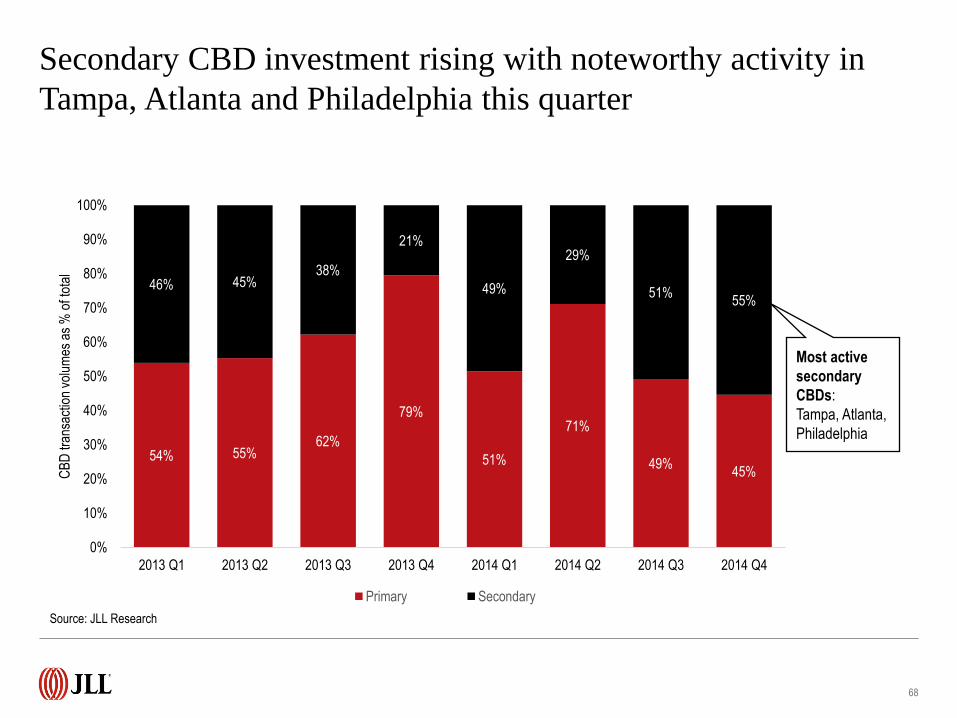
Secondary CBD investment rising with noteworthy activity in
Tampa, Atlanta and Philadelphia this quarter
68
54% 55% 62%
79%
51%
71%
49% 45%
46% 45% 38%
21%
49%
29%
51% 55%
0%
10%
20%
30%
40%
50%
60%
70%
80%
90%
100%
2013 Q1 2013 Q2 2013 Q3 2013 Q4 2014 Q1 2014 Q2 2014 Q3 2014 Q4
CB
D tr
ansa
ctio
n vo
lum
es a
s %
of t
otal
Primary Secondary
Most active
secondary
CBDs:
Tampa, Atlanta,
Philadelphia
Source: JLL Research
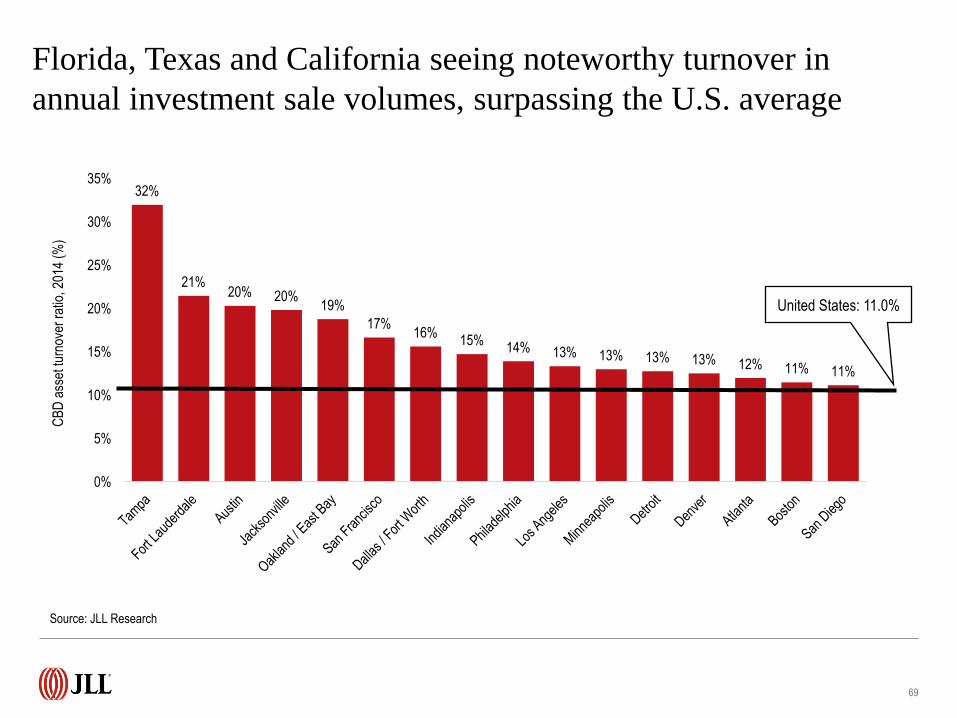
Florida, Texas and California seeing noteworthy turnover in
annual investment sale volumes, surpassing the U.S. average
69
32%
21% 20% 20%
19%
17% 16%
15% 14% 13% 13% 13% 13% 12% 11% 11%
0%
5%
10%
15%
20%
25%
30%
35%
CB
D a
sset
turn
over
rat
io, 2
014
(%)
United States: 11.0%
Source: JLL Research
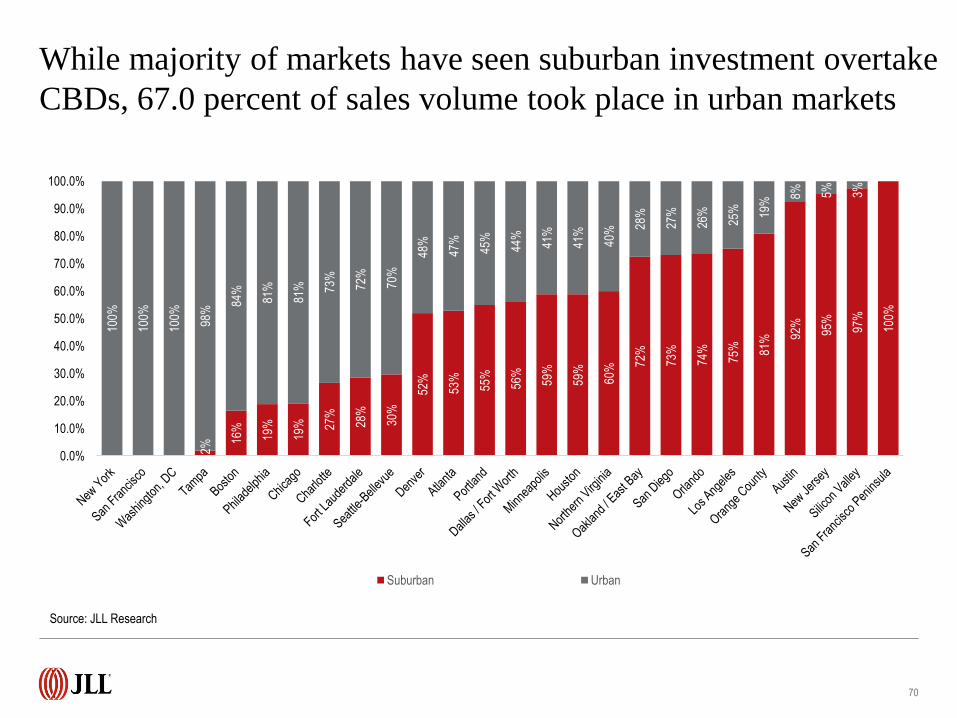
While majority of markets have seen suburban investment overtake
CBDs, 67.0 percent of sales volume took place in urban markets
70
2% 16
%
19%
19%
27%
28%
30%
52%
53%
55%
56%
59%
59%
60%
72%
73%
74%
75%
81%
92%
95%
97%
100%
100%
100%
100%
98%
84%
81%
81%
73%
72%
70%
48%
47%
45%
44%
41%
41%
40%
28%
27%
26%
25%
19%
8%
5%
3%
0.0%
10.0%
20.0%
30.0%
40.0%
50.0%
60.0%
70.0%
80.0%
90.0%
100.0%
Suburban Urban
Source: JLL Research
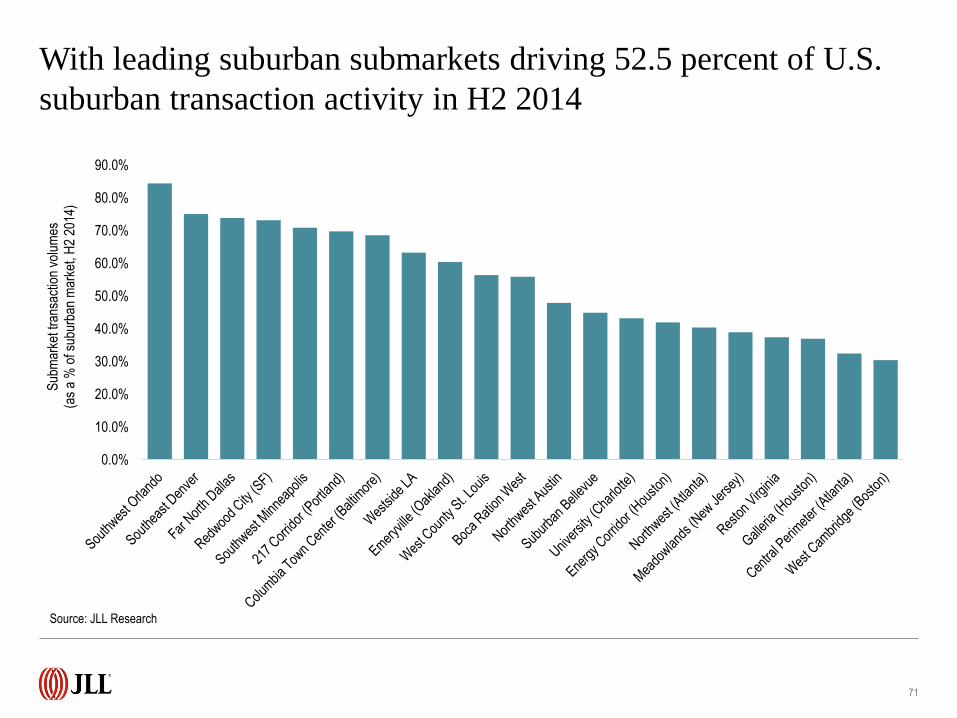
With leading suburban submarkets driving 52.5 percent of U.S.
suburban transaction activity in H2 2014
71
0.0%
10.0%
20.0%
30.0%
40.0%
50.0%
60.0%
70.0%
80.0%
90.0%
Sub
mar
ket t
rans
actio
n vo
lum
es
(as
a %
of s
ubur
ban
mar
ket,
H2
2014
)
Source: JLL Research
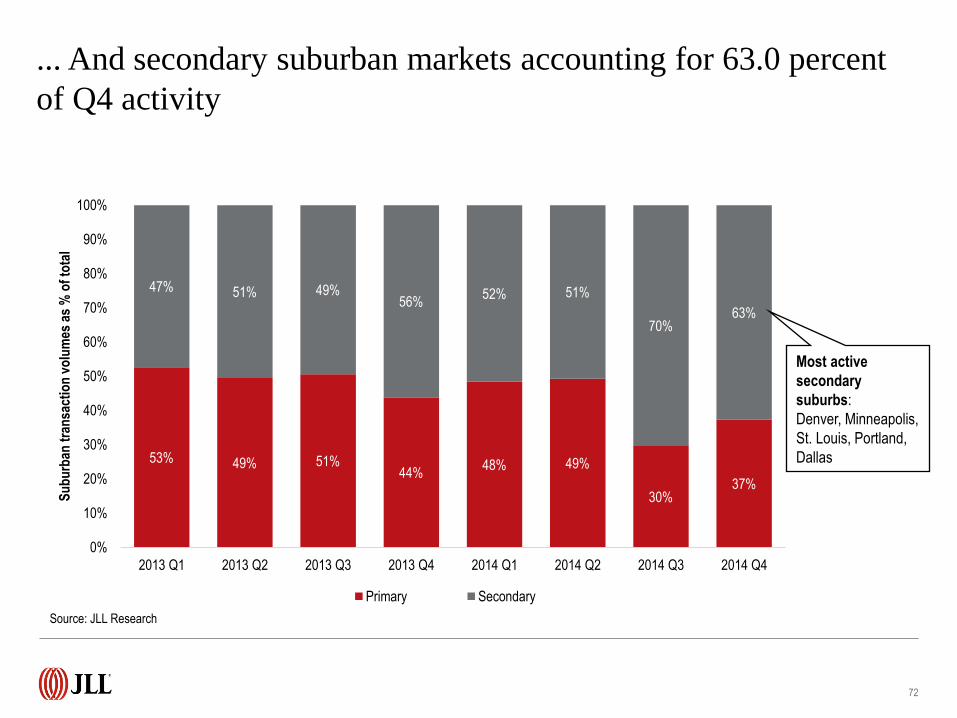
... And secondary suburban markets accounting for 63.0 percent
of Q4 activity
72
53% 49% 51% 44%
48% 49%
30% 37%
47% 51% 49% 56%
52% 51%
70% 63%
0%
10%
20%
30%
40%
50%
60%
70%
80%
90%
100%
2013 Q1 2013 Q2 2013 Q3 2013 Q4 2014 Q1 2014 Q2 2014 Q3 2014 Q4
Su
bu
rban
tra
nsa
ctio
n v
olu
mes
as
% o
f to
tal
Primary Secondary
Most active
secondary
suburbs:
Denver, Minneapolis,
St. Louis, Portland,
Dallas
Source: JLL Research

Outlook
74
Source: JLL Research
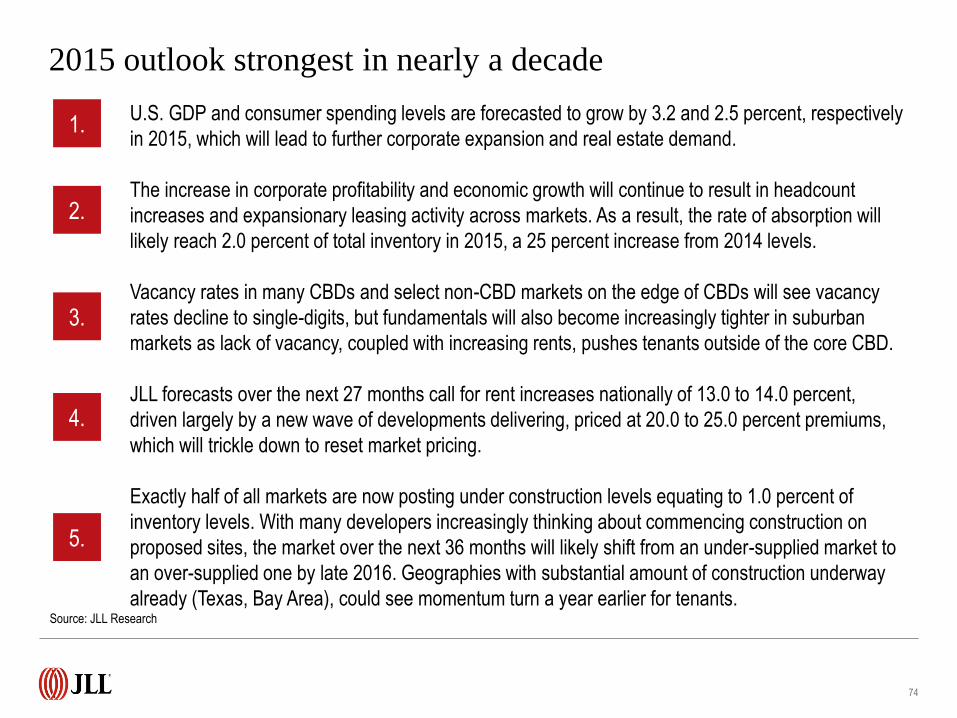
2015 outlook strongest in nearly a decade
U.S. GDP and consumer spending levels are forecasted to grow by 3.2 and 2.5 percent, respectively
in 2015, which will lead to further corporate expansion and real estate demand.
The increase in corporate profitability and economic growth will continue to result in headcount
increases and expansionary leasing activity across markets. As a result, the rate of absorption will
likely reach 2.0 percent of total inventory in 2015, a 25 percent increase from 2014 levels.
Vacancy rates in many CBDs and select non-CBD markets on the edge of CBDs will see vacancy
rates decline to single-digits, but fundamentals will also become increasingly tighter in suburban
markets as lack of vacancy, coupled with increasing rents, pushes tenants outside of the core CBD.
JLL forecasts over the next 27 months call for rent increases nationally of 13.0 to 14.0 percent,
driven largely by a new wave of developments delivering, priced at 20.0 to 25.0 percent premiums,
which will trickle down to reset market pricing.
Exactly half of all markets are now posting under construction levels equating to 1.0 percent of
inventory levels. With many developers increasingly thinking about commencing construction on
proposed sites, the market over the next 36 months will likely shift from an under-supplied market to
an over-supplied one by late 2016. Geographies with substantial amount of construction underway
already (Texas, Bay Area), could see momentum turn a year earlier for tenants.
1.
2.
3.
4.
5.

The slowdown in the energy industry, as a result of the decline in oil prices in recent weeks, will yield a slower demand environment in energy hotbeds such as Houston over the short to mid-term. Likewise, absorption in high-priced tech markets like San Francisco and Silicon Valley could also slow as rental rates reach peak levels amidst declining vacancy.
COPYRIGHT © JONES LANG LASALLE IP, INC. 2015
John Sikaitis Managing Director – Office and Local Markets Research
+1 202 719 5839
Julia Georgules Associate Director – Office Research
+1 415 354 6908
Sean Coghlan Manager – Capital Markets Research
+1 215 988 5556
Phil Ryan Research Analyst – Office and Economy Research
+1 202 719 6295
>> Click to learn more, and see
market-by-market data