u.s. oil and gas infrastructure investment/media/files/policy/infrastructure/api-infrastructure...1...
TRANSCRIPT

U.S. OIL AND GAS
INFRASTRUCTURE INVESTMENT
T H R O U G H 2 0 3 5
AN ENGINE FOR ECONOMIC GROWTHSTUDY PREPARED FOR A M E R I CA N P E T R O L E U M I N S T I T U T E
© Copyright 2017 – American Petroleum Institute (API), all rights reserved. Digital Media | DM2017-036 | PDF
APRIL 2017

ICF Authors: Kevin Petak, Harry Vidas, Julio Manik, Srirama Palagummi, Anthony Ciatto, and Andrew Griffith
About API: The American Petroleum Institute (API) is the only national trade
association that represents all aspects of America’s oil and natural gas industry. Our more than 625 corporate members, from the largest major oil company to the smallest of independents, come from all segments of the industry. They are producers, refiners, suppliers, marketers, pipeline operators and marine transporters, as well as service and
supply companies that support all segments of the industry.
Although our focus is primarily domestic, in recent years our work has expanded to include a growing international dimension, and today API is recognized around the
world for its broad range of programs.
About ICF: ICF (NASDAQ:ICFI) provides professional services and technology solutions that deliver beneficial impact in areas critical to the world's future. The firm combines passion for its work with industry expertise and innovative analytics to
produce compelling results throughout the entire program lifecycle, from research and analysis through implementation and improvement. Since 1969, ICF has been
serving government at all levels, major corporations, and multilateral institutions. More than 5,000 employees serve these clients from more than 65 offices worldwide
Waivers. Those viewing this Material hereby waive any claim at any time, whether now or in the future, against ICF, its officers, directors, employees or agents arising out of or in connection with this Material. In no event whatsoever shall ICF, its officers, directors,
employees, or agents be liable to those viewing this Material.
Warranties and Representations. ICF endeavors to provide information and projections consistent with standard practices in a professional manner. ICF MAKES NO WARRANTIES, HOWEVER, EXPRESS OR IMPLIED (INCLUDING WITHOUT LIMITATION ANY WARRANTIES OR MERCHANTABILITY OR FITNESS FOR A
PARTICULAR PURPOSE), AS TO THIS MATERIAL. Specifically but without limitation, ICF makes no warranty or guarantee regarding the accuracy of any forecasts,
estimates, or analyses, or that such work products will be accepted by any legal or regulatory body.
Contacts:
American Petroleum Institute ICF
Steven Crookshank, Senior Economist Kevin Petak, Vice President 1220 L Street, NW 9300 Lee Highway Washington, DC 20005 Fairfax, VA 22031

Table of Contents
Executive Summary .................................................................................................................. 1
1 Introduction ........................................................................................................................ 6
1.1 Study Objectives ..................................................................................................................... 6
1.2 Study Regions......................................................................................................................... 8
1.3 Infrastructure Coverage .......................................................................................................... 9
1.4 Report Structure ................................................................................................................... 10
2 Methodology .................................................................................................................... 12
2.1 Modeling Framework ............................................................................................................ 12
2.2 Infrastructure Methodology and Criteria ............................................................................... 13
3 Scenario Overview ........................................................................................................... 23
3.1 Defining the Study’s Scenarios ............................................................................................. 23
3.2 Comparison of Supply, Demand, and Pipeline Capacity in the Scenarios .......................... 27
4 Oil and Gas Infrastructure Requirements ...................................................................... 42
4.1 Overview of Oil and Gas Infrastructure Development .......................................................... 42
4.2 Oil and Gas Infrastructure Development by Category ......................................................... 45
4.3 Summary of Regional Investment in Oil and Gas Infrastructure .......................................... 59
5 Results of the Economic Impact Analysis ..................................................................... 64
6 Conclusions ..................................................................................................................... 70
Appendix A: ICF Modeling Tools ........................................................................................... 74
Gas Market Model (GMM) ................................................................................................................ 74
Detailed Production Report (DPR) ................................................................................................... 77
NGL Transport Model (NGLTM) ....................................................................................................... 79
Crude Oil Transport Model (COTM) ................................................................................................. 81
Appendix B: Details for Infrastructure Development ........................................................... 83
New Infrastructure and E/U/R/R ....................................................................................................... 83
New Infrastructure .......................................................................................................................... 101
Enhancement, Upgrade, Replacement, and Refurbishment (E/U/R/R) ........................................ 119

Appendix C: Regional Capital Expenditures for Infrastructure Development .................. 137
Appendix D: Average Annual Values for Gross State Product and Taxes........................ 151
Appendix E: Approximate Economic Impacts of Pipeline and Gathering CAPEX ........... 153

1
Executive Summary
During the past five years, U.S. oil and gas infrastructure development proceeded at a rapid pace, and
many have wondered whether the trend can continue. In that light, API contracted ICF to undertake a
study that investigates the amount of oil and gas infrastructure development possible in the U.S. through
2035. This report summarizes results of the study.
The report focuses on the amount of infrastructure needed for two different scenarios, a Base Case and
a High Case, each of which are plausible depictions of future market conditions. While the Base Case
represents a most likely scenario, the High Case is put forward to assess infrastructure development in a
more robust environment that is fostered by a larger hydrocarbon resource base and more rapid
advancements in E&P technology. The study assesses capital expenditures associated with and the
resulting economic consequences of oil and gas infrastructure development. Key findings are as follows:
1) Rapid infrastructure development is likely to continue for a prolonged period of time. The primary
drivers for robust development are still in place – shale and tight resource development is likely
to continue in earnest, and markets will grow in response to the relatively low commodity prices
that are being fostered by new oil and gas supplies.
2) Total capital expenditures (CAPEX) for oil and gas infrastructure development will range from
$1.06 to $1.34 trillion from 2017 through 2035 (Exhibit ES-1). These levels of investment equate
to an average annual CAPEX ranging from $56 to $71 billion throughout the projection (Exhibit
ES-2). This includes investments in new as well as existing infrastructure for the following
categories: a) Surface and Lease Equipment; b) Gathering and Processing Facilities; c) Oil, Gas, and
NGL Pipelines; d) Oil and Gas Storage Facilities; e) Refineries and Oil Products Pipelines; and f)
Export Terminals.
Exhibit ES-1: Projected Capital Investment in Oil and Gas Infrastructure from 2017-2035 (Million
2015$)
Gas$480,707
45%
NGL$57,108
6%
Oil$521,871
49%
Base CaseTotal Investment = $1,059,686
High CaseTotal Investment = $1,342,167
Gas$651,128
49%
NGL$84,810
6%
Oil$606,229
45%

2
3) Investment in infrastructure contributes $1.50 to $1.89 trillion to U.S. Gross Domestic Product
(GDP) over the projection period, or between $79 and $100 billion annually.
4) Infrastructure development will employ an average of 828,000 to 1,047,000 individuals annually
in the U.S. Significant jobs are created not only within states where infrastructure development
occurs, but across ALL states because of indirect and induced labor impacts. Oil and gas
infrastructure development has far-reaching benefits across the entire U.S. economy.
5) The outcome of the scenarios is dependent on regulatory approvals of infrastructure projects.
Exhibit ES-2: Oil and Gas Infrastructure CAPEX by Year (Million 2015$)
Base CaseProjected (2017-2035) Average Annual CAPEX = $55,773
High CaseProjected (2017-2035) Average Annual CAPEX = $70,640
$0
$10,000
$20,000
$30,000
$40,000
$50,000
$60,000
$70,000
$80,000
$90,000
$100,000
2012
2013
2014
2015
201
6
2017
2018
2019
2020
2021
2022
2023
2024
2025
2026
202
7
2028
2029
2030
2031
2032
2033
2034
2035
New E/U/R/R
E/U/R/R = Enhancement/Upgrade/Replacement/Refurbishment
$0
$10,000
$20,000
$30,000
$40,000
$50,000
$60,000
$70,000
$80,000
$90,000
$100,000
2012
2013
2014
2015
201
6
2017
2018
2019
2020
2021
2022
2023
2024
2025
2026
202
7
2028
2029
2030
2031
2032
2033
2034
2035
New E/U/R/R
E/U/R/R = Enhancement/Upgrade/Replacement/Refurbishment

3
Study Highlights
The scenarios in this study project significant growth in oil and gas production and markets that evolve to
accommodate such growth. While the Base Case shows fairly constant U.S. oil production in aggregate,
tight oil supplies will continue to grow to offset declines in conventional production. In the High Case, oil
production growth is robust with U.S. production rising to upwards of 12 million barrels per day by 2035.
Natural gas production growth is even more pronounced, increasing from roughly 72 billion cubic feet per
day at present to between 110 and 131 billion cubic feet per day by 2035. Natural gas liquids (NGL) will
track along with gas production over time.
Such robust production growth is supported by strong demand growth. Refinery output in the U.S. will
increase from its present level of just over 16 million barrels per day to between 17 and 19 million barrels
per day by 2035. Increased oil refining is driven by tight oil development within the U.S. and oil sands
production from Western Canada. Gas markets grow dramatically, with significant growth of liquefied
natural gas (LNG) exports, exports to Mexico, increases in petrochemical activity, and increases in gas-
fired power generation. Petrochemical activity and exports also drive growth in NGL markets.
Robust development of unconventional oil and gas resources and the supporting market activity promote
new transport capability for oil and gas. As a result transport capability for oil, gas, and NGLs increases by
3.0 to 5.0 million barrels per day, 49 to 68 billion cubic feet per day, and 1.8 to 2.6 million barrels per day,
respectively. Incremental transport is also supported by a significant amount of new gathering and
processing infrastructure.
Thus, investment in oil and gas infrastructure will sum to $1.06 to $1.34 trillion from 2017 through 2035,
averaging $56 to $71 billion per year. Roughly 30 percent of the investment or $16.7 to $19.2 billion
annually will be for surface and lease equipment (Exhibit ES-3), which is split between investment in
equipment that supports production from onshore wells and development of offshore platforms located
in the Gulf of Mexico. Oil, gas, and NGL pipeline development will also be robust with an annual average
CAPEX of $12.3 to $19.0 billion from 2017 through 2035, equating to between 22 and 27 percent of the
total infrastructure investment. Across the U.S., there will be 27,000 to 45,000 miles of pipelines with 10
to 12 million horsepower of compression added and replaced throughout the period. Gathering and
processing investment ranks third among the investment categories, with an average annual CAPEX of
$12.4 to $14.8 billion accounting for roughly 22 percent of the total infrastructure investment. This
investment is aimed at gathering and processing oil, gas, and NGLs from 24,075 to 28,175 new well
completions per year, and there will be 218,000 to 240,000 miles of gathering lines, 22 to 29 million
horsepower and compression, 70 to 85 billion cubic feet per day of processing plant capacity, and 5 to 6
million barrels per day of fractionation capacity built and replaced throughout the projection. The
remainder of the investment, or between $14.3 and $17.6 billion per year is required to support refining,
storage, and export activities.

4
Exhibit ES-3: Annual Oil and Gas Infrastructure CAPEX by Category (Million 2015$)
Geographically, oil and gas infrastructure investment will be greatest in the Southwest, which includes
Texas, with a total CAPEX of $381 to $501 billion, accounting for 36 to 37 percent of the total infrastructure
investment across the U.S. (Exhibit ES-4). It should come as little surprise that this area leads the way on
$0
$10,000
$20,000
$30,000
$40,000
$50,000
$60,000
$70,000
$80,000
$90,000
$100,000
2012
2013
2014
2015
2016
2017
2018
2019
2020
2021
2022
2023
2024
2025
2026
202
7
2028
2029
2030
2031
2032
2033
2034
2035
Surface and Lease Equipment Gathering and Processing
Oil, Gas, and NGL Pipelines Oil and Gas Storage
Refining and Oil Products Transport Export Terminals
Projected (2017-2035) Average Annual ValuesSurface and Lease Equipment = $16,737
Gathering and Processing = $12,401Oil, Gas, and NGL Pipelines = $12,320
Oil and Gas Storage = $1,104Refining and Oil Products Transport = $10,301
Export Terminals = $2,910
BASE CASE
$0
$10,000
$20,000
$30,000
$40,000
$50,000
$60,000
$70,000
$80,000
$90,000
$100,000
2012
2013
2014
2015
2016
2017
2018
2019
2020
2021
2022
2023
2024
2025
2026
202
7
2028
2029
2030
2031
2032
2033
2034
2035
Surface and Lease Equipment Gathering and Processing
Oil, Gas, and NGL Pipelines Oil and Gas Storage
Refining and Oil Products Transport Export Terminals
Projected (2017-2035) Average Annual ValuesSurface and Lease Equipment = $19,210
Gathering and Processing = $14,759Oil, Gas, and NGL Pipelines = $19,030
Oil and Gas Storage = $1,340Refining and Oil Products Transport = $11,412
Export Terminals = $4,889
HIGH CASE

5
infrastructure development because it is relatively friendly to oil and gas development and is already
home to a significant amount of infrastructure. However, the Northeast/Midwest U.S. will also see a
significant investment in oil and gas infrastructure, with total investment for the area ranging from $283
to $381 billion, accounting for roughly 27 to 28 percent of the total oil and gas infrastructure investment
across the U.S. The focus for this area has been and will continue to be on developing and transporting
the vast amount of natural gas resource contained in the Marcellus/Utica producing basin. Infrastructure
development for this area will depend on approvals of pipeline projects and market evolution. Offshore
Gulf of Mexico infrastructure development is also significant at $177 to $204 billion, accounting for
roughly 16 percent of the total investment that occurs across each of the scenarios. Collectively, other
geographic areas account for the remaining $296 to $360 billion or roughly 27 percent of the total
investment across the projections.
Exhibit ES-4: Regional CAPEX for Oil and Gas Infrastructure from 2017-2035 (Million 2015$)
Infrastructure development will continue to have significant and widespread impacts on the U.S.
economy. It will support an average of 828,000 to 1,047,000 jobs each year from 2017 through 2035. It
will also add a total of $1.50 to $1.89 trillion or an annual average of $79 to $100 billion to U.S. Gross
Domestic Product. Federal taxes related to oil and gas infrastructure development will total $304 to $386
billion, while state taxes will total $236 to $299 billion throughout the projection period. All states benefit
from infrastructure development as there are indirect and induced employment benefits spread to states
even where these is no infrastructure development.
Concluding Statement
A robust environment for oil and gas infrastructure development has not yet run its course and is likely to
continue for many years, with total investment in oil and gas infrastructure ranging from $1.06 to $1.34
trillion from 2017 through 2035. This investment will have positive impacts on the U.S. economy,
employing many individuals and contributing significantly to Gross Domestic Product. It will also foster
delivery of lower cost energy to households and businesses, and help the upstream and downstream
portions of the oil and gas business develop more fully over time.
Base CaseTotal Investment = $1,059,686
High CaseTotal Investment = $1,342,167
Central$114,358
11%
Midwest$79,157
7%
Northeast$204,273
19%
Southeast$52,137
5%
Southwest$381,438
36%
Western$44,088
4%
Offshore$177,490
17%
Alaska$6,744
1%Central
$128,67810%
Midwest$103,268
8%
Northeast$277,916
21%
Southeast$75,598
6%
Southwest$500,539
37%
Western$45,479
3%
Offshore$203,787
15%
Alaska$6,902
0%

6
1 Introduction
1.1 Study Objectives
With the advent of oil and gas development from shale formations, North America’s energy business has
been transformed. The Shale Revolution has brought about a renewed focus on North America’s oil and
gas development, and U.S. oil production has risen from roughly from 5 to 9 million barrels per day while
natural gas production has risen from about 55 to 72 billion cubic feet per day over the past decade. As
a result, growth in the business that involve processing, refining, and transport of oil and gas has also been
strong with $390 billion of spending for new infrastructure during the past five years (Exhibit 1).
Exhibit 1: Infrastructure CAPEX during the Past Five Years, Million 2015$
Generally, recent capital expenditures (i.e., the CAPEX from 2012 through 2016) for infrastructure have
been averaging about $78 billion per year, with a peak expenditure of over $85 billion in 2013. Spending
has been greatest for surface equipment with an average annual CAPEX of roughly $22billion in real terms.
This category includes offshore oil platforms in the Gulf of Mexico, each of which is relatively expensive.
New pipelines have accounted for roughly one-third of the capital expenditure, averaging just over $20
billion per year, while onshore gathering and processing expenditures have averaged about $16 billion
per year in real terms. The remaining categories that include oil and gas storage, refining enhancements
and upgrades, products and rail transport, and export facilities collectively add roughly $20 billion per
year to the total. In short, significant infrastructure development has occurred across a number of
categories.
$0
$10,000
$20,000
$30,000
$40,000
$50,000
$60,000
$70,000
$80,000
$90,000
$100,000
2012 2013 2014 2015 2016
Surface and Lease Equipment Gathering and Processing
Oil, Gas, and NGL Pipelines Oil and Gas Storage
Refining and Oil Products Transport Export Terminals

7
Even while robust growth in U.S. oil and gas production and infrastructure development has occurred,
much uncertainty remains about whether such growth will continue. The relatively low oil and gas price
environment over the past few years has reduced E&P spending and activity, and infrastructure
development has slowed from its peak in 2013. Thus, this study is being undertaken to examine whether
the drivers of robust infrastructure development are still in place and to project potential needs and
impacts of infrastructure going forward considering the uncertainty that exists.
The primary objective of the study is to inform industry, policymakers, and stakeholders about the
dynamics of North America’s energy markets based on a detailed supply/demand outlook for oil and gas
development. Within this context, the study assesses oil and gas infrastructure needed to support the
delivery of crude oil and oil products, natural gas, and natural gas liquids (NGLs). The associated economic
benefits of infrastructure development, most notably GDP and jobs impacts are also projected.
The study considers recent trends and uncertainties, investigating impacts of those trends on future
infrastructure requirements with two scenarios, a “Base Case” and a “High Growth Case”. These cases
are briefly described below.
The study’s Base Case represents a reasonable set of expectations about the future that are
consistent with recent market activity. The case may also be characterized as a “status quo” case
in that it reflects future market growth consistent with recent trends in the power sector and for
export activity. In the case, oil and gas prices rebound so as to support E&P activity that is
sufficient to satisfy market growth.
The study’s High Case depicts a higher growth environment for exploration and production (E&P)
activity and oil and gas infrastructure development that is fostered by a larger hydrocarbon
resource base and more rapid advancements in E&P technology. The case depicts an environment
in which oil and gas development is 20% to 30% above the development forecast in the Base Case.
To develop the Base and High Case results, the study includes the following components:
Natural gas supply/demand projections that rely on the most current market trends.
Projections for North American E&P activity that are supported by a robust, cost effective, and
growing resource base for oil and natural gas.
An assessment of natural gas use in power plants, considering load requirements and an ever-
changing mix of generation assets.
An assessment of onshore lease equipment, offshore production facilities, and gathering,
processing, and fractionation needs to permit the delivery of hydrocarbons to an already
extensive pipeline grid that supports delivery to refineries, markets, end-users, and export
terminals.
Review of oil and gas storage requirements to temporarily store hydrocarbons until they are
needed in markets and at refineries.

8
Analysis of NGL and oil infrastructure requirements, including refinery upgrades that are required
to process the lighter sweeter crudes that are being developed across North America and the
incremental oil products transport that is needed to accomodate increased refinery output.
An assessment of the increased oil, gas, and NGL exports that could occur with increasing North
American supplies.
The economic impact analysis that is discussed near the end of the report is based on IMPLAN modeling,
which provides direct, indirect, and induced job impacts of the oil and gas infrastructure development.
Measures of state-level employment and value added impacts are included.
1.2 Study Regions
For reporting, this study applies U.S. DOE EIA pipeline regions for the Lower 48 states in the U.S. (Exhibit
2). It is worth noting that the Marcellus and Utica shale plays are split between the Northeast and
Midwest. Significant gas and natural gas liquids (NGLs) production growth from this area is expected to
drive a large amount of infrastructure development in the future. Another significant area of growth will
be the Southwest, which is an area already with a large amount of oil and gas infrastructure and is also
home to many producing basins.
Exhibit 2: Study Regions
Central
Southwest
Western
Southeast
MidwestNortheast
OffshoreAlaska

9
1.3 Infrastructure Coverage
Exhibit 3 lists the infrastructure categories assessed in this study. The study applies a broad definition to
infrastructure that includes all assets needed to process, refine, store, and transport oil, gas, NGLs, and
oil products to end-users. End-users include industrial facilities that use oil, gas, and NGLs as either a fuel
or feedstock, petrochemical facilities, power plants, export terminals, and distribution companies.
Distribution infrastructure has been excluded from the analysis, and expenditures for upgrades and
enhancements to distribution systems could add billions of dollars to the capital expenditures discussed
throughout this report.
Exhibit 3: Oil and Gas Infrastructure Categories
Category Sub-Category Type of
Hydrocarbon
Surface and Lease Equipment Onshore Lease Equipment Oil and Gas
Offshore Production Platforms Oil
Gathering and Processing Gas Gathering Lines Gas
Oil Gathering Lines Oil
Compressors Gas
Processing Plants Gas
Fractionation Facilities NGL
Oil, Gas, and NGL Pipelines Oil Pipelines Oil
Pumps for Oil Pipelines Oil
Gas Pipelines Gas
Compressor Stations for Gas Pipelines Gas
NGL Pipelines NGL
Pumps for NGL Pipelines NGL
Oil and Gas Storage Above Ground Tank Farms Oil
Underground Storage Gas and NGL
Refining and Oil Products Transport Refining Oil
Oil Product Pipelines Oil
Pumps for Oil Product Pipelines Oil
Rail Transport Oil and NGL
Export Terminals LNG Export Facilities Gas
NGL Export Terminals NGL

10
The main infrastructure categories include: surface and lease equipment; gathering and processing; oil,
gas, and NGL pipelines; oil and gas storage; refining and oil products transport; and export terminals. Each
category is also split into sub-categories to provide additional detail. In addition, each sub-sub category
is allocated into gas, oil, or NGL development in order to link the different activities with broader reporting
by type of hydrocarbon.
Transmission pipelines include mainline capacity from supply areas to market areas and laterals on
isolated segments that connect individual facilities or a cluster of facilities to a pipeline’s mainline. Gas
gathering pipe is the pipe that connects wells to a mainline or to a gas processing plant where the liquids
and non-hydrocarbon gases are extracted. Oil gathering pipe collects and delivers crude oil from oil wells
and lease condensate from gas wells to nearby crude oil storage and treatment tanks or to crude oil
transmission mainlines. Surface and Lease equipment for oil wells includes accessory equipment, the
disposal system, electrification, flowlines, free water knockout units, heater treaters, LACT units,
manifolds, producing separators, production pumping equipment, production pumps, production valves
and mandrels, storage tanks, and test separators. Surface and Lease equipment for gas wells includes
dehydrators, disposal pumps, electrification, flowlines and connections, the production package,
production pumping equipment, production pumps, and storage tanks.
Reported infrastructure development and the corresponding CAPEX include projects for new capacity as
well as projects to refurbish, replace, upgrade, and enhance existing capacity. Throughout the projection,
refurbishments, replacements, upgrades, and enhancements are made to legacy capacity in place before
the start of the projection and also to capacity added during the projection. Refurbishments,
replacements, upgrades, and enhancements include changes made to refineries for the purpose of
processing lighter sweeter crudes that are being developed across North America. They also include
capital expenditures related to integrity management programs for pipelines and for NOx emissions
reductions at compressor stations.
Capital expenditures reported throughout the report are in 2015$, unless otherwise stated. They do not
include operations and maintenance (O&M) costs, because O&M costs are not typically capitalized. Costs
associated with O&M could add billions of dollars to the total expenditures reported herein, and would
account for a significant number of jobs beyond the employment levels that are reported in Section 6.
1.4 Report Structure
The remainder of this report contains the following information:
Section 2 provides an overview of the modeling methodology.
Section 3 summarizes the scenarios applied in this study, presenting the trends for oil and gas
production and demand, and examining market dynamics for gas, NGL, and oil transport.
Section 4 provides the results for oil and gas infrastructure development. The section starts off
with an overview, followed by a detailed discussion that examines infrastructure development in

11
the two scenarios for each of the infrastructure categories. The section ends with a discussion
about regional development.
Section 5 provides results of the economic impact analysis to assess the jobs and GDP impacts of
infrastructure development.
Section 6 lists key findings for the study.
Appendix A discusses the ICF modeling tools applied to complete this analysis.
Appendix B provides details for infrastructure development, including all of the key statistics that
drive infrastructure investment
Appendix C provides capital expenditures by region.
Appendix D provides projected annual averages for Gross State Product and Taxes by state.

12
2 Methodology
2.1 Modeling Framework
In this study, oil and gas infrastructure development and capital expenditure requirements are
determined based on ICF’s Midstream Infrastructure Report (MIR) process, shown in Exhibit 4. ICF’s MIR
uses four proprietary modeling tools, namely ICF’s Gas Market Model (GMM), the Detailed Production
Report (DPR), a Natural Gas Liquids (NGL) Transport Model (NGLTM), and a Crude Oil Transport Model
(COTM). Detailed descriptions of these modeling tools are provided in Appendix A.
Exhibit 4: Modeling Tools for ICF’s Midstream Infrastructure Report
The GMM, a full supply-demand equilibrium model of the North American gas market, is a widely used
model that is applied to assess North American gas supply, demand, transport, and prices. It determines
natural gas prices, production, and demand by sector and region. The GMM projects gas transmission
capacity that is likely to be developed based on gas market and supply dynamics.
ICF’s DPR, a vintage production model, is used to estimate the number of oil and gas well completions and
well recoveries based on levels of gas production that are calculated in the GMM and projections of oil
and gas prices, gas-directed versus oil-directed drilling, and well productivity. Crude oil and NGLs
production projections for over 50 regions are estimated in the DPR based on assumed liquids-to-gas
ratios.

13
ICF’s NGLTM and COTM are used to evaluate NGL and crude oil transport and to estimate pipeline capacity
requirements. The models rely on regional NGL and crude oil production from the DPR, and consider
pipelines, railways, trucking routes, and marine channels as means of transporting raw (y-mix) and purity
NGLs and crude oil from production areas to refineries, export terminals, and processing and industrial
facilities that use the hydrocarbons either as a fuel or feedstock. Within the Midstream Infrastructure
Report itself, refinery enhancements and output are estimated along oil product transport and crude oil
and oil products exports.
2.2 Infrastructure Methodology and Criteria
ICF’s MIR projects natural gas, NGL, and crude oil infrastructure requirements by considering:
Regional natural gas supply-demand growth based on scenario market trends;
Well completions and production by region;
Gas processing and NGL fractionation requirements;
Changes in power plant gas use;
Regional underground and above ground natural gas storage needs;
Changes in transportation of natural gas, NGLs, and oil brought on by regional supply-demand
balances, changing market forces, and world trade of raw and refined energy products; and
Enhancement, upgrade, replacement, and refurbishment (E/U/R/R) requirements for existing oil
and gas assets.
2.2.1 Estimating the Amount of Infrastructure Development
The criteria applied to estimate new infrastructure development and the capital expenditures associated
with it are listed in Exhibit 5. Near-term infrastructure development includes projects that are currently
under construction or are sufficiently advanced in the development process. Unplanned projects are also
included in the projection when the market signals need of new capacity.
Surface and lease equipment, offshore platforms, gathering, processing, and fractionation projects are
included in the infrastructure assessment. Natural gas transport capability is added to the infrastructure
stack based on projections from the GMM. The decision to add pipeline capacity is based on supply growth
and market evolution within and across geographic areas. Projects that are currently under development
(including projects characterized as new pipeline, expansion projects, repurposing projects, and reversals
of pipelines), as well as unplanned or “generic” projects are included. If unknown for a specific project,
the project’s pipeline mileage and compression are calculated using rule-of-thumb estimates, which are
based on historical capacity expansion data along various pipeline corridors.

14
Exhibit 5: Criteria for New Infrastructure Development
Metric
Criteria
Gas gathering line miles per well (for gathering gas both from gas wells and oil wells)
Low productivity gas and oil wells use small-diameter gathering lines and are assumed to require an average of 0.35 miles/well and 0.25 miles/well, respectively. Higher productivity gas and oil wells require larger-diameter but shorter gathering pipelines. Factors are applied to adjust miles/well and diameter based on the number of wells per pad. Miles/well factors range from 1.0 for 4-well pads to 0.5 for 8-well pads. Diameter factors range from 1.0 for 4-well pads to 1.4 for 8-well pads.
Oil gathering line miles per oil well (only applies to high-productivity wells)
0.25 miles/well for 4-well pads and 0.125 miles/wells for 8-well pads.
Low-productivity non-associated gas estimated ultimate recovery (EUR) cutoff
EUR less than 0.5 billion cubic feet per well.
Low-productivity associated gas EUR cutoff
EUR less than 0.15 billion cubic feet per well.
Low-productivity oil well EUR cutoff
EUR less than 30,000 barrels/well
Number of wells per pad
An average of 4 wells per pad is assumed for 2015; the number of wells per pad is assumed to increase linearly to 8 wells per pad by 2035. Given the assumed criteria above, an increased number of wells per pad reduces total gathering line mileage, but increases line diameters.
Gas gathering line compression requirement
141 horsepower for every 1 million cubic feet per day of production.
Portion of gas production growth that requires new processing capacity
Average of 60 percent; varies by play and region.

15
Exhibit 5: Criteria for New Infrastructure Development (Continued)
Metric
Criteria
Gas processing plant size
Between 25 and 600 million cubic feet per day, yielding an average of 275 million cubic feet per day for all production; varies by play and region.
Gas laterals for processing plant
20 miles per plant.
Gas lateral diameters for processing plant
Between 10 to 30 inches estimated by considering the size of the plant.
Gas power plant capacity
If unknown, the average power plant size for combined cycle plants is assumed to be 500 Megawatts (MW). Combustion turbine capacity can range up to 500 MW.
Gas laterals for gas power plants
15 miles per power plant.
Gas lateral diameter for gas power plant
24 inches for combined cycles. Diameter for small power plants is calculated using Panhandle Equation assuming a heat rate of 8,000 Btu/kWh (to estimate gas throughput).
Gas storage capacity
5 billion cubic feet of incremental working gas capacity for every 1 billion cubic feet per day of LNG export capacity added after 2020. 1 billion cubic feet of incremental working gas capacity for every 1 Gigawatt of incremental gas-fired generating capacity added after 2020.
Compression requirements for gas storage fields
1,880 horsepower per billion cubic feet of working gas capacity for salt cavern storage. 610 horsepower per billion cubic feet of working gas capacity for depleted reservoir storage. 1,200 horsepower per billion cubic feet of working gas capacity for aquifer reservoir storage.

16
Exhibit 5: Criteria for New Infrastructure Development (Continued)
Metric
Criteria
Portion of NGL production growth that requires new fractionation capacity
Average of 85 percent, varies by play and region.
NGL Fractionation Plant Size
Between 25,000 and 500,000 barrel per day, yielding an average of 75,000 barrel per day for all production; varies by play and region.
NGL Laterals for Fractionation and Petrochemical Facilities
Between 60 and 400 miles per 100,000 barrels per day of NGLs, varies by play and region.
NGL lateral diameter
Between 10 to 16 inches, varies by play and region.
Crude oil storage tank capacity
Average of 5,000 barrels per tank.
Crude oil storage tank farm size
Average of 750 tanks per farm.
Crude oil tank farm laterals
Average 20 miles per tank farm with diameters ranging between 12 and 24 inches.
Oil product pipeline miles
Average of 1.3 miles per 1,000 barrels per day of incremental refinery output.
Oil product pipeline diameter
Average of 15 inches, varies by PADD.
Pumping requirements for crude oil and oil product pipelines
Average of 177 horsepower per mile of pipeline.

17
Oil and gas lease equipment and offshore platform requirements are calculated based on incremental
well completions and the expected oil, gas, and NGL production from the wells. This analysis does not
provide detailed measures or metrics for lease equipment such as miles of flowlines and connections,
number of dehydrators, storage tanks, disposal systems, separators, etc. Expenditures for incremental
lease equipment, as discussed in Section 4, are directly proportional to the number of well completions.
Incremental capacity for offshore platforms is estimated for incremental oil, gas, and NGL production as
a barrel of oil equivalent (BOE) rate based on new offshore well completions.
The mileage for gas gathering lines is computed by considering incremental gas production, the number
of well completions, estimated ultimate recovery (EUR) per well, well spacing, and number of wells in
multi-well pad configurations. The core calculations assume a certain amount of gathering line mileage
per well. Compression requirements for gas gathering lines are estimated based on production levels and
by assuming a pre-defined horsepower-to-production ratio, estimated from historical data.
Gas processing plant capacity is computed by assuming that a portion of the production growth requires
new processing capacity. The number of processing plants that are needed is estimated based on the total
incremental processing capacity that is required and assuming an average plant size for each geographic
area. Pipeline lateral requirements for connecting processing plants with pipeline mainlines are calculated
based on the number of new plants that are required, with an assumed mileage for each lateral. The
diameter of the laterals is estimated based on the size of the gas processing plants in a geographic area.
The number of unplanned gas-fired power plants is derived by considering the growth of gas-fired power
generation. The total incremental gas power plant capacity is applied to estimate the number of new gas
power plants that will be built in each geographic area, based on assumed plant sizes. The required lateral
pipeline mileage is then calculated using an assumed mileage per plant. The diameter for the laterals is
estimated based on the required throughput for each plant, calculated based on each plant’s heat rate.
Gas storage is added in response to LNG and power plant additions. Lateral mileage, sizing, and
compression needs to connect gas storage are based on the amount of storage capacity added.
NGL pipeline capacity is based on supply development, North American market growth, and export
activity. Announced NGL pipeline projects that are under construction or deemed far enough along in the
development process to be completed are included in infrastructure tallies. NGL raw-mix pipelines and
pipelines built to transport a single liquid (for example, ethane or propane) or a mix of condensate
products (for example, pentanes-plus) to be used as a diluent for oil transport are included.
New NGL pipeline projects are included to support future supply development and market growth. NGLs
produced in relatively constrained areas require new pipelines to foster transport of the liquids to market
areas or export facilities. If unknown, pipeline mileage for new capacity is estimated based on the distance
between geographic areas, and the size of the pipeline and pumping requirements are estimated based
on expected throughput.
NGL lateral mileage from gas processing and fractionation facilities to a NGL transmission line is calculated
based on the amount of NGLs that are processed (i.e., removed from the gas stream). Lateral mileage and

18
the diameter for each lateral are estimated based on an assumed number of miles per volume of NGLs
processed and is based on an average processing-fractionation plant size.
Incremental NGL fractionation capacity is estimated based on NGL supply development and market
growth. NGL export capacity is scenario-dependent, based on supply development and market activity.
Oil gathering line connections are required only for high-productivity oil wells. Wells with low productivity
do not require gathering lines, as oil production is handled with local tank storage and field trucking. A
“cutoff” for estimated ultimate recovery (EUR) per well is assumed to separate high and low productivity
wells. Oil gathering line mileage is then derived based on the number of wells per drill site, assuming that
an average mileage of gathering line is needed for each high-productivity well.
The need for crude oil transmission capacity is based on supply development and import/export activity.
The study considers rail and trucking of oil as transport options. Announced pipeline projects have been
included in the pipeline stack. If unknown for a project, pipeline mileage is estimated based on the
distance between the relevant geographic areas for each project. The sizing of a pipeline and pumping
requirements are estimated based on throughput.
Crude oil storage is added based on oil production growth within geographic areas. The number of crude
oil tanks is computed based on the required storage capacity for fields, assuming an average tank size.
The required number of tank farms is computed based on an average number of storage tanks per tank
farm. The lateral mileage for oil storage capacity is estimated by assuming that so many miles of lateral
are needed per tank farm.
As mentioned above, this study accounts for crude oil transport by rails. Thus, planned rail cars and loading
and unloading terminal capacity additions are included in the infrastructure stack. However, the study
does not include unplanned rail car and terminal loading/unloading capacity, as incremental pipeline
capacity is considered to be a more cost-effective option for unplanned capacity, especially when the
capacity requirement is significant.
Planned crude oil refinery capacity additions and enhancements are included and reported in the
Enhancements, Upgrades, Replacements, and Refurbishments category discussed below. We include
changes to refineries only in this category because it is difficult to distinguish between “new” capacity and
enhancements and upgrades to existing capacity. In addition, the analysis considers refurbishments and
replacements to capacity along with the upgrades and enhancements.
The need for crude product pipeline is based on growth in refinery output. Refinery output has been
estimated considering supply changes and market growth. New crude product pipeline miles are
calculated based on the miles needed per unit volume growth of refinery output as calculated from
historical data. The diameter of the pipeline is assumed based on the average diameter for existing
pipelines. Pumping requirements are estimated based on historical horsepower per mile of pipeline
statistics.

19
Enhancements, upgrades, replacements, and refurbishments (E/U/R/R) of existing infrastructure are
estimated based on an annual percent that has been derived from historical replacement information and
expert judgement. Effectively, the measures have been calculated by applying an estimated lifespan for
different types of infrastructure. For example, gathering line compressors have historically had a lifespan
of roughly 20 years. So, the assigned E/U/R/R percent for gathering line compressor is 5.00 (i.e., 1 divided
by 20 years). That means that each year, 5.00 percent of the installed gathering line compressors will
require E/U/R/R. All of the E/U/R/R criteria for existing infrastructure are summarized in Exhibit 6.
Exhibit 6: Enhancements, Upgrades, Replacements, and Refurbishments (E/U/R/R) Criteria
Infrastructure Type
Annual
E/U/R/R (%)
Installed
Units as of 2015
Gathering Line Pipe (Miles) 1.76% 432,000
Gathering Line Compressor (1000 Horsepower) 5.00% 11,400
Lease Equipment (Book Value of Installed Equipment, million$) 2.86% $101,400
Oil, Gas, and NGL Pipeline (Miles) 0.07% 501,354 /1
Gas Pipeline Compressor (1000 Horsepower) 1.25% 20,600
Oil and NGL Pump (1000 Horsepower) 1.25% 5,200
Gas Processing Plant Capacity (billion cubic feet per day) 2.86% 95
NGL Fractionation Capacity (thousand barrel oil equivalent per day) 2.86% 2,800
Underground Gas Storage (billion cubic feet of working gas capacity) 1.02% 3,900
Crude Oil Storage (thousand barrel) 2.86% 560,000
Crude Oil Refining Capacity (thousand barrel per day) 4.22% 18,058
1. Does not include CO2 pipelines.

20
2.2.2 Estimating Capital Requirements for Oil and Gas Infrastructure Development
Unit cost measures that have been derived for each type of infrastructure by using historical expenditure
information provided by various sources are applied to estimate total expenditures for new oil and gas
infrastructure development. Unless otherwise specified, the same unit cost measures are also applied to
estimate total E/U/R/R expenditures.
Pipeline cost assumptions have been derived by considering data from Oil and Gas Journal (OGJ) surveys
of pipeline projects. Using the OGJ data, we have completed a regression analysis of data across years to
determine an average U.S. pipeline cost of $178,000 per inch-mile for 2016 (in nominal dollars) for large
gas transmission pipelines. The data for future years is extrapolated from that level based on the
regression. Regional cost multipliers have also been derived from OGJ data, and are shown in Exhibit 7.
Cost multipliers are very different across regions; for example, costs are relatively high in the Northeast
where projects have been very difficult and time consuming to construct, but much lower in the
Southwest which has generally been a much more friendly area for infrastructure development.
Exhibit 7: Regional Cost Multipliers for Pipeline Development
Region Regional Cost Multipliers
Central 0.65
Midwest 1.20
Northeast 1.68
Offshore 1.00
Southeast 0.80
Southwest 0.74
Western 0.94
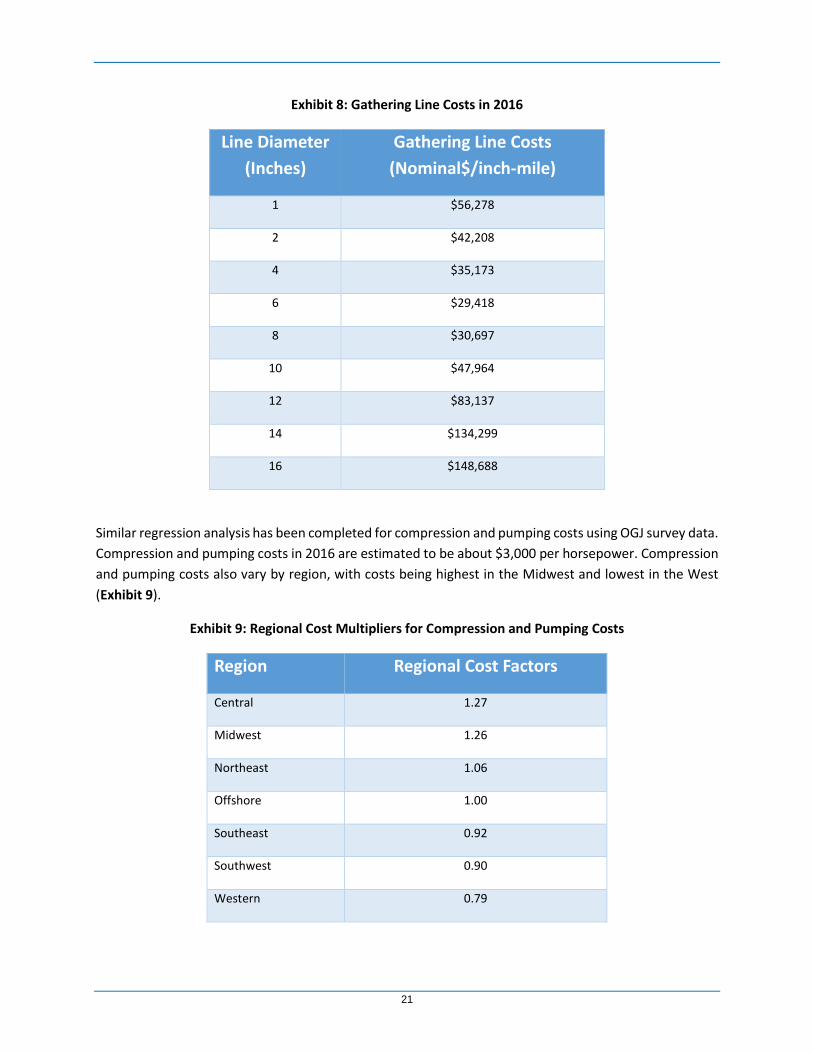
Smaller-diameter pipes used in gathering systems have lower unit costs that vary by diameter. As shown
in Exhibit 8, gathering line costs (which have also been derived from OGJ survey results) for pipes between
one and sixteen inches in diameter range from $56,000 to $149,000 per inch-mile in 2016, well below the
average inch-mile cost of the larger-diameter transmission pipelines discussed above. The same regional
cost factors discussed above apply as well to gathering projects.
21
Exhibit 8: Gathering Line Costs in 2016
Line Diameter
(Inches)
Gathering Line Costs
(Nominal$/inch-mile)
1 $56,278
2 $42,208
4 $35,173
6 $29,418
8 $30,697
10 $47,964
12 $83,137
14 $134,299
16 $148,688
Similar regression analysis has been completed for compression and pumping costs using OGJ survey data.
Compression and pumping costs in 2016 are estimated to be about $3,000 per horsepower. Compression
and pumping costs also vary by region, with costs being highest in the Midwest and lowest in the West
(Exhibit 9).
Exhibit 9: Regional Cost Multipliers for Compression and Pumping Costs
Region Regional Cost Factors
Central 1.27
Midwest 1.26
Northeast 1.06
Offshore 1.00
Southeast 0.92
Southwest 0.90
Western 0.79

22
Lease equipment costs have been estimated from EIA Oil and Gas Lease Equipment and Operating Cost
data, and the cost is adjusted to current levels based on Producer Price Index Industry Data from the
Bureau of Labor Statistics. The costs average $87,000 per gas well and $210,000 per oil well. Oil and gas
offshore platform costs are based on historical expenditure information provided by various sources.
Average platform costs of $21,000 per barrel of oil equivalent are applied for offshore development.
Gas storage field costs are shown in Exhibit 10. Costs vary depending on the type of underground storage
field (i.e., salt cavern, depleted reservoir, or aquifer storage) with an average of $32 million per billion
cubic feet of working gas capacity applied for new projects and $27 million per billion cubic feet of working
gas capacity applied for expansion projects. E/U/R/R requirements for gas storage are assumed to have a
cost of 18 million per billion cubic feet of installed working gas capacity.
Exhibit 10: Natural Gas Storage Costs in 2016 (Million$ per Billion Cubic Feet of Working Gas Capacity)
Field Type Expansion New
Salt Cavern $27.8 $33.0
Depleted Reservoir $16.4 $18.8
Aquifer $31.8 $38.9
Other unit costs for remaining types of assets as estimated from various sources are as follows:
Gas processing costs (not including compression) in 2016 are about $638,000 per million cubic
feet per day of processed capacity. Compression requirements for gas processing plants are 100
horsepower per million cubic feet per day of capacity, and the costs associated with it are added
to the cost of capacity directly above.
Costs for NGL fractionation facilities average about $6,500 per barrel of oil equivalent (BOE) per
day of processed NGLs.
Costs for NGL export facilities are purity dependent, averaging about $6,150 per barrel of oil
equivalent (BOE) per day of ethane, about $5,000 per BOE per day for propane and butane.
Costs of LNG export facilities, as identified in U.S. Department of Energy export applications and
other publicly available sources, average $4 billion to $5 billion per billion cubic feet per day of
export capacity.
The unit cost for crude oil storage tanks is assumed to be about $15 per barrel of oil.
The unit cost for crude oil refining capacity expansion is about $12,000 per barrel of oil equivalent
(BOE) per day.

23
3 Scenario Overview
3.1 Defining the Study’s Scenarios
Oil and gas markets are facing a great deal of uncertainty with relatively low commodity prices currently
hampering supply development. In late 2015, crude oil prices declined precipitously, mainly due to a
supply glut brought about by reduced growth in global markets. According to the U.S. DOE EIA, crude oil
production in the U.S. increased significantly into 2015, with production peaking at over 9 million barrels
per day earlier in the year. The increase came almost entirely from development of tight oil and shale
plays. The growth reduced crude oil imports to the U.S. and contributed to a significant supply overhang
in global markets, adding to record inventory levels for crude oil.
At the same time, natural gas and NGL prices declined in response to robust gas supply growth occurring
from shale resources. The mild winter of 2015-16 created a natural gas storage overhang in the U.S. that
further reduced prices, and natural gas at Henry Hub fell to under $2 per MMBtu by March 2016.
The low commodity price environment has slowed E&P activity and arrested the robust supply increases
that had been occurring before 2016. The slowing supply growth has brought about reduced
infrastructure development, creating a cloud of uncertainty for future growth of oil and gas infrastructure.
But, while the scale of uncertainty that currently exists is significant, the environment remains positive
for oil and gas development in the longer term.
There are a number of factors still at work to increase supply and motivate infrastructure development.
Notably, the shale and tight oil and gas resource base across North America is large and there is still a vast
amount of relatively low cost oil and gas remaining to be developed. The application of technology is
continuing to reduce drilling costs and enhance well productivity. Thus, the unit cost of oil and gas
production is continuing to decline.
In addition to the productivity gains and cost reductions that have been occurring, markets appear to be
poised for growth. Indeed, refinery input and output has been increasing during the past few years as
North American oil production is creating a renewed interest in investments in refineries to increase
product output. Natural gas exports are on the cusp of growing significantly, both to Mexico and to
markets around the globe where $3 per MMBtu Henry Hub gas is attractive. Further, low gas prices have
fostered growth for gas-fired power generation as coal plants continue to retire across the U.S. This trend
seems irreversible in light of regulations that encourage clean power. However, it is worth noting that
while the scenarios include currently enacted environmental regulations and regional efforts to control
carbon emissions, they do not include any federal programs aimed at carbon emissions, such as the Clean
Power Plan. Nevertheless, the relatively low gas price environment generally discourages additional
investment to upgrade and/or further limit emissions from coal plants, especially considering that a threat
for federal carbon control still looms on the horizon. Petrochemical facilities appear to be poised for a
resurgence with the relatively low natural gas and NGL prices that have been brought about by the robust

24
supply development. Thus, a number of markets appear to be poised for growth, which would foster a
renewed interest in supply development.
Considering these factors, this study includes two cases, a Base Case and a High Case that project different
amounts of growth for supply and markets. The Base Case, which represents a “Status Quo” scenario,
shows increasing oil and gas supply due to continued productivity improvements for supply and to satisfy
market growth that comes from the power sector, export activity, and petrochemical facilities. The supply
growth that occurs in the case, in turn, fosters a renewed interest in development of oil and gas
infrastructure. The case includes a robust natural gas resource base and growth across a number of
markets (Exhibit 11). The E&P technology assumptions in the case are consistent with recent
advancements in technology and drilling costs remain constant in real terms. In addition, there is growth
in the amount of resource that is recoverable over time, with the concept of resource appreciation
included in the case. Thus, the unit costs of production are generally declining in the future, consistent
with recent trends.
As alluded to above, the Base Case includes growth across a number of different markets. Most notably,
refinery input continues to increase, albeit relatively modestly, and continued development of tight oil
supplies here in the U.S. and incremental imports from Canada modestly reduce near-term imports of
crude from overseas, consistent with recent trends. Natural gas markets grow fairly robustly as there is
additional gas use in petrochemical facilities and in the power sector where coal plants continue to retire
and some nuclear plants are retired at the end of their 60-year life. LNG and Mexican exports of natural
gas also rise fairly significantly over time, consistent with recent trends. For NGL, both domestic ethylene
and polypropylene production increase along with exports. The market growth projected in the scenario
is sustained by supply development that occurs at reasonable prices. In the case, oil prices approach $75
by 2025 while Henry Hub price averages a little over $4 per MMBtu over through 2035.
The High Case is provided to depict an increased growth environment for oil and gas supply and markets
to assess the full potential for oil and gas infrastructure development. The case is developed by assuming
a larger recoverable resource base for oil and gas and more robust improvements in technology that drive
productivity gains above those in the Base Case. The scenario has been developed by using the Base Case
as a starting point and assuming that changes brought about between the U.S. DOE EIA Annual Energy
Outlook (AEO) reference case and high resource and technology case occur.
The case generally assumes a resource base that is 40 to 55 percent larger and well productivity that
improves at a much faster pace. Admittedly, technology improvements and the amount of recoverable
resource are among the most difficult factors to predict, so it is reasonable to assume that these drivers
of growth could be more robust in light of improvements in productivity and recoverable resource that
have recently occurred.
In the High Case, lower gas and NGL prices that are brought about because of the increased productivity
of wells. Thus, the case projects substantially greater market growth across a number of markets. Most
notably, refinery input in the case increases relatively significantly as robust increases in domestic
production back out crude imports. Thus, oil product movement also increases as a result of the growth

25
in refinery output. Natural gas markets are noticeably larger, with increases across the board for
petrochemical and power plant gas use and LNG and Mexican exports. LNG and Mexican exports rise
significantly to an average of 21 billion cubic feet per day after 2020. NGL markets also continue to grow
at a robust pace, with ethylene and polypropylene production rising along with NGL exports.
Exhibit 11: Scenario Assumptions and Trends
Category Base Case High Case
Macroeconomics U.S. Gross Domestic Product (GDP) grows
at 2.1 percent per year
Same
U.S. Industrial Production grows at 1.8
percent per year
U.S. industrial output up to 2.0 percent
per year
Global economic activity rebounds to pre-
2015 growth rates
Same
Oil and Gas Supply U.S. Recoverable oil resource at 250 billion
barrels and recoverable gas resource at
3,600 trillion cubic feet
Oil resource base increased by 55
percent and gas resource base increased
by 40 percent
Recoverable resource appreciates by 0.9
percent per year
Recoverable resource appreciation up by
20 percent over Base Case
Oil and gas drilling costs constant in real
terms
Drilling costs are reduced by roughly 35
percent
Average well productivity improves by
roughly 20 percent every 7 years
Time for improvement reduced by
roughly 30 percent
U.S. Oil Market
Dynamics
WTI rises from current level to $75 per
barrel (2015$) by 2025
Same
Canadian imports rise to 4.1 million barrel
per day (MMBpd) after Keystone Pipeline is
completed
Canadian imports increase more robustly
to 4.4 MMBpd
Other crude imports decline to 3.5 MMBpd
after 2020 and then rise back to 4.7
MMBpd by 2035
Other crude imports decline to 1.8
MMBpd by 2035
Refinery input grows from 16.4 MMBpd in
2015 to 17 MMBpd by 2035
Refinery input grows by another 1.8
MMBpd over the Base Case
Oil products transport up with refinery
output
Same

26
Exhibit 11: Scenario Assumptions and Trends (Continued)
Category Base Case High Case
U.S. Natural Gas
Market Dynamics
Henry Hub prices average about $4.30 per
MMBtu (2015$)
Henry Hub prices down by roughly 15
percent versus the Base Case
Modest growth in households and
commercial establishments using gas,
mostly due to oil-to-gas conversions
Same
Petrochemical gas use up by 1.9 billion
cubic feet per day (Bcfd) over current level
by 2035
Petrochemical gas use up roughly 30
percent over Base Case levels
Electric load growth averages 0.95 percent
per year
Electric load growth averages 1.01
percent per year
108 Gigawatts (GW) of coal plants retire by
2035
132 GW of coal plants retire by 2035
28 GW of nuclear plants retire by 2035 30 GW of nuclear plants retire by 2035
85 GW of renewables capacity added by
2035
Only 70 GW of capacity added, due to
reduced gas prices
Modest penetration of gas vehicles
amounts to 0.2 billion cubic feet per year of
consumption post-2020
Same
LNG exports and exports to Mexico average
15.8 Bcfd after 2020
LNG exports and exports to Mexico
average 21.0 Bcfd after 2020
U.S. NGL Market
Dynamics
NGL prices track oil and gas prices Same, but price levels are lower due to
reduced gas prices
0.4 MMBpd of ethylene production (i.e,
ethane crackers) added through 2035
Up over base case level by 0.3 MMBpd
0.2 MMBpd of polypropylene production
added through 2035
Up over base case level by 0.1 MBpd
Butane & Pentane+ consumption grows by
0.6 MMBpd through 2035
Up over base case level by 0.2 MMBpd
NGL exports average 1.8 MMBpd after
2020
NGL exports average 2.5 MMBpd after
2020

27
3.2 Comparison of Supply, Demand, and Pipeline Capacity in the Scenarios
As mentioned above, this study’s cases show very different results for supply, demand, and transport of
hydrocarbons. This section further examines those trends, comparing and contrasting results for each
case.
3.2.1 Projected Oil, Gas, and NGL Production
Each of the study’s cases show noticeable increases in production from shale and tight resources.
However, the amount of growth is very different between the two cases due to the assumptions that have
been made regarding resource base and technology improvements.
For oil, the Base Case shows a modest decline in total crude oil production for the U.S. over the course of
the projection (Exhibit 12). In the case, increases in shale and tight oil production are more than offset
by declines in conventional onshore production. So, the total production falls from its current value of
roughly 9 million barrels per day to nearly 8 million barrels per day by 2035. The implication of these
production trends is that new pipeline transport and oil handling capability will be selectively needed in
areas where transport needs are growing. Further, most of the pipeline capacity needed to serve those
areas is already under construction and scheduled to be completed during the next year.
Perhaps the more striking result is the difference between the cases. By 2035, the High Case shows a
production increase of roughly 4 million barrels per day versus the Base Case, with its crude oil production
rising to over 12 million barrels per day by 2035. This difference is driven by the more robust resource
base assumed in the High Case. Essentially, the amount of oil resource applied in the Base Case is
insufficient to offset the impact of resource depletion over time, whereas the resource in the High Case is
large enough to offset resource depletion, fostering incremental growth in total oil production. The High
Case effectively provides a more robust environment for development of new oil transport and oil
handling capabilities.
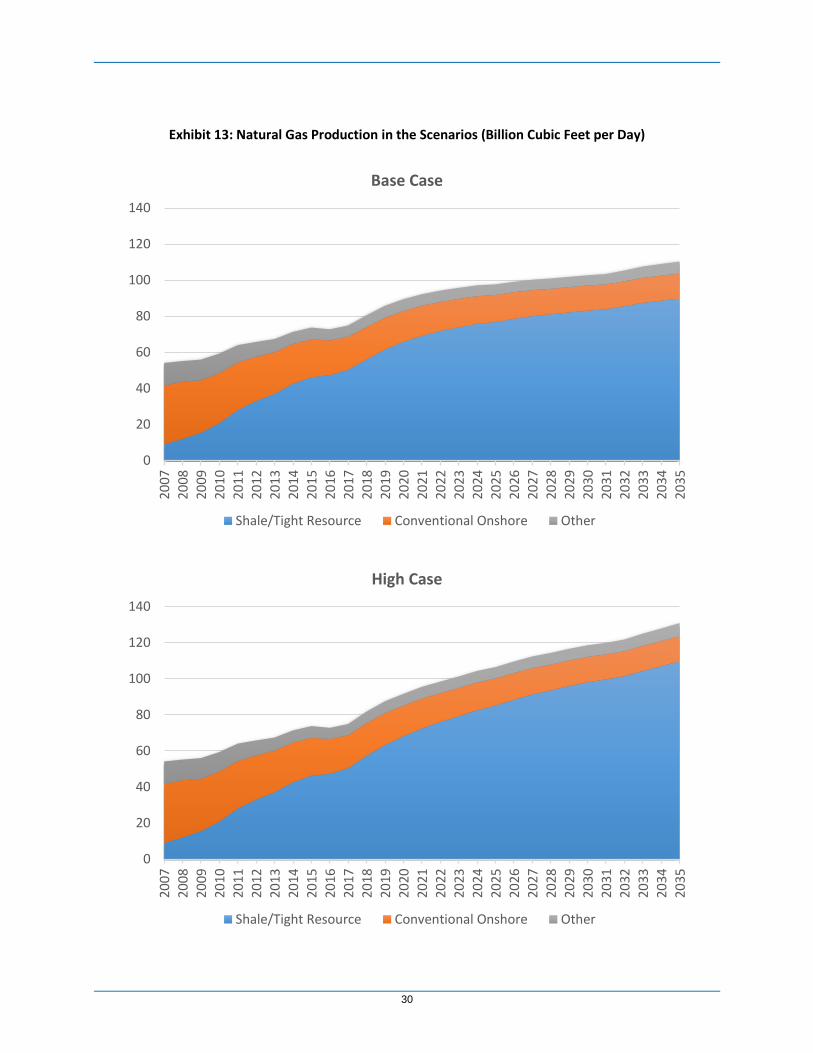
For natural gas, the picture is somewhat different, with each of the cases showing significant growth in
total gas production over time (Exhibit 13). That’s because market growth drives production increases in
each of the scenarios. However, market growth is very different for each case because the cost of supply
and prices are different. In the High Case, the increased resource base and accelerated technological
advancement yields lower gas prices, and thus, greater market growth. So, the High Case shows
production growing to 131 billion cubic feet per day while the Base Case shows production growing to
only 110 billion cubic feet per day by 2035. It is also interesting to note that the production growth in the
High Case is more consistent with recent history. That is to say that the production follows a more linear
path in the future, consistent with the historical trend. In the Base Case, market growth slows over time,
yielding reduced growth in consumption and a slowing trend for production in the longer term.

28
For each case, natural gas production growth is concentrated in shale and tight formations. As is the case
for oil, the productivity gains in shale resources will continue to increase production from shale plays,
while conventional onshore and other production that includes coalbed methane and offshore Gulf of
Mexico gas supplies declines. Because shale plays are geographically widespread, production growth and
the need for new infrastructure will be geographically widespread – a natural gas capacity chart shown
later in this section will illuminate this point. However, as discussed later, because the cost of production
is relatively low in the Marcellus/Utica compared to production costs elsewhere, a significant portion of
the growth in production and new infrastructure will be concentrated in the Northeast U.S.
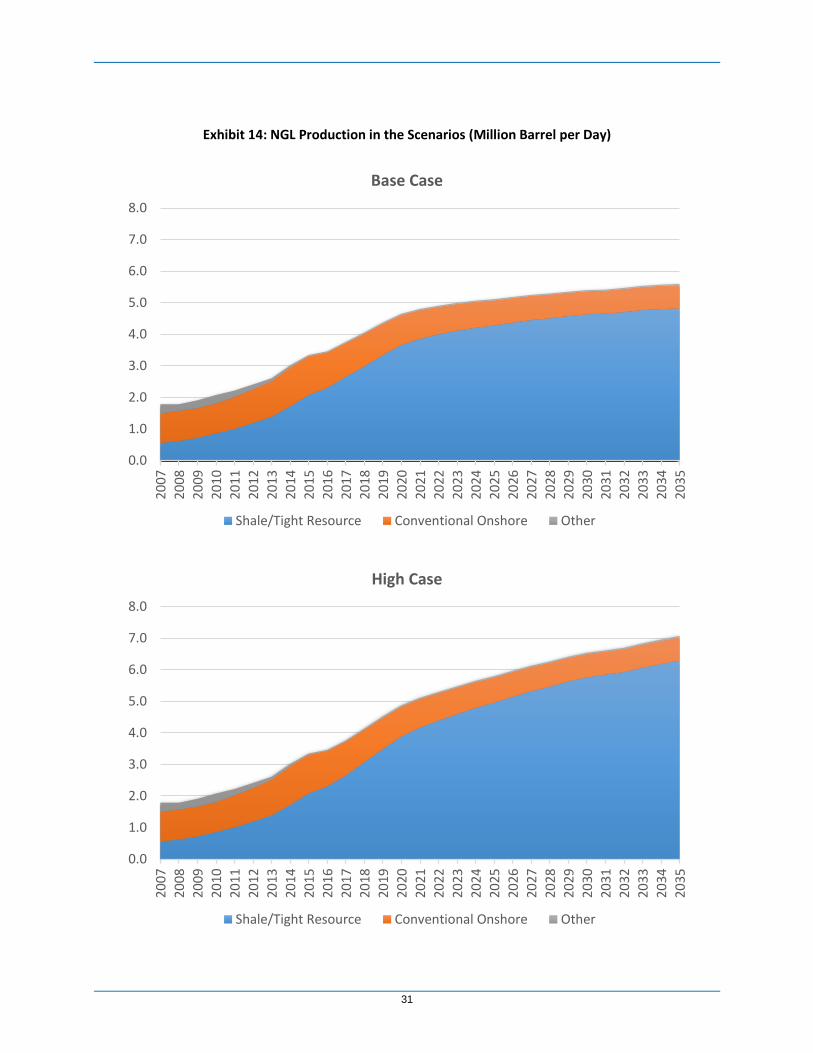
For natural gas liquids (NGLs), production growth is also very significant for each of the scenarios
(Exhibit 14). This is because NGLs track natural gas production over time; that occurs because NGLs are
a by-product of the gas production stream. Thus, Base Case NGL production grows by a little over 2
million barrels per day while High Case NGL production grows by roughly 3.5 million barrels per day
through 2035. As is the case for natural gas, NGL production growth is concentrated in unconventional
(i.e., shale) resources.
It is worth noting that it will be important for natural gas liquids markets to grow to “absorb” the levels
of production that are projected in the scenarios. Absent market growth, liquids could be stranded,
potentially becoming a deterrent to natural gas market development. Further elaboration on this point
is required since it is not necessarily an intuitive finding.
A significant portion of the NGL production increase will be comprised of ethane, with 60 to 70 percent
of the NGL stream containing that hydrocarbon. Ethane, of course, could be retained in the gas stream
and not separately extracted from the stream or produced. When ethane is retained in the stream and
not separately produced, it is referred to as “ethane rejection”. While ethane can be rejected into the
gas stream and placed into a natural gas pipeline, there are limits as to the amount of ethane that could
be transported on most natural gas pipelines in the U.S. The limits relate to the heat content of the gas
stream. As greater amounts of ethane are rejected into the gas stream, which is largely comprised of
methane, the heat content for the entire stream rises and may potentially exceed pipeline limits. At
that point, the stream is not suitable for gas pipeline transport, and would need to find another option
to be transported to markets. In short, it is important for NGL markets to evolve so that ethane
rejection doesn’t become the proverbial “tail wagging the dog” as far as gas production is concerned.
Further, it is also uncommon for gas pipelines to transport propane or butane as the heat content of
those hydrocarbons is too high to be absorbed into the stream. So, at a minimum, much if not all of the
propane and butane would need to be separated from the gas stream. With the levels of NGL
production exhibited in the scenarios, lack of markets for the liquids could very well place strain on gas
transport. To avoid such a problem, development of ethane crackers, polypropylene facilities, and NGL
export terminals is a necessity. Such market development would likely be concentrated along the Gulf
Coast, making development of incremental transport of liquids-laden streams via pipeline and/or rail a
necessity – this point will be discussed in greater detail below.

29
Exhibit 12: Crude Oil Production in the Scenarios (Million Barrel per Day)
0.0
2.0
4.0
6.0
8.0
10.0
12.0
14.0
2007
2008
2009
2010
2011
2012
2013
2014
2015
2016
2017
2018
2019
2020
2021
2022
202
320
2420
2520
2620
2720
2820
2920
3020
3120
3220
3320
3420
35
Base Case
Shale/Tight Resource Conventional Onshore Other
0.0
2.0
4.0
6.0
8.0
10.0
12.0
14.0
2007
2008
2009
2010
2011
2012
2013
2014
2015
2016
2017
2018
2019
2020
2021
2022
202
320
2420
2520
2620
2720
2820
2920
3020
3120
3220
3320
3420
35
High Case
Shale/Tight Resource Conventional Onshore Other
30
Exhibit 13: Natural Gas Production in the Scenarios (Billion Cubic Feet per Day)
0
20
40
60
80
100
120
140
2007
2008
2009
2010
2011
2012
2013
2014
2015
2016
2017
201
8
2019
2020
2021
2022
2023
2024
2025
2026
202
7
2028
2029
2030
2031
2032
2033
2034
2035
Base Case
Shale/Tight Resource Conventional Onshore Other
0
20
40
60
80
100
120
140
2007
2008
2009
2010
2011
2012
2013
2014
2015
2016
2017
201
8
2019
2020
2021
2022
2023
2024
2025
2026
202
7
2028
2029
2030
2031
2032
2033
2034
2035
High Case
Shale/Tight Resource Conventional Onshore Other
31
Exhibit 14: NGL Production in the Scenarios (Million Barrel per Day)
0.0
1.0
2.0
3.0
4.0
5.0
6.0
7.0
8.0
2007
2008
2009
2010
2011
2012
2013
2014
2015
201
6
2017
2018
2019
2020
2021
2022
2023
2024
2025
2026
2027
2028
2029
2030
2031
203
2
203
3
2034
2035
Base Case
Shale/Tight Resource Conventional Onshore Other
0.0
1.0
2.0
3.0
4.0
5.0
6.0
7.0
8.0
2007
2008
2009
2010
2011
2012
2013
2014
2015
201
6
2017
2018
2019
2020
2021
2022
2023
2024
2025
2026
2027
2028
2029
2030
2031
203
2
203
3
2034
2035
High Case
Shale/Tight Resource Conventional Onshore Other

32
3.2.2 Projected Markets for Oil, Gas, and NGLs
Each of the study’s cases show significant market growth driven by a variety of factors. This sub-section
discusses projected market growth and its primary drivers.
To begin with oil, we project that U.S. refinery output will increase as production from tight oil supplies
increases and as imports of heavy crude from Western Canada grow. Exhibit 15 shows refinery crude oil
input increase from their current level of just over 16 million barrels per day to between 17 and 19 million
barrels per day for the Base Case and High Case, respectively. This increased refinery input and output
would be made possible by upgrades and refurbishments.
The two cases project a very different composition for oil supplies to refineries. In the Base Case, much
of the incremental supply to support an increasing utilization of U.S. refineries comes from Western
Canada. While it is true that Canadian imports could increase by roughly 1 million barrels per day with
projects like Keystone XL, the exhibit doesn’t necessarily tell the full story. That is, the oil stream from the
U.S. is becoming more highly comprised of light sweet crudes over time. So, in the future, increasing
supplies of Canadian heavy oil are being blended with an increasing amount of lighter crudes from the
U.S. in the U.S. refineries
Not only do the increased supplies of Canadian oil and the lighter sweeter crudes increase refinery input
over time, but they also displace crude oil imports from other countries. While this is a trend that has
already been underway, it has the potential to accelerate as shown in the High Case. In that case, the
increase of domestic crude oil production along with the incremental imports of heavy crude oil from
Western Canada potentially cuts crude oil imports from other countries in half over time. Increasing
refinery input would increase oil product output, products that can be exported elsewhere, yielding an
even greater boost to the U.S. economy.
For natural gas, each of the scenarios project very significant market growth, with Base Case gas use
approaching 105 billion cubic feet per day while the High Case closes on 125 billion cubic feet per day by
2035 (Exhibit 16). These are dramatic increases over the current level of consumption in the U.S. that
averages about 72 billion cubic feet per day over the course of a year.
The growth in natural gas use comes from a couple different areas. Perhaps the most noticeable growth
comes from LNG exports, which grow to between 10 and 19 billion cubic feet per day in the Base Case
and High Case, respectively. These levels of LNG export are supported by 15 to 30 trains of liquefaction
capacity, almost entirely located along the U.S. Gulf Coast. A significant amount of liquefaction capacity
is already under construction and scheduled to come online over the next few years. Whether or not the
continued growth of LNG toward levels observed in the High Case will actually come about will be mostly
a function of U.S. gas prices and global market growth for LNG, particularly from Asian buyers. The larger
resource base and more robust advancement of E&P technologies in the High Case yields lower gas prices
which fosters the increased LNG exports in the scenario.

33
The second-most noticeable area of growth for gas use comes from the power sector, where incremental
gas use grows by between 12 and 25 billion cubic feet per day in the Base and High Case, respectively.
While this seems like pretty dramatic growth, there are a few different factors driving the result. First,
and following recent trends, there is likely to be a significant amount of coal power plant capacity retired
in the future. There are a number of environmental regulations that make coal power capacity more
expensive to operate than gas capacity. Further, the efficiency of the existing coal fleet is generally much
less than the efficiency of the gas fleet, with the average heat rate of the units being much greater. In
addition, the threat of carbon regulation, while reduced with the Trump administration, still looms on the
horizon. All of these factors, combined with relatively low gas prices do not necessarily bode well for coal
generation. Thus, in addition to the coal capacity already retired to date, the Base Case and High case
retire an additional 108 to 132 Gigawatts of coal capacity, respectively. Much of this retired capacity will
move over to gas and renewables generation.
In addition to coal plant retirements, two other factors behind the increase in gas generation are electric
load growth and nuclear plant retirements. The scenarios each assume significant electric load growth
consistent with ISO projections. They also include a number of plant retirements after a number of older
nuclear plants reach an age of 60 years. Each of these increase the amount of generation that gas and
renewables must provide as the coal plants continue to retire.
The final two growth components for natural gas consumption are exports to Mexico and petrochemical
gas use. In the Base Case and High Case, exports to Mexico rise by roughly 3 billion cubic feet per day, a
result driven by replacement of Mexico’s oil generating facilities with gas generating facilities.
Petrochemical gas use grows by between 1 and 2 billion cubic feet per day to round out total growth in
gas use during the projection period. Most of the increase occurs at refineries, ammonia (fertilizer) plants,
and for methanol production.
Finally, the natural gas liquids (NGL) market is set for robust growth in the future. As mentioned above,
NGLs are a by-product of natural gas production. So, with the robust growth of gas production depicted
in each of the scenarios, it will become important for NGL markets to evolve to “absorb” the liquids that
will come from the gas stream. Thus, the Base Case and High case project between 2.2 and 3.5 million
barrel per day of market growth, respectively (Exhibit 17).
The biggest growth component for NGLs is exports, which grow to between 2.0 and 2.8 million barrel per
day in the scenarios. While not shown, the largest increases for exports occur for propane, a large portion
of which is exported to Asia to support polypropylene production. The second largest growth component
is for ethane, which is used in ethane crackers domestically to produce ethylene. More modest growth
occurs for butane and pentanes+ which are used mostly in refineries.

34
Exhibit 15: U.S. Refinery Input (Million Barrel per Day)
0
2
4
6
8
10
12
14
16
18
20
2010
2011
2012
2013
2014
2015
2016
2017
2018
2019
2020
2021
2022
2023
2024
202
5
2026
2027
2028
2029
2030
2031
2032
2033
2034
2035
Base Case
Domestic Production Canadian Imports Other Net Imports
0
2
4
6
8
10
12
14
16
18
20
2010
2011
2012
2013
2014
2015
2016
2017
2018
2019
2020
2021
2022
2023
2024
202
5
2026
2027
2028
2029
2030
2031
2032
2033
2034
2035
High Case
Domestic Production Canadian Imports Other Net Imports

35
Exhibit 16: Natural Gas Market Growth (Billion Cubic Feet per Day)
(10)
10
30
50
70
90
110
130
150
20
15
20
16
20
17
20
18
20
19
20
20
20
21
20
22
20
23
20
24
20
25
20
26
20
27
20
28
20
29
20
30
20
31
20
32
20
33
20
34
20
35
Net PipelineExports toMexico
LNG Exports
PowerGeneration
Industrial
Commercial
Residential
(10)
10
30
50
70
90
110
130
150
20
15
20
16
20
17
20
18
20
19
20
20
20
21
20
22
20
23
20
24
20
25
20
26
20
27
20
28
20
29
20
30
20
31
20
32
20
33
20
34
20
35
Net PipelineExports toMexico
LNG Exports
PowerGeneration
Industrial
Commercial
Residential
Base Case
High Case

36
Exhibit 17: Natural Gas Liquids Market Growth (Billion Cubic Feet per Day)
0.0
1.0
2.0
3.0
4.0
5.0
6.0
7.0
8.0
2011
201
2
2013
2014
2015
2016
2017
2018
201
9
2020
2021
2022
2023
202
4
2025
2026
2027
2028
2029
2030
2031
2032
2033
2034
2035
Base Case
Ethane Cracker Consumption Polypropylene Facility Consumption*
Net Exports Domestic Butane & Pentane+
*Includes domestic propane demand
0.0
1.0
2.0
3.0
4.0
5.0
6.0
7.0
8.0
2011
201
2
2013
2014
2015
2016
2017
2018
201
9
2020
2021
2022
2023
202
4
2025
2026
2027
2028
2029
2030
2031
2032
2033
2034
2035
High Case
Ethane Cracker Consumption Polypropylene Facility Consumption*
Net Exports Domestic Butane & Pentane+
*Includes domestic propane demand

37
3.2.3 Projected Transport of Oil, Gas, and NGLs
Considering the production and market dynamics discussed above, we have used the modeling framework
discussed in Section 2 to assess the amount of pipeline capacity needed to support transport of oil, gas,
and NGL. This sub-section discusses results of that analysis.
To begin with oil, we find that 3.0 million barrels per day of new capacity will be added in the Base Case,
while 5.0 million barrels per day will be needed in the High Case (Exhibit 18). Much of the new transport
capability for each of the cases, or 2.2 million barrels per day, is already under construction and scheduled
to be completed within the next 12 months.
Exhibit 18: Crude Oil Pipeline Capacity Added in the Scenarios (Million Barrel per Day)
Base Case
High Case
Geographically, that capacity is concentrated in the Central, Midwest, and Southwest. Incremental
transport in the Central and Midwest is already being added to support imports of heavy crude oil from
Alberta’s oil sands. These are legacy projects that were already underway before the collapse in oil prices
and near-term slowdown in oil sands development. Another portion of the capacity is aimed at
transporting incremental supplies from the Bakken toward the East Coast and Gulf Coast. Yet another
Originating Region 2015 20162017-
2020
2021-
2025
2026-
2030
2031-
20352017-2035
Average
Annual 2017-
2035
U.S. 3.6 1.4 2.2 0.8 - - 3.0 0.2
Central 0.4 0.5 0.8 0.8 - - 1.6 0.1
Midwest 1.3 0.1 0.6 - - - 0.6 0.0
Northeast 0.3 - - - - - - -
Offshore - - - - - - - -
Southeast - - - - - - - -
Southwest 1.6 0.9 0.8 - - - 0.8 0.0
Western - - - - - - - -
Alaska - - - - - - - -
Originating Region 2015 20162017-
2020
2021-
2025
2026-
2030
2031-
20352017-2035
Average
Annual 2017-
2035
U.S. 3.6 1.4 2.9 1.3 0.8 - 5.0 0.3
Central 0.4 0.5 0.8 0.8 0.3 - 1.9 0.1
Midwest 1.3 0.1 0.8 - - - 0.8 0.0
Northeast 0.3 - - - - - - -
Offshore - - - - - - - -
Southeast - - - - - - - -
Southwest 1.6 0.9 1.3 0.5 0.5 - 2.3 0.1
Western - - - - - - - -
Alaska - - - - - - - -

38
portion of the capacity is aimed at transporting growing supplies of crude oil from West Texas to refineries
concentrated mostly along the Texas Gulf Coast.
In each of the cases after 2020, between 800,000 and 1.1 million barrels per day of incremental transport
will be needed to support imports of heavy crude from Alberta’s oil sands – recall from the discussion
above that oil sands production will resume its growth as oil prices rebound to $75 per barrel (2015$) in
the projections. Beyond that, the High Case adds another 1.7 million barrels per day of crude oil transport
capability as incremental production growth that is fostered by the increased resource base and
technological advancements. Most of the incremental capacity, or 1.5 million barrels per day is added in
the Southwest to support additional transport of crude oil from the Permian Basin toward the
Midcontinent and Gulf Coast refinery complex. The Permian Basin is the most prolific and cost effective
oil province in the U.S. with a vast amount of resource in a number of different plays, so it stands to reason
that any resource base improvements and/or technological advances would have a more pronounced
impact on production from that area. The remainder of the incremental transport in the High Case
originates from the Bakken into the Midwest.
It is also worth noting that the vast majority of the new oil pipeline transport that is projected for the U.S.
is likely to be completed during the next 5 to 10 years. This stands to reason since a robust buildout of
transport capability has occurred during the past five years and is currently ongoing. Thus, as production
growth slows over the projection period, the need of incremental capacity also slows as already built
capacity is relied on to transport incremental supplies.
For transport of natural gas, between 49 and 68 billion cubic feet per day of new pipeline capacity will be
needed to support the levels of production and market growth that are projected through 2035 (Exhibit
19). The incremental transport of 2.6 to 3.6 billion cubic feet per day per year would be added to an
already extensive gas transportation network that currently provides roughly 150 billion cubic feet per
day of transport capability. Thus, the size of the U.S. gas transportation network will increase at a rate of
roughly 2 percent per year in the future.
Unlike oil transport, which is more geographically limited, the buildout of the gas transportation network
is likely to occur in many different areas. Of course, because it is the most cost effective gas producing
area in North America, much of the new gas pipeline capacity will originate from the Marcellus and Utica
production basin. Effectively, 32 to 47 billion cubic feet per day of new capacity will be placed to transport
supplies from the Marcellus and Utica to consumers and export facilities that are geographically
widespread across the eastern part of the continent. Thus, although the capacity that originates from the
area shows up in the table in the Northeast and Midwest (based on the points of origination for projects),
the capacity will have far reaching effects on other market areas where gas is delivered.
Because there are many different pipeline projects aimed at providing the incremental transport for
Marcellus/Utica gas, many different companies will benefit from development of the area’s gas supplies,
Further, impacts of the development of the area’s gas will have far reaching benefits for the nation’s gas
consumers and the overall economy, as will be discussed later in Section 5.

39
Exhibit 19: Natural Gas Pipeline Capacity Added in the Scenarios (Billion Cubic Feet per Day)
Base Case
High Case
Of course, development of Marcellus/Utica supplies as well as development of supplies from other basins
(e.g., the Haynesville in Northwest Louisiana and East Texas), will impact development elsewhere because
of the market growth that the supplies support. Thus, the scenarios project a significant amount of new
capacity is needed in the Southwest and Southeast, where between 16 and 19 billion cubic feet per day
of new transport capability will be required. This new capacity will be needed to facilitate LNG exports as
well as exports to Mexico and foster the growth of gas-fired power generation.
Interestingly, not much new pipeline capacity appears to be needed in the Central and Western U.S. These
areas are already “over-piped” and have modest expectations for market growth. Indeed gas
consumption in these areas may struggle to keep pace with growth elsewhere. In fact, gas consumption
may even decline in the westernmost parts of the continent, especially in California where there is an
increased focus on renewable energy policies.
Originating Region 2015 20162017-
2020
2021-
2025
2026-
2030
2031-
20352017-2035
Average
Annual 2017-
2035
U.S. 6.8 5.7 39.2 7.8 2.0 0.5 49.5 2.6
Central - - - - 0.5 - 0.5 0.0
Midwest 1.9 2.7 4.4 1.0 - 0.5 5.9 0.3
Northeast 2.5 2.1 18.2 6.6 1.5 - 26.3 1.4
Offshore - - - - - - - -
Southeast 0.8 0.2 3.2 0.2 - - 3.4 0.2
Southwest 1.7 0.6 12.6 - - - 12.6 0.7
Western - - 0.8 - - - 0.8 0.0
Alaska - - - - - - - -
Originating Region 2015 20162017-
2020
2021-
2025
2026-
2030
2031-
20352017-2035
Average
Annual 2017-
2035
U.S. 6.8 5.7 39.4 12.9 10.9 4.2 67.4 3.5
Central - - 0.2 - 0.5 - 0.7 0.0
Midwest 1.9 2.7 4.4 2.0 1.0 1.0 8.4 0.4
Northeast 2.5 2.1 18.2 10.8 6.3 3.0 38.2 2.0
Offshore - - - - - - - -
Southeast 0.8 0.2 3.2 0.2 1.0 - 4.4 0.2
Southwest 1.7 0.6 12.6 - 2.1 0.2 14.9 0.8
Western - - 0.8 - - - 0.8 0.0
Alaska - - - - - - - -

40
Unlike oil, where development of new capacity noticeably slows over the projection period, development
of gas pipeline capacity is projected to be more uniform throughout the projection period. While the
cases project a slowdown from the very robust expansion that is likely to take place over the next few
years, the scenarios also project 10 to 28 billion cubic feet per day of new capability after 2020. This result
depends on the size of the resource base and continued technological advancements. These changes are
important because they would keep gas prices from rising in response to the robust market growth
occurring in the High Case. Thus, because the relatively large resource base and technological
advancements keep gas prices relatively low, they continue to foster the market growth and incremental
infrastructure development required in the High Case.
For transport of natural gas liquids (NGLs), between 1.8 and 2.6 million barrel per day of new pipeline
capacity will be needed to support the levels of production and market growth that are projected through
2035 (Exhibit 20). Almost all of this new capacity will be placed in service over the next decade.
Exhibit 20: NGL Pipeline Capacity Added in the Scenarios (Million Barrel per Day)
Base Case
High Case
Originating Region 2015 20162017-
2020
2021-
2025
2026-
2030
2031-
20352017-2035
Average
Annual 2017-
2035
U.S. 1.2 0.3 1.5 0.3 - - 1.8 0.1
Central 0.1 0.0 0.0 - - - 0.0 0.0
Midwest 0.1 0.2 0.5 - - - 0.5 0.0
Northeast 0.1 - 0.5 0.2 - - 0.7 0.0
Offshore - - - - - - - -
Southeast - - - - - - - -
Southwest 0.8 0.1 0.4 0.1 - - 0.5 0.0
Western - - - - - - - -
Alaska - - - - - - - -
Originating Region 2015 20162017-
2020
2021-
2025
2026-
2030
2031-
20352017-2035
Average
Annual 2017-
2035
U.S. 1.2 0.3 1.6 0.9 - 0.1 2.6 0.1
Central 0.1 0.0 0.0 - - - 0.0 0.0
Midwest 0.1 0.2 0.5 0.2 - - 0.7 0.0
Northeast 0.1 - 0.5 0.4 - - 0.9 0.0
Offshore - - - - - - - -
Southeast - - - - - - - -
Southwest 0.8 0.1 0.5 0.4 - 0.1 1.0 0.1
Western - - - - - - - -
Alaska - - - - - - - -

41
The areas for development of new capacity include the: 1) Northeast – home to the Marcellus and Utica
where gas production is likely to continue to grow very rapidly; 2) the Midwest where the Aux Sable liquids
extraction facility resides; and 3) the Southwest where there are potentially a large number of “wet” gas
plays that contain significant amounts of liquids resource. The last of these areas, the Southwest, is also
home to the Mont Belvieu, a widely recognized location for NGL transactions, that is in relatively close
proximity to a number of sites where additional petrochemical facilities (i.e., ethane crackers and
polypropylene plants) and NGL export terminals could be built and/or expanded.
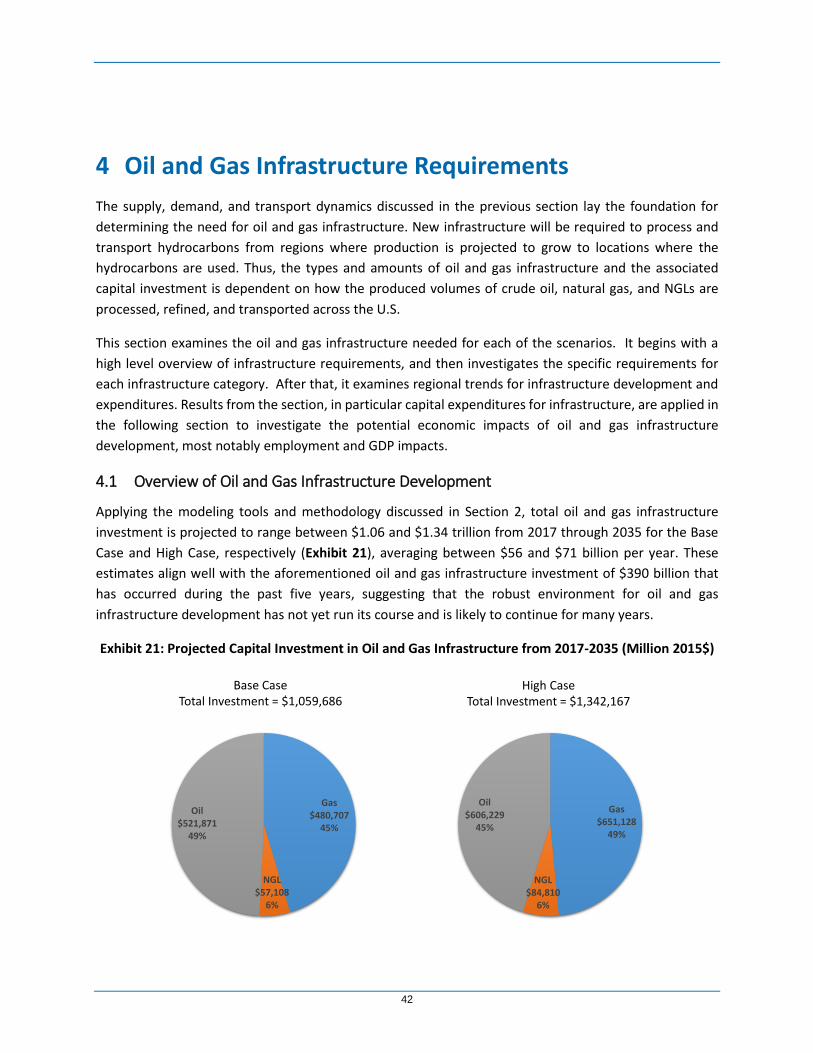
42
4 Oil and Gas Infrastructure Requirements
The supply, demand, and transport dynamics discussed in the previous section lay the foundation for
determining the need for oil and gas infrastructure. New infrastructure will be required to process and
transport hydrocarbons from regions where production is projected to grow to locations where the
hydrocarbons are used. Thus, the types and amounts of oil and gas infrastructure and the associated
capital investment is dependent on how the produced volumes of crude oil, natural gas, and NGLs are
processed, refined, and transported across the U.S.
This section examines the oil and gas infrastructure needed for each of the scenarios. It begins with a
high level overview of infrastructure requirements, and then investigates the specific requirements for
each infrastructure category. After that, it examines regional trends for infrastructure development and
expenditures. Results from the section, in particular capital expenditures for infrastructure, are applied in
the following section to investigate the potential economic impacts of oil and gas infrastructure
development, most notably employment and GDP impacts.
4.1 Overview of Oil and Gas Infrastructure Development
Applying the modeling tools and methodology discussed in Section 2, total oil and gas infrastructure
investment is projected to range between $1.06 and $1.34 trillion from 2017 through 2035 for the Base
Case and High Case, respectively (Exhibit 21), averaging between $56 and $71 billion per year. These
estimates align well with the aforementioned oil and gas infrastructure investment of $390 billion that
has occurred during the past five years, suggesting that the robust environment for oil and gas
infrastructure development has not yet run its course and is likely to continue for many years.
Exhibit 21: Projected Capital Investment in Oil and Gas Infrastructure from 2017-2035 (Million 2015$)
Gas$480,707
45%
NGL$57,108
6%
Oil$521,871
49%
Base CaseTotal Investment = $1,059,686
High CaseTotal Investment = $1,342,167
Gas$651,128
49%
NGL$84,810
6%
Oil$606,229
45%

43
Investment is strongest for natural gas gathering, processing and transport, with capital outlays totaling
between $481 and $651 billion over the projection period, accounting for between 45 and 49 percent of
the total investment. Natural gas infrastructure development has significant upside and risk because of
uncertainties around gas market development. Oil capital expenditures range from $522 to $606 billion,
with total expenditures much more consistent across the scenarios. This is because two of the biggest
components for oil-related investment, offshore oil platforms and refinery upgrades and refurbishments
are relatively steady in the different environments depicted in the scenarios. NGL investment is much less
at between $57 and $85 billion (i.e., 6 percent of the total), as expenditures are more narrowly focused
on fractionation facilities and a few large pipeline projects.
Much of the infrastructure projected here faces regulatory hurdles, but because this study is aimed at
quantifying potential infrastructure development and its associated CAPEX, it assumes that regulatory
hurdles will be overcome and infrastructure will be built in response to market needs. However, it is
worth noting that project delays in regulatory approvals processes pose significant downside risk for
projected investment and the associated economic benefits discussed later in Section 5.
For the most part and as mentioned above, infrastructure development and its associated CAPEX is
relatively steady throughout the projection period, averaging between $56 and $71 billion per year
(Exhibit 22). While robust buildout of infrastructure is likely to continue over the next few years, buildout
and investment in infrastructure is significant even in the longer term, with investment in new
infrastructure (NOT including enhancements, upgrades, replacements, and refurbishments of existing
infrastructure) averaging between $25 and $41 billion after 2020. Investment is, however, much more
steady in the High Case where the aforementioned upside potential for gas infrastructure development is
realized.
It is also worth noting that infrastructure development is buoyed after 2020 by expenditures aimed at
enhancing, upgrading, replacing and refurbishing older assets and equipment. Over time, equipment and
parts wear out, and assets must be adapted to respond to changes in the market and to comply with
regulations. This will be the case for refineries, which would need to adapt to a changing oil stream as
volumes of lighter sweet crude oil from the U.S. increase over time. Integrity management regulations
also necessitate replacement of assets. Further, some equipment with moving parts that is more
frequently used, for example, skid mounted compressor units relied on in gathering systems will wear out
and need to be replaced. Each of these factors as well as others will contribute to the $25 to $27 billion
per year CAPEX required to enhance, upgrade, replace, and refurbish existing facilities. Also, it should be
noted that none of these capital expenditures include operations and maintenance expenses, which
would potentially add billions of dollars to the values.

44
Exhibit 22: Oil and Gas Infrastructure CAPEX by Year (Million 2015$)
Base CaseProjected (2017-2035) Average Annual CAPEX = $55,773
High CaseProjected (2017-2035) Average Annual CAPEX = $70,640
$0
$10,000
$20,000
$30,000
$40,000
$50,000
$60,000
$70,000
$80,000
$90,000
$100,000
2012
2013
2014
2015
201
6
2017
2018
2019
2020
2021
2022
2023
2024
2025
2026
202
7
2028
2029
2030
2031
2032
2033
2034
2035
New E/U/R/R
E/U/R/R = Enhancement/Upgrade/Replacement/Refurbishment
$0
$10,000
$20,000
$30,000
$40,000
$50,000
$60,000
$70,000
$80,000
$90,000
$100,000
2012
2013
2014
2015
201
6
2017
2018
2019
2020
2021
2022
2023
2024
2025
2026
202
7
2028
2029
2030
2031
2032
2033
2034
2035
New E/U/R/R
E/U/R/R = Enhancement/Upgrade/Replacement/Refurbishment

45
4.2 Oil and Gas Infrastructure Development by Category
This portion of the report discusses investment by category. Expenditures across categories are first
discussed in broad terms directly below, and then each category is separately examined.
Among the categories, investment is greatest for surface and lease equipment with capital expenditures
totaling between $318 and $365 billion from 2017 to 2035, accounting for about 30 percent of the total
oil and gas infrastructure investment (Exhibit 23). The average annual CAPEX is fairly steady from year to
year, ranging from $16.7 to $19.2 billion per year (Exhibit 24). Roughly 80 percent of the expenditures
are for equipment that is put in place to support new producing wells and the remaining 20 percent is
attributed to replacement and refurbishment of existing infrastructure.
Pipeline development ranks second with a total CAPEX of $234 and $362 billion over the projection,
accounting for 22 to 27 percent of the total oil and gas infrastructure investment. These amounts equate
to an average annual CAPEX of between $12.3 and $19.0 billion. Much of the expenditure, or about 75
percent of it is for new infrastructure, with only 25 percent attributed to replacement and refurbishment
of existing infrastructure. This category has significant upside potential and risk depending on the
evolution of gas and NGL markets.
Gathering and processing investment runs a close third with a total CAPEX of $236 and $280 billion over
the projection, accounting for 22 percent of the total oil and gas infrastructure investment. The average
annual expenditure is $12.4 to $14.8 billion. A significant portion, or 47 percent of the CAPEX is for
replacement and refurbishment of existing infrastructure, mostly replacement of “small package”
compressors and components in processing plants that wear out over time. The three remaining
categories collectively add a total CAPEX of $272 to $335 billion over the projection, or $14.3 to $17.6
billion annually.
Exhibit 23: Oil and Gas Infrastructure CAPEX from 2017-2035 by Category (Million 2015$)
2012-16 Base Case, 2017-35 High Case, 2017-35
CAPEX % of Total CAPEX % of Total CAPEX % of Total
Surface and Lease Equipment $111,375 28.6% $318,010 30.0% $364,997 27.2%
Gathering and Processing $78,524 20.2% $235,621 22.2% $280,418 20.9%
Oil, Gas, and NGL Pipelines $101,670 26.1% $234,072 22.1% $361,579 26.9%
Oil and Gas Storage $10,242 2.6% $20,977 2.0% $25,456 1.9%
Refining and Oil Products Transport $79,081 20.3% $195,722 18.5% $216,829 16.2%
Export Terminals $8,742 2.2% $55,284 5.2% $92,887 6.9%
Total Expenditures $389,633 100.0% $1,059,686 100.0% $1,342,167 100.0%

46
Exhibit 24: Annual Oil and Gas Infrastructure CAPEX by Category (Million 2015$)

47
4.2.1 Capital Expenditures for Surface and Lease Equipment
As discussed above, surface and lease equipment capital expenditures are very significant, totaling $318
to $365 billion over the projection. These values equate to annual expenditures of $16.7 to $19.2 billion
for the Base Case and High Case, respectively (Exhibit 25). The values align well with average annual
expenditures over the past five years.
Over half of the investment in surface and lease equipment is devoted to offshore oil platforms in the Gulf
of Mexico, with a projected annual CAPEX averaging between $9.2 and $10.6 billion. Offshore
development is bolstered by the rebound of oil prices to $75 per barrel in real terms in each of the
scenarios. Further, because oil prices are the same in each scenario, the level of offshore drilling activity
is about the same. The Base Case projects that 445,000 barrels of oil equivalent per day are added each
year, while the High Case projects a slightly greater level of 512,000 barrels of oil equivalent per day each
year. Note that these statistics, as well as others are listed in the exhibit and are also shown in tables
showing regional detail in Appendix B. The difference in oil added results because of the incremental
resource and accelerated technology advancement assumed in the High Case. The production levels
require 9 to 10 new platforms every year, each of which are relatively large deep water platforms costing
about $1 billion.
Projected annual CAPEX for onshore surface and lease equipment averages $7.5 to $8.7 billion for the
Base Case and High Case, respectively. While these values are significant, they are somewhat below levels
from ten years ago as the number of annual well completions in the U.S. has declined significantly since
that time. With the move away from conventional resource to shale and tight resource development,
individual wells have become much more productive. Thus, far fewer wells are required to increase
production when compared with ten years ago. Because there are fewer wells needed, the amount of
surface and lease equipment projected year by year is also much less than it once was, driving down
surface and lease equipment expenditures relative to historical expenditures. However, today’s
equipment is also built to handle larger volumes of production, offsetting some of the cost reduction. In
addition, the cost reduction is also offset by replacement and refurbishment costs that make up roughly
40 percent of the total expenditures for onshore surface and lease equipment.
The difference in CAPEX for onshore surface and lease equipment between cases is driven by the slightly
greater activity in the High Case versus the Base Case. The High Case projects an average of 28,175 oil
and gas well completions each year while the Base Case projects only 24,075 oil and gas well completions
per year. With well completions up by about 17 percent in the High Case versus the Base Case, it should
come as no surprise that investment in surface and lease equipment is up by nearly that same percent in
the High Case.
Increased drilling activity between the cases occurs almost exclusively in oil well completions where the
resource base has been increased very significantly in the High Case relative to the Base Case. Gas well
completions are up only slightly in the High Case versus the Base Case. In the High Case, well productivity
improvements, and not well completions, drive the dramatic increases in gas production over time, as
was discussed earlier in Section 3.

48
Exhibit 25: Surface and Lease Equipment CAPEX (Million 2015$)
$0
$5,000
$10,000
$15,000
$20,000
$25,000
$30,00020
12
2013
2014
2015
2016
2017
2018
2019
2020
2021
2022
2023
2024
2025
2026
2027
2028
2029
2030
2031
2032
2033
2034
2035
Onshore Offshore
Projected (2017-2035) Average Annual ValuesGas Well Completions = 7,963Oil Well Completions = 16,112
Total Well Completions = 24,075Gulf of Mexico BOE/d Added = 445,000
Estimated Number of Platforms Added = 9
BASE CASE
$0
$5,000
$10,000
$15,000
$20,000
$25,000
$30,000
2012
2013
2014
2015
2016
2017
2018
2019
2020
2021
2022
2023
2024
2025
2026
2027
2028
2029
2030
2031
2032
2033
2034
2035
Onshore Offshore
Projected (2017-2035) Average Annual ValuesGas Well Completions = 8,011Oil Well Completions = 20,164
Total Well Completions = 28,175Gulf of Mexico BOE/d Added = 512,000
Estimated Number of Platforms Added = 10
HIGH CASE

49
4.2.2 Capital Expenditures for Gathering and Processing
As discussed above, gathering and processing capital expenditures rank third among the categories with
investment totaling $236 to $280 billion over the projection. These values equate to annual expenditures
of $12.4 to $14.8 billion for the Base Case and High Case, respectively (Exhibit 26), aligning well with
average annual expenditures during the past five years.
Roughly one-third or the largest portion of the total investment for this category is devoted to gathering
lines, with a projected annual CAPEX averaging between $4.6 and $4.9 billion for the Base and High Case,
respectively. The difference between the two cases is attributed to the change in the number of well
completions and the related changes in oil and gas production. In the U.S., 11,485 to 12,612 miles of
gathering lines will be built or replaced each year, equating to a total of between 218,000 and 240,000
miles throughout the projection. Roughly 75 percent of the new and replaced lines are for gas gathering
with the remainder added for oil gathering. Oil lines account for a smaller portion of gathering because
there are significant amounts of crude oil stored in tanks near the wellhead and taken away by truck
instead of pipe. The average diameter of the added gathering lines is roughly 6 inches for each case, but
there is a great deal of regional variance in the diameter, as shown in tables in Appendix B.
To support the gas gathering process, between 1.2 and 1.5 million horsepower of compression will be
needed each year, yielding an annual investment of $3.0 to $3.7 billion. Annual additions/enhancements
to compression equate to 22 to 29 million horsepower throughout the projection. Much of the
compression for gathering lines will be modularized skid-mounted units that can be easily added or
removed over time.
Investment in gas processing plants averages $3.2 to $4.0 billion per year for the Base and High Case,
respectively. This sub-category includes separators, treaters, dehydrators, meters, control equipment,
valves, and compressors located within the confines of the processing plant. Expenditures support 3.7 to
4.5 billion cubic feet per day per year of new and replaced processing capacity, which equates to 70 to 85
billion cubic feet per day of processing capacity throughout the projection. Across the U.S., this amount
of capacity equates to between 13 and 17 processing plants each year, given that, on average, a single
plant can process up to 275 million cubic feet of gas per day.
This analysis also shows that new and replaced NGL fractionation capacity of 256,000 to 335,000 barrels
per day will be required each year, yielding an average annual CAPEX of $1.7 to $2.2 billion for the Base
and High Case, respectively. The annual capacity additions equate to roughly 5 to 6 million barrels per
day of new/replacement capacity throughout the projection. Further, these totals equal 3 to 5
fractionation plants each year, assuming that, on average, a single plant can process up to 75,000 barrels
of NGLs per day.
Capital expenditures associated with enhancing, upgrading, replacing, and refurbishing infrastructure in
this category are very significant, averaging $5.9 to $6.3 billion per year. This level of expenditures
accounts for roughly 45 percent of the total investment in gathering and processing assets, which seems
like a relatively large percent to invest in replacement and refurbishment of existing assets. However, the
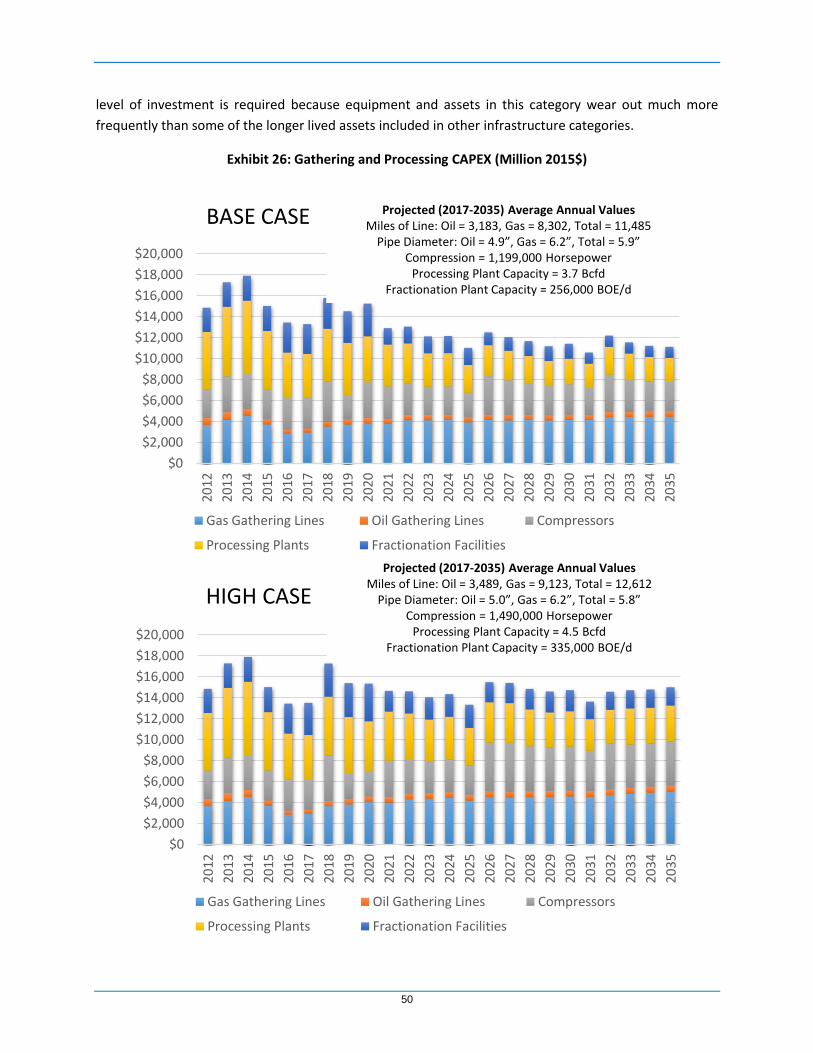
50
level of investment is required because equipment and assets in this category wear out much more
frequently than some of the longer lived assets included in other infrastructure categories.
Exhibit 26: Gathering and Processing CAPEX (Million 2015$)
$0
$2,000
$4,000
$6,000
$8,000
$10,000
$12,000
$14,000
$16,000
$18,000
$20,000
2012
2013
2014
2015
2016
2017
2018
2019
2020
2021
2022
2023
2024
2025
2026
2027
2028
2029
2030
2031
2032
2033
2034
2035
Gathering and Processing, Millions of 2015$ (Base Case)
Gas Gathering Lines Oil Gathering Lines Compressors
Processing Plants Fractionation Facilities
$0
$2,000
$4,000
$6,000
$8,000
$10,000
$12,000
$14,000
$16,000
$18,000
$20,000
2012
2013
2014
2015
2016
2017
2018
2019
2020
2021
2022
2023
2024
2025
2026
2027
2028
2029
2030
2031
2032
2033
2034
2035
Gathering and Processing, Millions of 2015$ (High Case)
Gas Gathering Lines Oil Gathering Lines Compressors
Processing Plants Fractionation Facilities
BASE CASE
HIGH CASE
Projected (2017-2035) Average Annual ValuesMiles of Line: Oil = 3,183, Gas = 8,302, Total = 11,485
Pipe Diameter: Oil = 4.9”, Gas = 6.2”, Total = 5.9”Compression = 1,199,000 Horsepower
Processing Plant Capacity = 3.7 BcfdFractionation Plant Capacity = 256,000 BOE/d
Projected (2017-2035) Average Annual ValuesMiles of Line: Oil = 3,489, Gas = 9,123, Total = 12,612
Pipe Diameter: Oil = 5.0”, Gas = 6.2”, Total = 5.8”Compression = 1,490,000 Horsepower
Processing Plant Capacity = 4.5 BcfdFractionation Plant Capacity = 335,000 BOE/d

51
4.2.3 Capital Expenditures for Oil, Gas, and NGL Pipelines
As discussed above, capital expenditures for oil, gas, and NGL pipelines rank second behind surface and
lease equipment with investment totaling $234 to $362 billion over the projection. These values equate
to annual expenditures of $12.3 to $19.0 billion for the Base Case and High Case, respectively (Exhibit 27).
While these values are somewhat below average annual expenditures that have recently averaged just
over $20 billion, they are still very significant and suggest that there are a number of years remaining for
the robust oil and gas pipeline buildout that has been occurring.
The vast majority, or roughly 80 percent of the total investment in this category is for natural gas pipelines,
with an average annual CAPEX of $10.1 to $15.3 billion. These values equate to a total of $190 to $290
billion throughout the projection.
Roughly 1,400 to 2,400 miles of natural gas pipeline are built each year, with a total of between 27,000 to
46,000 miles put in place throughout the projection. There is significant upside and risk for natural gas
pipeline development, depending on market evolution and project approvals. In addition to the mileage
of lines, there is between 524,000 and 596,000 horsepower of compression added each year, equating to
a total of 10 to 12 million horsepower of compression over the course of the projection.
The vast majority of investment in natural gas pipelines is for new capacity, with only 20 percent of the
total investment aimed at replacing and refurbishing older pipelines. Most, if not all of the replacement
and refurbishment CAPEX for natural gas pipelines will be associated with integrity management
programs and for upgrades necessary to comply with NOxemissions standards.
Oil and NGL pipeline investments average $2.2 to $3.7 billion per year, or between $42 and $70 billion
over the entire projection. There are far fewer miles of oil and NGL pipeline required in the scenarios, in
comparison to gas pipelines. Thus, only 600 to 950 miles of pipeline are added each year for a total of
11,000 to 18,000 miles over the entire projection. Pumping requirements for oil and NGL pipelines will
total 128,000 to 185,000 horsepower each year, or 2.4 to 3.5 million horsepower over the entire
projection.
Much of the new oil pipeline that is required is already under construction, or could be added with a few
large projects. The same can also be said for NGL transport, where a few large projects could yield much
of the needed capacity. Thus, oil and NGL pipeline investments are uneven over time, particularly when
they are compared with investments in natural gas pipelines that are much steadier throughout the
projection.
Most of the pipeline capacity that is added in each of the scenarios is fairly large pipe, averaging just
over 22” in diameter. Some of the projects, particularly the oil projects aimed at transporting heavy
crude oil from Western Canada into the U.S. and toward the Gulf Coast require very large pipes, each of
which is upwards of 32” in diameter.

52
Exhibit 27: Oil, Gas, and Natural Gas Liquids (NGLs) Pipeline CAPEX (Million 2015$)
$0
$5,000
$10,000
$15,000
$20,000
$25,000
$30,00020
12
2013
2014
2015
2016
2017
2018
2019
2020
2021
2022
2023
2024
2025
2026
2027
2028
2029
2030
2031
2032
2033
2034
2035
Oil, Gas, and NGL Pipelines, Millions of 2015$ (Base Case)
Oil Lines Pumps for Oil Lines NGL Lines
Pumps for NGL Lines Gas Lines Compressors for Gas Lines
$0
$5,000
$10,000
$15,000
$20,000
$25,000
$30,000
2012
2013
2014
2015
2016
2017
2018
2019
2020
2021
2022
2023
2024
2025
2026
202
7
2028
2029
2030
2031
2032
2033
2034
2035
Oil, Gas, and NGL Pipelines, Millions of 2015$ (High Case)
Oil Lines Pumps for Oil Lines NGL Lines
Pumps for NGL Lines Gas Lines Compressors for Gas Lines
BASE CASE
HIGH CASE
Projected (2017-2035) Average Annual ValuesPipeline Miles: Oil = 269, Gas = 1,404, NGL = 339,Total = 2,013
Pipe Diameter: Oil = 26.0”, Gas = 23.0”, HGL = 15.0”, Total = 22.1”Compression = 524.000 Horsepower
Pumping = 128,000 Horsepower
Projected (2017-2035) Average Annual ValuesPipeline Miles: Oil = 389, Gas = 2,409, NGL = 574,Total = 3,373
Pipe Diameter: Oil = 27.7”, Gas = 22.5”, HGL = 15.4”, Total = 21.9”Compression = 596.000 Horsepower
Pumping = 185,000 Horsepower

53
4.2.4 Capital Expenditures for Oil and Gas Storage
Capital expenditures for oil and gas storage are the least significant of the investments discussed in this
report. This result occurs because there is already a vast amount of oil and gas storage capacity in place
across the U.S., and the need of new storage infrastructure is not very significant. Thus, total capital
expenditures range from $21.0 and $25.5 billion over the projection period, equating to an average annual
CAPEX of $1.1 to $1.3 billion (Exhibit 28).
Even though there is already a large amount of storage in place, the two scenarios add incremental storage
in response to market and supply growth. For crude oil, storage is added to provide a temporary “holding
location” for supplies until they are able to be transported to centralized tank farms and/or refineries.
The Base Case adds 1.1 million barrels of storage per year in response to the modest oil production growth
that occurs over time, while the High Case adds 5.0 million barrels of storage per year in response to the
enhanced production growth that occurs. Total storage additions in the High Case approach 100 million
barrels by 2035, in line with the Case’s crude oil production growth of nearly 4 million barrels per day.
However, the far greater portion of the oil storage investment in the case occurs for replacement and
refurbishment of already existing oil tanks. Essentially, there are 13 to 14 million barrels per year of oil
tanks replaced and/or refurbished in the cases, yielding roughly $3 billion per year expenditure for oil tank
upkeep.
With regards to natural gas, the Base Case adds 19 billion cubic feet per year of working gas capability
while the High Case adds 31 billion cubic feet per year of working gas capability. This added storage is
mostly high deliverability salt cavern storage located in relatively close proximity to where gas markets
grow most significantly, that is, near power plants, large petrochemical facilities, and LNG export facilities.
The gas storage is added mostly to manage loads and balance consumption with supplies. The larger
market growth in the High Case accounts for the incremental 12 billion cubic feet per year that is added
above Base Case levels.
Even with these storage additions, the largest portion of the projected storage expenditures in the Base
and High Case are for replacement, refurbishment, and upgrades of existing storage capability, notably in
gas storage fields. The cases project that $13 to $14 billion of the total storage expenditures are needed
from 2017 through 2035 to replace and refurbish old wells in gas storage fields.
Thus, gas storage injection and withdrawal wells supporting roughly 40 billion cubic feet of working gas
capacity are reworked or replaced each year in order to improve well completion integrity. Over the
entire projection, the total amount of working gas capacity that is touched by such well integrity
management programs will total almost 800 billion cubic feet, which is approximately 20 percent of the
effective working gas capacity currently in place in the U.S. There is little doubt that well integrity
management programs for storage fields are becoming a significant area of focus for the foreseeable
future.

54
Exhibit 28: Oil and Gas Storage CAPEX (Million 2015$)
$0
$500
$1,000
$1,500
$2,000
$2,500
$3,000
2012
2013
2014
2015
2016
2017
2018
2019
2020
2021
2022
2023
2024
2025
2026
2027
2028
2029
2030
2031
2032
2033
2034
2035
Oil and Gas Storage, Millions of 2015$ (Base Case)
Oil Storage Gas Storage
$0
$500
$1,000
$1,500
$2,000
$2,500
$3,000
2012
2013
2014
2015
2016
2017
2018
2019
2020
2021
2022
2023
2024
2025
2026
2027
2028
2029
2030
2031
2032
2033
2034
2035
Oil and Gas Storage, Millions of 2015$ (High Case)
Oil Storage Gas Storage
BASE CASE
HIGH CASE
Projected (2017-2035) Average Annual ValuesGas Storage Capacity Added/Refurbished = 60 billion cubic feetOil Storage Capacity Added/Refurbished = 14.0 million barrels
Refurbishment = 79% of CAPEX
Projected (2017-2035) Average Annual ValuesGas Storage Capacity Added/Refurbished = 73 billion cubic feetOil Storage Capacity Added/Refurbished = 19.2 million barrels
Refurbishment = 67% of CAPEX

55
4.2.5 Capital Expenditures for Refining and Oil Products Transport
The scenarios project capital expenditures for refining and oil products transport of $196 to $217 billion
from 2017 to 2035. These values equate to $10.3 to $11.4 billion per year (Exhibit 29). While these values
are significant, they are somewhat below recent annual expenditures that have averaged close to $16
billion. The recent historical expenditures have a significant annual expenditure of almost $3 billion for
rail transport of crude oil that is not present in the future – more to be said on this point below.
By far, the most significant expenditure in this category is associated with enhancing, upgrading, replacing,
and refurbishing refining capacity. A resurgence in refining has occurred with the dawn of tight oil supply
development in the U.S. The tight oil supplies from a number of different basins are generally made up
of lighter, sweeter crudes that are somewhat different from the oil that has historically been delivered to
U.S. refineries, which has been heavier and sour. Thus, there have been significant investments to
enhance and upgrade refineries during the past few years to handle the different qualities of the slate of
crudes that are being produced and delivered to refineries. Thus, recent investment in retooling U.S.
refineries has averaged about $6.5 billion per year.
The scenarios project that the recent trend for refining upgrades and enhancements will continue, with
an additional CAPEX of $178 to $194 billion devoted to refineries during the projection. These values
equate to annual investment of $9.4 and $10.2 billion for the Base and High Case, respectively. The
investments will be aimed at increasing refining runs with the lighter, sweeter crudes that are being
developed in the scenarios. The difference between the Base Case and High Case is associated with
increased refinery input and output in the High Case.
To support the takeaway of the increased amount of products from the refineries, between 170 and 253
miles per year of oil products pipelines will need to be built of replaced each forecast year. With an
average diameter of about 13.5”, the annual CAPEX for the oil products pipelines will range from $250 to
$500 million. In addition to the miles of pipe, between 162,000 and 179,000 horsepower of pumps will
be put in place to support the transport of oil transport along the pipelines.
Perhaps the most surprising result for this category of oil infrastructure investment is the lack of
investment in new rail transport, as alluded to above. This result occurs because of two reasons. First, a
significant part of recent historical expenditures for rail transport of crude oil has been focused on
replacing aging rail cars to comply with recent regulations. To date, a substantial portion of the fleet has
been replaced, so that investment has mostly run its course. The second reason, which is the more
significant driver of the result is that the study has more generally assumed incremental crude oil and oil
products transport will be almost entirely satisfied with new pipeline capacity, substantiating levels of
investment in crude oil pipeline transport discussed earlier. Admittedly, there could be additional
penetration of rail transport, especially because rail transport has “optionality” that pipelines do not
necessarily offer. However, if additional rail transport were to supplant pipeline transport, some portion
of the CAPEX would merely move from pipeline to rail transport and the total projected capital
expenditure across all categories may not necessarily change by much. That result would depend on the
amount of pipeline capacity that is supplanted by rail transport, because rail transport is typically more
expensive than pipeline transport.

56
Exhibit 29: Refining and Oil Products Transport CAPEX (Million 2015$)
$0
$5,000
$10,000
$15,000
$20,000
$25,00020
12
2013
2014
2015
2016
2017
2018
2019
2020
2021
2022
2023
2024
2025
2026
2027
2028
2029
2030
2031
2032
2033
2034
2035
Refining Oil Product PipelinePumps for Oil Products Pipelines Rail Transport
BASE CASE Projected (2017-2035) Average Annual ValuesRefinery Enhancements, Upgrades, Replacements, and
Refurbishments = 780,000 barrel per dayOil Produce Pipeline Miles = 170
Oil Product Pipeline Diameter = 13.5”Oil Product Pipeline Pumps = 162,000 horsepower
Rail Loading/Unloading Capacity = 8,000 barrel per day
$0
$5,000
$10,000
$15,000
$20,000
$25,000
2012
2013
2014
2015
2016
2017
2018
2019
2020
2021
2022
2023
2024
2025
2026
2027
2028
2029
2030
2031
2032
2033
2034
2035
Refining Oil Product PipelinePumps for Oil Products Pipelines Rail Transport
HIGH CASE Projected (2017-2035) Average Annual ValuesRefinery Enhancements, Upgrades, Replacements, and
Refurbishments = 853,000 barrel per dayOil Produce Pipeline Miles = 253
Oil Product Pipeline Diameter = 13.6”Oil Product Pipeline Pumps = 179,000 horsepower
Rail Loading/Unloading Capacity = 8,000 barrel per day

57
4.2.6 Capital Expenditures for Export Terminals
The scenarios project capital expenditures for liquefied natural gas (LNG) and natural gas liquid (NGL)
export facilities ranging from $55 to $93 billion from 2017 to 2035. These values equate to $3.0 to $4.9
billion per year (Exhibit 30), well above recent historical averages. Thus, the U.S. is right at the cusp of
significant growth for LNG and NGL exports.
With the Base Case assuming 15 trains of liquefaction (i.e., 0.5 billion cubic feet per day per year of new
capacity) placed into service to support roughly 10 billion cubic feet per day of exports after 2025, total
expenditures for LNG export facilities rise to over $50 billion from 2017 through 2035. While this level of
investment equates to an average annual CAPEX of $2.7 billion over the entire projection period, almost
all of the new capacity is added during the next five years. Thus, investment through 2022 averages almost
$9.0 billion per year. The majority of the new facilities are placed into service along the Gulf Coast at
various locations including Sabine Pass, Corpus Christi, Freeport, and Lake Charles.
The High Case adds 10 to 12 additional trains of LNG to support exports that rise to roughly 19 billion cubic
feet per day after 2025. The new capacity in the case sums to 1.1 billion cubic feet per day each year.
These additions yield a total investment of over $85 billion throughout the projection, averaging nearly
$4.5 billion per year. Unlike the Base Case, the investment is more prolonged with significant levels of
investment occurring after the next five years. Much of the incremental capacity in the scenario is
provided by additional liquefaction at locations already developed in the Base Case, plus some other
locations that are not included in the Base Case.
Natural gas liquids export facilities added in the cases contribute between $4.5 and $7.5 billion to the
total CAPEX. While the dollar value of NGL export facilities is much lower than the expenditures for LNG
export facilities, the expenditure supports a significant amount of new export capacity – the scenarios add
between 45,300 and 76,000 barrels per day of NGL export capacity each year. Thus, the total NGL export
capacity added sums to 0.9 to 1.5 million barrels per day throughout the projection.
Much of the new NGL capacity will be built to accommodate propane exports. However, there will also
be incremental capacity required to support exports of ethane and butane. Even though there is a
significant amount of export capability added, the CAPEX is not nearly as large as it is for LNG because
liquefaction facilities required to produce the LNG are relatively expensive facilities, compared with the
liquids handling, loading, and unloading facilities needed to facilitate liquids import and export activity.

58
Exhibit 30: Liquefied Natural Gas (LNG) and Natural Gas Liquids (NGL) Export Terminal CAPEX (Million
2015$)
$0
$5,000
$10,000
$15,000
$20,000
$25,000
$30,00020
12
2013
2014
2015
201
6
2017
2018
2019
2020
2021
2022
2023
2024
2025
2026
202
7
2028
2029
2030
2031
2032
2033
2034
2035
LNG NGL
$0
$5,000
$10,000
$15,000
$20,000
$25,000
$30,000
2012
2013
2014
2015
201
6
2017
2018
2019
2020
2021
2022
2023
2024
2025
2026
202
7
2028
2029
2030
2031
2032
2033
2034
2035
LNG NGL
BASE CASE
HIGH CASE
Projected (2017-2035) Average Annual ValuesLNG Export Capacity Added = 0.5 billion cubic feet per day
NGL Export Capacity Added = 45,300 barrels per day
Projected (2017-2035) Average Annual ValuesLNG Export Capacity Added = 1.1 billion cubic feet per day
NGL Export Capacity Added = 76,000 barrels per day

59
4.3 Summary of Regional Investment in Oil and Gas Infrastructure
Regionally, oil and gas infrastructure development is projected to be greatest in the Southwest, which
accounts for between $381 and $501 billion, or 36 to 37 percent of the total oil and gas infrastructure
investment in infrastructure throughout the projection (Exhibit 31). It should come as little surprise that
this area leads the way on infrastructure development because it is relatively friendly to oil and gas
development that is already home to a significant amount of infrastructure. Thus, a fair portion of the
investment in this area will be focused not only on development of new facilities, but also on enhancing,
upgrading, replacing, and refurbishing existing infrastructure.
However, the Northeast U.S. will also witness a significant investment in oil and gas infrastructure moving
forward, with total investment for the area ranging between $204 and $278 billion. These values equate
to roughly 20 percent of the total oil and gas infrastructure investment across the U.S. The focus for this
area has been and will continue to be on developing and transporting the vast amount of natural gas
resource contained in the Marcellus/Utica producing basin. Infrastructure development for this area will
greatly depend on approvals of pipeline projects and market evolution.
Offshore Gulf of Mexico infrastructure development is also significant at $177 to $204 billion, accounting
for roughly 16 percent of the total investment that occurs across each of the scenarios. The relatively
stable and consistent investment in this area is linked to offshore oil platforms. Collectively, other
geographic areas account for the remaining $296 to $360 billion, or roughly 27 percent of the total
investment across the projections. Reasons for development of these other areas are varied, as
summarized in the discussion below.
Exhibit 31: Cumulative Regional CAPEX for Oil and Gas Infrastructure, 2017-2035 (Million 2015$)
Base CaseTotal Investment = $1,059,686
High CaseTotal Investment = $1,342,167
Central$114,358
11%
Midwest$79,157
7%
Northeast$204,273
19%
Southeast$52,137
5%
Southwest$381,438
36%
Western$44,088
4%
Offshore$177,490
17%
Alaska$6,744
1%Central
$128,67810%
Midwest$103,268
8%
Northeast$277,916
21%
Southeast$75,598
6%
Southwest$500,539
37%
Western$45,479
3%
Offshore$203,787
15%
Alaska$6,902
0%

60
Central
Total investment in this region will range from $114 to $129 billion over the course of the projection,
equating to annual investment of $6.0 and $6.8 billion for the Base and High Case, respectively (Exhibit
32 and Exhibit 34). These values amount to roughly 10 to 11 percent (Exhibit 33 and Exhibit 35) of the
total investment in oil and gas infrastructure across the U.S. Investment in this area will be focused on
development and replacement of surface and lease equipment and gathering and processing facilities, as
the area is home to many producing wells and roughly 20 percent of the future E&P activity will be
concentrated within the area. The area is home to a number of large producing basins, including the
Bakken and Williston, Greater Green River, Uinta/Piceance, DJ, and Powder River, as well as the more
recently developed Niobrara region. Each of these producing areas has a vast amount of resource
remaining to be developed, providing significant opportunity for continued oil and gas infrastructure
development across the area.
Midwest
Total investment in this region will range from $79 to $104 billion (i.e., roughly 8 percent of the U.S. total)
throughout the projection, equating to $4.2 to $5.4 billion annually. Roughly half of the projected
investment for the area is focused on new pipeline projects, a number of which are aimed at delivering
incremental natural gas supplies from burgeoning production in the Marcellus and Utica into the area.
However, there is also significant investment projected for the area’s refineries, which are located closer
to the Bakken Shale and Western Canada than many refineries elsewhere across the U.S; the area’s
refineries are very likely to enhance and upgrade their capabilities to handle increasing volumes of oil
from those areas.
Northeast
As mentioned above, total oil and gas infrastructure investment for this region is very significant at $204
to $278 billion, representing roughly 20 percent of total investment across the U.S. throughout the
projection. Roughly 40 to 45 percent of the area’s annual investment of $10.8 to $14.6 billion is focused
on building new gas and NGL pipelines from the Marcellus and Utica producing areas. Also, there is a
significant difference between the Base and High Case because the area is highly dependent on market
evolution; that is to say market development for the area’s gas is vital for infrastructure development.
Greater growth in natural gas markets would spur significant infrastructure development, and vice versa.
Gathering and processing development also accounts for a significant portion of the area’s investment, as
there will be 18,500 to 20,000 miles of gathering line, 31.0 to 41.0 billion cubic feet per day of gas
processing plant capacity, and 1.2 to 1.7 million barrels per day of NGL fractionation capacity developed
or replaced from 2017 through 2035. In aggregate, the gathering and processing facilities added within
this area will account for roughly 40 percent of the total gathering and processing capabilities added
across the U.S.

61
Southeast
Total investment in this region will range from $52 to $76 billion (i.e., roughly 5 percent of the U.S. total)
throughout the projection, equating to $2.7 to $4.0 billion annually. Roughly 70 percent of the projected
investment for the area is focused on new pipeline projects, almost all of which are designed to deliver
natural gas to power plants. This area will potentially experience very robust growth in gas-fired power
generation as the nation’s coal power plants continue to retire. There is also some investment in the area
for refinery upgrades and enhancements.
Southwest
As mentioned above, investment in oil and gas infrastructure for this region is the most significant across
the U.S. at $381 to $501 billion, accounting for 36 to 37 percent of total investment throughout the
projection. These levels of investment equate to $20.1 and $26.3 billion annually. Future investment for
infrastructure in this region is more broadly and evenly spread across infrastructure categories, or at least
much more so than in other regions. This is an intuitive finding considering that, historically, the area’s
infrastructure has been very robust and diverse.
The sub-category with the most significant spending in this area is refining, with average annual
expenditures of $5.2 to $5.8 billion. This area has a vast refinery complex that will be in need of upgrades
and enhancements as production from tight oil resources grows over time.
Gathering and processing runs a close second to refining with average annual expenditures ranging from
$4.9 to $5.8 billion. The area’s production is fairly well spread between oil, gas, and NGLs, so future
infrastructure should be broadly focused on developing each hydrocarbon.
Investment in the area’s surface and lease equipment is also projected to be fairly sizeable, running from
$4.7 to $5.6 billion per year. With many oil and gas producing wells already in the area, and with the Base
and High Case projecting that the area will account for 55 to 60 percent of new producing wells from 2017
through 2035, it is not surprising that over half of the study’s total investment for onshore surface and
lease equipment for the U.S. is driven by well completions in this area.
After surface and lease equipment, investments for pipelines and the area’s export facilities will range
from $2.4 to $4.5 billion for each sub-category. There are many new pipeline facilities needed to foster
hydrocarbon transport into, within, and out of the area. Oil pipelines are needed to transport incremental
supplies from West Texas to refineries near the Texas Gulf Coast; gas pipelines are needed to feed LNG
export and petrochemical facilities and to move gas to locations that export gas from the U.S. to Mexico;
and NGL pipelines are needed to transport natural gas liquids to export terminals, new ethane crackers,
and new poly-propylene production facilities. Finally, new LNG export terminals and incremental NGL
export capacity will be heavily concentrated in this area in the future.
Of all regions across the U.S., this area is also most significant for oil and gas storage development, with
annual CAPEX ranging from $390 to $488 million. There are many oil tank farms spread along the Gulf
Coast, and the study projects that new oil storage capacity will continue to be developed there. In

62
addition, much of the high deliverability salt cavern storage that will be developed in the future will be
concentrated in the area because of the favorable geology for such storage. In short, this region will
remain the most robust region for oil and gas infrastructure development moving forward.
West
Oil and gas infrastructure investment in this area is relatively modest at $44 to $45 billion, accounting for
roughly 4 percent of the total investment throughout the projection. These levels of investment equate
to an annual average of $2.3 to $2.4 billion. The majority of the area’s investment will be concentrated
in refinery refurbishments and upgrades, but it remains to be seen whether the area’s refineries, mostly
located in California, will undertake significant investments considering potential market and regulatory
changes. Thus, these investments, which are a relatively small portion of the projected total investment
across the U.S., are somewhat at risk.
Offshore Gulf of Mexico
As mentioned above, investment in this area will total $177 to $204 billion from 2017 through 2035, or
$9.3 to $10.7 billion per year. The area’s investment accounts for roughly 16 percent of the total
investment across the U.S. Investment is almost entirely concentrated in offshore platform development,
with 9 to 10 new oil platforms projected to be placed into service each year.
Alaska
Oil and gas infrastructure development in this State is relatively small at roughly $7 billion from 2017
through 2035. Future investment is mostly focused on infrastructure needed to support oil production
from the North Slope, which has been declining and is likely to continue to decline in the future. While
the State has a vast amount of gas resource that could be developed, the scenarios included herein do
not consider development of that resource. Such development could dramatically change the
infrastructure investment results for the State.
Exhibit 32: Projected Annual CAPEX by Region and Category, Base Case (Million 2015$)
Central Midwest Northeast Southeast Southwest West Offshore Alaska U.S.
Surface and Lease Equipment $1,733 $51 $693 $42 $4,694 $294 $9,213 $18 $16,737
Gathering and Processing $2,023 $294 $4,595 $119 $4,915 $142 $86 $226 $12,401
Oil, Gas, and NGL Pipelines $1,321 $2,090 $4,335 $1,783 $2,358 $372 $42 $19 $12,320
Oil and Gas Storage $123 $227 $183 $109 $390 $69 $0 $3 $1,104
Refining and Products Transport $818 $1,505 $692 $593 $5,160 $1,443 $0 $90 $10,301
Export Terminals $0 $0 $252 $98 $2,560 $0 $0 $0 $2,910
Total Midstream Investment $6,019 $4,166 $10,751 $2,744 $20,076 $2,320 $9,342 $355 $55,773

63
Exhibit 33: Percent of Projected Annual CAPEX by Region and Category, Base Case
Exhibit 34: Projected Annual CAPEX by Region and Category, High Case (Million 2015$)
Exhibit 35: Percent of Projected Annual CAPEX by Region and Category, High Case (Million 2015$)
Central Midwest Northeast Southeast Southwest West Offshore Alaska U.S.
Surface and Lease Equipment 3.1% 0.1% 1.2% 0.1% 8.4% 0.5% 16.5% 0.0% 30.0%
Gathering and Processing 3.6% 0.5% 8.2% 0.2% 8.8% 0.3% 0.2% 0.4% 22.2%
Oil, Gas, and NGL Pipelines 2.4% 3.7% 7.8% 3.2% 4.2% 0.7% 0.1% 0.0% 22.1%
Oil and Gas Storage 0.2% 0.4% 0.3% 0.2% 0.7% 0.1% 0.0% 0.0% 2.0%
Refining and Products Transport 1.5% 2.7% 1.2% 1.1% 9.3% 2.6% 0.0% 0.2% 18.5%
Export Terminals 0.0% 0.0% 0.5% 0.2% 4.6% 0.0% 0.0% 0.0% 5.2%
Total Midstream Investment 10.8% 7.5% 19.3% 4.9% 36.0% 4.2% 16.7% 0.6% 100.0%
Central Midwest Northeast Southeast Southwest West Offshore Alaska U.S.
Surface and Lease Equipment $1,808 $54 $775 $52 $5,612 $293 $10,600 $15 $19,210
Gathering and Processing $2,203 $402 $5,833 $103 $5,768 $142 $83 $224 $14,759
Oil, Gas, and NGL Pipelines $1,677 $3,100 $6,799 $2,893 $4,100 $401 $42 $19 $19,030
Oil and Gas Storage $155 $263 $218 $140 $488 $72 $0 $3 $1,340
Refining and Products Transport $929 $1,616 $749 $693 $5,836 $1,485 $0 $103 $11,412
Export Terminals $0 $0 $252 $98 $4,539 $0 $0 $0 $4,889
Total Midstream Investment $6,773 $5,435 $14,627 $3,979 $26,344 $2,394 $10,726 $363 $70,640
Central Midwest Northeast Southeast Southwest West Offshore Alaska U.S.
Surface and Lease Equipment 2.6% 0.1% 1.1% 0.1% 7.9% 0.4% 15.0% 0.0% 27.2%
Gathering and Processing 3.1% 0.6% 8.3% 0.1% 8.2% 0.2% 0.1% 0.3% 20.9%
Oil, Gas, and NGL Pipelines 2.4% 4.4% 9.6% 4.1% 5.8% 0.6% 0.1% 0.0% 26.9%
Oil and Gas Storage 0.2% 0.4% 0.3% 0.2% 0.7% 0.1% 0.0% 0.0% 1.9%
Refining and Products Transport 1.3% 2.3% 1.1% 1.0% 8.3% 2.1% 0.0% 0.1% 16.2%
Export Terminals 0.0% 0.0% 0.4% 0.1% 6.4% 0.0% 0.0% 0.0% 6.9%
Total Midstream Investment 9.6% 7.7% 20.7% 5.6% 37.3% 3.4% 15.2% 0.5% 100.0%

64
5 Results of the Economic Impact Analysis
Investment in oil and gas infrastructure will have significant benefits for the U.S. economy. Specifically, it will increase both employment and Gross State Products. To assess economic benefits that result from the capital expenditures discussed above, we have applied IMPLAN, which is a widely used economic impact analysis system. IMPLAN considers both multiplier effects and leakage to markets elsewhere, as it estimates impacts across three different categories:
Direct Employment and Investment – represents economic impacts (e.g., employment or
output changes) due to the direct investments, such as payments to companies in the relevant
industries for asset categories that apply directly to this study.
Indirect Employment and Expenditures – represents economic impacts due to the industry
inter-linkages caused by the iteration of industries purchasing from other industries, brought
about by changes in final demands (e.g., when pipeline manufacturers purchases steel from
another company).
Induced Employment and Expenditures – represents the economic impacts on local industries
due to consumers’ consumption expenditures arising from the new household incomes that are
generated by the direct and indirect effects of the final demand changes (e.g., a worker
purchases new clothing or purchases food in restaurants).
Considering the total oil and gas infrastructure investment of $1.06 to $1.34 trillion, or $55 to $71 billion
annually, the IMPLAN analysis projects that total direct, indirect, and induced employment, or the total
number of jobs per year across the U.S. will average between 828,,000 and 1,047,,000 for the Base Case
and High Case, respectively (Exhibit 36 and Exhibit 37). These numbers are only for employment
associated with oil and gas infrastructure development. They do not include jobs more broadly across the
upstream and downstream segments of the industry, nor do they include jobs related to operating and
maintaining oil and gas infrastructure, each of which would add millions to the U.S. labor pool.
Nevertheless, the results suggest that oil and gas infrastructure development will be a significant engine
for economic growth in the future.
The projections also show that infrastructure development will directly employ between 277,000 and
350,000 employees. These include employees at companies directly involved with the planning,
designing, and construction of the infrastructure. However, the impacts outside of the companies directly
involved in infrastructure development are also significant, with the projected results showing between
215,000 and 272,000 indirect jobs and between 337,000 and 425,000 induced jobs. In other words,
benefits will be far reaching across the entire U.S. economy.
Infrastructure development drives employment across the country, even as far away as Hawaii where
there are induced employment impacts. The top five states for employment associated with
infrastructure development are Louisiana, Texas, Pennsylvania, California, and Ohio, in that order.
However, Louisiana’s and Texas’ employment numbers are very close to each other, so it’s difficult to
distinguish which state will benefit more from investment in infrastructure development. Also note that
California will have relatively modest direct investment in new infrastructure, so most of its employment

65
benefits will be based on indirect and induced employment impacts that occur from development
occurring elsewhere.
This economic impact analysis also projects that U.S. Gross Domestic Product (GDP) associated with oil
and gas infrastructure development will total $1.50 to $1.89 trillion for the 2017 to 2035 projection period
(Exhibit 38 and Exhibit 39). These values equate to annual average contributions of between $79 and
$100 billion to U.S. GDP; note that annual average tables for Gross State Product (GSP) and taxes are
shown in Appendix D.
Based on Gross State Product information provided in the exhibits, the top five beneficiaries of investment
include Texas, Louisiana, Pennsylvania, California, and Ohio, in that order. These are the same states that
benefited most from an employment standpoint. However, there are also billions of dollars of benefits
to all other states across the U.S.
Federal and State tax coffers are also larger as a result of oil and gas infrastructure investment. Federal
taxes associated with oil and gas infrastructure development will total $304 to $386 billion from 2017 to
2035, and annually, oil and gas infrastructure investment will contribute $16 to $20 billion to federal taxes.
State and local taxes associated with oil and gas infrastructure development will sum to $236 to $299
billion from 2017 through 2035, and annually, oil and gas infrastructure investment will contribute $12 to
$16 billion to state tax coffers. State and local governments will gain tens of billions of dollars from
investments in oil and gas infrastructure.
All of the values from this economic impact analysis flow throughout the U.S. economy, having wide-
ranging benefits for millions of Americans. As aforementioned, this analysis excludes values associated
with operating and maintaining the infrastructure, and it also excludes values associated with the
upstream and downstream segments of the business. However, the oil and gas infrastructure discussed
herein will be critical to those sectors as well. Without development of such oil and gas infrastructure,
the upstream and downstream will be developed less fully over time, and the foregone economic benefits
would be very significant.
Oil and gas infrastructure development also fosters delivery of lower cost energy to households and
businesses, which is another positive economic impact that has not been considered in this analysis. A
more complete and thorough economic impact analysis would consider such benefits, as well as the
foregone benefits for the upstream and downstream segments of the energy business, in addition to the
economic impacts that are discussed herein. Collectively, such economic benefits would be multiples of
impacts shown here.

66
Exhibit 36: Projected Employment (Jobs per Year) for the Base Case
Direct Indirect Induced Total Direct Indirect Induced Total
U.S. 398,620 309,272 485,043 1,192,934 276,786 214,707 336,864 828,357
Alabama 3,472 4,066 6,077 13,615 2,052 2,654 4,106 8,812
Alaska 3,144 1,500 1,689 6,334 1,594 765 1,005 3,364
Arizona 621 2,281 6,505 9,407 581 1,647 4,558 6,786
Arkansas 4,656 3,176 4,090 11,922 1,934 1,587 2,486 6,007
California 12,331 13,707 47,833 73,871 7,223 8,915 32,821 48,959
Colorado 10,858 6,569 9,025 26,452 5,739 3,695 5,779 15,214
Connecticut 157 2,136 6,111 8,404 204 1,529 4,268 6,001
Delaware 1,349 840 1,365 3,554 1,409 830 1,065 3,304
District of Columbia 367 180 1,009 1,556 296 145 712 1,152
Florida 1,200 2,821 18,567 22,588 1,711 2,389 13,124 17,224
Georgia 571 2,059 9,058 11,688 1,228 1,799 6,533 9,560
Hawaii 0 39 1,323 1,363 0 27 919 946
Idaho 565 772 1,681 3,019 660 663 1,240 2,563
Il l inois 10,612 10,868 19,246 40,726 4,103 6,027 12,446 22,576
Indiana 4,550 8,091 10,473 23,113 2,425 5,270 7,069 14,764
Iowa 700 1,568 3,747 6,015 737 1,214 2,666 4,617
Kansas 9,493 5,706 6,032 21,231 6,208 3,796 4,062 14,066
Kentucky 2,192 2,942 5,118 10,252 1,622 2,117 3,564 7,303
Louisiana 96,309 44,294 33,454 174,058 72,774 32,948 25,217 130,940
Maine 154 1,023 1,744 2,921 172 742 1,228 2,142
Maryland 661 1,745 7,467 9,873 1,586 1,700 5,523 8,808
Massachusetts 162 3,391 10,135 13,688 227 2,410 7,067 9,705
Michigan 3,563 8,004 13,109 24,676 2,173 5,420 9,020 16,613
Minnesota 3,096 4,068 7,932 15,096 2,257 2,902 5,514 10,673
Mississippi 4,664 2,606 3,629 10,899 3,088 1,778 2,456 7,321
Missouri 590 2,185 6,339 9,114 714 1,664 4,482 6,860
Montana 2,876 1,466 1,694 6,036 1,557 817 1,049 3,423
Nebraska 761 990 2,430 4,181 919 880 1,789 3,588
Nevada 135 278 2,440 2,852 160 222 1,713 2,095
New Hampshire 127 619 1,799 2,545 144 457 1,264 1,865
New Jersey 5,310 4,915 13,214 23,439 3,216 3,205 9,037 15,458
New Mexico 10,683 5,426 4,619 20,727 6,034 3,120 2,836 11,991
New York 5,980 10,650 28,738 45,369 4,053 7,354 19,926 31,333
North Carolina 1,099 4,378 10,523 16,000 770 3,040 7,310 11,121
North Dakota 10,646 5,504 4,108 20,258 4,672 2,591 2,064 9,327
Ohio 15,099 16,102 19,636 50,836 11,383 11,676 13,834 36,893
Oklahoma 16,475 10,554 9,709 36,738 8,851 6,106 6,038 20,995
Oregon 526 1,918 4,506 6,951 271 1,289 3,102 4,661
Pennsylvania 27,964 22,267 25,408 75,639 29,214 20,299 20,244 69,758
Rhode Island 130 622 1,397 2,149 144 458 984 1,586
South Carolina 1,560 5,728 7,174 14,462 1,303 4,082 5,039 10,424
South Dakota 1,160 869 1,289 3,318 472 439 806 1,717
Tennessee 2,105 3,706 7,574 13,385 1,720 2,715 5,317 9,752
Texas 97,100 55,804 58,077 210,981 61,357 35,755 38,791 135,902
Utah 4,586 2,920 3,946 11,452 2,595 1,763 2,567 6,925
Vermont 127 386 827 1,341 147 297 590 1,033
Virginia 1,412 3,002 10,121 14,536 2,293 2,725 7,376 12,394
Washington 3,768 3,485 9,343 16,596 1,598 1,980 6,182 9,760
West Virginia 5,828 3,992 3,615 13,435 6,264 3,857 3,107 13,229
Wisconsin 1,781 4,166 7,722 13,670 1,085 2,826 5,311 9,223
Wyoming 5,342 2,887 2,376 10,605 3,847 2,118 1,658 7,623
Average 2013-2016 Average 2017-2035

67
Exhibit 37: Projected Employment (Jobs per Year) for the High Case
Direct Indirect Induced Total Direct Indirect Induced Total
U.S. 398,620 309,272 485,043 1,192,934 349,895 272,132 425,195 1,047,222
Alabama 3,470 4,065 6,076 13,611 2,703 3,414 5,216 11,333
Alaska 3,144 1,500 1,689 6,334 1,645 786 1,167 3,598
Arizona 621 2,281 6,505 9,407 617 2,031 5,724 8,373
Arkansas 4,656 3,176 4,090 11,922 3,487 2,522 3,410 9,419
California 12,331 13,707 47,833 73,871 7,163 10,398 40,873 58,435
Colorado 10,858 6,569 9,025 26,452 6,570 4,336 7,112 18,018
Connecticut 157 2,136 6,111 8,404 317 1,967 5,406 7,690
Delaware 1,349 840 1,365 3,554 1,859 1,091 1,363 4,314
District of Columbia 367 180 1,009 1,556 423 207 911 1,541
Florida 1,200 2,821 18,567 22,588 2,523 3,202 16,664 22,389
Georgia 571 2,059 9,058 11,688 1,425 2,228 8,209 11,861
Hawaii 0 39 1,323 1,363 0 35 1,160 1,195
Idaho 565 772 1,681 3,019 707 780 1,531 3,018
Il l inois 10,612 10,868 19,246 40,726 5,461 7,800 15,773 29,034
Indiana 4,550 8,091 10,473 23,113 3,280 6,801 8,981 19,062
Iowa 700 1,568 3,747 6,015 837 1,494 3,342 5,672
Kansas 9,493 5,706 6,032 21,231 6,708 4,241 4,823 15,772
Kentucky 2,195 2,943 5,119 10,257 3,225 3,255 4,809 11,289
Louisiana 96,309 44,294 33,454 174,058 90,918 41,277 31,487 163,682
Maine 154 1,023 1,744 2,921 272 967 1,566 2,804
Maryland 661 1,745 7,467 9,873 1,754 2,048 6,897 10,699
Massachusetts 162 3,391 10,135 13,688 347 3,084 8,942 12,374
Michigan 3,563 8,004 13,109 24,676 2,673 6,833 11,374 20,880
Minnesota 3,096 4,068 7,932 15,096 2,699 3,606 6,922 13,226
Mississippi 4,662 2,605 3,628 10,895 3,965 2,279 3,119 9,363
Missouri 590 2,185 6,339 9,114 754 2,039 5,621 8,414
Montana 2,876 1,466 1,694 6,036 1,761 931 1,270 3,962
Nebraska 761 990 2,430 4,181 1,045 1,060 2,227 4,332
Nevada 135 278 2,440 2,852 166 265 2,153 2,583
New Hampshire 127 619 1,799 2,545 243 609 1,612 2,465
New Jersey 5,310 4,915 13,214 23,439 3,832 3,955 11,343 19,130
New Mexico 10,683 5,426 4,619 20,727 7,341 3,807 3,500 14,648
New York 5,980 10,650 28,738 45,369 5,719 9,614 25,319 40,653
North Carolina 1,099 4,378 10,523 16,000 874 3,805 9,208 13,887
North Dakota 10,646 5,504 4,108 20,258 4,944 2,801 2,348 10,093
Ohio 15,099 16,102 19,636 50,836 15,199 15,189 17,688 48,076
Oklahoma 16,475 10,554 9,709 36,738 11,975 8,124 7,836 27,936
Oregon 526 1,918 4,506 6,951 301 1,615 3,906 5,822
Pennsylvania 27,964 22,267 25,408 75,639 38,080 26,250 25,881 90,211
Rhode Island 130 622 1,397 2,149 242 610 1,259 2,111
South Carolina 1,560 5,728 7,174 14,462 1,675 5,186 6,378 13,239
South Dakota 1,160 869 1,289 3,318 563 540 1,009 2,112
Tennessee 2,107 3,707 7,575 13,390 3,339 4,010 7,020 14,370
Texas 97,100 55,804 58,077 210,981 76,583 44,749 48,723 170,055
Utah 4,586 2,920 3,946 11,452 3,090 2,137 3,191 8,418
Vermont 127 386 827 1,341 247 406 761 1,414
Virginia 1,411 3,002 10,121 14,535 2,634 3,323 9,244 15,201
Washington 3,768 3,485 9,343 16,596 1,604 2,329 7,682 11,615
West Virginia 5,827 3,992 3,615 13,434 9,839 5,818 4,427 20,084
Wisconsin 1,781 4,166 7,722 13,670 1,642 3,717 6,779 12,137
Wyoming 5,342 2,887 2,376 10,605 4,623 2,562 2,031 9,217
Average 2013-2016 Average 2017-2035

68
Exhibit 38: Projected Gross State Product and Taxes for the Base Case (Million 2015$)
GDP
State/Local
Tax
Federal
Tax Total Tax GDP
State/Local
Tax
Federal
Tax Total Tax
U.S. $453,712 $69,468 $79,239 $148,707 $1,496,910 $236,392 $303,990 $540,383
Alabama $5,905 $889 $1,030 $1,918 $18,501 $2,881 $3,762 $6,643
Alaska $1,938 $562 $339 $901 $4,929 $1,481 $1,002 $2,483
Arizona $4,478 $610 $781 $1,391 $15,081 $2,125 $3,061 $5,186
Arkansas $4,264 $636 $743 $1,379 $10,981 $1,691 $2,230 $3,920
California $29,884 $4,749 $5,214 $9,964 $95,286 $15,669 $19,367 $35,036
Colorado $8,988 $1,282 $1,572 $2,854 $25,350 $3,742 $5,161 $8,903
Connecticut $4,213 $575 $736 $1,311 $14,110 $1,991 $2,865 $4,856
Delaware $1,246 $216 $218 $434 $5,246 $940 $1,065 $2,005
District of Columbia $508 $94 $90 $183 $1,777 $338 $360 $698
Florida $9,270 $1,243 $1,619 $2,861 $32,636 $4,519 $6,617 $11,136
Georgia $5,187 $700 $907 $1,607 $19,069 $2,660 $3,856 $6,516
Hawaii $512 $93 $89 $182 $1,690 $316 $343 $660
Idaho $1,308 $181 $228 $410 $4,938 $707 $1,007 $1,714
Il l inois $16,846 $2,575 $2,947 $5,522 $47,766 $7,542 $9,697 $17,239
Indiana $11,271 $1,679 $1,969 $3,649 $35,426 $5,459 $7,203 $12,662
Iowa $2,816 $472 $492 $964 $9,881 $1,709 $2,001 $3,710
Kansas $7,268 $1,134 $1,268 $2,403 $22,919 $3,707 $4,669 $8,375
Kentucky $4,563 $673 $798 $1,471 $15,287 $2,330 $3,104 $5,434
Louisiana $51,737 $7,912 $9,052 $16,964 $184,497 $29,246 $37,470 $66,715
Maine $1,589 $256 $278 $534 $5,390 $896 $1,094 $1,991
Maryland $4,301 $616 $752 $1,368 $16,850 $2,490 $3,385 $5,875
Massachusetts $6,848 $967 $1,196 $2,163 $22,844 $3,333 $4,639 $7,972
Michigan $12,162 $1,860 $2,124 $3,984 $39,428 $6,228 $8,005 $14,233
Minnesota $6,622 $1,104 $1,158 $2,262 $22,021 $3,793 $4,483 $8,276
Mississippi $3,611 $629 $632 $1,261 $11,572 $2,080 $2,355 $4,435
Missouri $4,336 $581 $758 $1,339 $15,013 $2,079 $3,043 $5,122
Montana $1,885 $274 $329 $603 $5,151 $771 $1,044 $1,815
Nebraska $1,787 $275 $312 $586 $6,809 $1,078 $1,378 $2,456
Nevada $1,134 $161 $198 $359 $3,896 $573 $791 $1,364
New Hampshire $1,226 $148 $214 $362 $4,170 $519 $847 $1,366
New Jersey $9,167 $1,404 $1,596 $3,000 $29,121 $4,605 $5,914 $10,519
New Mexico $6,346 $1,210 $1,107 $2,317 $17,814 $3,517 $3,633 $7,149
New York $20,147 $4,072 $3,520 $7,592 $66,221 $13,818 $13,433 $27,251
North Carolina $7,873 $1,192 $1,375 $2,567 $25,983 $4,065 $5,270 $9,335
North Dakota $6,312 $1,424 $1,100 $2,524 $14,293 $3,333 $2,909 $6,241
Ohio $21,708 $3,387 $3,803 $7,191 $73,686 $11,875 $14,946 $26,821
Oklahoma $12,764 $1,686 $2,230 $3,916 $36,085 $4,922 $7,346 $12,268
Oregon $3,418 $570 $597 $1,167 $11,048 $1,903 $2,244 $4,147
Pennsylvania $29,058 $4,226 $5,069 $9,295 $119,526 $17,939 $24,253 $42,192
Rhode Island $1,084 $171 $190 $361 $3,698 $604 $751 $1,355
South Carolina $7,913 $1,351 $1,378 $2,729 $26,602 $4,693 $5,405 $10,097
South Dakota $1,237 $157 $216 $372 $3,266 $426 $660 $1,087
Tennessee $6,163 $756 $1,078 $1,833 $20,937 $2,653 $4,252 $6,905
Texas $70,239 $9,564 $12,248 $21,812 $217,924 $30,753 $44,304 $75,057
Utah $4,028 $647 $702 $1,349 $11,875 $1,970 $2,417 $4,387
Vermont $656 $109 $115 $224 $2,298 $393 $466 $859
Virginia $6,419 $873 $1,122 $1,995 $24,274 $3,407 $4,908 $8,315
Washington $6,586 $962 $1,150 $2,113 $19,312 $2,919 $3,921 $6,840
West Virginia $4,832 $851 $844 $1,695 $21,320 $3,871 $4,316 $8,186
Wisconsin $6,660 $1,029 $1,165 $2,193 $21,545 $3,441 $4,382 $7,824
Wyoming $3,398 $680 $592 $1,272 $11,569 $2,393 $2,360 $4,752
Total 2017-2035Total 2013-2016

69
Exhibit 39: Projected Gross State Product and Taxes for the High Case (Million 2015$)
GDP
State/Local
Tax
Federal
Tax Total Tax GDP
State/Local
Tax
Federal
Tax Total Tax
U.S. $453,712 $69,468 $79,239 $148,707 $1,893,138 $299,313 $385,676 $684,988
Alabama $5,904 $889 $1,030 $1,918 $23,666 $3,692 $4,824 $8,515
Alaska $1,938 $562 $339 $901 $5,302 $1,597 $1,079 $2,676
Arizona $4,478 $610 $781 $1,391 $18,819 $2,657 $3,831 $6,488
Arkansas $4,264 $636 $743 $1,379 $16,322 $2,520 $3,335 $5,856
California $29,884 $4,749 $5,214 $9,964 $115,832 $19,082 $23,600 $42,681
Colorado $8,988 $1,282 $1,572 $2,854 $30,321 $4,489 $6,187 $10,675
Connecticut $4,213 $575 $736 $1,311 $18,012 $2,547 $3,670 $6,217
Delaware $1,246 $216 $218 $434 $6,811 $1,223 $1,388 $2,611
District of Columbia $508 $94 $90 $183 $2,359 $450 $480 $930
Florida $9,270 $1,243 $1,619 $2,861 $42,131 $5,847 $8,575 $14,422
Georgia $5,187 $700 $907 $1,607 $23,832 $3,332 $4,839 $8,171
Hawaii $512 $93 $89 $182 $2,136 $401 $435 $836
Idaho $1,308 $181 $228 $410 $5,953 $854 $1,215 $2,068
Il l inois $16,846 $2,575 $2,947 $5,522 $61,123 $9,667 $12,447 $22,115
Indiana $11,271 $1,679 $1,969 $3,649 $45,423 $7,010 $9,259 $16,269
Iowa $2,816 $472 $492 $964 $12,290 $2,130 $2,497 $4,627
Kansas $7,268 $1,134 $1,268 $2,403 $26,152 $4,240 $5,335 $9,574
Kentucky $4,565 $673 $798 $1,471 $22,087 $3,376 $4,510 $7,886
Louisiana $51,737 $7,912 $9,052 $16,964 $230,619 $36,620 $47,002 $83,622
Maine $1,589 $256 $278 $534 $6,959 $1,160 $1,418 $2,578
Maryland $4,301 $616 $752 $1,368 $20,731 $3,071 $4,185 $7,256
Massachusetts $6,848 $967 $1,196 $2,163 $29,080 $4,252 $5,925 $10,177
Michigan $12,162 $1,860 $2,124 $3,984 $49,761 $7,877 $10,133 $18,010
Minnesota $6,622 $1,104 $1,158 $2,262 $27,528 $4,748 $5,609 $10,357
Mississippi $3,610 $629 $632 $1,261 $14,787 $2,662 $3,016 $5,678
Missouri $4,336 $581 $758 $1,339 $18,664 $2,590 $3,795 $6,385
Montana $1,885 $274 $329 $603 $6,014 $902 $1,221 $2,124
Nebraska $1,787 $275 $312 $586 $8,342 $1,323 $1,691 $3,014
Nevada $1,134 $161 $198 $359 $4,841 $713 $986 $1,699
New Hampshire $1,226 $148 $214 $362 $5,425 $677 $1,106 $1,783
New Jersey $9,167 $1,404 $1,596 $3,000 $36,292 $5,752 $7,392 $13,144
New Mexico $6,346 $1,210 $1,107 $2,317 $21,760 $4,304 $4,443 $8,747
New York $20,147 $4,072 $3,520 $7,592 $85,263 $17,834 $17,360 $35,193
North Carolina $7,873 $1,192 $1,375 $2,567 $32,683 $5,125 $6,651 $11,776
North Dakota $6,312 $1,424 $1,100 $2,524 $15,674 $3,663 $3,193 $6,856
Ohio $21,708 $3,387 $3,803 $7,191 $95,216 $15,383 $19,381 $34,764
Oklahoma $12,764 $1,686 $2,230 $3,916 $47,627 $6,516 $9,720 $16,235
Oregon $3,418 $570 $597 $1,167 $13,902 $2,400 $2,832 $5,231
Pennsylvania $29,058 $4,226 $5,069 $9,295 $153,956 $23,173 $31,370 $54,543
Rhode Island $1,084 $171 $190 $361 $4,826 $790 $984 $1,774
South Carolina $7,913 $1,351 $1,378 $2,729 $33,793 $5,975 $6,886 $12,861
South Dakota $1,237 $157 $216 $372 $4,051 $529 $822 $1,351
Tennessee $6,165 $756 $1,078 $1,834 $29,223 $3,713 $5,964 $9,676
Texas $70,239 $9,564 $12,248 $21,812 $272,969 $38,609 $55,638 $94,247
Utah $4,028 $647 $702 $1,349 $14,543 $2,418 $2,967 $5,384
Vermont $656 $109 $115 $224 $3,054 $524 $623 $1,146
Virginia $6,419 $873 $1,122 $1,995 $30,100 $4,234 $6,109 $10,343
Washington $6,586 $962 $1,150 $2,113 $23,463 $3,552 $4,776 $8,328
West Virginia $4,832 $851 $844 $1,695 $31,432 $5,728 $6,406 $12,134
Wisconsin $6,660 $1,029 $1,165 $2,193 $27,932 $4,469 $5,695 $10,164
Wyoming $3,398 $680 $592 $1,272 $14,056 $2,914 $2,872 $5,787
Total 2017-2035Total 2013-2016

70
6 Conclusions
There has been $390 billion invested in oil and gas infrastructure over the past five years, equating to an
average annual investment of roughly $78 billion. Indeed, it has been a very robust period for
infrastructure development, and many have wondered whether such levels of investment and
development can continue.
Recent declines in oil and natural gas prices, driven by supply-demand dynamics, among other factors,
have created an environment of great uncertainty for future energy investments, including investments
in the midstream space. This study investigates investment in oil and gas infrastructure, and concludes
that robust infrastructure development is likely to continue for a prolonged period of time. It also
concludes that the robust investment in oil and gas infrastructure will have significant positive impacts for
the U.S. economy.
To assess infrastructure development, the study considers both a “Base Case” and “High Case”. Each of
these scenarios are plausible representations of how the market may evolve over time. They provide an
assessment of how much infrastructure will be needed across time, by type of infrastructure, and by
region.
In each scenario, growth in shale gas and tight oil production continues, and production growth from cost-
effective plays like the Marcellus and Utica in the Northeast U.S. and the Permian Basin in West Texas will
be the main driver of oil and gas infrastructure development. Robust supply growth will continue to foster
increased output from U.S. refineries, development of natural gas liquid (NGL) and liquefied natural gas
(LNG) exports, incremental exports of natural gas to Mexico, new petrochemical facilities spread across
the Northeast and near the Gulf Coast, and increases in gas-fired power generation. These factors, in
turn, support oil and gas infrastructure development.
Summary of Scenario Trends
The supply and demand trends that underpin the study’s scenarios and infrastructure development are summarized below:
The Base Case and High Case both project significant supply and market growth, but the amount
of growth differs between the cases.
In aggregate, U.S. oil production is relatively constant in the Base Case, but increases by roughly
4 million barrels per day or by roughly 50 percent in the High Case. Tight oil supplies are a focus
for development in each case.
Natural gas production grows from roughly 70 billion cubic feet per day at present to over 110
billion cubic feet per day by 2035 in the Base Case, and to over 130 billion cubic feet per day in
the High Case.

71
NGL production is projected to grow to 6 to 7 million barrels per day by 2035 from the current
level of roughly 3 million barrels per day.
Refinery output will increase from a little over 16 million barrels per day at present to between
17 and 19 million barrels per day by 2035, driven by development of U.S. tight oil supplies.
Natural gas market growth is strong in each scenario. The total market growth is underpinned by
growth in LNG exports and exports to Mexico, growth in gas use as a fuel and feedstock in
petrochemical facilities, and growth in gas-fired power generation.
NGL market growth is also substantial in each scenario with new ethane crackers and poly-
propylene facilities being added to the mix, and incremental export capability being developed
over time.
Between 3.0 and 5.0 million barrels per day of new oil transport capacity is placed into service in
each of the scenarios.
Between 49 and 68 billion cubic feet per day of new natural gas transport capacity will be needed
to support the levels of gas production and associated market growth projected through 2035.
Between 1.8 and 2.6 million barrels per day of new NGL transport capacity will be needed to
support the levels of NGL production and associated market growth projected through 2035.
Summary of Projected Infrastructure Development
Total capital expenditures for oil and gas infrastructure from 2017 to 2035 are projected to be $1.06 and
$1.34 trillion, equating to annual averages of $56 to $71 billion. In the Base Case, roughly 45 percent of
the investment is attributed to natural gas infrastructure development, roughly 49 percent is attributed
to oil infrastructure development, and the remaining investment is attributed to NGL infrastructure
development. In the High Case, natural gas infrastructure development rises to 49 percent of the total
investment, while oil infrastructure development falls to 45 percent of the total, and NGL infrastructure
development remains at about the same percent as in the Base Case.
A summary of infrastructure investment by category follows:
Surface and Lease Equipment will account for the largest portion of infrastructure development
with a CAPEX of $318 to $365 over the investment horizon. The CAPEX is fairly equally split
between onshore and offshore development, with investment in lease equipment for an average
of 24,075 to 28,175 new wells and 9 to 10 new oil platforms each year.
Oil, gas, and NGL pipelines come in second with a total CAPEX of $234 to $362 billion throughout
the projection. Within this infrastructure category, investment is greatest for natural gas pipelines
with a CAPEX totaling $190 to $290 billion throughout the projection. Roughly 1,400 to 2,400
miles of natural gas pipeline are built each year, with a total of between 27,000 to 46,000 miles
put in place throughout the projection.

72
Gathering and processing is third with a total CAPEX of $236 to $280 billion over the projection.
The scenarios project 11,485 to 12,612 miles of gathering line, 1.2 to 1.5 million horsepower of
compression, 3.7 to 4.5 billion cubic feet per day of processing plant capacity, and 256,000 to
335,000 million barrels per day of fractionation plant capacity will be added or replaced each year
throughout the forecast period.
Refining and oil products transport ranks fourth with a total CAPEX of $196 to $217 billion during
the projection. The vast majority of the investment in this category is for refinery enhancements,
upgrades, replacements, and refurbishments, with annual expenditures averaging $9.42 to $10.2
billion.
LNG and NGL exports rank fifth among the categories with a total CAPEX of $55 to $93 billion. The
scenarios increase LNG exports to between 10 and 19 billion cubic feet per day after 2025. The
scenarios also add 45,300 and 76,000 barrels per day of NGL export capacity each year.
Oil and gas storage ranks last among the investment categories with a total CAPEX of $21.1 to
$25.5 billion. Much of the investment in this category is for replacement of natural gas storage
injection and withdrawal wells related to well integrity management programs.
Regionally, the largest portion of infrastructure development occurs in the Southwest, with investment
for the area totaling $381 to $501 billion over the projection. Investment for this area is widespread
across a number of infrastructure categories. The Northeast ranks second with total investment of $204
to $278 billion. The largest portion of the expenditures for this area are for gas pipelines to transport
Marcellus/Utica production to markets. However, gathering and processing investments are also quite
significant in this area. Offshore investment ranks third among the regions, with a total CAPEX of $177 to
$204 billion. Collectively, all other areas project total investment in oil and gas infrastructure of $296 to
$360 billion.
Summary of the Economic Impact Analysis
The study also assesses economic benefits of the projected infrastructure development. Economic benefits of oil and gas infrastructure development are very significant, as highlighted below:
The total investment of $1.06 to $1.34 trillion adds $1.50 to $1.89 trillion to U.S. Gross Domestic
Product (GDP) from 2017 through 2035.
Gross State Products increase across the U.S., and the five states that benefit most from the
infrastructure development include Texas, Louisiana, Pennsylvania, California, and Ohio, in that
order.
Federal and State tax coffers are also larger as a result of oil and gas infrastructure investment.
Federal taxes associated with infrastructure development will total $304 to $386 billion, and state
and local taxes associated with development will sum to $236 to $299 billion from 2017 through
2035.

73
The level of employment (i.e., the number of jobs) supported by infrastructure development
averages 828,000 to 1,047,000 each year throughout the projection. There are an average of
277,000 to 350,000 employees directly supported by the development. But, employment impacts
are widespread across the U.S. as there are also indirect and induced labor impacts included in
the job totals.
These employment and GSP benefits do not consider employment in the upstream and
downstream portions of the oil and gas business, nor do they consider the operation and
maintenance of the infrastructure. Those unconsidered segments would account for millions of
jobs and significant contribution to GSP, which would add to the totals discussed here.
Infrastructure development will have wide-ranging benefits for millions of Americans. The
midstream business is critical to the growth of the upstream and downstream portions of the oil
and gas business. Without adequate infrastructure to support processing and transport of oil and
gas, the upstream and downstream will develop less fully over time, and the foregone economic
benefits would be very significant. In addition, oil and gas infrastructure development fosters
delivery of lower cost energy to households and businesses, which is another positive economic
impact that has not been considered in this analysis.

74
Appendix A: ICF Modeling Tools
Gas Market Model (GMM)
ICF’s Gas Market Model (GMM) is an internationally recognized modeling and market analysis system for the North American gas market. The GMM was developed by Energy and Environmental Analysis, Inc., now a wholly owned business unit within ICF, in the mid-1990s to provide forecasts of the North American natural gas market under different assumptions. In its infancy, the model was used to simulate changes in the gas market that occur when major new sources of gas supply are delivered into the marketplace.
The GMM has been used to complete strategic planning studies for many private sector companies. The different studies include:
Analyses of different pipeline expansions;
Measuring the impact of gas-fired power generation growth;
Assessing the impact of low and high gas supply; and
Assessing the impact of different regulatory environments.
In addition to its use for strategic planning studies, the model has been widely used by a number of institutional clients and advisory councils, including the recent Interstate Natural Gas Association of America (INGAA) study. The model was also the primary tool used to complete the widely referenced study on the North American Gas market for the National Petroleum Council in 2003.
GMM is a full supply/demand equilibrium model of the North American gas market. The model solves for monthly natural gas prices throughout North America, given different supply/demand conditions, the assumptions for which are specified by the user.
There are nine different components of ICF’s model, as shown in (Exhibit 40). The inputs for the model are provided through a “drivers” spreadsheet. The user provides assumptions for weather, economic growth, oil prices, and gas supply deliverability, among other variables. ICF’s market reconnaissance keeps the model up to date with generating capacity, storage and pipeline expansions, and the impact of regulatory changes in gas transmission. This is important to maintaining model credibility and confidence of results.
Overall, the model solves for monthly market clearing prices by considering the interaction between supply and demand curves at each of the model’s nodes. On the supply side of the equation, prices are determined by production and storage price curves that reflect prices as a function of production and storage utilization (Exhibit 41). Total U.S. and Canadian gas supplies include production, LNG imports, and storage withdrawals (in the withdrawal season only).1 Gas production is solved in 81 distinct regions throughout the United States and Canada, and is represented by both short- and long-run supply curves. In the short run (i.e., the current month), gas production is bound by the amount of available productive capacity. In the long run, productive capacity changes as a function of the available gas resource, the cost of development, and the solved gas price. North American LNG imports and exports are exogenously
1 Storage withdrawals are solved within the model based on “storage supply curves” that reflect the level of withdrawals relative to gas prices. The curves have been fit to historical price and withdrawal data.

75
specified by the selected scenario. For each modeling, ICF includes its own projection of North American LNG imports and export by terminal.
Prices are also influenced by “pipeline discount” curves, which reflect the change in basis or the marginal value of gas transmission as a function of the load factor of the pipeline corridor. The structure of the transmission network is shown in (Exhibit 42). The discount curves have been empirically fit to historic basis values and pipeline load factors on each pipeline corridor. Pipeline capacity expansions are exogenously specified for each scenario.
Exhibit 40: GMM Structure
Source: ICF GMM®
Exhibit 41: Natural Gas Supply and Demand Curves in the GMM
Source: ICF GMM®

76
On the demand-side of the equation, prices are represented by a curve that captures the fuel-switching behavior of end-users at different price levels. The gas demand routine solves for gas demand across different sectors, given economic growth, weather, and the level of price competition between gas and oil. The electric power module solves for the power generation dispatch on a regional basis to determine the amount of gas used in power generation, which is allocated along with end-use gas demand to model nodes. The GMM forecast for power generation is consistent with ICF’s Integrated Planning Model (IPM®), and the GMM power module allows for elasticity around IPM results to allow for seasonal/monthly variations. The GMM provides IPM with gas supply curves and basis that is used to determine gas prices for power plants within the IPM framework. The demand forecast for gas in the power sector from the IPM is then used as a benchmark to iterate both models until the gas prices and gas demand from power plants are converged in both models. Furthermore, IPM provides coal and oil retirements, and generation forecast from nuclear, hydro, and non-hydro renewables that is used in the GMM electric power model.
The GMM balances supply and demand at all nodes in the model at the market clearing prices determined by the shape of the supply, demand, and transportation curves. The model nodes are tied together by a series of network links in the gas transportation module. The gas supply component of the model solves for node-level natural gas deliverability or supply capability, including LNG import levels. The model solves for gas storage injections and withdrawals at different gas prices. The components of supply (i.e., gas deliverability, storage withdrawals, supplemental gas, LNG imports, and imports to Mexico) are balanced against demand (i.e., end-use demand, power generation gas demand, LNG exports, and exports to Mexican) at each of the nodes and gas prices are solved for in the market simulation module.
Unlike other commercially available models for the gas industry, ICF does significant backcasting (calibration) of the model’s curves and relationships on a monthly basis to make sure that the model reliably reflects historical gas market behavior, instilling confidence in the projected results.
Exhibit 42: GMM Transmission Network
Source: ICF GMM®

77
Detailed Production Report (DPR)
ICF’s Detailed Production Report (DPR) is a gas and oil vintage well production model that provides a complete outlook for U.S. and Canada natural gas, natural gas liquids (NGLs), and crude oil (Exhibit 43). The DPR presents annual production projections for more than 50 basins throughout the U.S. and Canada, and includes total production for both the U.S. and Canada. The report’s gas production projections are linked to ICF’s Natural Gas-Strategic Outlook, which provides additional insight into the future of the North American natural gas market.
The DPR contains many findings that will be of interest to oil and gas producers, field services companies, and the investment community, including:
Projected gas, oil, and NGL production by year and by region through 2035.
Projected gas and oil well activity by year and region through 2035.
Vintage production charts for each region, showing how production changes over time.
Estimated ultimate recovery (EUR) statistics for oil, gas, and NGLs wells by region.
The DPR was developed by ICF in the 2011 and its forecasts have been widely used by a number of institutional clients and advisory councils. INGAA midstream infrastructure studies in 2011, 2014, and 2016 relied on the DPR for natural gas, NGL, and oil production trends based on projections of gas and oil drilling activity to assess midstream infrastructure needs in the U.S. and Canada through 2035. The DPR’s historical gas/oil well completions, gas/NGLs/crude oil production, and gas-to-liquids ratio are calibrated to most recent statistics. The historical data is also used to estimate gas/NGLs/crude oil EURs. The main drivers for DPR forecasts are gas production forecasts from ICF’s Gas Market Model (GMM) and expected gas and oil well production decline curves (Exhibit 44). The GMM node-level annual gas production is mapped to each of the 56 DPR plays/production basins and broken out by gas resource type (Exhibit 45). DPR projections are also affected by assumptions for expected gas versus oil directed drilling ratio over time, EUR improvements due to advancement in horizontal drilling and hydraulic fracturing technology, EUR reductions that occur as drilling activities move away from sweet spots, and changes to production decline profiles due to changes in production operation such as “well throttling” implemented to improve EURs.

78
Exhibit 43: Example Vintage Production from DPR
Source: ICF
Exhibit 44: Example Oil and Gas Well Decline Curves
Source: ICF

79
Exhibit 45: Example Breakout of Gas Production by Type
Source: ICF
NGL Transport Model (NGLTM)
ICF has developed a Natural Gas Liquids Transport Model (NGLTM) to represent the annual transport of NGLs in the U.S. and Canada. The model can move “raw mix” NGLs and “pure” NGLs products between supply areas and market areas along active corridors representing existing or future pipeline paths, as well as existing and future paths for rail movement of NGLs. Imports and exports of NGL products are also represented in the model framework. NGL production is based on ICF’s Detailed Production Report. Excess production is moved from growing supply areas to the dominant NGL demand centers along the Gulf coast. Imports and exports of pure NGL products bring the market areas into balance. NGLTM also includes estimates of ethane rejection due to growing production that outpaces demand and infrastructure growth.
The NGLTM contains 27 supply/demand areas for the U.S. and Canada (Exhibit 46). The areas are connected by roughly 200 corridors representing individual pipeline projects and other forms of available transport (truck, rail, and ship) to move both raw NGLs (y-mix) and pure NGLs products like Ethane and Propane from production areas to demand areas.
The model minimizes the cost of transport between areas using mileage-based transport costs
with pipelines assumed to have significantly lower unit costs of transport than rail and truck
transport.
The model solves for annual NGL flows between areas. Raw mix and purity movements are
accounted for separately.

80
Capacity on individual NGL pipelines and pipeline expansion projects are often represented
separately. Pipeline capacity for petroleum products pipelines that move NGLs, rich gas natural
gas pipelines, or crude lines that transport raw mix or diluent products may also be represented
in the model as NGLs transport capacity.
Annual supply, demand, and imports/exports of NGLs are set by assumption or from other
publically available analyses using ICF’s models and forecasting tools.
Since the model is solving for annual transport, short term or seasonal storage of NGLs in raw or
purity form is not considered.
Capacity for transporting NGLs within each supply/demand area is not specifically modeled, but
intra-area projects may be included to estimate total pipeline infrastructure costs.
Refined petroleum products like gasoline or diesel fuel are not included in the movements of this
model, but refined bi-products which resemble the heavier NGLs and can be used as diluents to
Canadian oil sands crude are represented.
The model contains a historical stack of capacity currently available and planned for the future. Actual or announced costs of pipeline projects are included where available, and costs for expansions and new pipelines are estimated by ICF. Additional unplanned capacity that is required to balance production with demand is added based on ICF’s judgment and knowledge of NGL markets.
Exhibit 46: NGLTM Paths
Source: ICF

81
Crude Oil Transport Model (COTM)
ICF has developed a Crude Oil Transport Model (COTM) to represent annual transport of crude oil in the U.S. and Canada. The model can move crude oil between supply areas and market areas along active corridors representing existing or future pipeline paths, as well as existing and future paths for rail movements of crude oil. Imports and exports of crude oil are also represented in the model framework. The COTM contains 32 supply/demand areas for the U.S. and Canada (Exhibit 47). Crude oil production is based on ICF’s Detailed Production Report. Excess production is moved from growing supply areas to the dominant oil demand centers (i.e., refineries) along the Gulf Coast. Imports and exports of crude oil bring the market areas into balance.
Exhibit 47: COTM Paths
Source: ICF
The supply and demand areas are connected by over 250 corridors representing individual pipeline projects and other forms of available transport (truck, rail, and ship) to move crude oil from production areas to demand areas. .
Refinery capacity is not assumed to grow. However, refineries may enhance their capacity to
accommodate increased refinery input and changing crude slates over time.

82
U.S. refinery input is based on EIA AEO projections. Canada refinery input is held constant at
historical levels.
Net imports into Canada can be negative, which means crude can be exported from the east and
west coasts of Canada.
Net imports to the U.S. Gulf Coast can fall to 0 MBPD.
The model considers exports of crude (negative imports) from the U.S. Gulf Coast.
Pipeline and railroad capacity along each corridor is specified as an input. Existing capacity is
augmented by a stack of announced projects in the U.S. and Canada. Additional unplanned
projects are added to permit markets to balance or facilitate export of oil.
Rates for transport are based on each corridor’s mileage and based on ICF’s proprietary cost
information. ICF assumes that rail corridor rates include additional costs for loading and
unloading.
The model contains a historical stack of capacity currently available and planned for the future. Actual or announced costs of pipeline projects are included where available and costs for expansions and new pipelines are estimated by ICF. Additional unplanned capacity required to balance the production with demand is added based on ICF’s judgment and knowledge of individual crude markets.

83
Appendix B: Details for Infrastructure Development
New Infrastructure and E/U/R/R
Exhibit 48: U.S. (Base Case) - New Infrastructure & E/U/R/R
Total
2012-2016
Total
2017-2035
Average
2012-2016
Average
2017-2035
Gas Well Completions 38,609 151,302 7,722 7,963
Oil Well Completions 128,666 306,132 25,733 16,112
Total Well Completions 167,275 457,433 33,455 24,075
Gas Production (Bcfd) 70.3 97.3 70.3 97.3
Crude Oil Production (MMBbl/d) 8.22 8.81 8.22 8.81
NGL Production (MMBbl/d) 2.97 5.04 2.97 5.04
Offshore Platform Capacity (MBOE/d) 3,091 8,454 618 445
Gas Gathering Line Miles 62,056 157,743 12,411 8,302
Gas Gathering Line Diameter (Inch) 5.4 6.2 5.4 6.2
Gas Gathering Line Compressor (1000 HP) 5,123 17,942 1,025 944
Oil Gathering Line Miles 23,617 60,475 4,723 3,183
Oil Gathering Line Diameter (Inch) 4.1 4.9 4.1 4.9
Oil & Gas Gathering Line Miles 85,673 218,218 17,135 11,485
Oil & Gas Gathering Line Diameter (Inch) 5.0 5.9 5.0 5.9
Gas Processing Plant Capacity (Bcfd) 33.1 69.6 6.6 3.7
Gas Processing Plant Compressor (1000 HP) 2,603 4,849 521 255
NGL Fractionation Capacity (MBOE/d) 1,885 4,866 377 256
Oil Line Miles 10,950 5,108 2,190 269
Oil Line Diameter (Inch) 19.5 26.0 19.5 26.0
Pump for Oil Lines (1000 HP) 1,852 1,738 370 91
NGL Line Miles 13,883 6,449 2,777 339
NGL Line Diameter (Inch) 15.8 15.0 15.8 15.0
Pump for NGL Lines (1000 HP) 491 710 98 37
Gas Line Miles 8,135 26,682 1,627 1,404
Gas Line Diameter (Inch) 23.3 23.0 23.3 23.0
Compressor for Gas Lines (1000 HP) 722 524 722 524
Oil, Gas, and NGL Line Miles 32,968 38,240 6,594 2,013
Oil, Gas, and NGL Line Diameter (Inch) 18.9 22.1 18.9 22.1
Crude Oil Storage Capaciy (MBbl) 207,525 265,409 41,505 13,969
Gas Storage Capacity (Bcf) 552 1,147 110 60
Refining Capacity Enhancement (1000 BPD) 4,590 14,815 918 780
Oil Product Pipeline Miles 3,361 3,225 672 170
Oil Product Pipeline Diameter (Inch) 12.7 13.5 12.7 13.5
Oil Product Pipeline Pump (1000 HP) 1,239 3,079 248 162
Crude Oil Rails Terminal Loading/Unloading Capacity (1000 BPD) 1,365 146 273 8
LNG Export Capacity (Bcfd) 1.4 10.3 0.3 0.5
NGL Export Capacity (MBOE/d) 766.7 860.0 153.3 45.3
Export Terminals
Refining and Oil Products Transport
Oil and Gas Storage
Oil, Gas, and NGL Pipelines
Gathering and Processing
Surface and Lease Equipment

84
Exhibit 49: U.S. (High Case) - New Infrastructure & E/U/R/R
Total
2012-2016
Total
2017-2035
Average
2012-2016
Average
2017-2035
Gas Well Completions 38,609 152,205 7,722 8,011
Oil Well Completions 128,666 383,112 25,733 20,164
Total Well Completions 167,275 535,317 33,455 28,175
Gas Production (Bcfd) 70.3 107.3 70.3 107.3
Crude Oil Production (MMBbl/d) 8.22 11.55 8.22 11.55
NGL Production (MMBbl/d) 2.97 5.80 2.97 5.80
Offshore Platform Capacity (MBOE/d) 3,091 9,728 618 512
Gas Gathering Line Miles 62,056 173,336 12,411 9,123
Gas Gathering Line Diameter (Inch) 5.4 6.2 5.4 6.2
Gas Gathering Line Compressor (1000 HP) 5,123 22,092 1,025 1,163
Oil Gathering Line Miles 23,617 66,300 4,723 3,489
Oil Gathering Line Diameter (Inch) 4.1 5.0 4.1 5.0
Oil & Gas Gathering Line Miles 85,673 239,637 17,135 12,612
Oil & Gas Gathering Line Diameter (Inch) 5.0 5.8 5.0 5.8
Gas Processing Plant Capacity (Bcfd) 33.1 84.9 6.6 4.5
Gas Processing Plant Compressor (1000 HP) 2,603 6,217 521 327
NGL Fractionation Capacity (MBOE/d) 1,885 6,370 377 335
Oil Line Miles 10,950 7,416 2,190 390
Oil Line Diameter (Inch) 19.5 27.6 19.5 27.6
Pump for Oil Lines (1000 HP) 1,852 2,694 370 142
NGL Line Miles 13,883 10,911 2,777 574
NGL Line Diameter (Inch) 15.8 15.4 15.8 15.4
Pump for NGL Lines (1000 HP) 491 817 98 43
Gas Line Miles 8,135 45,776 1,627 2,409
Gas Line Diameter (Inch) 23.3 22.5 23.3 22.5
Compressor for Gas Lines (1000 HP) 722 596 722 596
Oil, Gas, and NGL Line Miles 32,968 64,103 6,594 3,374
Oil, Gas, and NGL Line Diameter (Inch) 18.9 21.9 18.9 21.9
Crude Oil Storage Capaciy (MBbl) 207,525 364,984 41,505 19,210
Gas Storage Capacity (Bcf) 552 1,392 110 73
Refining Capacity Enhancement (1000 BPD) 4,590 16,198 918 853
Oil Product Pipeline Miles 3,361 4,808 672 253
Oil Product Pipeline Diameter (Inch) 12.7 13.6 12.7 13.6
Oil Product Pipeline Pump (1000 HP) 1,239 3,409 248 179
Crude Oil Rails Terminal Loading/Unloading Capacity (1000 BPD) 1,365 146 273 8
LNG Export Capacity (Bcfd) 1.4 20.2 0.3 1.1
NGL Export Capacity (MBOE/d) 766.7 1,443.6 153.3 76.0
Gathering and Processing
Surface and Lease Equipment
Oil, Gas, and NGL Pipelines
Oil and Gas Storage
Refining and Oil Products Transport
Export Terminals

85
Exhibit 50: Alaska (Base Case) - New Infrastructure & E/U/R/R
Total
2012-2016
Total
2017-2035
Average
2012-2016
Average
2017-2035
Gas Well Completions 25 53 5 3
Oil Well Completions 490 741 98 39
Total Well Completions 515 793 103 42
Gas Production (Bcfd) 0.9 0.8 0.9 0.8
Crude Oil Production (MMBbl/d) 0.48 0.34 0.48 0.34
NGL Production (MMBbl/d) 0.02 0.02 0.02 0.02
Offshore Platform Capacity (MBOE/d) 0 0 0 0
Gas Gathering Line Miles 121 219 24 12
Gas Gathering Line Diameter (Inch) 9.3 10.8 9.3 10.8
Gas Gathering Line Compressor (1000 HP) 308 597 62 31
Oil Gathering Line Miles 161 370 32 19
Oil Gathering Line Diameter (Inch) 7.9 7.9 7.9 7.9
Oil & Gas Gathering Line Miles 282 588 56 31
Oil & Gas Gathering Line Diameter (Inch) 8.5 9.0 8.5 9.0
Gas Processing Plant Capacity (Bcfd) 1.4 2.7 0.3 0.1
Gas Processing Plant Compressor (1000 HP) 60 112 12 6
NGL Fractionation Capacity (MBOE/d) 3 0 1 0
Oil Line Miles 13 41 3 2
Oil Line Diameter (Inch) 15.8 18.0 15.8 18.0
Pump for Oil Lines (1000 HP) 9 32 2 2
NGL Line Miles 0 0 0 0
NGL Line Diameter (Inch) 12.0 0.0 12.0 0.0
Pump for NGL Lines (1000 HP) 0 0 0 0
Gas Line Miles 5 17 1 1
Gas Line Diameter (Inch) 15.0 12.1 15.0 12.1
Compressor for Gas Lines (1000 HP) 0 0 0 0
Oil, Gas, and NGL Line Miles 18 58 4 3
Oil, Gas, and NGL Line Diameter (Inch) 16.0 16.3 16.0 16.3
Crude Oil Storage Capaciy (MBbl) 2,158 4,349 432 229
Gas Storage Capacity (Bcf) 0 0 0 0
Refining Capacity Enhancement (1000 BPD) 48 140 10 7
Oil Product Pipeline Miles 10 9 2 0
Oil Product Pipeline Diameter (Inch) 9.0 10.3 9.0 10.3
Oil Product Pipeline Pump (1000 HP) 3 7 1 0
Crude Oil Rails Terminal Loading/Unloading Capacity (1000 BPD) 0 0 0 0
LNG Export Capacity (Bcfd) 0.0 0.0 0.0 0.0
NGL Export Capacity (MBOE/d) 0.0 0.0 0.0 0.0
Oil and Gas Storage
Export Terminals
Refining and Oil Products Transport
Gathering and Processing
Oil, Gas, and NGL Pipelines
Surface and Lease Equipment

86
Exhibit 51: Alaska (High Case) - New Infrastructure & E/U/R/R
Total
2012-2016
Total
2017-2035
Average
2012-2016
Average
2017-2035
Gas Well Completions 25 23 5 1
Oil Well Completions 490 571 98 30
Total Well Completions 515 594 103 31
Gas Production (Bcfd) 0.9 0.8 0.9 0.8
Crude Oil Production (MMBbl/d) 0.48 0.59 0.48 0.59
NGL Production (MMBbl/d) 0.02 0.02 0.02 0.02
Offshore Platform Capacity (MBOE/d) 0 0 0 0
Gas Gathering Line Miles 121 193 24 10
Gas Gathering Line Diameter (Inch) 9.3 10.9 9.3 10.9
Gas Gathering Line Compressor (1000 HP) 308 597 62 31
Oil Gathering Line Miles 161 319 32 17
Oil Gathering Line Diameter (Inch) 7.9 7.9 7.9 7.9
Oil & Gas Gathering Line Miles 282 512 56 27
Oil & Gas Gathering Line Diameter (Inch) 8.5 9.0 8.5 9.0
Gas Processing Plant Capacity (Bcfd) 1.4 2.7 0.3 0.1
Gas Processing Plant Compressor (1000 HP) 60 112 12 6
NGL Fractionation Capacity (MBOE/d) 3 0 1 0
Oil Line Miles 13 41 3 2
Oil Line Diameter (Inch) 15.8 18.0 15.8 18.0
Pump for Oil Lines (1000 HP) 9 32 2 2
NGL Line Miles 0 0 0 0
NGL Line Diameter (Inch) 12.0 0.0 12.0 0.0
Pump for NGL Lines (1000 HP) 0 0 0 0
Gas Line Miles 5 17 1 1
Gas Line Diameter (Inch) 15.0 12.1 15.0 12.1
Compressor for Gas Lines (1000 HP) 0 0 0 0
Oil, Gas, and NGL Line Miles 18 58 4 3
Oil, Gas, and NGL Line Diameter (Inch) 16.0 16.3 16.0 16.3
Crude Oil Storage Capaciy (MBbl) 2,158 4,349 432 229
Gas Storage Capacity (Bcf) 0 0 0 0
Refining Capacity Enhancement (1000 BPD) 48 159 10 8
Oil Product Pipeline Miles 10 15 2 1
Oil Product Pipeline Diameter (Inch) 9.0 10.0 9.0 10.0
Oil Product Pipeline Pump (1000 HP) 3 8 1 0
Crude Oil Rails Terminal Loading/Unloading Capacity (1000 BPD) 0 0 0 0
LNG Export Capacity (Bcfd) 0.0 0.0 0.0 0.0
NGL Export Capacity (MBOE/d) 0.0 0.0 0.0 0.0
Surface and Lease Equipment
Gathering and Processing
Oil, Gas, and NGL Pipelines
Oil and Gas Storage
Export Terminals
Refining and Oil Products Transport

87
Exhibit 52: Central (Base Case) - New Infrastructure & E/U/R/R
Total
2012-2016
Total
2017-2035
Average
2012-2016
Average
2017-2035
Gas Well Completions 6,973 20,588 1,395 1,084
Oil Well Completions 38,290 69,050 7,658 3,634
Total Well Completions 45,262 89,638 9,052 4,718
Gas Production (Bcfd) 15.4 15.7 15.4 15.7
Crude Oil Production (MMBbl/d) 1.82 1.72 1.82 1.72
NGL Production (MMBbl/d) 0.57 0.74 0.57 0.74
Offshore Platform Capacity (MBOE/d) 0 0 0 0
Gas Gathering Line Miles 16,245 37,541 3,249 1,976
Gas Gathering Line Diameter (Inch) 5.7 6.6 5.7 6.6
Gas Gathering Line Compressor (1000 HP) 842 1,854 168 98
Oil Gathering Line Miles 5,883 19,773 1,177 1,041
Oil Gathering Line Diameter (Inch) 4.4 4.7 4.4 4.7
Oil & Gas Gathering Line Miles 22,128 57,313 4,426 3,016
Oil & Gas Gathering Line Diameter (Inch) 5.4 5.9 5.4 5.9
Gas Processing Plant Capacity (Bcfd) 5.4 10.1 1.1 0.5
Gas Processing Plant Compressor (1000 HP) 352 492 70 26
NGL Fractionation Capacity (MBOE/d) 215 379 43 20
Oil Line Miles 3,125 2,242 625 118
Oil Line Diameter (Inch) 17.7 29.7 17.7 29.7
Pump for Oil Lines (1000 HP) 363 559 73 29
NGL Line Miles 1,722 266 344 14
NGL Line Diameter (Inch) 12.7 14.5 12.7 14.5
Pump for NGL Lines (1000 HP) 113 103 23 5
Gas Line Miles 1,318 2,404 264 127
Gas Line Diameter (Inch) 16.0 19.4 16.0 19.4
Compressor for Gas Lines (1000 HP) 64 73 64 73
Oil, Gas, and NGL Line Miles 6,165 4,912 1,233 259
Oil, Gas, and NGL Line Diameter (Inch) 16.0 23.8 16.0 23.8
Crude Oil Storage Capaciy (MBbl) 65,946 68,586 13,189 3,610
Gas Storage Capacity (Bcf) 108 144 22 8
Refining Capacity Enhancement (1000 BPD) 318 1,016 64 53
Oil Product Pipeline Miles 1,052 530 210 28
Oil Product Pipeline Diameter (Inch) 10.1 11.3 10.1 11.3
Oil Product Pipeline Pump (1000 HP) 329 652 66 34
Crude Oil Rails Terminal Loading/Unloading Capacity (1000 BPD) 160 0 32 0
LNG Export Capacity (Bcfd) 0.0 0.0 0.0 0.0
NGL Export Capacity (MBOE/d) 0.0 0.0 0.0 0.0
Export Terminals
Refining and Oil Products Transport
Oil and Gas Storage
Oil, Gas, and NGL Pipelines
Gathering and Processing
Surface and Lease Equipment

88
Exhibit 53: Central (High Case) - New Infrastructure & E/U/R/R
Total
2012-2016
Total
2017-2035
Average
2012-2016
Average
2017-2035
Gas Well Completions 6,973 20,913 1,395 1,101
Oil Well Completions 38,290 74,350 7,658 3,913
Total Well Completions 45,262 95,263 9,052 5,014
Gas Production (Bcfd) 15.4 16.9 15.4 16.9
Crude Oil Production (MMBbl/d) 1.82 2.15 1.82 2.15
NGL Production (MMBbl/d) 0.57 0.81 0.57 0.81
Offshore Platform Capacity (MBOE/d) 0 0 0 0
Gas Gathering Line Miles 16,245 38,691 3,249 2,036
Gas Gathering Line Diameter (Inch) 5.7 6.6 5.7 6.6
Gas Gathering Line Compressor (1000 HP) 842 2,039 168 107
Oil Gathering Line Miles 5,883 20,649 1,177 1,087
Oil Gathering Line Diameter (Inch) 4.4 4.8 4.4 4.8
Oil & Gas Gathering Line Miles 22,128 59,339 4,426 3,123
Oil & Gas Gathering Line Diameter (Inch) 5.4 6.0 5.4 6.0
Gas Processing Plant Capacity (Bcfd) 5.4 11.4 1.1 0.6
Gas Processing Plant Compressor (1000 HP) 352 610 70 32
NGL Fractionation Capacity (MBOE/d) 215 388 43 20
Oil Line Miles 3,125 2,882 625 152
Oil Line Diameter (Inch) 17.7 28.2 17.7 28.2
Pump for Oil Lines (1000 HP) 363 610 73 32
NGL Line Miles 1,722 300 344 16
NGL Line Diameter (Inch) 12.7 14.3 12.7 14.3
Pump for NGL Lines (1000 HP) 113 103 23 5
Gas Line Miles 1,318 3,455 264 182
Gas Line Diameter (Inch) 16.0 20.4 16.0 20.4
Compressor for Gas Lines (1000 HP) 64 78 64 78
Oil, Gas, and NGL Line Miles 6,165 6,637 1,233 349
Oil, Gas, and NGL Line Diameter (Inch) 16.0 23.5 16.0 23.5
Crude Oil Storage Capaciy (MBbl) 65,946 96,517 13,189 5,080
Gas Storage Capacity (Bcf) 108 171 22 9
Refining Capacity Enhancement (1000 BPD) 318 1,153 64 61
Oil Product Pipeline Miles 1,052 757 210 40
Oil Product Pipeline Diameter (Inch) 10.1 10.9 10.1 10.9
Oil Product Pipeline Pump (1000 HP) 329 699 66 37
Crude Oil Rails Terminal Loading/Unloading Capacity (1000 BPD) 160 0 32 0
LNG Export Capacity (Bcfd) 0.0 0.0 0.0 0.0
NGL Export Capacity (MBOE/d) 0.0 0.0 0.0 0.0
Gathering and Processing
Surface and Lease Equipment
Oil, Gas, and NGL Pipelines
Oil and Gas Storage
Refining and Oil Products Transport
Export Terminals

89
Exhibit 54: Midwest (Base Case) - New Infrastructure & E/U/R/R
Total
2012-2016
Total
2017-2035
Average
2012-2016
Average
2017-2035
Gas Well Completions 109 637 22 34
Oil Well Completions 2,402 763 480 40
Total Well Completions 2,510 1,400 502 74
Gas Production (Bcfd) 0.3 0.3 0.3 0.3
Crude Oil Production (MMBbl/d) 0.04 0.01 0.04 0.01
NGL Production (MMBbl/d) 0.05 0.04 0.05 0.04
Offshore Platform Capacity (MBOE/d) 0 0 0 0
Gas Gathering Line Miles 863 1,234 173 65
Gas Gathering Line Diameter (Inch) 4.3 5.3 4.3 5.3
Gas Gathering Line Compressor (1000 HP) 16 74 3 4
Oil Gathering Line Miles 0 0 0 0
Oil Gathering Line Diameter (Inch) 0.0 0.0 0.0 0.0
Oil & Gas Gathering Line Miles 863 1,234 173 65
Oil & Gas Gathering Line Diameter (Inch) 4.3 5.3 4.3 5.3
Gas Processing Plant Capacity (Bcfd) 0.7 1.7 0.1 0.1
Gas Processing Plant Compressor (1000 HP) 27 63 5 3
NGL Fractionation Capacity (MBOE/d) 155 543 31 29
Oil Line Miles 1,032 980 206 52
Oil Line Diameter (Inch) 29.8 21.6 29.8 21.6
Pump for Oil Lines (1000 HP) 674 412 135 22
NGL Line Miles 1,754 292 351 15
NGL Line Diameter (Inch) 13.5 16.5 13.5 16.5
Pump for NGL Lines (1000 HP) 86 167 17 9
Gas Line Miles 808 4,518 162 238
Gas Line Diameter (Inch) 23.5 23.4 23.5 23.4
Compressor for Gas Lines (1000 HP) 35 55 35 55
Oil, Gas, and NGL Line Miles 3,593 5,791 719 305
Oil, Gas, and NGL Line Diameter (Inch) 20.5 22.7 20.5 22.7
Crude Oil Storage Capaciy (MBbl) 2,838 2,960 568 156
Gas Storage Capacity (Bcf) 52 261 10 14
Refining Capacity Enhancement (1000 BPD) 600 2,074 120 109
Oil Product Pipeline Miles 751 453 150 24
Oil Product Pipeline Diameter (Inch) 11.5 12.0 11.5 12.0
Oil Product Pipeline Pump (1000 HP) 269 608 54 32
Crude Oil Rails Terminal Loading/Unloading Capacity (1000 BPD) 350 0 70 0
LNG Export Capacity (Bcfd) 0.0 0.0 0.0 0.0
NGL Export Capacity (MBOE/d) 0.0 0.0 0.0 0.0
Export Terminals
Refining and Oil Products Transport
Oil and Gas Storage
Oil, Gas, and NGL Pipelines
Gathering and Processing
Surface and Lease Equipment

90
Exhibit 55: Midwest (High Case) - New Infrastructure & E/U/R/R
Total
2012-2016
Total
2017-2035
Average
2012-2016
Average
2017-2035
Gas Well Completions 109 650 22 34
Oil Well Completions 2,402 989 480 52
Total Well Completions 2,510 1,639 502 86
Gas Production (Bcfd) 0.3 0.3 0.3 0.3
Crude Oil Production (MMBbl/d) 0.04 0.01 0.04 0.01
NGL Production (MMBbl/d) 0.05 0.04 0.05 0.04
Offshore Platform Capacity (MBOE/d) 0 0 0 0
Gas Gathering Line Miles 863 1,287 173 68
Gas Gathering Line Diameter (Inch) 4.3 5.3 4.3 5.3
Gas Gathering Line Compressor (1000 HP) 16 90 3 5
Oil Gathering Line Miles 0 0 0 0
Oil Gathering Line Diameter (Inch) 0.0 0.0 0.0 0.0
Oil & Gas Gathering Line Miles 863 1,287 173 68
Oil & Gas Gathering Line Diameter (Inch) 4.3 5.3 4.3 5.3
Gas Processing Plant Capacity (Bcfd) 0.7 1.7 0.1 0.1
Gas Processing Plant Compressor (1000 HP) 27 65 5 3
NGL Fractionation Capacity (MBOE/d) 155 836 31 44
Oil Line Miles 1,032 1,159 206 61
Oil Line Diameter (Inch) 29.8 23.8 29.8 23.8
Pump for Oil Lines (1000 HP) 674 523 135 28
NGL Line Miles 1,754 1,140 351 60
NGL Line Diameter (Inch) 13.5 16.8 13.5 16.8
Pump for NGL Lines (1000 HP) 86 190 17 10
Gas Line Miles 808 6,925 162 364
Gas Line Diameter (Inch) 23.5 23.1 23.5 23.1
Compressor for Gas Lines (1000 HP) 35 80 35 80
Oil, Gas, and NGL Line Miles 3,593 9,224 719 485
Oil, Gas, and NGL Line Diameter (Inch) 20.5 22.4 20.5 22.4
Crude Oil Storage Capaciy (MBbl) 2,838 3,269 568 172
Gas Storage Capacity (Bcf) 54 307 11 16
Refining Capacity Enhancement (1000 BPD) 600 2,202 120 116
Oil Product Pipeline Miles 751 628 150 33
Oil Product Pipeline Diameter (Inch) 11.5 11.7 11.5 11.7
Oil Product Pipeline Pump (1000 HP) 269 645 54 34
Crude Oil Rails Terminal Loading/Unloading Capacity (1000 BPD) 350 0 70 0
LNG Export Capacity (Bcfd) 0.0 0.0 0.0 0.0
NGL Export Capacity (MBOE/d) 0.0 0.0 0.0 0.0
Gathering and Processing
Surface and Lease Equipment
Oil, Gas, and NGL Pipelines
Oil and Gas Storage
Refining and Oil Products Transport
Export Terminals

91
Exhibit 56: Northeast (Base Case) - New Infrastructure & E/U/R/R
Total
2012-2016
Total
2017-2035
Average
2012-2016
Average
2017-2035
Gas Well Completions 10,391 61,641 2,078 3,244
Oil Well Completions 3,788 7,110 758 374
Total Well Completions 14,179 68,751 2,836 3,618
Gas Production (Bcfd) 15.6 42.0 15.6 42.0
Crude Oil Production (MMBbl/d) 0.06 0.10 0.06 0.10
NGL Production (MMBbl/d) 0.28 1.47 0.28 1.47
Offshore Platform Capacity (MBOE/d) 0 0 0 0
Gas Gathering Line Miles 6,565 17,527 1,313 922
Gas Gathering Line Diameter (Inch) 6.9 9.5 6.9 9.5
Gas Gathering Line Compressor (1000 HP) 1,731 9,423 346 496
Oil Gathering Line Miles 233 1,011 47 53
Oil Gathering Line Diameter (Inch) 4.0 4.0 4.0 4.0
Oil & Gas Gathering Line Miles 6,798 18,538 1,360 976
Oil & Gas Gathering Line Diameter (Inch) 6.8 9.2 6.8 9.2
Gas Processing Plant Capacity (Bcfd) 11.7 31.4 2.3 1.7
Gas Processing Plant Compressor (1000 HP) 1,176 2,762 235 145
NGL Fractionation Capacity (MBOE/d) 390 1,241 78 65
Oil Line Miles 319 12 64 1
Oil Line Diameter (Inch) 31.8 25.9 31.8 25.9
Pump for Oil Lines (1000 HP) 100 22 20 1
NGL Line Miles 617 1,522 123 80
NGL Line Diameter (Inch) 19.1 14.8 19.1 14.8
Pump for NGL Lines (1000 HP) 8 46 2 2
Gas Line Miles 1,963 7,789 393 410
Gas Line Diameter (Inch) 26.2 24.8 26.2 24.8
Compressor for Gas Lines (1000 HP) 232 113 232 113
Oil, Gas, and NGL Line Miles 2,899 9,322 580 491
Oil, Gas, and NGL Line Diameter (Inch) 25.3 23.1 25.3 23.1
Crude Oil Storage Capaciy (MBbl) 5,953 7,259 1,191 382
Gas Storage Capacity (Bcf) 43 123 9 6
Refining Capacity Enhancement (1000 BPD) 288 973 58 51
Oil Product Pipeline Miles 253 147 51 8
Oil Product Pipeline Diameter (Inch) 16.0 14.0 16.0 14.0
Oil Product Pipeline Pump (1000 HP) 99 234 20 12
Crude Oil Rails Terminal Loading/Unloading Capacity (1000 BPD) 25 0 5 0
LNG Export Capacity (Bcfd) 0.0 0.8 0.0 0.0
NGL Export Capacity (MBOE/d) 99.8 178.0 20.0 9.4
Export Terminals
Refining and Oil Products Transport
Oil and Gas Storage
Oil, Gas, and NGL Pipelines
Gathering and Processing
Surface and Lease Equipment

92
Exhibit 57: Northeast (High Case) - New Infrastructure & E/U/R/R
Total
2012-2016
Total
2017-2035
Average
2012-2016
Average
2017-2035
Gas Well Completions 10,391 63,172 2,078 3,325
Oil Well Completions 3,788 12,489 758 657
Total Well Completions 14,179 75,661 2,836 3,982
Gas Production (Bcfd) 15.6 47.3 15.6 47.3
Crude Oil Production (MMBbl/d) 0.06 0.17 0.06 0.17
NGL Production (MMBbl/d) 0.28 1.78 0.28 1.78
Offshore Platform Capacity (MBOE/d) 0 0 0 0
Gas Gathering Line Miles 6,565 18,300 1,313 963
Gas Gathering Line Diameter (Inch) 6.9 9.5 6.9 9.5
Gas Gathering Line Compressor (1000 HP) 1,731 12,490 346 657
Oil Gathering Line Miles 233 1,758 47 93
Oil Gathering Line Diameter (Inch) 4.0 4.3 4.0 4.3
Oil & Gas Gathering Line Miles 6,798 20,058 1,360 1,056
Oil & Gas Gathering Line Diameter (Inch) 6.8 9.1 6.8 9.1
Gas Processing Plant Capacity (Bcfd) 11.7 41.1 2.3 2.2
Gas Processing Plant Compressor (1000 HP) 1,176 3,629 235 191
NGL Fractionation Capacity (MBOE/d) 390 1,694 78 89
Oil Line Miles 319 428 64 23
Oil Line Diameter (Inch) 31.8 40.4 31.8 40.4
Pump for Oil Lines (1000 HP) 100 572 20 30
NGL Line Miles 617 2,260 123 119
NGL Line Diameter (Inch) 19.1 15.2 19.1 15.2
Pump for NGL Lines (1000 HP) 8 52 2 3
Gas Line Miles 1,963 12,407 393 653
Gas Line Diameter (Inch) 26.2 23.9 26.2 23.9
Compressor for Gas Lines (1000 HP) 232 130 232 130
Oil, Gas, and NGL Line Miles 2,899 15,095 580 794
Oil, Gas, and NGL Line Diameter (Inch) 25.3 23.1 25.3 23.1
Crude Oil Storage Capaciy (MBbl) 5,953 12,298 1,191 647
Gas Storage Capacity (Bcf) 43 143 9 8
Refining Capacity Enhancement (1000 BPD) 288 1,042 58 55
Oil Product Pipeline Miles 253 190 51 10
Oil Product Pipeline Diameter (Inch) 16.0 14.5 16.0 14.5
Oil Product Pipeline Pump (1000 HP) 99 243 20 13
Crude Oil Rails Terminal Loading/Unloading Capacity (1000 BPD) 25 0 5 0
LNG Export Capacity (Bcfd) 0.0 0.8 0.0 0.0
NGL Export Capacity (MBOE/d) 99.8 178.0 20.0 9.4
Gathering and Processing
Surface and Lease Equipment
Oil, Gas, and NGL Pipelines
Oil and Gas Storage
Refining and Oil Products Transport
Export Terminals

93
Exhibit 58: Offshore (Base Case) - New Infrastructure & E/U/R/R
Total
2012-2016
Total
2017-2035
Average
2012-2016
Average
2017-2035
Gas Well Completions 153 320 31 17
Oil Well Completions 617 1,443 123 76
Total Well Completions 770 1,764 154 93
Gas Production (Bcfd) 3.8 3.6 3.8 3.6
Crude Oil Production (MMBbl/d) 0.00 0.00 0.00 0.00
NGL Production (MMBbl/d) 0.08 0.03 0.08 0.03
Offshore Platform Capacity (MBOE/d) 3,091 8,454 618 445
Gas Gathering Line Miles 283 519 57 27
Gas Gathering Line Diameter (Inch) 7.8 10.4 7.8 10.4
Gas Gathering Line Compressor (1000 HP) 150 243 30 13
Oil Gathering Line Miles 146 582 29 31
Oil Gathering Line Diameter (Inch) 5.0 6.8 5.0 6.8
Oil & Gas Gathering Line Miles 428 1,101 86 58
Oil & Gas Gathering Line Diameter (Inch) 6.8 8.5 6.8 8.5
Gas Processing Plant Capacity (Bcfd) 0.2 0.1 0.0 0.0
Gas Processing Plant Compressor (1000 HP) 18 16 4 1
NGL Fractionation Capacity (MBOE/d) 0 0 0 0
Oil Line Miles 11 44 2 2
Oil Line Diameter (Inch) 24.0 24.0 24.0 24.0
Pump for Oil Lines (1000 HP) 12 46 2 2
NGL Line Miles 0 0 0 0
NGL Line Diameter (Inch) 0.0 0.0 0.0 0.0
Pump for NGL Lines (1000 HP) 0 0 0 0
Gas Line Miles 34 37 7 2
Gas Line Diameter (Inch) 28.6 25.0 28.6 25.0
Compressor for Gas Lines (1000 HP) 2 2 2 2
Oil, Gas, and NGL Line Miles 46 81 9 4
Oil, Gas, and NGL Line Diameter (Inch) 10.8 23.7 10.8 23.7
Crude Oil Storage Capaciy (MBbl) 0 0 0 0
Gas Storage Capacity (Bcf) 0 0 0 0
Refining Capacity Enhancement (1000 BPD) 0 0 0 0
Oil Product Pipeline Miles 0 0 0 0
Oil Product Pipeline Diameter (Inch) 0.0 0.0 0.0 0.0
Oil Product Pipeline Pump (1000 HP) 0 0 0 0
Crude Oil Rails Terminal Loading/Unloading Capacity (1000 BPD) 0 0 0 0
LNG Export Capacity (Bcfd) 0.0 0.0 0.0 0.0
NGL Export Capacity (MBOE/d) 0.0 0.0 0.0 0.0
Export Terminals
Refining and Oil Products Transport
Oil and Gas Storage
Oil, Gas, and NGL Pipelines
Gathering and Processing
Surface and Lease Equipment

94
Exhibit 59: Offshore (High Case) - New Infrastructure & E/U/R/R
Total
2012-2016
Total
2017-2035
Average
2012-2016
Average
2017-2035
Gas Well Completions 153 277 31 15
Oil Well Completions 617 1,326 123 70
Total Well Completions 770 1,603 154 84
Gas Production (Bcfd) 3.8 3.8 3.8 3.8
Crude Oil Production (MMBbl/d) 0.00 0.00 0.00 0.00
NGL Production (MMBbl/d) 0.08 0.04 0.08 0.04
Offshore Platform Capacity (MBOE/d) 3,091 9,728 618 512
Gas Gathering Line Miles 283 498 57 26
Gas Gathering Line Diameter (Inch) 7.8 10.2 7.8 10.2
Gas Gathering Line Compressor (1000 HP) 150 242 30 13
Oil Gathering Line Miles 146 549 29 29
Oil Gathering Line Diameter (Inch) 5.0 6.7 5.0 6.7
Oil & Gas Gathering Line Miles 428 1,047 86 55
Oil & Gas Gathering Line Diameter (Inch) 6.8 8.4 6.8 8.4
Gas Processing Plant Capacity (Bcfd) 0.2 0.1 0.0 0.0
Gas Processing Plant Compressor (1000 HP) 18 16 4 1
NGL Fractionation Capacity (MBOE/d) 0 0 0 0
Oil Line Miles 11 44 2 2
Oil Line Diameter (Inch) 24.0 24.0 24.0 24.0
Pump for Oil Lines (1000 HP) 12 46 2 2
NGL Line Miles 0 0 0 0
NGL Line Diameter (Inch) 0.0 0.0 0.0 0.0
Pump for NGL Lines (1000 HP) 0 0 0 0
Gas Line Miles 34 37 7 2
Gas Line Diameter (Inch) 28.6 25.0 28.6 25.0
Compressor for Gas Lines (1000 HP) 2 2 2 2
Oil, Gas, and NGL Line Miles 46 81 9 4
Oil, Gas, and NGL Line Diameter (Inch) 10.8 23.7 10.8 23.7
Crude Oil Storage Capaciy (MBbl) 0 0 0 0
Gas Storage Capacity (Bcf) 0 0 0 0
Refining Capacity Enhancement (1000 BPD) 0 0 0 0
Oil Product Pipeline Miles 0 0 0 0
Oil Product Pipeline Diameter (Inch) 0.0 0.0 0.0 0.0
Oil Product Pipeline Pump (1000 HP) 0 0 0 0
Crude Oil Rails Terminal Loading/Unloading Capacity (1000 BPD) 0 0 0 0
LNG Export Capacity (Bcfd) 0.0 0.0 0.0 0.0
NGL Export Capacity (MBOE/d) 0.0 0.0 0.0 0.0
Gathering and Processing
Surface and Lease Equipment
Oil, Gas, and NGL Pipelines
Oil and Gas Storage
Refining and Oil Products Transport
Export Terminals

95
Exhibit 60: Southeast (Base Case) - New Infrastructure & E/U/R/R
Total
2012-2016
Total
2017-2035
Average
2012-2016
Average
2017-2035
Gas Well Completions 494 1,398 99 74
Oil Well Completions 754 1,355 151 71
Total Well Completions 1,248 2,753 250 145
Gas Production (Bcfd) 0.6 0.5 0.6 0.5
Crude Oil Production (MMBbl/d) 0.10 0.06 0.10 0.06
NGL Production (MMBbl/d) 0.00 0.00 0.00 0.00
Offshore Platform Capacity (MBOE/d) 0 0 0 0
Gas Gathering Line Miles 706 1,575 141 83
Gas Gathering Line Diameter (Inch) 4.5 5.2 4.5 5.2
Gas Gathering Line Compressor (1000 HP) 27 51 5 3
Oil Gathering Line Miles 244 629 49 33
Oil Gathering Line Diameter (Inch) 4.3 4.0 4.3 4.0
Oil & Gas Gathering Line Miles 950 2,204 190 116
Oil & Gas Gathering Line Diameter (Inch) 4.5 4.8 4.5 4.8
Gas Processing Plant Capacity (Bcfd) 0.5 1.0 0.1 0.1
Gas Processing Plant Compressor (1000 HP) 20 37 4 2
NGL Fractionation Capacity (MBOE/d) 5 122 1 6
Oil Line Miles 24 51 5 3
Oil Line Diameter (Inch) 18.0 18.0 18.0 18.0
Pump for Oil Lines (1000 HP) 10 38 2 2
NGL Line Miles 27 27 5 1
NGL Line Diameter (Inch) 8.0 8.0 8.0 8.0
Pump for NGL Lines (1000 HP) 3 28 1 1
Gas Line Miles 1,924 6,192 385 326
Gas Line Diameter (Inch) 24.1 23.8 24.1 23.8
Compressor for Gas Lines (1000 HP) 213 89 213 89
Oil, Gas, and NGL Line Miles 1,975 6,270 395 330
Oil, Gas, and NGL Line Diameter (Inch) 23.8 23.7 23.8 23.7
Crude Oil Storage Capaciy (MBbl) 3,070 3,796 614 200
Gas Storage Capacity (Bcf) 99 130 20 7
Refining Capacity Enhancement (1000 BPD) 263 768 53 40
Oil Product Pipeline Miles 330 328 66 17
Oil Product Pipeline Diameter (Inch) 22.4 19.1 22.4 19.1
Oil Product Pipeline Pump (1000 HP) 136 358 27 19
Crude Oil Rails Terminal Loading/Unloading Capacity (1000 BPD) 70 0 14 0
LNG Export Capacity (Bcfd) 0.0 0.4 0.0 0.0
NGL Export Capacity (MBOE/d) 0.0 0.0 0.0 0.0
Oil and Gas Storage
Export Terminals
Refining and Oil Products Transport
Oil, Gas, and NGL Pipelines
Gathering and Processing
Surface and Lease Equipment

96
Exhibit 61: Southeast (High Case) - New Infrastructure & E/U/R/R
Total
2012-2016
Total
2017-2035
Average
2012-2016
Average
2017-2035
Gas Well Completions 494 1,368 99 72
Oil Well Completions 754 2,172 151 114
Total Well Completions 1,248 3,540 250 186
Gas Production (Bcfd) 0.6 0.5 0.6 0.5
Crude Oil Production (MMBbl/d) 0.10 0.08 0.10 0.08
NGL Production (MMBbl/d) 0.00 0.00 0.00 0.00
Offshore Platform Capacity (MBOE/d) 0 0 0 0
Gas Gathering Line Miles 706 1,767 141 93
Gas Gathering Line Diameter (Inch) 4.5 5.0 4.5 5.0
Gas Gathering Line Compressor (1000 HP) 27 51 5 3
Oil Gathering Line Miles 244 882 49 46
Oil Gathering Line Diameter (Inch) 4.3 4.0 4.3 4.0
Oil & Gas Gathering Line Miles 950 2,649 190 139
Oil & Gas Gathering Line Diameter (Inch) 4.5 4.7 4.5 4.7
Gas Processing Plant Capacity (Bcfd) 0.5 1.0 0.1 0.1
Gas Processing Plant Compressor (1000 HP) 20 37 4 2
NGL Fractionation Capacity (MBOE/d) 6 65 1 3
Oil Line Miles 24 55 5 3
Oil Line Diameter (Inch) 18.0 18.0 18.0 18.0
Pump for Oil Lines (1000 HP) 10 38 2 2
NGL Line Miles 27 27 5 1
NGL Line Diameter (Inch) 8.0 8.0 8.0 8.0
Pump for NGL Lines (1000 HP) 3 28 1 1
Gas Line Miles 1,924 11,555 385 608
Gas Line Diameter (Inch) 24.1 22.7 24.1 22.7
Compressor for Gas Lines (1000 HP) 213 111 213 111
Oil, Gas, and NGL Line Miles 1,975 11,637 395 612
Oil, Gas, and NGL Line Diameter (Inch) 23.8 22.7 23.8 22.7
Crude Oil Storage Capaciy (MBbl) 3,070 4,646 614 245
Gas Storage Capacity (Bcf) 99 177 20 9
Refining Capacity Enhancement (1000 BPD) 263 873 53 46
Oil Product Pipeline Miles 330 485 66 26
Oil Product Pipeline Diameter (Inch) 22.4 20.4 22.4 20.4
Oil Product Pipeline Pump (1000 HP) 136 391 27 21
Crude Oil Rails Terminal Loading/Unloading Capacity (1000 BPD) 70 0 14 0
LNG Export Capacity (Bcfd) 0.0 0.4 0.0 0.0
NGL Export Capacity (MBOE/d) 0.0 0.0 0.0 0.0
Gathering and Processing
Surface and Lease Equipment
Oil, Gas, and NGL Pipelines
Oil and Gas Storage
Export Terminals
Refining and Oil Products Transport

97
Exhibit 62: Southwest (Base Case) - New Infrastructure & E/U/R/R
Total
2012-2016
Total
2017-2035
Average
2012-2016
Average
2017-2035
Gas Well Completions 20,380 66,386 4,076 3,494
Oil Well Completions 75,030 216,916 15,006 11,417
Total Well Completions 95,410 283,302 19,082 14,911
Gas Production (Bcfd) 33.0 34.0 33.0 34.0
Crude Oil Production (MMBbl/d) 5.18 6.19 5.18 6.19
NGL Production (MMBbl/d) 1.93 2.70 1.93 2.70
Offshore Platform Capacity (MBOE/d) 0 0 0 0
Gas Gathering Line Miles 34,057 93,539 6,811 4,923
Gas Gathering Line Diameter (Inch) 5.2 5.6 5.2 5.6
Gas Gathering Line Compressor (1000 HP) 2,019 5,630 404 296
Oil Gathering Line Miles 13,818 32,133 2,764 1,691
Oil Gathering Line Diameter (Inch) 4.0 5.2 4.0 5.2
Oil & Gas Gathering Line Miles 47,875 125,672 9,575 6,614
Oil & Gas Gathering Line Diameter (Inch) 4.8 5.5 4.8 5.5
Gas Processing Plant Capacity (Bcfd) 13.1 22.2 2.6 1.2
Gas Processing Plant Compressor (1000 HP) 939 1,340 188 71
NGL Fractionation Capacity (MBOE/d) 1,107 2,567 221 135
Oil Line Miles 6,413 1,690 1,283 89
Oil Line Diameter (Inch) 18.1 24.4 18.1 24.4
Pump for Oil Lines (1000 HP) 675 592 135 31
NGL Line Miles 9,760 4,336 1,952 228
NGL Line Diameter (Inch) 16.6 15.1 16.6 15.1
Pump for NGL Lines (1000 HP) 280 365 56 19
Gas Line Miles 1,656 4,938 331 260
Gas Line Diameter (Inch) 24.8 20.9 24.8 20.9
Compressor for Gas Lines (1000 HP) 187 139 187 139
Oil, Gas, and NGL Line Miles 17,828 10,963 3,566 577
Oil, Gas, and NGL Line Diameter (Inch) 17.9 19.1 17.9 19.1
Crude Oil Storage Capaciy (MBbl) 125,123 173,520 25,025 9,133
Gas Storage Capacity (Bcf) 159 392 32 21
Refining Capacity Enhancement (1000 BPD) 2,557 7,747 511 408
Oil Product Pipeline Miles 577 1,283 115 68
Oil Product Pipeline Diameter (Inch) 13.6 13.9 13.6 13.9
Oil Product Pipeline Pump (1000 HP) 273 890 55 47
Crude Oil Rails Terminal Loading/Unloading Capacity (1000 BPD) 212 0 42 0
LNG Export Capacity (Bcfd) 1.4 9.1 0.3 0.5
NGL Export Capacity (MBOE/d) 664.3 680.9 132.9 35.8
Oil and Gas Storage
Export Terminals
Refining and Oil Products Transport
Oil, Gas, and NGL Pipelines
Surface and Lease Equipment
Gathering and Processing

98
Exhibit 63: Southwest (High Case) - New Infrastructure & E/U/R/R
Total
2012-2016
Total
2017-2035
Average
2012-2016
Average
2017-2035
Gas Well Completions 20,380 65,567 4,076 3,451
Oil Well Completions 75,030 282,729 15,006 14,880
Total Well Completions 95,410 348,297 19,082 18,331
Gas Production (Bcfd) 33.0 37.2 33.0 37.2
Crude Oil Production (MMBbl/d) 5.18 8.11 5.18 8.11
NGL Production (MMBbl/d) 1.93 3.06 1.93 3.06
Offshore Platform Capacity (MBOE/d) 0 0 0 0
Gas Gathering Line Miles 34,057 107,032 6,811 5,633
Gas Gathering Line Diameter (Inch) 5.2 5.5 5.2 5.5
Gas Gathering Line Compressor (1000 HP) 2,019 6,511 404 343
Oil Gathering Line Miles 13,818 36,181 2,764 1,904
Oil Gathering Line Diameter (Inch) 4.0 5.2 4.0 5.2
Oil & Gas Gathering Line Miles 47,875 143,213 9,575 7,538
Oil & Gas Gathering Line Diameter (Inch) 4.8 5.5 4.8 5.5
Gas Processing Plant Capacity (Bcfd) 13.1 26.4 2.6 1.4
Gas Processing Plant Compressor (1000 HP) 939 1,720 188 91
NGL Fractionation Capacity (MBOE/d) 1,107 3,373 221 178
Oil Line Miles 6,413 2,759 1,283 145
Oil Line Diameter (Inch) 18.1 27.2 18.1 27.2
Pump for Oil Lines (1000 HP) 675 836 135 44
NGL Line Miles 9,760 7,177 1,952 378
NGL Line Diameter (Inch) 16.6 15.3 16.6 15.3
Pump for NGL Lines (1000 HP) 280 443 56 23
Gas Line Miles 1,656 10,484 331 552
Gas Line Diameter (Inch) 24.8 21.0 24.8 21.0
Compressor for Gas Lines (1000 HP) 187 152 187 152
Oil, Gas, and NGL Line Miles 17,828 20,420 3,566 1,075
Oil, Gas, and NGL Line Diameter (Inch) 17.9 19.9 17.9 19.9
Crude Oil Storage Capaciy (MBbl) 125,123 238,965 25,025 12,577
Gas Storage Capacity (Bcf) 158 495 32 26
Refining Capacity Enhancement (1000 BPD) 2,557 8,672 511 456
Oil Product Pipeline Miles 577 1,963 115 103
Oil Product Pipeline Diameter (Inch) 13.6 14.0 13.6 14.0
Oil Product Pipeline Pump (1000 HP) 273 1,032 55 54
Crude Oil Rails Terminal Loading/Unloading Capacity (1000 BPD) 212 0 42 0
LNG Export Capacity (Bcfd) 1.4 19.1 0.3 1.0
NGL Export Capacity (MBOE/d) 664.3 1,264.5 132.9 66.6
Surface and Lease Equipment
Gathering and Processing
Oil, Gas, and NGL Pipelines
Oil and Gas Storage
Export Terminals
Refining and Oil Products Transport

99
Exhibit 64: Western (Base Case) - New Infrastructure & E/U/R/R
Total
2012-2016
Total
2017-2035
Average
2012-2016
Average
2017-2035
Gas Well Completions 85 278 17 15
Oil Well Completions 7,296 8,754 1,459 461
Total Well Completions 7,381 9,032 1,476 475
Gas Production (Bcfd) 0.6 0.5 0.6 0.5
Crude Oil Production (MMBbl/d) 0.55 0.38 0.55 0.38
NGL Production (MMBbl/d) 0.04 0.04 0.04 0.04
Offshore Platform Capacity (MBOE/d) 0 0 0 0
Gas Gathering Line Miles 3,216 5,591 643 294
Gas Gathering Line Diameter (Inch) 3.2 3.9 3.2 3.9
Gas Gathering Line Compressor (1000 HP) 29 71 6 4
Oil Gathering Line Miles 3,132 5,977 626 315
Oil Gathering Line Diameter (Inch) 3.4 3.7 3.4 3.7
Oil & Gas Gathering Line Miles 6,347 11,567 1,269 609
Oil & Gas Gathering Line Diameter (Inch) 3.3 3.8 3.3 3.8
Gas Processing Plant Capacity (Bcfd) 0.2 0.5 0.0 0.0
Gas Processing Plant Compressor (1000 HP) 11 27 2 1
NGL Fractionation Capacity (MBOE/d) 10 13 2 1
Oil Line Miles 15 47 3 2
Oil Line Diameter (Inch) 15.8 18.0 15.8 18.0
Pump for Oil Lines (1000 HP) 10 37 2 2
NGL Line Miles 3 6 1 0
NGL Line Diameter (Inch) 14.0 14.0 14.0 14.0
Pump for NGL Lines (1000 HP) 0 0 0 0
Gas Line Miles 426 789 85 42
Gas Line Diameter (Inch) 22.1 21.8 22.1 21.8
Compressor for Gas Lines (1000 HP) 39 25 39 25
Oil, Gas, and NGL Line Miles 443 843 89 44
Oil, Gas, and NGL Line Diameter (Inch) 8.8 21.6 8.8 21.6
Crude Oil Storage Capaciy (MBbl) 2,436 4,939 487 260
Gas Storage Capacity (Bcf) 90 97 18 5
Refining Capacity Enhancement (1000 BPD) 515 2,097 103 110
Oil Product Pipeline Miles 387 474 77 25
Oil Product Pipeline Diameter (Inch) 10.7 12.1 10.7 12.1
Oil Product Pipeline Pump (1000 HP) 130 330 26 17
Crude Oil Rails Terminal Loading/Unloading Capacity (1000 BPD) 548 146 110 8
LNG Export Capacity (Bcfd) 0.0 0.0 0.0 0.0
NGL Export Capacity (MBOE/d) 2.6 1.1 0.5 0.1
Oil and Gas Storage
Export Terminals
Refining and Oil Products Transport
Gathering and Processing
Oil, Gas, and NGL Pipelines
Surface and Lease Equipment

100
Exhibit 65: Western (High Case) - New Infrastructure & E/U/R/R
Total
2012-2016
Total
2017-2035
Average
2012-2016
Average
2017-2035
Gas Well Completions 85 236 17 12
Oil Well Completions 7,296 8,485 1,459 447
Total Well Completions 7,381 8,721 1,476 459
Gas Production (Bcfd) 0.6 0.5 0.6 0.5
Crude Oil Production (MMBbl/d) 0.55 0.44 0.55 0.44
NGL Production (MMBbl/d) 0.04 0.04 0.04 0.04
Offshore Platform Capacity (MBOE/d) 0 0 0 0
Gas Gathering Line Miles 3,216 5,569 643 293
Gas Gathering Line Diameter (Inch) 3.2 3.9 3.2 3.9
Gas Gathering Line Compressor (1000 HP) 29 72 6 4
Oil Gathering Line Miles 3,132 5,963 626 314
Oil Gathering Line Diameter (Inch) 3.4 3.8 3.4 3.8
Oil & Gas Gathering Line Miles 6,347 11,532 1,269 607
Oil & Gas Gathering Line Diameter (Inch) 3.3 3.8 3.3 3.8
Gas Processing Plant Capacity (Bcfd) 0.2 0.5 0.0 0.0
Gas Processing Plant Compressor (1000 HP) 11 28 2 1
NGL Fractionation Capacity (MBOE/d) 10 13 2 1
Oil Line Miles 15 47 3 2
Oil Line Diameter (Inch) 15.8 18.0 15.8 18.0
Pump for Oil Lines (1000 HP) 10 37 2 2
NGL Line Miles 3 7 1 0
NGL Line Diameter (Inch) 14.0 14.0 14.0 14.0
Pump for NGL Lines (1000 HP) 0 0 0 0
Gas Line Miles 426 896 85 47
Gas Line Diameter (Inch) 22.1 22.3 22.1 22.3
Compressor for Gas Lines (1000 HP) 39 30 39 30
Oil, Gas, and NGL Line Miles 443 951 89 50
Oil, Gas, and NGL Line Diameter (Inch) 8.8 22.0 8.8 22.0
Crude Oil Storage Capaciy (MBbl) 2,436 4,939 487 260
Gas Storage Capacity (Bcf) 89 99 18 5
Refining Capacity Enhancement (1000 BPD) 515 2,097 103 110
Oil Product Pipeline Miles 387 770 77 41
Oil Product Pipeline Diameter (Inch) 10.7 12.1 10.7 12.1
Oil Product Pipeline Pump (1000 HP) 130 392 26 21
Crude Oil Rails Terminal Loading/Unloading Capacity (1000 BPD) 548 146 110 8
LNG Export Capacity (Bcfd) 0.0 0.0 0.0 0.0
NGL Export Capacity (MBOE/d) 2.6 1.1 0.5 0.1
Surface and Lease Equipment
Gathering and Processing
Oil, Gas, and NGL Pipelines
Oil and Gas Storage
Export Terminals
Refining and Oil Products Transport

101
New Infrastructure
Exhibit 66: U.S. (Base Case) - New Infrastructure
Total
2012-2016
Total
2017-2035
Average
2012-2016
Average
2017-2035
Gas Well Completions 38,609 151,302 7,722 7,963
Oil Well Completions 128,666 306,132 25,733 16,112
Total Well Completions 167,275 457,433 33,455 24,075
Gas Production (Bcfd) 70.3 97.3 70.3 97.3
Crude Oil Production (MMBbl/d) 8.22 8.81 8.22 8.81
NGL Production (MMBbl/d) 2.97 5.04 2.97 5.04
Offshore Platform Capacity (MBOE/d) 3,091 8,454 618 445
Gas Gathering Line Miles 30,894 67,467 6,179 3,551
Gas Gathering Line Diameter (Inch) 6.7 7.9 6.7 7.9
Gas Gathering Line Compressor (1000 HP) 2,388 7,422 478 391
Oil Gathering Line Miles 18,369 32,371 3,674 1,704
Oil Gathering Line Diameter (Inch) 4.2 5.3 4.2 5.3
Oil & Gas Gathering Line Miles 49,264 99,837 9,853 5,255
Oil & Gas Gathering Line Diameter (Inch) 5.7 7.0 5.7 7.0
Gas Processing Plant Capacity (Bcfd) 20.7 28.7 4.1 1.5
Gas Processing Plant Compressor (1000 HP) 2,070 2,867 414 151
NGL Fractionation Capacity (MBOE/d) 1,520 2,680 304 141
Oil Line Miles 10,718 4,074 2,144 214
Oil Line Diameter (Inch) 19.4 27.1 19.4 27.1
Pump for Oil Lines (1000 HP) 1,644 648 329 34
NGL Line Miles 13,696 5,674 2,739 299
NGL Line Diameter (Inch) 15.8 13.7 15.8 13.7
Pump for NGL Lines (1000 HP) 385 240 77 13
Gas Line Miles 6,666 20,917 1,333 1,101
Gas Line Diameter (Inch) 24.2 23.9 24.2 23.9
Compressor for Gas Lines (1000 HP) 468 219 468 219
Oil, Gas, and NGL Line Miles 31,080 30,665 6,216 1,614
Oil, Gas, and NGL Line Diameter (Inch) 18.9 22.5 18.9 22.5
Crude Oil Storage Capaciy (MBbl) 136,640 21,118 27,328 1,111
Gas Storage Capacity (Bcf) 358 364 72 19
Refining Capacity Enhancement (1000 BPD) 0 0 0 0
Oil Product Pipeline Miles 3,070 2,092 614 110
Oil Product Pipeline Diameter (Inch) 12.7 13.7 12.7 13.7
Oil Product Pipeline Pump (1000 HP) 544 370 109 19
Crude Oil Rails Terminal Loading/Unloading Capacity (1000 BPD) 1,365 146 273 8
LNG Export Capacity (Bcfd) 1.4 10.3 0.3 0.5
NGL Export Capacity (MBOE/d) 766.7 860.0 153.3 45.3
Export Terminals
Surface and Lease Equipment
Gathering and Processing
Oil, Gas, and NGL Pipelines
Oil and Gas Storage
Refining and Oil Products Transport

102
Exhibit 67: U.S. (High Case) - New Infrastructure
Total
2012-2016
Total
2017-2035
Average
2012-2016
Average
2017-2035
Gas Well Completions 38,609 152,205 7,722 8,011
Oil Well Completions 128,666 383,112 25,733 20,164
Total Well Completions 167,275 535,317 33,455 28,175
Gas Production (Bcfd) 70.3 107.3 70.3 107.3
Crude Oil Production (MMBbl/d) 8.22 11.55 8.22 11.55
NGL Production (MMBbl/d) 2.97 5.80 2.97 5.80
Offshore Platform Capacity (MBOE/d) 3,091 9,728 618 512
Gas Gathering Line Miles 30,894 80,135 6,179 4,218
Gas Gathering Line Diameter (Inch) 6.7 7.5 6.7 7.5
Gas Gathering Line Compressor (1000 HP) 2,388 10,638 478 560
Oil Gathering Line Miles 18,369 37,103 3,674 1,953
Oil Gathering Line Diameter (Inch) 4.2 5.4 4.2 5.4
Oil & Gas Gathering Line Miles 49,264 117,237 9,853 6,170
Oil & Gas Gathering Line Diameter (Inch) 5.7 6.8 5.7 6.8
Gas Processing Plant Capacity (Bcfd) 20.7 41.1 4.1 2.2
Gas Processing Plant Compressor (1000 HP) 2,070 4,112 414 216
NGL Fractionation Capacity (MBOE/d) 1,520 3,898 304 205
Oil Line Miles 10,718 6,358 2,144 335
Oil Line Diameter (Inch) 19.4 28.6 19.4 28.6
Pump for Oil Lines (1000 HP) 1,644 1,478 329 78
NGL Line Miles 13,696 10,121 2,739 533
NGL Line Diameter (Inch) 15.8 14.4 15.8 14.4
Pump for NGL Lines (1000 HP) 385 337 77 18
Gas Line Miles 6,666 39,874 1,333 2,099
Gas Line Diameter (Inch) 24.2 22.9 24.2 22.9
Compressor for Gas Lines (1000 HP) 468 281 468 281
Oil, Gas, and NGL Line Miles 31,080 56,352 6,216 2,966
Oil, Gas, and NGL Line Diameter (Inch) 18.9 22.1 18.9 22.1
Crude Oil Storage Capaciy (MBbl) 136,640 94,271 27,328 4,962
Gas Storage Capacity (Bcf) 358 592 72 31
Refining Capacity Enhancement (1000 BPD) 0 0 0 0
Oil Product Pipeline Miles 3,070 3,653 614 192
Oil Product Pipeline Diameter (Inch) 12.7 13.8 12.7 13.8
Oil Product Pipeline Pump (1000 HP) 544 647 109 34
Crude Oil Rails Terminal Loading/Unloading Capacity (1000 BPD) 1,365 146 273 8
LNG Export Capacity (Bcfd) 1.4 20.2 0.3 1.1
NGL Export Capacity (MBOE/d) 766.7 1,443.6 153.3 76.0
Export Terminals
Surface and Lease Equipment
Gathering and Processing
Oil, Gas, and NGL Pipelines
Oil and Gas Storage
Refining and Oil Products Transport

103
Exhibit 68: Alaska (Base Case) - New Infrastructure
Total
2012-2016
Total
2017-2035
Average
2012-2016
Average
2017-2035
Gas Well Completions 25 53 5 3
Oil Well Completions 490 741 98 39
Total Well Completions 515 793 103 42
Gas Production (Bcfd) 0.9 0.8 0.9 0.8
Crude Oil Production (MMBbl/d) 0.48 0.34 0.48 0.34
NGL Production (MMBbl/d) 0.02 0.02 0.02 0.02
Offshore Platform Capacity (MBOE/d) 0 0 0 0
Gas Gathering Line Miles 64 83 13 4
Gas Gathering Line Diameter (Inch) 11.3 14.5 11.3 14.5
Gas Gathering Line Compressor (1000 HP) 0 1 0 0
Oil Gathering Line Miles 122 185 24 10
Oil Gathering Line Diameter (Inch) 8.0 8.0 8.0 8.0
Oil & Gas Gathering Line Miles 186 268 37 14
Oil & Gas Gathering Line Diameter (Inch) 9.1 10.0 9.1 10.0
Gas Processing Plant Capacity (Bcfd) 0.0 0.0 0.0 0.0
Gas Processing Plant Compressor (1000 HP) 3 1 1 0
NGL Fractionation Capacity (MBOE/d) 3 0 1 0
Oil Line Miles 2 0 0 0
Oil Line Diameter (Inch) 0.0 18.0 0.0 18.0
Pump for Oil Lines (1000 HP) 0 0 0 0
NGL Line Miles 0 0 0 0
NGL Line Diameter (Inch) 0.0 0.0 0.0 0.0
Pump for NGL Lines (1000 HP) 0 0 0 0
Gas Line Miles 1 0 0 0
Gas Line Diameter (Inch) 30.0 30.0 30.0 30.0
Compressor for Gas Lines (1000 HP) 0 0 0 0
Oil, Gas, and NGL Line Miles 2 0 0 0
Oil, Gas, and NGL Line Diameter (Inch) 15.1 30.0 15.1 30.0
Crude Oil Storage Capaciy (MBbl) 283 0 57 0
Gas Storage Capacity (Bcf) 0 0 0 0
Refining Capacity Enhancement (1000 BPD) 0 0 0 0
Oil Product Pipeline Miles 10 7 2 0
Oil Product Pipeline Diameter (Inch) 8.8 9.4 8.8 9.4
Oil Product Pipeline Pump (1000 HP) 2 1 0 0
Crude Oil Rails Terminal Loading/Unloading Capacity (1000 BPD) 0 0 0 0
LNG Export Capacity (Bcfd) 0.0 0.0 0.0 0.0
NGL Export Capacity (MBOE/d) 0.0 0.0 0.0 0.0
Surface and Lease Equipment
Gathering and Processing
Oil, Gas, and NGL Pipelines
Oil and Gas Storage
Refining and Oil Products Transport
Export Terminals

104
Exhibit 69: Alaska (High Case) - New Infrastructure
Total
2012-2016
Total
2017-2035
Average
2012-2016
Average
2017-2035
Gas Well Completions 25 23 5 1
Oil Well Completions 490 571 98 30
Total Well Completions 515 594 103 31
Gas Production (Bcfd) 0.9 0.8 0.9 0.8
Crude Oil Production (MMBbl/d) 0.48 0.59 0.48 0.59
NGL Production (MMBbl/d) 0.02 0.02 0.02 0.02
Offshore Platform Capacity (MBOE/d) 0 0 0 0
Gas Gathering Line Miles 64 61 13 3
Gas Gathering Line Diameter (Inch) 11.3 16.0 11.3 16.0
Gas Gathering Line Compressor (1000 HP) 0 1 0 0
Oil Gathering Line Miles 122 143 24 8
Oil Gathering Line Diameter (Inch) 8.0 8.0 8.0 8.0
Oil & Gas Gathering Line Miles 186 204 37 11
Oil & Gas Gathering Line Diameter (Inch) 9.1 10.4 9.1 10.4
Gas Processing Plant Capacity (Bcfd) 0.0 0.0 0.0 0.0
Gas Processing Plant Compressor (1000 HP) 3 1 1 0
NGL Fractionation Capacity (MBOE/d) 3 0 1 0
Oil Line Miles 2 0 0 0
Oil Line Diameter (Inch) 0.0 18.0 0.0 18.0
Pump for Oil Lines (1000 HP) 0 0 0 0
NGL Line Miles 0 0 0 0
NGL Line Diameter (Inch) 0.0 0.0 0.0 0.0
Pump for NGL Lines (1000 HP) 0 0 0 0
Gas Line Miles 1 0 0 0
Gas Line Diameter (Inch) 30.0 30.0 30.0 30.0
Compressor for Gas Lines (1000 HP) 0 0 0 0
Oil, Gas, and NGL Line Miles 2 0 0 0
Oil, Gas, and NGL Line Diameter (Inch) 15.1 30.0 15.1 30.0
Crude Oil Storage Capaciy (MBbl) 283 0 57 0
Gas Storage Capacity (Bcf) 0 0 0 0
Refining Capacity Enhancement (1000 BPD) 0 0 0 0
Oil Product Pipeline Miles 10 12 2 1
Oil Product Pipeline Diameter (Inch) 8.8 9.4 8.8 9.4
Oil Product Pipeline Pump (1000 HP) 2 2 0 0
Crude Oil Rails Terminal Loading/Unloading Capacity (1000 BPD) 0 0 0 0
LNG Export Capacity (Bcfd) 0.0 0.0 0.0 0.0
NGL Export Capacity (MBOE/d) 0.0 0.0 0.0 0.0
Surface and Lease Equipment
Gathering and Processing
Oil, Gas, and NGL Pipelines
Oil and Gas Storage
Refining and Oil Products Transport
Export Terminals

105
Exhibit 70: Central (Base Case) - New Infrastructure
Total
2012-2016
Total
2017-2035
Average
2012-2016
Average
2017-2035
Gas Well Completions 6,973 20,588 1,395 1,084
Oil Well Completions 38,290 69,050 7,658 3,634
Total Well Completions 45,262 89,638 9,052 4,718
Gas Production (Bcfd) 15.4 15.7 15.4 15.7
Crude Oil Production (MMBbl/d) 1.82 1.72 1.82 1.72
NGL Production (MMBbl/d) 0.57 0.74 0.57 0.74
Offshore Platform Capacity (MBOE/d) 0 0 0 0
Gas Gathering Line Miles 8,496 13,769 1,699 725
Gas Gathering Line Diameter (Inch) 6.9 8.7 6.9 8.7
Gas Gathering Line Compressor (1000 HP) 286 303 57 16
Oil Gathering Line Miles 5,155 12,361 1,031 651
Oil Gathering Line Diameter (Inch) 4.4 4.7 4.4 4.7
Oil & Gas Gathering Line Miles 13,650 26,130 2,730 1,375
Oil & Gas Gathering Line Diameter (Inch) 5.9 6.8 5.9 6.8
Gas Processing Plant Capacity (Bcfd) 2.4 1.6 0.5 0.1
Gas Processing Plant Compressor (1000 HP) 242 162 48 9
NGL Fractionation Capacity (MBOE/d) 172 161 34 8
Oil Line Miles 3,078 2,004 616 105
Oil Line Diameter (Inch) 17.6 30.3 17.6 30.3
Pump for Oil Lines (1000 HP) 323 313 65 16
NGL Line Miles 1,678 93 336 5
NGL Line Diameter (Inch) 12.7 12.5 12.7 12.5
Pump for NGL Lines (1000 HP) 93 21 19 1
Gas Line Miles 1,047 1,368 209 72
Gas Line Diameter (Inch) 15.9 21.7 15.9 21.7
Compressor for Gas Lines (1000 HP) 31 40 31 40
Oil, Gas, and NGL Line Miles 5,804 3,466 1,161 182
Oil, Gas, and NGL Line Diameter (Inch) 15.9 26.4 15.9 26.4
Crude Oil Storage Capaciy (MBbl) 46,104 30 9,221 2
Gas Storage Capacity (Bcf) 87 54 17 3
Refining Capacity Enhancement (1000 BPD) 0 0 0 0
Oil Product Pipeline Miles 988 278 198 15
Oil Product Pipeline Diameter (Inch) 9.9 9.9 9.9 9.9
Oil Product Pipeline Pump (1000 HP) 175 49 35 3
Crude Oil Rails Terminal Loading/Unloading Capacity (1000 BPD) 160 0 32 0
LNG Export Capacity (Bcfd) 0.0 0.0 0.0 0.0
NGL Export Capacity (MBOE/d) 0.0 0.0 0.0 0.0
Export Terminals
Surface and Lease Equipment
Gathering and Processing
Oil, Gas, and NGL Pipelines
Oil and Gas Storage
Refining and Oil Products Transport

106
Exhibit 71: Central (High Case) - New Infrastructure
Total
2012-2016
Total
2017-2035
Average
2012-2016
Average
2017-2035
Gas Well Completions 6,973 20,913 1,395 1,101
Oil Well Completions 38,290 74,350 7,658 3,913
Total Well Completions 45,262 95,263 9,052 5,014
Gas Production (Bcfd) 15.4 16.9 15.4 16.9
Crude Oil Production (MMBbl/d) 1.82 2.15 1.82 2.15
NGL Production (MMBbl/d) 0.57 0.81 0.57 0.81
Offshore Platform Capacity (MBOE/d) 0 0 0 0
Gas Gathering Line Miles 8,496 14,722 1,699 775
Gas Gathering Line Diameter (Inch) 6.9 8.8 6.9 8.8
Gas Gathering Line Compressor (1000 HP) 286 437 57 23
Oil Gathering Line Miles 5,155 13,095 1,031 689
Oil Gathering Line Diameter (Inch) 4.4 4.9 4.4 4.9
Oil & Gas Gathering Line Miles 13,650 27,816 2,730 1,464
Oil & Gas Gathering Line Diameter (Inch) 5.9 7.0 5.9 7.0
Gas Processing Plant Capacity (Bcfd) 2.4 2.7 0.5 0.1
Gas Processing Plant Compressor (1000 HP) 242 269 48 14
NGL Fractionation Capacity (MBOE/d) 172 166 34 9
Oil Line Miles 3,078 2,641 616 139
Oil Line Diameter (Inch) 17.6 28.5 17.6 28.5
Pump for Oil Lines (1000 HP) 323 361 65 19
NGL Line Miles 1,678 128 336 7
NGL Line Diameter (Inch) 12.7 12.5 12.7 12.5
Pump for NGL Lines (1000 HP) 93 21 19 1
Gas Line Miles 1,047 2,410 209 127
Gas Line Diameter (Inch) 15.9 22.1 15.9 22.1
Compressor for Gas Lines (1000 HP) 31 44 31 44
Oil, Gas, and NGL Line Miles 5,804 5,178 1,161 273
Oil, Gas, and NGL Line Diameter (Inch) 15.9 25.2 15.9 25.2
Crude Oil Storage Capaciy (MBbl) 46,104 20,617 9,221 1,085
Gas Storage Capacity (Bcf) 87 79 17 4
Refining Capacity Enhancement (1000 BPD) 0 0 0 0
Oil Product Pipeline Miles 988 501 198 26
Oil Product Pipeline Diameter (Inch) 9.9 9.9 9.9 9.9
Oil Product Pipeline Pump (1000 HP) 175 89 35 5
Crude Oil Rails Terminal Loading/Unloading Capacity (1000 BPD) 160 0 32 0
LNG Export Capacity (Bcfd) 0.0 0.0 0.0 0.0
NGL Export Capacity (MBOE/d) 0.0 0.0 0.0 0.0
Export Terminals
Surface and Lease Equipment
Gathering and Processing
Oil, Gas, and NGL Pipelines
Oil and Gas Storage
Refining and Oil Products Transport

107
Exhibit 72: Midwest (Base Case) - New Infrastructure
Total
2012-2016
Total
2017-2035
Average
2012-2016
Average
2017-2035
Gas Well Completions 109 637 22 34
Oil Well Completions 2,402 763 480 40
Total Well Completions 2,510 1,400 502 74
Gas Production (Bcfd) 0.3 0.3 0.3 0.3
Crude Oil Production (MMBbl/d) 0.04 0.01 0.04 0.01
NGL Production (MMBbl/d) 0.05 0.04 0.05 0.04
Offshore Platform Capacity (MBOE/d) 0 0 0 0
Gas Gathering Line Miles 487 220 97 12
Gas Gathering Line Diameter (Inch) 3.8 6.7 3.8 6.7
Gas Gathering Line Compressor (1000 HP) 5 32 1 2
Oil Gathering Line Miles 0 0 0 0
Oil Gathering Line Diameter (Inch) 0.0 0.0 0.0 0.0
Oil & Gas Gathering Line Miles 487 220 97 12
Oil & Gas Gathering Line Diameter (Inch) 3.8 6.7 3.8 6.7
Gas Processing Plant Capacity (Bcfd) 0.0 0.2 0.0 0.0
Gas Processing Plant Compressor (1000 HP) 5 16 1 1
NGL Fractionation Capacity (MBOE/d) 142 360 28 19
Oil Line Miles 994 817 199 43
Oil Line Diameter (Inch) 29.9 20.6 29.9 20.6
Pump for Oil Lines (1000 HP) 626 125 125 7
NGL Line Miles 1,734 194 347 10
NGL Line Diameter (Inch) 13.5 10.4 13.5 10.4
Pump for NGL Lines (1000 HP) 75 99 15 5
Gas Line Miles 606 3,723 121 196
Gas Line Diameter (Inch) 24.9 24.2 24.9 24.2
Compressor for Gas Lines (1000 HP) 0 10 0 10
Oil, Gas, and NGL Line Miles 3,334 4,734 667 249
Oil, Gas, and NGL Line Diameter (Inch) 20.5 23.0 20.5 23.0
Crude Oil Storage Capaciy (MBbl) 1,810 0 362 0
Gas Storage Capacity (Bcf) 0 62 0 3
Refining Capacity Enhancement (1000 BPD) 0 0 0 0
Oil Product Pipeline Miles 689 215 138 11
Oil Product Pipeline Diameter (Inch) 11.3 11.0 11.3 11.0
Oil Product Pipeline Pump (1000 HP) 122 38 24 2
Crude Oil Rails Terminal Loading/Unloading Capacity (1000 BPD) 350 0 70 0
LNG Export Capacity (Bcfd) 0.0 0.0 0.0 0.0
NGL Export Capacity (MBOE/d) 0.0 0.0 0.0 0.0
Surface and Lease Equipment
Gathering and Processing
Oil, Gas, and NGL Pipelines
Oil and Gas Storage
Refining and Oil Products Transport
Export Terminals

108
Exhibit 73: Midwest (High Case) - New Infrastructure
Total
2012-2016
Total
2017-2035
Average
2012-2016
Average
2017-2035
Gas Well Completions 109 650 22 34
Oil Well Completions 2,402 989 480 52
Total Well Completions 2,510 1,639 502 86
Gas Production (Bcfd) 0.3 0.3 0.3 0.3
Crude Oil Production (MMBbl/d) 0.04 0.01 0.04 0.01
NGL Production (MMBbl/d) 0.05 0.04 0.05 0.04
Offshore Platform Capacity (MBOE/d) 0 0 0 0
Gas Gathering Line Miles 487 260 97 14
Gas Gathering Line Diameter (Inch) 3.8 6.2 3.8 6.2
Gas Gathering Line Compressor (1000 HP) 5 45 1 2
Oil Gathering Line Miles 0 0 0 0
Oil Gathering Line Diameter (Inch) 0.0 0.0 0.0 0.0
Oil & Gas Gathering Line Miles 487 260 97 14
Oil & Gas Gathering Line Diameter (Inch) 3.8 6.2 3.8 6.2
Gas Processing Plant Capacity (Bcfd) 0.0 0.2 0.0 0.0
Gas Processing Plant Compressor (1000 HP) 5 18 1 1
NGL Fractionation Capacity (MBOE/d) 142 587 28 31
Oil Line Miles 994 993 199 52
Oil Line Diameter (Inch) 29.9 23.3 29.9 23.3
Pump for Oil Lines (1000 HP) 626 217 125 11
NGL Line Miles 1,734 1,034 347 54
NGL Line Diameter (Inch) 13.5 14.9 13.5 14.9
Pump for NGL Lines (1000 HP) 75 119 15 6
Gas Line Miles 606 6,110 121 322
Gas Line Diameter (Inch) 24.9 23.5 24.9 23.5
Compressor for Gas Lines (1000 HP) 0 35 0 35
Oil, Gas, and NGL Line Miles 3,334 8,137 667 428
Oil, Gas, and NGL Line Diameter (Inch) 20.5 22.4 20.5 22.4
Crude Oil Storage Capaciy (MBbl) 1,810 219 362 12
Gas Storage Capacity (Bcf) 0 97 0 5
Refining Capacity Enhancement (1000 BPD) 0 0 0 0
Oil Product Pipeline Miles 689 387 138 20
Oil Product Pipeline Diameter (Inch) 11.3 11.0 11.3 11.0
Oil Product Pipeline Pump (1000 HP) 122 69 24 4
Crude Oil Rails Terminal Loading/Unloading Capacity (1000 BPD) 350 0 70 0
LNG Export Capacity (Bcfd) 0.0 0.0 0.0 0.0
NGL Export Capacity (MBOE/d) 0.0 0.0 0.0 0.0
Surface and Lease Equipment
Gathering and Processing
Oil, Gas, and NGL Pipelines
Oil and Gas Storage
Refining and Oil Products Transport
Export Terminals

109
Exhibit 74: Northeast (Base Case) - New Infrastructure
Total
2012-2016
Total
2017-2035
Average
2012-2016
Average
2017-2035
Gas Well Completions 10,391 61,641 2,078 3,244
Oil Well Completions 3,788 7,110 758 374
Total Well Completions 14,179 68,751 2,836 3,618
Gas Production (Bcfd) 15.6 42.0 15.6 42.0
Crude Oil Production (MMBbl/d) 0.06 0.10 0.06 0.10
NGL Production (MMBbl/d) 0.28 1.47 0.28 1.47
Offshore Platform Capacity (MBOE/d) 0 0 0 0
Gas Gathering Line Miles 2,201 6,669 440 351
Gas Gathering Line Diameter (Inch) 10.8 14.0 10.8 14.0
Gas Gathering Line Compressor (1000 HP) 1,356 5,236 271 276
Oil Gathering Line Miles 221 700 44 37
Oil Gathering Line Diameter (Inch) 4.0 4.0 4.0 4.0
Oil & Gas Gathering Line Miles 2,422 7,369 484 388
Oil & Gas Gathering Line Diameter (Inch) 10.2 13.0 10.2 13.0
Gas Processing Plant Capacity (Bcfd) 11.3 21.1 2.3 1.1
Gas Processing Plant Compressor (1000 HP) 1,129 2,111 226 111
NGL Fractionation Capacity (MBOE/d) 385 805 77 42
Oil Line Miles 317 4 63 0
Oil Line Diameter (Inch) 31.9 18.0 31.9 18.0
Pump for Oil Lines (1000 HP) 97 0 19 0
NGL Line Miles 613 1,502 123 79
NGL Line Diameter (Inch) 19.1 14.8 19.1 14.8
Pump for NGL Lines (1000 HP) 5 27 1 1
Gas Line Miles 1,775 6,986 355 368
Gas Line Diameter (Inch) 26.8 25.2 26.8 25.2
Compressor for Gas Lines (1000 HP) 188 47 188 47
Oil, Gas, and NGL Line Miles 2,706 8,492 541 447
Oil, Gas, and NGL Line Diameter (Inch) 25.7 23.3 25.7 23.3
Crude Oil Storage Capaciy (MBbl) 4,561 802 912 42
Gas Storage Capacity (Bcf) 24 46 5 2
Refining Capacity Enhancement (1000 BPD) 0 0 0 0
Oil Product Pipeline Miles 228 53 46 3
Oil Product Pipeline Diameter (Inch) 16.4 16.0 16.4 16.0
Oil Product Pipeline Pump (1000 HP) 40 9 8 0
Crude Oil Rails Terminal Loading/Unloading Capacity (1000 BPD) 25 0 5 0
LNG Export Capacity (Bcfd) 0.0 0.8 0.0 0.0
NGL Export Capacity (MBOE/d) 99.8 178.0 20.0 9.4
Export Terminals
Surface and Lease Equipment
Gathering and Processing
Oil, Gas, and NGL Pipelines
Oil and Gas Storage
Refining and Oil Products Transport

110
Exhibit 75: Northeast (High Case) - New Infrastructure
Total
2012-2016
Total
2017-2035
Average
2012-2016
Average
2017-2035
Gas Well Completions 10,391 63,172 2,078 3,325
Oil Well Completions 3,788 12,489 758 657
Total Well Completions 14,179 75,661 2,836 3,982
Gas Production (Bcfd) 15.6 47.3 15.6 47.3
Crude Oil Production (MMBbl/d) 0.06 0.17 0.06 0.17
NGL Production (MMBbl/d) 0.28 1.78 0.28 1.78
Offshore Platform Capacity (MBOE/d) 0 0 0 0
Gas Gathering Line Miles 2,201 7,305 440 384
Gas Gathering Line Diameter (Inch) 10.8 13.7 10.8 13.7
Gas Gathering Line Compressor (1000 HP) 1,356 7,660 271 403
Oil Gathering Line Miles 221 1,301 44 68
Oil Gathering Line Diameter (Inch) 4.0 4.4 4.0 4.4
Oil & Gas Gathering Line Miles 2,422 8,607 484 453
Oil & Gas Gathering Line Diameter (Inch) 10.2 12.3 10.2 12.3
Gas Processing Plant Capacity (Bcfd) 11.3 29.0 2.3 1.5
Gas Processing Plant Compressor (1000 HP) 1,129 2,900 226 153
NGL Fractionation Capacity (MBOE/d) 385 1,182 77 62
Oil Line Miles 317 415 63 22
Oil Line Diameter (Inch) 31.9 40.6 31.9 40.6
Pump for Oil Lines (1000 HP) 97 473 19 25
NGL Line Miles 613 2,238 123 118
NGL Line Diameter (Inch) 19.1 15.2 19.1 15.2
Pump for NGL Lines (1000 HP) 5 33 1 2
Gas Line Miles 1,775 11,571 355 609
Gas Line Diameter (Inch) 26.8 24.1 26.8 24.1
Compressor for Gas Lines (1000 HP) 188 61 188 61
Oil, Gas, and NGL Line Miles 2,706 14,224 541 749
Oil, Gas, and NGL Line Diameter (Inch) 25.7 23.2 25.7 23.2
Crude Oil Storage Capaciy (MBbl) 4,561 4,502 912 237
Gas Storage Capacity (Bcf) 24 66 5 3
Refining Capacity Enhancement (1000 BPD) 0 0 0 0
Oil Product Pipeline Miles 228 96 46 5
Oil Product Pipeline Diameter (Inch) 16.4 16.0 16.4 16.0
Oil Product Pipeline Pump (1000 HP) 40 17 8 1
Crude Oil Rails Terminal Loading/Unloading Capacity (1000 BPD) 25 0 5 0
LNG Export Capacity (Bcfd) 0.0 0.8 0.0 0.0
NGL Export Capacity (MBOE/d) 99.8 178.0 20.0 9.4
Export Terminals
Surface and Lease Equipment
Gathering and Processing
Oil, Gas, and NGL Pipelines
Oil and Gas Storage
Refining and Oil Products Transport

111
Exhibit 76: Offshore (Base Case) - New Infrastructure
Total
2012-2016
Total
2017-2035
Average
2012-2016
Average
2017-2035
Gas Well Completions 153 320 31 17
Oil Well Completions 617 1,443 123 76
Total Well Completions 770 1,764 154 93
Gas Production (Bcfd) 3.8 3.6 3.8 3.6
Crude Oil Production (MMBbl/d) 0.00 0.00 0.00 0.00
NGL Production (MMBbl/d) 0.08 0.03 0.08 0.03
Offshore Platform Capacity (MBOE/d) 3,091 8,454 618 445
Gas Gathering Line Miles 115 193 23 10
Gas Gathering Line Diameter (Inch) 10.9 15.4 10.9 15.4
Gas Gathering Line Compressor (1000 HP) 1 3 0 0
Oil Gathering Line Miles 105 361 21 19
Oil Gathering Line Diameter (Inch) 4.9 7.3 4.9 7.3
Oil & Gas Gathering Line Miles 219 554 44 29
Oil & Gas Gathering Line Diameter (Inch) 8.1 10.1 8.1 10.1
Gas Processing Plant Capacity (Bcfd) 0.2 0.1 0.0 0.0
Gas Processing Plant Compressor (1000 HP) 17 6 3 0
NGL Fractionation Capacity (MBOE/d) 0 0 0 0
Oil Line Miles 0 0 0 0
Oil Line Diameter (Inch) 0.0 0.0 0.0 0.0
Pump for Oil Lines (1000 HP) 0 0 0 0
NGL Line Miles 0 0 0 0
NGL Line Diameter (Inch) 0.0 0.0 0.0 0.0
Pump for NGL Lines (1000 HP) 0 0 0 0
Gas Line Miles 26 2 5 0
Gas Line Diameter (Inch) 30.0 30.0 30.0 30.0
Compressor for Gas Lines (1000 HP) 0 0 0 0
Oil, Gas, and NGL Line Miles 26 2 5 0
Oil, Gas, and NGL Line Diameter (Inch) 0.0 0.0 0.0 0.0
Crude Oil Storage Capaciy (MBbl) 0 0 0 0
Gas Storage Capacity (Bcf) 0 0 0 0
Refining Capacity Enhancement (1000 BPD) 0 0 0 0
Oil Product Pipeline Miles 0 0 0 0
Oil Product Pipeline Diameter (Inch) 0.0 0.0 0.0 0.0
Oil Product Pipeline Pump (1000 HP) 0 0 0 0
Crude Oil Rails Terminal Loading/Unloading Capacity (1000 BPD) 0 0 0 0
LNG Export Capacity (Bcfd) 0.0 0.0 0.0 0.0
NGL Export Capacity (MBOE/d) 0.0 0.0 0.0 0.0
Surface and Lease Equipment
Gathering and Processing
Oil, Gas, and NGL Pipelines
Oil and Gas Storage
Refining and Oil Products Transport
Export Terminals

112
Exhibit 77: Offshore (High Case) - New Infrastructure
Total
2012-2016
Total
2017-2035
Average
2012-2016
Average
2017-2035
Gas Well Completions 153 277 31 15
Oil Well Completions 617 1,326 123 70
Total Well Completions 770 1,603 154 84
Gas Production (Bcfd) 3.8 3.8 3.8 3.8
Crude Oil Production (MMBbl/d) 0.00 0.00 0.00 0.00
NGL Production (MMBbl/d) 0.08 0.04 0.08 0.04
Offshore Platform Capacity (MBOE/d) 3,091 9,728 618 512
Gas Gathering Line Miles 115 175 23 9
Gas Gathering Line Diameter (Inch) 10.9 15.3 10.9 15.3
Gas Gathering Line Compressor (1000 HP) 1 2 0 0
Oil Gathering Line Miles 105 331 21 17
Oil Gathering Line Diameter (Inch) 4.9 7.2 4.9 7.2
Oil & Gas Gathering Line Miles 219 506 44 27
Oil & Gas Gathering Line Diameter (Inch) 8.1 10.0 8.1 10.0
Gas Processing Plant Capacity (Bcfd) 0.2 0.1 0.0 0.0
Gas Processing Plant Compressor (1000 HP) 17 6 3 0
NGL Fractionation Capacity (MBOE/d) 0 0 0 0
Oil Line Miles 0 0 0 0
Oil Line Diameter (Inch) 0.0 0.0 0.0 0.0
Pump for Oil Lines (1000 HP) 0 0 0 0
NGL Line Miles 0 0 0 0
NGL Line Diameter (Inch) 0.0 0.0 0.0 0.0
Pump for NGL Lines (1000 HP) 0 0 0 0
Gas Line Miles 26 2 5 0
Gas Line Diameter (Inch) 30.0 30.0 30.0 30.0
Compressor for Gas Lines (1000 HP) 0 0 0 0
Oil, Gas, and NGL Line Miles 26 2 5 0
Oil, Gas, and NGL Line Diameter (Inch) 0.0 0.0 0.0 0.0
Crude Oil Storage Capaciy (MBbl) 0 0 0 0
Gas Storage Capacity (Bcf) 0 0 0 0
Refining Capacity Enhancement (1000 BPD) 0 0 0 0
Oil Product Pipeline Miles 0 0 0 0
Oil Product Pipeline Diameter (Inch) 0.0 0.0 0.0 0.0
Oil Product Pipeline Pump (1000 HP) 0 0 0 0
Crude Oil Rails Terminal Loading/Unloading Capacity (1000 BPD) 0 0 0 0
LNG Export Capacity (Bcfd) 0.0 0.0 0.0 0.0
NGL Export Capacity (MBOE/d) 0.0 0.0 0.0 0.0
Surface and Lease Equipment
Gathering and Processing
Oil, Gas, and NGL Pipelines
Oil and Gas Storage
Refining and Oil Products Transport
Export Terminals

113
Exhibit 78: Southeast (Base Case) - New Infrastructure
Total
2012-2016
Total
2017-2035
Average
2012-2016
Average
2017-2035
Gas Well Completions 494 1,398 99 74
Oil Well Completions 754 1,355 151 71
Total Well Completions 1,248 2,753 250 145
Gas Production (Bcfd) 0.6 0.5 0.6 0.5
Crude Oil Production (MMBbl/d) 0.10 0.06 0.10 0.06
NGL Production (MMBbl/d) 0.00 0.00 0.00 0.00
Offshore Platform Capacity (MBOE/d) 0 0 0 0
Gas Gathering Line Miles 250 521 50 27
Gas Gathering Line Diameter (Inch) 6.2 7.2 6.2 7.2
Gas Gathering Line Compressor (1000 HP) 1 2 0 0
Oil Gathering Line Miles 188 339 38 18
Oil Gathering Line Diameter (Inch) 4.4 4.0 4.4 4.0
Oil & Gas Gathering Line Miles 438 860 88 45
Oil & Gas Gathering Line Diameter (Inch) 5.4 5.9 5.4 5.9
Gas Processing Plant Capacity (Bcfd) 0.0 0.0 0.0 0.0
Gas Processing Plant Compressor (1000 HP) 2 1 0 0
NGL Fractionation Capacity (MBOE/d) 1 85 0 4
Oil Line Miles 11 2 2 0
Oil Line Diameter (Inch) 18.0 18.0 18.0 18.0
Pump for Oil Lines (1000 HP) 0 0 0 0
NGL Line Miles 20 0 4 0
NGL Line Diameter (Inch) 8.0 0.0 8.0 0.0
Pump for NGL Lines (1000 HP) 0 17 0 1
Gas Line Miles 1,708 5,315 342 280
Gas Line Diameter (Inch) 24.5 24.2 24.5 24.2
Compressor for Gas Lines (1000 HP) 170 34 170 34
Oil, Gas, and NGL Line Miles 1,739 5,317 348 280
Oil, Gas, and NGL Line Diameter (Inch) 24.2 24.2 24.2 24.2
Crude Oil Storage Capaciy (MBbl) 2,070 343 414 18
Gas Storage Capacity (Bcf) 85 66 17 3
Refining Capacity Enhancement (1000 BPD) 0 0 0 0
Oil Product Pipeline Miles 295 193 59 10
Oil Product Pipeline Diameter (Inch) 23.5 23.4 23.5 23.4
Oil Product Pipeline Pump (1000 HP) 52 34 10 2
Crude Oil Rails Terminal Loading/Unloading Capacity (1000 BPD) 70 0 14 0
LNG Export Capacity (Bcfd) 0.0 0.4 0.0 0.0
NGL Export Capacity (MBOE/d) 0.0 0.0 0.0 0.0
Export Terminals
Surface and Lease Equipment
Gathering and Processing
Oil, Gas, and NGL Pipelines
Oil and Gas Storage
Refining and Oil Products Transport

114
Exhibit 79: Southeast (High Case) - New Infrastructure
Total
2012-2016
Total
2017-2035
Average
2012-2016
Average
2017-2035
Gas Well Completions 494 1,368 99 72
Oil Well Completions 754 2,172 151 114
Total Well Completions 1,248 3,540 250 186
Gas Production (Bcfd) 0.6 0.5 0.6 0.5
Crude Oil Production (MMBbl/d) 0.10 0.08 0.10 0.08
NGL Production (MMBbl/d) 0.00 0.00 0.00 0.00
Offshore Platform Capacity (MBOE/d) 0 0 0 0
Gas Gathering Line Miles 250 675 50 36
Gas Gathering Line Diameter (Inch) 6.2 6.3 6.2 6.3
Gas Gathering Line Compressor (1000 HP) 1 2 0 0
Oil Gathering Line Miles 188 543 38 29
Oil Gathering Line Diameter (Inch) 4.4 4.0 4.4 4.0
Oil & Gas Gathering Line Miles 438 1,218 88 64
Oil & Gas Gathering Line Diameter (Inch) 5.4 5.3 5.4 5.3
Gas Processing Plant Capacity (Bcfd) 0.0 0.0 0.0 0.0
Gas Processing Plant Compressor (1000 HP) 2 1 0 0
NGL Fractionation Capacity (MBOE/d) 2 42 0 2
Oil Line Miles 11 5 2 0
Oil Line Diameter (Inch) 18.0 18.0 18.0 18.0
Pump for Oil Lines (1000 HP) 0 0 0 0
NGL Line Miles 20 0 4 0
NGL Line Diameter (Inch) 8.0 0.0 8.0 0.0
Pump for NGL Lines (1000 HP) 0 17 0 1
Gas Line Miles 1,708 10,642 342 560
Gas Line Diameter (Inch) 24.5 22.8 24.5 22.8
Compressor for Gas Lines (1000 HP) 170 55 170 55
Oil, Gas, and NGL Line Miles 1,739 10,647 348 560
Oil, Gas, and NGL Line Diameter (Inch) 24.2 22.8 24.2 22.8
Crude Oil Storage Capaciy (MBbl) 2,070 966 414 51
Gas Storage Capacity (Bcf) 85 111 17 6
Refining Capacity Enhancement (1000 BPD) 0 0 0 0
Oil Product Pipeline Miles 295 347 59 18
Oil Product Pipeline Diameter (Inch) 23.5 23.4 23.5 23.4
Oil Product Pipeline Pump (1000 HP) 52 61 10 3
Crude Oil Rails Terminal Loading/Unloading Capacity (1000 BPD) 70 0 14 0
LNG Export Capacity (Bcfd) 0.0 0.4 0.0 0.0
NGL Export Capacity (MBOE/d) 0.0 0.0 0.0 0.0
Export Terminals
Surface and Lease Equipment
Gathering and Processing
Oil, Gas, and NGL Pipelines
Oil and Gas Storage
Refining and Oil Products Transport

115
Exhibit 80: Southwest (Base Case) - New Infrastructure
Total
2012-2016
Total
2017-2035
Average
2012-2016
Average
2017-2035
Gas Well Completions 20,380 66,386 4,076 3,494
Oil Well Completions 75,030 216,916 15,006 11,417
Total Well Completions 95,410 283,302 19,082 14,911
Gas Production (Bcfd) 33.0 34.0 33.0 34.0
Crude Oil Production (MMBbl/d) 5.18 6.19 5.18 6.19
NGL Production (MMBbl/d) 1.93 2.70 1.93 2.70
Offshore Platform Capacity (MBOE/d) 0 0 0 0
Gas Gathering Line Miles 17,851 44,475 3,570 2,341
Gas Gathering Line Diameter (Inch) 6.3 6.7 6.3 6.7
Gas Gathering Line Compressor (1000 HP) 733 1,829 147 96
Oil Gathering Line Miles 10,768 16,472 2,154 867
Oil Gathering Line Diameter (Inch) 4.1 5.7 4.1 5.7
Oil & Gas Gathering Line Miles 28,619 60,947 5,724 3,208
Oil & Gas Gathering Line Diameter (Inch) 5.4 6.4 5.4 6.4
Gas Processing Plant Capacity (Bcfd) 6.7 5.6 1.3 0.3
Gas Processing Plant Compressor (1000 HP) 669 558 134 29
NGL Fractionation Capacity (MBOE/d) 814 1,269 163 67
Oil Line Miles 6,314 1,247 1,263 66
Oil Line Diameter (Inch) 18.0 26.3 18.0 26.3
Pump for Oil Lines (1000 HP) 599 210 120 11
NGL Line Miles 9,648 3,879 1,930 204
NGL Line Diameter (Inch) 16.6 13.5 16.6 13.5
Pump for NGL Lines (1000 HP) 212 76 42 4
Gas Line Miles 1,199 3,195 240 168
Gas Line Diameter (Inch) 26.9 21.8 26.9 21.8
Compressor for Gas Lines (1000 HP) 113 58 113 58
Oil, Gas, and NGL Line Miles 17,161 8,320 3,432 438
Oil, Gas, and NGL Line Diameter (Inch) 17.9 18.6 17.9 18.6
Crude Oil Storage Capaciy (MBbl) 81,485 19,942 16,297 1,050
Gas Storage Capacity (Bcf) 98 138 20 7
Refining Capacity Enhancement (1000 BPD) 0 0 0 0
Oil Product Pipeline Miles 500 984 100 52
Oil Product Pipeline Diameter (Inch) 13.7 14.1 13.7 14.1
Oil Product Pipeline Pump (1000 HP) 89 174 18 9
Crude Oil Rails Terminal Loading/Unloading Capacity (1000 BPD) 212 0 42 0
LNG Export Capacity (Bcfd) 1.4 9.1 0.3 0.5
NGL Export Capacity (MBOE/d) 664.3 680.9 132.9 35.8
Surface and Lease Equipment
Gathering and Processing
Oil, Gas, and NGL Pipelines
Oil and Gas Storage
Refining and Oil Products Transport
Export Terminals

116
Exhibit 81: Southwest (High Case) - New Infrastructure
Total
2012-2016
Total
2017-2035
Average
2012-2016
Average
2017-2035
Gas Well Completions 20,380 65,567 4,076 3,451
Oil Well Completions 75,030 282,729 15,006 14,880
Total Well Completions 95,410 348,297 19,082 18,331
Gas Production (Bcfd) 33.0 37.2 33.0 37.2
Crude Oil Production (MMBbl/d) 5.18 8.11 5.18 8.11
NGL Production (MMBbl/d) 1.93 3.06 1.93 3.06
Offshore Platform Capacity (MBOE/d) 0 0 0 0
Gas Gathering Line Miles 17,851 55,414 3,570 2,917
Gas Gathering Line Diameter (Inch) 6.3 6.3 6.3 6.3
Gas Gathering Line Compressor (1000 HP) 733 2,472 147 130
Oil Gathering Line Miles 10,768 19,743 2,154 1,039
Oil Gathering Line Diameter (Inch) 4.1 5.7 4.1 5.7
Oil & Gas Gathering Line Miles 28,619 75,157 5,724 3,956
Oil & Gas Gathering Line Diameter (Inch) 5.4 6.2 5.4 6.2
Gas Processing Plant Capacity (Bcfd) 6.7 9.0 1.3 0.5
Gas Processing Plant Compressor (1000 HP) 669 903 134 48
NGL Fractionation Capacity (MBOE/d) 814 1,921 163 101
Oil Line Miles 6,314 2,303 1,263 121
Oil Line Diameter (Inch) 18.0 28.7 18.0 28.7
Pump for Oil Lines (1000 HP) 599 428 120 23
NGL Line Miles 9,648 6,715 1,930 353
NGL Line Diameter (Inch) 16.6 14.2 16.6 14.2
Pump for NGL Lines (1000 HP) 212 147 42 8
Gas Line Miles 1,199 8,706 240 458
Gas Line Diameter (Inch) 26.9 21.3 26.9 21.3
Compressor for Gas Lines (1000 HP) 113 70 113 70
Oil, Gas, and NGL Line Miles 17,161 17,724 3,432 933
Oil, Gas, and NGL Line Diameter (Inch) 17.9 19.6 17.9 19.6
Crude Oil Storage Capaciy (MBbl) 81,485 67,966 16,297 3,577
Gas Storage Capacity (Bcf) 98 237 20 12
Refining Capacity Enhancement (1000 BPD) 0 0 0 0
Oil Product Pipeline Miles 500 1,654 100 87
Oil Product Pipeline Diameter (Inch) 13.7 14.2 13.7 14.2
Oil Product Pipeline Pump (1000 HP) 89 293 18 15
Crude Oil Rails Terminal Loading/Unloading Capacity (1000 BPD) 212 0 42 0
LNG Export Capacity (Bcfd) 1.4 19.1 0.3 1.0
NGL Export Capacity (MBOE/d) 664.3 1,264.5 132.9 66.6
Surface and Lease Equipment
Gathering and Processing
Oil, Gas, and NGL Pipelines
Oil and Gas Storage
Refining and Oil Products Transport
Export Terminals

117
Exhibit 82: Western (Base Case) - New Infrastructure
Total
2012-2016
Total
2017-2035
Average
2012-2016
Average
2017-2035
Gas Well Completions 85 278 17 15
Oil Well Completions 7,296 8,754 1,459 461
Total Well Completions 7,381 9,032 1,476 475
Gas Production (Bcfd) 0.6 0.5 0.6 0.5
Crude Oil Production (MMBbl/d) 0.55 0.38 0.55 0.38
NGL Production (MMBbl/d) 0.04 0.04 0.04 0.04
Offshore Platform Capacity (MBOE/d) 0 0 0 0
Gas Gathering Line Miles 1,432 1,538 286 81
Gas Gathering Line Diameter (Inch) 4.7 7.0 4.7 7.0
Gas Gathering Line Compressor (1000 HP) 6 17 1 1
Oil Gathering Line Miles 1,810 1,952 362 103
Oil Gathering Line Diameter (Inch) 4.0 4.8 4.0 4.8
Oil & Gas Gathering Line Miles 3,242 3,490 648 184
Oil & Gas Gathering Line Diameter (Inch) 4.3 5.8 4.3 5.8
Gas Processing Plant Capacity (Bcfd) 0.0 0.1 0.0 0.0
Gas Processing Plant Compressor (1000 HP) 4 11 1 1
NGL Fractionation Capacity (MBOE/d) 3 0 1 0
Oil Line Miles 2 0 0 0
Oil Line Diameter (Inch) 0.0 18.0 0.0 18.0
Pump for Oil Lines (1000 HP) 0 0 0 0
NGL Line Miles 3 6 1 0
NGL Line Diameter (Inch) 14.0 14.0 14.0 14.0
Pump for NGL Lines (1000 HP) 0 0 0 0
Gas Line Miles 305 327 61 17
Gas Line Diameter (Inch) 22.2 21.5 22.2 21.5
Compressor for Gas Lines (1000 HP) 16 0 16 0
Oil, Gas, and NGL Line Miles 309 333 62 18
Oil, Gas, and NGL Line Diameter (Inch) 3.2 21.4 3.2 21.4
Crude Oil Storage Capaciy (MBbl) 327 0 65 0
Gas Storage Capacity (Bcf) 65 0 13 0
Refining Capacity Enhancement (1000 BPD) 0 0 0 0
Oil Product Pipeline Miles 360 363 72 19
Oil Product Pipeline Diameter (Inch) 10.5 11.9 10.5 11.9
Oil Product Pipeline Pump (1000 HP) 64 64 13 3
Crude Oil Rails Terminal Loading/Unloading Capacity (1000 BPD) 548 146 110 8
LNG Export Capacity (Bcfd) 0.0 0.0 0.0 0.0
NGL Export Capacity (MBOE/d) 2.6 1.1 0.5 0.1
Export Terminals
Surface and Lease Equipment
Gathering and Processing
Oil, Gas, and NGL Pipelines
Oil and Gas Storage
Refining and Oil Products Transport

118
Exhibit 83: Western (High Case) - New Infrastructure
Total
2012-2016
Total
2017-2035
Average
2012-2016
Average
2017-2035
Gas Well Completions 85 236 17 12
Oil Well Completions 7,296 8,485 1,459 447
Total Well Completions 7,381 8,721 1,476 459
Gas Production (Bcfd) 0.6 0.5 0.6 0.5
Crude Oil Production (MMBbl/d) 0.55 0.44 0.55 0.44
NGL Production (MMBbl/d) 0.04 0.04 0.04 0.04
Offshore Platform Capacity (MBOE/d) 0 0 0 0
Gas Gathering Line Miles 1,432 1,522 286 80
Gas Gathering Line Diameter (Inch) 4.7 7.0 4.7 7.0
Gas Gathering Line Compressor (1000 HP) 6 18 1 1
Oil Gathering Line Miles 1,810 1,947 362 102
Oil Gathering Line Diameter (Inch) 4.0 4.9 4.0 4.9
Oil & Gas Gathering Line Miles 3,242 3,469 648 183
Oil & Gas Gathering Line Diameter (Inch) 4.3 5.8 4.3 5.8
Gas Processing Plant Capacity (Bcfd) 0.0 0.1 0.0 0.0
Gas Processing Plant Compressor (1000 HP) 4 12 1 1
NGL Fractionation Capacity (MBOE/d) 3 0 1 0
Oil Line Miles 2 0 0 0
Oil Line Diameter (Inch) 0.0 18.0 0.0 18.0
Pump for Oil Lines (1000 HP) 0 0 0 0
NGL Line Miles 3 6 1 0
NGL Line Diameter (Inch) 14.0 14.0 14.0 14.0
Pump for NGL Lines (1000 HP) 0 0 0 0
Gas Line Miles 305 434 61 23
Gas Line Diameter (Inch) 22.2 22.5 22.2 22.5
Compressor for Gas Lines (1000 HP) 16 5 16 5
Oil, Gas, and NGL Line Miles 309 440 62 23
Oil, Gas, and NGL Line Diameter (Inch) 3.2 22.4 3.2 22.4
Crude Oil Storage Capaciy (MBbl) 327 0 65 0
Gas Storage Capacity (Bcf) 65 3 13 0
Refining Capacity Enhancement (1000 BPD) 0 0 0 0
Oil Product Pipeline Miles 360 654 72 34
Oil Product Pipeline Diameter (Inch) 10.5 11.9 10.5 11.9
Oil Product Pipeline Pump (1000 HP) 64 116 13 6
Crude Oil Rails Terminal Loading/Unloading Capacity (1000 BPD) 548 146 110 8
LNG Export Capacity (Bcfd) 0.0 0.0 0.0 0.0
NGL Export Capacity (MBOE/d) 2.6 1.1 0.5 0.1
Export Terminals
Surface and Lease Equipment
Gathering and Processing
Oil, Gas, and NGL Pipelines
Oil and Gas Storage
Refining and Oil Products Transport

119
Enhancement, Upgrade, Replacement, and Refurbishment (E/U/R/R)
Exhibit 84: U.S. (Base Case) - E/U/R/R
Total
2012-2016
Total
2017-2035
Average
2012-2016
Average
2017-2035
Gas Gathering Line Miles 31,162 90,276 6,232 4,751
Gas Gathering Line Diameter (Inch) 4.2 5.0 4.2 5.0
Gas Gathering Line Compressor (1000 HP) 2,734 10,520 547 554
Oil Gathering Line Miles 5,247 28,104 1,049 1,479
Oil Gathering Line Diameter (Inch) 3.6 4.4 3.6 4.4
Oil & Gas Gathering Line Miles 36,409 118,380 7,282 6,231
Oil & Gas Gathering Line Diameter (Inch) 4.1 4.9 4.1 4.9
Gas Processing Plant Capacity (Bcfd) 12.4 41.0 2.5 2.2
Gas Processing Plant Compressor (1000 HP) 533 1,982 107 104
NGL Fractionation Capacity (MBOE/d) 365 2,186 73 115
Oil Line Miles 233 1,034 47 54
Oil Line Diameter (Inch) 21.5 21.6 21.5 21.6
Pump for Oil Lines (1000 HP) 207 1,090 41 57
NGL Line Miles 187 775 37 41
NGL Line Diameter (Inch) 16.0 24.4 16.0 24.4
Pump for NGL Lines (1000 HP) 106 470 21 25
Gas Line Miles 1,469 5,765 294 303
Gas Line Diameter (Inch) 19.4 19.7 19.4 19.7
Compressor for Gas Lines (1000 HP) 255 306 255 306
Oil, Gas, and NGL Line Miles 1,888 7,575 378 399
Oil, Gas, and NGL Line Diameter (Inch) 19.4 20.4 19.4 20.4
Crude Oil Storage Capaciy (MBbl) 70,885 244,292 14,177 12,857
Gas Storage Capacity (Bcf) 194 783 39 41
Refining Capacity Enhancement (1000 BPD) 4,590 14,815 918 780
Oil Product Pipeline Miles 291 1,133 58 60
Oil Product Pipeline Diameter (Inch) 12.9 12.9 12.9 12.9
Oil Product Pipeline Pump (1000 HP) 695 2,708 139 143
Refining and Oil Products Transport
Oil and Gas Storage
Oil, Gas, and NGL Pipelines
Gathering and Processing

120
Exhibit 85: U.S. (High Case) - E/U/R/R
Total
2012-2016
Total
2017-2035
Average
2012-2016
Average
2017-2035
Gas Gathering Line Miles 31,162 93,202 6,232 4,905
Gas Gathering Line Diameter (Inch) 4.2 5.0 4.2 5.0
Gas Gathering Line Compressor (1000 HP) 2,734 11,454 547 603
Oil Gathering Line Miles 5,247 29,197 1,049 1,537
Oil Gathering Line Diameter (Inch) 3.6 4.4 3.6 4.4
Oil & Gas Gathering Line Miles 36,409 122,399 7,282 6,442
Oil & Gas Gathering Line Diameter (Inch) 4.1 4.9 4.1 4.9
Gas Processing Plant Capacity (Bcfd) 12.4 43.8 2.5 2.3
Gas Processing Plant Compressor (1000 HP) 533 2,106 107 111
NGL Fractionation Capacity (MBOE/d) 365 2,472 73 130
Oil Line Miles 233 1,058 47 56
Oil Line Diameter (Inch) 21.5 21.8 21.5 21.8
Pump for Oil Lines (1000 HP) 207 1,215 41 64
NGL Line Miles 187 791 37 42
NGL Line Diameter (Inch) 16.0 27.7 16.0 27.7
Pump for NGL Lines (1000 HP) 106 480 21 25
Gas Line Miles 1,469 5,902 294 311
Gas Line Diameter (Inch) 19.4 19.8 19.4 19.8
Compressor for Gas Lines (1000 HP) 255 315 255 315
Oil, Gas, and NGL Line Miles 1,888 7,750 378 408
Oil, Gas, and NGL Line Diameter (Inch) 19.4 20.8 19.4 20.8
Crude Oil Storage Capaciy (MBbl) 70,885 270,713 14,177 14,248
Gas Storage Capacity (Bcf) 194 800 39 42
Refining Capacity Enhancement (1000 BPD) 4,590 16,198 918 853
Oil Product Pipeline Miles 291 1,155 58 61
Oil Product Pipeline Diameter (Inch) 12.9 12.9 12.9 12.9
Oil Product Pipeline Pump (1000 HP) 695 2,762 139 145
Oil, Gas, and NGL Pipelines
Gathering and Processing
Refining and Oil Products Transport
Oil and Gas Storage

121
Exhibit 86: Alaska (Base Case) - E/U/R/R
Total
2012-2016
Total
2017-2035
Average
2012-2016
Average
2017-2035
Gas Gathering Line Miles 58 136 12 7
Gas Gathering Line Diameter (Inch) 7.1 8.6 7.1 8.6
Gas Gathering Line Compressor (1000 HP) 308 596 62 31
Oil Gathering Line Miles 38 185 8 10
Oil Gathering Line Diameter (Inch) 7.5 7.8 7.5 7.8
Oil & Gas Gathering Line Miles 96 320 19 17
Oil & Gas Gathering Line Diameter (Inch) 7.3 8.1 7.3 8.1
Gas Processing Plant Capacity (Bcfd) 1.4 2.7 0.3 0.1
Gas Processing Plant Compressor (1000 HP) 57 111 11 6
NGL Fractionation Capacity (MBOE/d) 0 0 0 0
Oil Line Miles 11 41 2 2
Oil Line Diameter (Inch) 18.0 18.0 18.0 18.0
Pump for Oil Lines (1000 HP) 9 32 2 2
NGL Line Miles 0 0 0 0
NGL Line Diameter (Inch) 12.0 0.0 12.0 0.0
Pump for NGL Lines (1000 HP) 0 0 0 0
Gas Line Miles 4 17 1 1
Gas Line Diameter (Inch) 11.6 11.6 11.6 11.6
Compressor for Gas Lines (1000 HP) 0 0 0 0
Oil, Gas, and NGL Line Miles 15 58 3 3
Oil, Gas, and NGL Line Diameter (Inch) 16.2 16.2 16.2 16.2
Crude Oil Storage Capaciy (MBbl) 1,875 4,349 375 229
Gas Storage Capacity (Bcf) 0 0 0 0
Refining Capacity Enhancement (1000 BPD) 48 140 10 7
Oil Product Pipeline Miles 1 2 0 0
Oil Product Pipeline Diameter (Inch) 12.9 12.9 12.9 12.9
Oil Product Pipeline Pump (1000 HP) 1 5 0 0
Refining and Oil Products Transport
Oil, Gas, and NGL Pipelines
Oil and Gas Storage
Gathering and Processing

122
Exhibit 87: Alaska (High Case) - E/U/R/R
Total
2012-2016
Total
2017-2035
Average
2012-2016
Average
2017-2035
Gas Gathering Line Miles 58 131 12 7
Gas Gathering Line Diameter (Inch) 7.1 8.6 7.1 8.6
Gas Gathering Line Compressor (1000 HP) 308 596 62 31
Oil Gathering Line Miles 38 176 8 9
Oil Gathering Line Diameter (Inch) 7.5 7.8 7.5 7.8
Oil & Gas Gathering Line Miles 96 308 19 16
Oil & Gas Gathering Line Diameter (Inch) 7.3 8.1 7.3 8.1
Gas Processing Plant Capacity (Bcfd) 1.4 2.7 0.3 0.1
Gas Processing Plant Compressor (1000 HP) 57 111 11 6
NGL Fractionation Capacity (MBOE/d) 0 0 0 0
Oil Line Miles 11 41 2 2
Oil Line Diameter (Inch) 18.0 18.0 18.0 18.0
Pump for Oil Lines (1000 HP) 9 32 2 2
NGL Line Miles 0 0 0 0
NGL Line Diameter (Inch) 12.0 0.0 12.0 0.0
Pump for NGL Lines (1000 HP) 0 0 0 0
Gas Line Miles 4 17 1 1
Gas Line Diameter (Inch) 11.6 11.6 11.6 11.6
Compressor for Gas Lines (1000 HP) 0 0 0 0
Oil, Gas, and NGL Line Miles 15 58 3 3
Oil, Gas, and NGL Line Diameter (Inch) 16.2 16.2 16.2 16.2
Crude Oil Storage Capaciy (MBbl) 1,875 4,349 375 229
Gas Storage Capacity (Bcf) 0 0 0 0
Refining Capacity Enhancement (1000 BPD) 48 159 10 8
Oil Product Pipeline Miles 1 2 0 0
Oil Product Pipeline Diameter (Inch) 12.9 12.9 12.9 12.9
Oil Product Pipeline Pump (1000 HP) 1 5 0 0
Gathering and Processing
Refining and Oil Products Transport
Oil, Gas, and NGL Pipelines
Oil and Gas Storage

123
Exhibit 88: Central (Base Case) - E/U/R/R
Total
2012-2016
Total
2017-2035
Average
2012-2016
Average
2017-2035
Gas Gathering Line Miles 7,749 23,772 1,550 1,251
Gas Gathering Line Diameter (Inch) 4.5 5.3 4.5 5.3
Gas Gathering Line Compressor (1000 HP) 556 1,551 111 82
Oil Gathering Line Miles 729 7,411 146 390
Oil Gathering Line Diameter (Inch) 4.1 4.5 4.1 4.5
Oil & Gas Gathering Line Miles 8,478 31,183 1,696 1,641
Oil & Gas Gathering Line Diameter (Inch) 4.5 5.1 4.5 5.1
Gas Processing Plant Capacity (Bcfd) 2.9 8.5 0.6 0.4
Gas Processing Plant Compressor (1000 HP) 110 331 22 17
NGL Fractionation Capacity (MBOE/d) 44 218 9 11
Oil Line Miles 47 238 9 13
Oil Line Diameter (Inch) 24.5 24.4 24.5 24.4
Pump for Oil Lines (1000 HP) 40 246 8 13
NGL Line Miles 44 172 9 9
NGL Line Diameter (Inch) 13.0 15.6 13.0 15.6
Pump for NGL Lines (1000 HP) 20 82 4 4
Gas Line Miles 271 1,036 54 55
Gas Line Diameter (Inch) 16.2 16.3 16.2 16.3
Compressor for Gas Lines (1000 HP) 33 33 33 33
Oil, Gas, and NGL Line Miles 361 1,447 72 76
Oil, Gas, and NGL Line Diameter (Inch) 16.9 17.6 16.9 17.6
Crude Oil Storage Capaciy (MBbl) 19,843 68,557 3,969 3,608
Gas Storage Capacity (Bcf) 21 90 4 5
Refining Capacity Enhancement (1000 BPD) 318 1,016 64 53
Oil Product Pipeline Miles 65 252 13 13
Oil Product Pipeline Diameter (Inch) 12.9 12.9 12.9 12.9
Oil Product Pipeline Pump (1000 HP) 155 603 31 32
Oil and Gas Storage
Refining and Oil Products Transport
Oil, Gas, and NGL Pipelines
Gathering and Processing

124
Exhibit 89: Central (High Case) - E/U/R/R
Total
2012-2016
Total
2017-2035
Average
2012-2016
Average
2017-2035
Gas Gathering Line Miles 7,749 23,969 1,550 1,262
Gas Gathering Line Diameter (Inch) 4.5 5.3 4.5 5.3
Gas Gathering Line Compressor (1000 HP) 556 1,602 111 84
Oil Gathering Line Miles 729 7,554 146 398
Oil Gathering Line Diameter (Inch) 4.1 4.6 4.1 4.6
Oil & Gas Gathering Line Miles 8,478 31,523 1,696 1,659
Oil & Gas Gathering Line Diameter (Inch) 4.5 5.1 4.5 5.1
Gas Processing Plant Capacity (Bcfd) 2.9 8.8 0.6 0.5
Gas Processing Plant Compressor (1000 HP) 110 341 22 18
NGL Fractionation Capacity (MBOE/d) 44 222 9 12
Oil Line Miles 47 241 9 13
Oil Line Diameter (Inch) 24.5 24.4 24.5 24.4
Pump for Oil Lines (1000 HP) 40 249 8 13
NGL Line Miles 44 172 9 9
NGL Line Diameter (Inch) 13.0 15.6 13.0 15.6
Pump for NGL Lines (1000 HP) 20 82 4 4
Gas Line Miles 271 1,045 54 55
Gas Line Diameter (Inch) 16.2 16.4 16.2 16.4
Compressor for Gas Lines (1000 HP) 33 34 33 34
Oil, Gas, and NGL Line Miles 361 1,458 72 77
Oil, Gas, and NGL Line Diameter (Inch) 16.9 17.6 16.9 17.6
Crude Oil Storage Capaciy (MBbl) 19,843 75,899 3,969 3,995
Gas Storage Capacity (Bcf) 21 92 4 5
Refining Capacity Enhancement (1000 BPD) 318 1,153 64 61
Oil Product Pipeline Miles 65 255 13 13
Oil Product Pipeline Diameter (Inch) 12.9 12.9 12.9 12.9
Oil Product Pipeline Pump (1000 HP) 155 610 31 32
Oil, Gas, and NGL Pipelines
Gathering and Processing
Oil and Gas Storage
Refining and Oil Products Transport

125
Exhibit 90: Midwest (Base Case) - E/U/R/R
Total
2012-2016
Total
2017-2035
Average
2012-2016
Average
2017-2035
Gas Gathering Line Miles 376 1,014 75 53
Gas Gathering Line Diameter (Inch) 5.0 5.0 5.0 5.0
Gas Gathering Line Compressor (1000 HP) 12 41 2 2
Oil Gathering Line Miles 0 0 0 0
Oil Gathering Line Diameter (Inch) 0.0 0.0 0.0 0.0
Oil & Gas Gathering Line Miles 376 1,014 75 53
Oil & Gas Gathering Line Diameter (Inch) 5.0 5.0 5.0 5.0
Gas Processing Plant Capacity (Bcfd) 0.7 1.5 0.1 0.1
Gas Processing Plant Compressor (1000 HP) 22 46 4 2
NGL Fractionation Capacity (MBOE/d) 13 183 3 10
Oil Line Miles 38 164 8 9
Oil Line Diameter (Inch) 26.7 26.6 26.7 26.6
Pump for Oil Lines (1000 HP) 48 287 10 15
NGL Line Miles 19 98 4 5
NGL Line Diameter (Inch) 17.0 28.5 17.0 28.5
Pump for NGL Lines (1000 HP) 11 68 2 4
Gas Line Miles 202 795 40 42
Gas Line Diameter (Inch) 19.4 19.7 19.4 19.7
Compressor for Gas Lines (1000 HP) 35 45 35 45
Oil, Gas, and NGL Line Miles 259 1,056 52 56
Oil, Gas, and NGL Line Diameter (Inch) 20.3 21.6 20.3 21.6
Crude Oil Storage Capaciy (MBbl) 1,029 2,960 206 156
Gas Storage Capacity (Bcf) 52 200 10 11
Refining Capacity Enhancement (1000 BPD) 600 2,074 120 109
Oil Product Pipeline Miles 62 238 12 13
Oil Product Pipeline Diameter (Inch) 12.9 12.9 12.9 12.9
Oil Product Pipeline Pump (1000 HP) 147 570 29 30
Oil and Gas Storage
Refining and Oil Products Transport
Oil, Gas, and NGL Pipelines
Gathering and Processing

126
Exhibit 91: Midwest (High Case) - E/U/R/R
Total
2012-2016
Total
2017-2035
Average
2012-2016
Average
2017-2035
Gas Gathering Line Miles 376 1,027 75 54
Gas Gathering Line Diameter (Inch) 5.0 5.0 5.0 5.0
Gas Gathering Line Compressor (1000 HP) 12 45 2 2
Oil Gathering Line Miles 0 0 0 0
Oil Gathering Line Diameter (Inch) 0.0 0.0 0.0 0.0
Oil & Gas Gathering Line Miles 376 1,027 75 54
Oil & Gas Gathering Line Diameter (Inch) 5.0 5.0 5.0 5.0
Gas Processing Plant Capacity (Bcfd) 0.7 1.5 0.1 0.1
Gas Processing Plant Compressor (1000 HP) 22 47 4 2
NGL Fractionation Capacity (MBOE/d) 13 249 3 13
Oil Line Miles 38 166 8 9
Oil Line Diameter (Inch) 26.7 26.7 26.7 26.7
Pump for Oil Lines (1000 HP) 48 306 10 16
NGL Line Miles 19 106 4 6
NGL Line Diameter (Inch) 17.0 34.7 17.0 34.7
Pump for NGL Lines (1000 HP) 11 71 2 4
Gas Line Miles 202 815 40 43
Gas Line Diameter (Inch) 19.4 19.8 19.4 19.8
Compressor for Gas Lines (1000 HP) 35 46 35 46
Oil, Gas, and NGL Line Miles 259 1,087 52 57
Oil, Gas, and NGL Line Diameter (Inch) 20.3 22.3 20.3 22.3
Crude Oil Storage Capaciy (MBbl) 1,029 3,050 206 161
Gas Storage Capacity (Bcf) 54 210 11 11
Refining Capacity Enhancement (1000 BPD) 600 2,202 120 116
Oil Product Pipeline Miles 62 241 12 13
Oil Product Pipeline Diameter (Inch) 12.9 12.9 12.9 12.9
Oil Product Pipeline Pump (1000 HP) 147 576 29 30
Oil, Gas, and NGL Pipelines
Gathering and Processing
Oil and Gas Storage
Refining and Oil Products Transport

127
Exhibit 92: Northeast (Base Case) - E/U/R/R
Total
2012-2016
Total
2017-2035
Average
2012-2016
Average
2017-2035
Gas Gathering Line Miles 4,364 10,858 873 571
Gas Gathering Line Diameter (Inch) 5.0 6.7 5.0 6.7
Gas Gathering Line Compressor (1000 HP) 375 4,188 75 220
Oil Gathering Line Miles 12 311 2 16
Oil Gathering Line Diameter (Inch) 4.0 4.0 4.0 4.0
Oil & Gas Gathering Line Miles 4,377 11,169 875 588
Oil & Gas Gathering Line Diameter (Inch) 5.0 6.6 5.0 6.6
Gas Processing Plant Capacity (Bcfd) 0.4 10.3 0.1 0.5
Gas Processing Plant Compressor (1000 HP) 48 651 10 34
NGL Fractionation Capacity (MBOE/d) 5 436 1 23
Oil Line Miles 1 7 0 0
Oil Line Diameter (Inch) 30.0 30.5 30.0 30.5
Pump for Oil Lines (1000 HP) 3 22 1 1
NGL Line Miles 4 20 1 1
NGL Line Diameter (Inch) 16.3 16.5 16.3 16.5
Pump for NGL Lines (1000 HP) 3 18 1 1
Gas Line Miles 188 802 38 42
Gas Line Diameter (Inch) 20.6 21.3 20.6 21.3
Compressor for Gas Lines (1000 HP) 44 66 44 66
Oil, Gas, and NGL Line Miles 193 829 39 44
Oil, Gas, and NGL Line Diameter (Inch) 20.6 21.2 20.6 21.2
Crude Oil Storage Capaciy (MBbl) 1,392 6,456 278 340
Gas Storage Capacity (Bcf) 20 77 4 4
Refining Capacity Enhancement (1000 BPD) 288 973 58 51
Oil Product Pipeline Miles 25 94 5 5
Oil Product Pipeline Diameter (Inch) 12.9 12.9 12.9 12.9
Oil Product Pipeline Pump (1000 HP) 59 224 12 12
Refining and Oil Products Transport
Oil and Gas Storage
Oil, Gas, and NGL Pipelines
Gathering and Processing

128
Exhibit 93: Northeast (High Case) - E/U/R/R
Total
2012-2016
Total
2017-2035
Average
2012-2016
Average
2017-2035
Gas Gathering Line Miles 4,364 10,994 873 579
Gas Gathering Line Diameter (Inch) 5.0 6.8 5.0 6.8
Gas Gathering Line Compressor (1000 HP) 375 4,830 75 254
Oil Gathering Line Miles 12 457 2 24
Oil Gathering Line Diameter (Inch) 4.0 4.1 4.0 4.1
Oil & Gas Gathering Line Miles 4,377 11,451 875 603
Oil & Gas Gathering Line Diameter (Inch) 5.0 6.6 5.0 6.6
Gas Processing Plant Capacity (Bcfd) 0.4 12.1 0.1 0.6
Gas Processing Plant Compressor (1000 HP) 48 729 10 38
NGL Fractionation Capacity (MBOE/d) 5 513 1 27
Oil Line Miles 1 13 0 1
Oil Line Diameter (Inch) 30.0 33.8 30.0 33.8
Pump for Oil Lines (1000 HP) 3 99 1 5
NGL Line Miles 4 22 1 1
NGL Line Diameter (Inch) 16.3 17.2 16.3 17.2
Pump for NGL Lines (1000 HP) 3 19 1 1
Gas Line Miles 188 836 38 44
Gas Line Diameter (Inch) 20.6 21.3 20.6 21.3
Compressor for Gas Lines (1000 HP) 44 69 44 69
Oil, Gas, and NGL Line Miles 193 871 39 46
Oil, Gas, and NGL Line Diameter (Inch) 20.6 21.4 20.6 21.4
Crude Oil Storage Capaciy (MBbl) 1,392 7,796 278 410
Gas Storage Capacity (Bcf) 20 77 4 4
Refining Capacity Enhancement (1000 BPD) 288 1,042 58 55
Oil Product Pipeline Miles 25 94 5 5
Oil Product Pipeline Diameter (Inch) 12.9 12.9 12.9 12.9
Oil Product Pipeline Pump (1000 HP) 59 226 12 12
Oil, Gas, and NGL Pipelines
Gathering and Processing
Oil and Gas Storage
Refining and Oil Products Transport

129
Exhibit 94: Offshore (Base Case) - E/U/R/R
Total
2012-2016
Total
2017-2035
Average
2012-2016
Average
2017-2035
Gas Gathering Line Miles 168 327 34 17
Gas Gathering Line Diameter (Inch) 5.7 7.5 5.7 7.5
Gas Gathering Line Compressor (1000 HP) 149 240 30 13
Oil Gathering Line Miles 41 221 8 12
Oil Gathering Line Diameter (Inch) 5.1 6.0 5.1 6.0
Oil & Gas Gathering Line Miles 209 548 42 29
Oil & Gas Gathering Line Diameter (Inch) 5.6 6.9 5.6 6.9
Gas Processing Plant Capacity (Bcfd) 0.0 0.0 0.0 0.0
Gas Processing Plant Compressor (1000 HP) 2 9 0 0
NGL Fractionation Capacity (MBOE/d) 0 0 0 0
Oil Line Miles 11 44 2 2
Oil Line Diameter (Inch) 24.0 24.0 24.0 24.0
Pump for Oil Lines (1000 HP) 12 46 2 2
NGL Line Miles 0 0 0 0
NGL Line Diameter (Inch) 0.0 0.0 0.0 0.0
Pump for NGL Lines (1000 HP) 0 0 0 0
Gas Line Miles 9 35 2 2
Gas Line Diameter (Inch) 24.7 24.7 24.7 24.7
Compressor for Gas Lines (1000 HP) 2 2 2 2
Oil, Gas, and NGL Line Miles 20 79 4 4
Oil, Gas, and NGL Line Diameter (Inch) 24.3 24.3 24.3 24.3
Crude Oil Storage Capaciy (MBbl) 0 0 0 0
Gas Storage Capacity (Bcf) 0 0 0 0
Refining Capacity Enhancement (1000 BPD) 0 0 0 0
Oil Product Pipeline Miles 0 0 0 0
Oil Product Pipeline Diameter (Inch) 0.0 0.0 0.0 0.0
Oil Product Pipeline Pump (1000 HP) 0 0 0 0
Refining and Oil Products Transport
Gathering and Processing
Oil and Gas Storage
Oil, Gas, and NGL Pipelines

130
Exhibit 95: Offshore (High Case) - E/U/R/R
Total
2012-2016
Total
2017-2035
Average
2012-2016
Average
2017-2035
Gas Gathering Line Miles 168 324 34 17
Gas Gathering Line Diameter (Inch) 5.7 7.4 5.7 7.4
Gas Gathering Line Compressor (1000 HP) 149 240 30 13
Oil Gathering Line Miles 41 217 8 11
Oil Gathering Line Diameter (Inch) 5.1 6.0 5.1 6.0
Oil & Gas Gathering Line Miles 209 541 42 28
Oil & Gas Gathering Line Diameter (Inch) 5.6 6.8 5.6 6.8
Gas Processing Plant Capacity (Bcfd) 0.0 0.0 0.0 0.0
Gas Processing Plant Compressor (1000 HP) 2 9 0 0
NGL Fractionation Capacity (MBOE/d) 0 0 0 0
Oil Line Miles 11 44 2 2
Oil Line Diameter (Inch) 24.0 24.0 24.0 24.0
Pump for Oil Lines (1000 HP) 12 46 2 2
NGL Line Miles 0 0 0 0
NGL Line Diameter (Inch) 0.0 0.0 0.0 0.0
Pump for NGL Lines (1000 HP) 0 0 0 0
Gas Line Miles 9 35 2 2
Gas Line Diameter (Inch) 24.7 24.7 24.7 24.7
Compressor for Gas Lines (1000 HP) 2 2 2 2
Oil, Gas, and NGL Line Miles 20 79 4 4
Oil, Gas, and NGL Line Diameter (Inch) 24.3 24.3 24.3 24.3
Crude Oil Storage Capaciy (MBbl) 0 0 0 0
Gas Storage Capacity (Bcf) 0 0 0 0
Refining Capacity Enhancement (1000 BPD) 0 0 0 0
Oil Product Pipeline Miles 0 0 0 0
Oil Product Pipeline Diameter (Inch) 0.0 0.0 0.0 0.0
Oil Product Pipeline Pump (1000 HP) 0 0 0 0
Oil, Gas, and NGL Pipelines
Oil and Gas Storage
Refining and Oil Products Transport
Gathering and Processing

131
Exhibit 96: Southeast (Base Case) - E/U/R/R
Total
2012-2016
Total
2017-2035
Average
2012-2016
Average
2017-2035
Gas Gathering Line Miles 457 1,054 91 55
Gas Gathering Line Diameter (Inch) 3.6 4.2 3.6 4.2
Gas Gathering Line Compressor (1000 HP) 27 49 5 3
Oil Gathering Line Miles 55 291 11 15
Oil Gathering Line Diameter (Inch) 3.8 4.1 3.8 4.1
Oil & Gas Gathering Line Miles 512 1,345 102 71
Oil & Gas Gathering Line Diameter (Inch) 3.6 4.1 3.6 4.1
Gas Processing Plant Capacity (Bcfd) 0.5 0.9 0.1 0.0
Gas Processing Plant Compressor (1000 HP) 18 36 4 2
NGL Fractionation Capacity (MBOE/d) 4 38 1 2
Oil Line Miles 13 49 3 3
Oil Line Diameter (Inch) 18.0 18.0 18.0 18.0
Pump for Oil Lines (1000 HP) 10 38 2 2
NGL Line Miles 7 27 1 1
NGL Line Diameter (Inch) 8.0 8.0 8.0 8.0
Pump for NGL Lines (1000 HP) 3 12 1 1
Gas Line Miles 216 877 43 46
Gas Line Diameter (Inch) 21.3 21.6 21.3 21.6
Compressor for Gas Lines (1000 HP) 43 54 43 54
Oil, Gas, and NGL Line Miles 237 953 47 50
Oil, Gas, and NGL Line Diameter (Inch) 20.7 21.0 20.7 21.0
Crude Oil Storage Capaciy (MBbl) 1,000 3,453 200 182
Gas Storage Capacity (Bcf) 15 65 3 3
Refining Capacity Enhancement (1000 BPD) 263 768 53 40
Oil Product Pipeline Miles 35 136 7 7
Oil Product Pipeline Diameter (Inch) 12.9 12.9 12.9 12.9
Oil Product Pipeline Pump (1000 HP) 83 324 17 17
Refining and Oil Products Transport
Gathering and Processing
Oil and Gas Storage
Oil, Gas, and NGL Pipelines

132
Exhibit 97: Southeast (High Case) - E/U/R/R
Total
2012-2016
Total
2017-2035
Average
2012-2016
Average
2017-2035
Gas Gathering Line Miles 457 1,092 91 57
Gas Gathering Line Diameter (Inch) 3.6 4.1 3.6 4.1
Gas Gathering Line Compressor (1000 HP) 27 49 5 3
Oil Gathering Line Miles 55 339 11 18
Oil Gathering Line Diameter (Inch) 3.8 4.1 3.8 4.1
Oil & Gas Gathering Line Miles 512 1,431 102 75
Oil & Gas Gathering Line Diameter (Inch) 3.6 4.1 3.6 4.1
Gas Processing Plant Capacity (Bcfd) 0.5 0.9 0.1 0.0
Gas Processing Plant Compressor (1000 HP) 18 36 4 2
NGL Fractionation Capacity (MBOE/d) 4 23 1 1
Oil Line Miles 13 49 3 3
Oil Line Diameter (Inch) 18.0 18.0 18.0 18.0
Pump for Oil Lines (1000 HP) 10 38 2 2
NGL Line Miles 7 27 1 1
NGL Line Diameter (Inch) 8.0 8.0 8.0 8.0
Pump for NGL Lines (1000 HP) 3 12 1 1
Gas Line Miles 216 914 43 48
Gas Line Diameter (Inch) 21.3 21.6 21.3 21.6
Compressor for Gas Lines (1000 HP) 43 56 43 56
Oil, Gas, and NGL Line Miles 237 991 47 52
Oil, Gas, and NGL Line Diameter (Inch) 20.7 21.1 20.7 21.1
Crude Oil Storage Capaciy (MBbl) 1,000 3,680 200 194
Gas Storage Capacity (Bcf) 15 67 3 4
Refining Capacity Enhancement (1000 BPD) 263 873 53 46
Oil Product Pipeline Miles 35 138 7 7
Oil Product Pipeline Diameter (Inch) 12.9 12.9 12.9 12.9
Oil Product Pipeline Pump (1000 HP) 83 330 17 17
Oil, Gas, and NGL Pipelines
Oil and Gas Storage
Refining and Oil Products Transport
Gathering and Processing

133
Exhibit 98: Southwest (Base Case) - E/U/R/R
Total
2012-2016
Total
2017-2035
Average
2012-2016
Average
2017-2035
Gas Gathering Line Miles 16,206 49,064 3,241 2,582
Gas Gathering Line Diameter (Inch) 4.0 4.7 4.0 4.7
Gas Gathering Line Compressor (1000 HP) 1,285 3,802 257 200
Oil Gathering Line Miles 3,051 15,661 610 824
Oil Gathering Line Diameter (Inch) 3.9 4.6 3.9 4.6
Oil & Gas Gathering Line Miles 19,257 64,725 3,851 3,407
Oil & Gas Gathering Line Diameter (Inch) 4.0 4.7 4.0 4.7
Gas Processing Plant Capacity (Bcfd) 6.4 16.6 1.3 0.9
Gas Processing Plant Compressor (1000 HP) 270 782 54 41
NGL Fractionation Capacity (MBOE/d) 293 1,298 59 68
Oil Line Miles 98 443 20 23
Oil Line Diameter (Inch) 19.0 19.0 19.0 19.0
Pump for Oil Lines (1000 HP) 76 382 15 20
NGL Line Miles 112 457 22 24
NGL Line Diameter (Inch) 17.5 28.2 17.5 28.2
Pump for NGL Lines (1000 HP) 68 289 14 15
Gas Line Miles 457 1,743 91 92
Gas Line Diameter (Inch) 19.3 19.4 19.3 19.4
Compressor for Gas Lines (1000 HP) 74 81 74 81
Oil, Gas, and NGL Line Miles 667 2,643 133 139
Oil, Gas, and NGL Line Diameter (Inch) 18.9 20.8 18.9 20.8
Crude Oil Storage Capaciy (MBbl) 43,638 153,578 8,728 8,083
Gas Storage Capacity (Bcf) 62 254 12 13
Refining Capacity Enhancement (1000 BPD) 2,557 7,747 511 408
Oil Product Pipeline Miles 77 299 15 16
Oil Product Pipeline Diameter (Inch) 12.9 12.9 12.9 12.9
Oil Product Pipeline Pump (1000 HP) 184 716 37 38
Refining and Oil Products Transport
Oil and Gas Storage
Oil, Gas, and NGL Pipelines
Gathering and Processing

134
Exhibit 99: Southwest (High Case) - E/U/R/R
Total
2012-2016
Total
2017-2035
Average
2012-2016
Average
2017-2035
Gas Gathering Line Miles 16,206 51,618 3,241 2,717
Gas Gathering Line Diameter (Inch) 4.0 4.7 4.0 4.7
Gas Gathering Line Compressor (1000 HP) 1,285 4,038 257 213
Oil Gathering Line Miles 3,051 16,438 610 865
Oil Gathering Line Diameter (Inch) 3.9 4.6 3.9 4.6
Oil & Gas Gathering Line Miles 19,257 68,056 3,851 3,582
Oil & Gas Gathering Line Diameter (Inch) 4.0 4.7 4.0 4.7
Gas Processing Plant Capacity (Bcfd) 6.4 17.4 1.3 0.9
Gas Processing Plant Compressor (1000 HP) 270 816 54 43
NGL Fractionation Capacity (MBOE/d) 293 1,452 59 76
Oil Line Miles 98 456 20 24
Oil Line Diameter (Inch) 19.0 19.2 19.0 19.2
Pump for Oil Lines (1000 HP) 76 409 15 22
NGL Line Miles 112 462 22 24
NGL Line Diameter (Inch) 17.5 32.4 17.5 32.4
Pump for NGL Lines (1000 HP) 68 296 14 16
Gas Line Miles 457 1,778 91 94
Gas Line Diameter (Inch) 19.3 19.4 19.3 19.4
Compressor for Gas Lines (1000 HP) 74 83 74 83
Oil, Gas, and NGL Line Miles 667 2,696 133 142
Oil, Gas, and NGL Line Diameter (Inch) 18.9 21.6 18.9 21.6
Crude Oil Storage Capaciy (MBbl) 43,638 170,999 8,728 9,000
Gas Storage Capacity (Bcf) 61 257 12 14
Refining Capacity Enhancement (1000 BPD) 2,557 8,672 511 456
Oil Product Pipeline Miles 77 309 15 16
Oil Product Pipeline Diameter (Inch) 12.9 12.9 12.9 12.9
Oil Product Pipeline Pump (1000 HP) 184 739 37 39
Oil, Gas, and NGL Pipelines
Gathering and Processing
Refining and Oil Products Transport
Oil and Gas Storage

135
Exhibit 100: Western (Base Case) - E/U/R/R
Total
2012-2016
Total
2017-2035
Average
2012-2016
Average
2017-2035
Gas Gathering Line Miles 1,784 4,053 357 213
Gas Gathering Line Diameter (Inch) 2.1 2.7 2.1 2.7
Gas Gathering Line Compressor (1000 HP) 23 54 5 3
Oil Gathering Line Miles 1,321 4,024 264 212
Oil Gathering Line Diameter (Inch) 2.5 3.2 2.5 3.2
Oil & Gas Gathering Line Miles 3,105 8,077 621 425
Oil & Gas Gathering Line Diameter (Inch) 2.3 3.0 2.3 3.0
Gas Processing Plant Capacity (Bcfd) 0.2 0.4 0.0 0.0
Gas Processing Plant Compressor (1000 HP) 7 16 1 1
NGL Fractionation Capacity (MBOE/d) 6 13 1 1
Oil Line Miles 13 47 3 2
Oil Line Diameter (Inch) 18.0 18.0 18.0 18.0
Pump for Oil Lines (1000 HP) 10 37 2 2
NGL Line Miles 0 1 0 0
NGL Line Diameter (Inch) 14.0 14.0 14.0 14.0
Pump for NGL Lines (1000 HP) 0 0 0 0
Gas Line Miles 121 462 24 24
Gas Line Diameter (Inch) 22.0 22.1 22.0 22.1
Compressor for Gas Lines (1000 HP) 24 25 24 25
Oil, Gas, and NGL Line Miles 134 510 27 27
Oil, Gas, and NGL Line Diameter (Inch) 21.6 21.7 21.6 21.7
Crude Oil Storage Capaciy (MBbl) 2,109 4,939 422 260
Gas Storage Capacity (Bcf) 25 97 5 5
Refining Capacity Enhancement (1000 BPD) 515 2,097 103 110
Oil Product Pipeline Miles 28 111 6 6
Oil Product Pipeline Diameter (Inch) 12.9 12.9 12.9 12.9
Oil Product Pipeline Pump (1000 HP) 66 266 13 14
Refining and Oil Products Transport
Oil and Gas Storage
Gathering and Processing
Oil, Gas, and NGL Pipelines
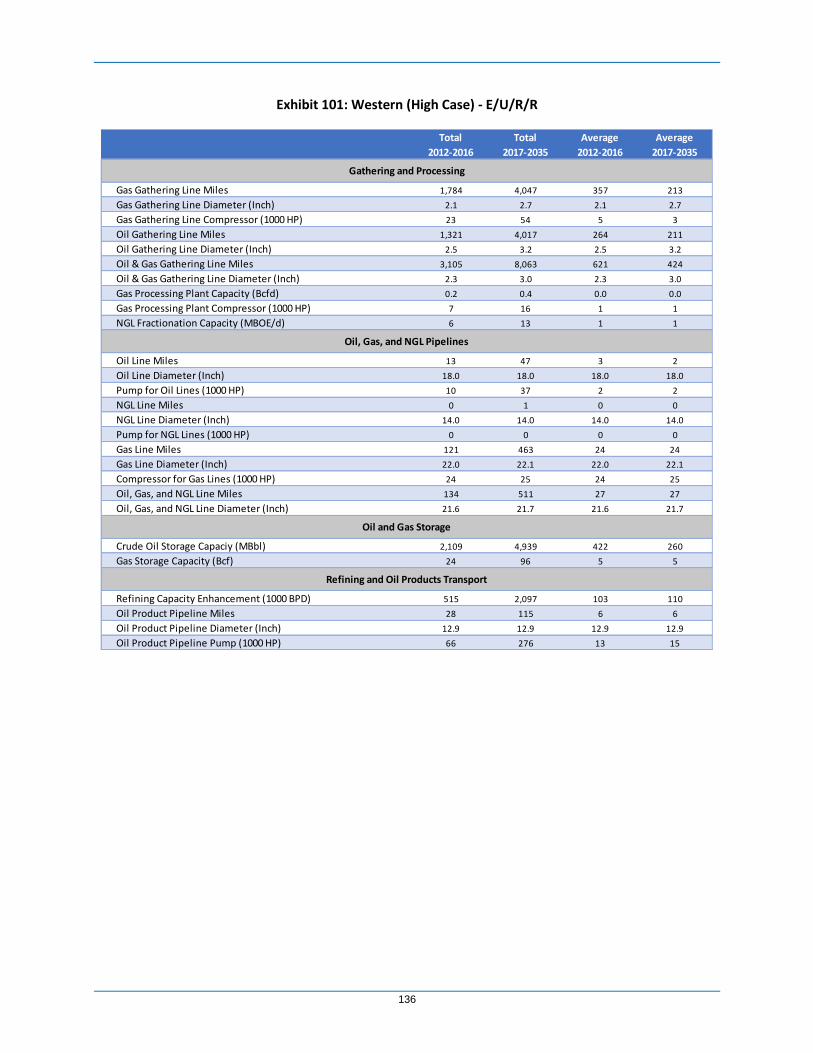
136
Exhibit 101: Western (High Case) - E/U/R/R
Total
2012-2016
Total
2017-2035
Average
2012-2016
Average
2017-2035
Gas Gathering Line Miles 1,784 4,047 357 213
Gas Gathering Line Diameter (Inch) 2.1 2.7 2.1 2.7
Gas Gathering Line Compressor (1000 HP) 23 54 5 3
Oil Gathering Line Miles 1,321 4,017 264 211
Oil Gathering Line Diameter (Inch) 2.5 3.2 2.5 3.2
Oil & Gas Gathering Line Miles 3,105 8,063 621 424
Oil & Gas Gathering Line Diameter (Inch) 2.3 3.0 2.3 3.0
Gas Processing Plant Capacity (Bcfd) 0.2 0.4 0.0 0.0
Gas Processing Plant Compressor (1000 HP) 7 16 1 1
NGL Fractionation Capacity (MBOE/d) 6 13 1 1
Oil Line Miles 13 47 3 2
Oil Line Diameter (Inch) 18.0 18.0 18.0 18.0
Pump for Oil Lines (1000 HP) 10 37 2 2
NGL Line Miles 0 1 0 0
NGL Line Diameter (Inch) 14.0 14.0 14.0 14.0
Pump for NGL Lines (1000 HP) 0 0 0 0
Gas Line Miles 121 463 24 24
Gas Line Diameter (Inch) 22.0 22.1 22.0 22.1
Compressor for Gas Lines (1000 HP) 24 25 24 25
Oil, Gas, and NGL Line Miles 134 511 27 27
Oil, Gas, and NGL Line Diameter (Inch) 21.6 21.7 21.6 21.7
Crude Oil Storage Capaciy (MBbl) 2,109 4,939 422 260
Gas Storage Capacity (Bcf) 24 96 5 5
Refining Capacity Enhancement (1000 BPD) 515 2,097 103 110
Oil Product Pipeline Miles 28 115 6 6
Oil Product Pipeline Diameter (Inch) 12.9 12.9 12.9 12.9
Oil Product Pipeline Pump (1000 HP) 66 276 13 15
Gathering and Processing
Oil, Gas, and NGL Pipelines
Refining and Oil Products Transport
Oil and Gas Storage
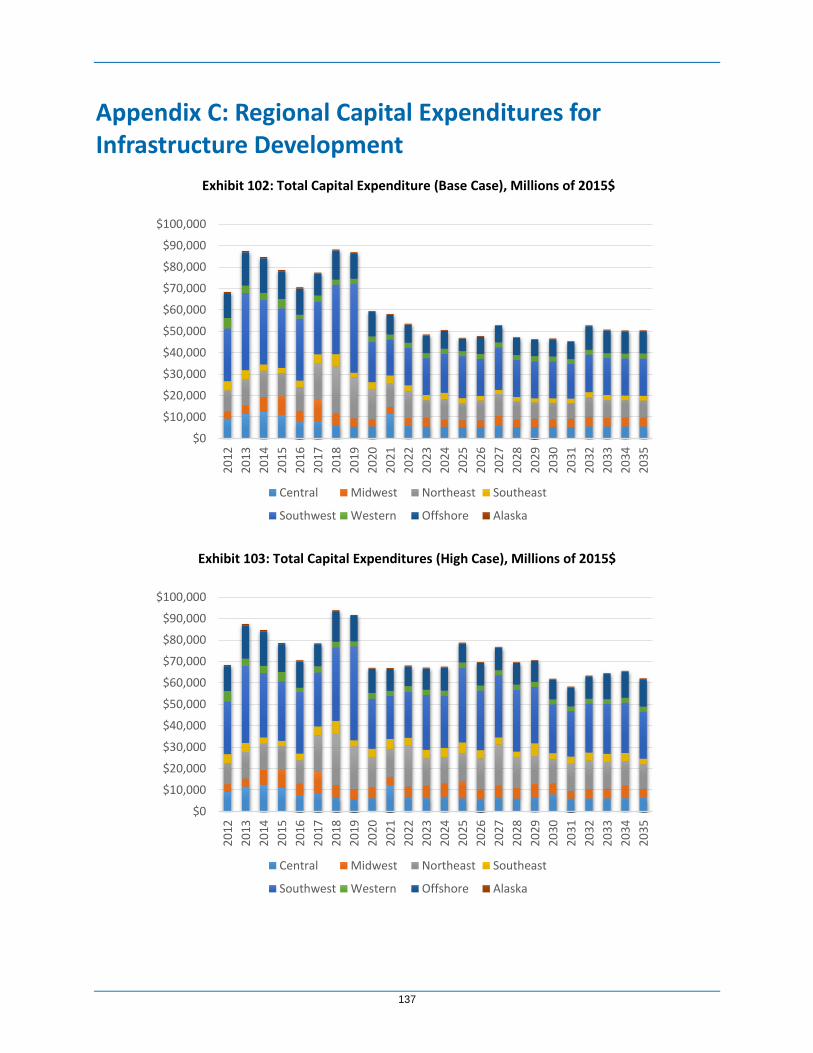
137
Appendix C: Regional Capital Expenditures for Infrastructure Development
Exhibit 102: Total Capital Expenditure (Base Case), Millions of 2015$
Exhibit 103: Total Capital Expenditures (High Case), Millions of 2015$
$0
$10,000
$20,000
$30,000
$40,000
$50,000
$60,000
$70,000
$80,000
$90,000
$100,00020
12
2013
2014
2015
2016
2017
2018
2019
2020
2021
2022
2023
2024
2025
2026
202
7
2028
2029
2030
2031
2032
2033
2034
2035
Central Midwest Northeast Southeast
Southwest Western Offshore Alaska
$0
$10,000
$20,000
$30,000
$40,000
$50,000
$60,000
$70,000
$80,000
$90,000
$100,000
2012
2013
2014
2015
2016
2017
2018
2019
2020
2021
2022
2023
2024
2025
2026
202
7
2028
2029
2030
2031
2032
2033
2034
2035
Central Midwest Northeast Southeast
Southwest Western Offshore Alaska

138
Exhibit 104: Total Capital Expenditure (Base Case), Millions of 2015$
Exhibit 105: Total Capital Expenditures (High Case), Millions of 2015$
Year Central Midwest Northeast Southeast Southwest Western Offshore Alaska US
2012 $9,200 $3,494 $9,707 $4,342 $24,640 $4,824 $11,586 $582 $68,374
2013 $11,557 $3,805 $12,412 $4,097 $36,004 $3,400 $15,582 $611 $87,467
2014 $12,415 $6,957 $12,165 $3,059 $30,005 $3,333 $16,129 $600 $84,662
2015 $10,957 $8,800 $10,755 $2,371 $27,861 $4,347 $12,929 $578 $78,599
2016 $7,612 $5,353 $10,936 $3,121 $28,913 $1,810 $12,194 $590 $70,530
2017 $8,153 $10,159 $16,877 $4,096 $24,609 $2,765 $10,292 $419 $77,369
2018 $6,218 $5,419 $21,922 $5,756 $32,449 $2,318 $13,678 $411 $88,171
2019 $5,461 $3,943 $18,947 $2,365 $41,610 $2,168 $12,017 $398 $86,907
2020 $5,610 $3,422 $13,946 $3,316 $18,786 $2,571 $11,355 $390 $59,395
2021 $11,504 $3,210 $10,830 $3,909 $16,689 $2,322 $9,192 $387 $58,043
2022 $6,196 $3,270 $12,556 $2,767 $17,574 $2,308 $8,423 $379 $53,474
2023 $5,460 $4,148 $8,180 $2,449 $17,245 $2,346 $8,261 $374 $48,462
2024 $5,511 $3,345 $9,327 $3,132 $18,222 $2,347 $8,305 $370 $50,558
2025 $5,299 $3,273 $7,745 $2,445 $19,637 $2,352 $5,835 $363 $46,949
2026 $5,313 $3,100 $9,271 $2,182 $17,228 $2,275 $8,016 $356 $47,742
2027 $6,047 $4,436 $10,219 $1,961 $19,859 $2,277 $7,682 $348 $52,829
2028 $5,310 $3,438 $8,436 $2,138 $17,289 $2,275 $7,978 $340 $47,204
2029 $5,324 $3,918 $7,544 $1,940 $17,304 $2,364 $7,636 $335 $46,365
2030 $5,244 $3,564 $7,758 $2,146 $17,274 $2,260 $8,016 $327 $46,590
2031 $5,290 $3,874 $7,283 $2,190 $16,169 $2,194 $8,033 $318 $45,351
2032 $5,595 $4,492 $9,101 $2,403 $17,543 $2,200 $11,114 $313 $52,762
2033 $5,585 $3,993 $8,278 $2,382 $17,260 $2,203 $10,738 $309 $50,748
2034 $5,643 $4,080 $8,066 $2,279 $17,286 $2,247 $10,460 $305 $50,365
2035 $5,596 $4,075 $7,988 $2,280 $17,405 $2,297 $10,460 $300 $50,401
Total 2012-2016 $51,740 $28,409 $55,974 $16,990 $147,424 $17,714 $68,420 $2,961 $389,633
Total 2017-2035 $114,358 $79,157 $204,273 $52,137 $381,438 $44,088 $177,490 $6,744 $1,059,686
Average 2012-2016 $10,348 $5,682 $11,195 $3,398 $29,485 $3,543 $13,684 $592 $77,927
Average 2017-2035 $6,019 $4,166 $10,751 $2,744 $20,076 $2,320 $9,342 $355 $55,773
Year Central Midwest Northeast Southeast Southwest Western Offshore Alaska US
2012 $9,200 $3,494 $9,706 $4,343 $24,640 $4,824 $11,586 $582 $68,374
2013 $11,557 $3,805 $12,411 $4,098 $36,004 $3,400 $15,582 $611 $87,467
2014 $12,415 $6,957 $12,164 $3,059 $30,005 $3,333 $16,129 $600 $84,662
2015 $10,957 $8,800 $10,754 $2,372 $27,861 $4,347 $12,929 $578 $78,599
2016 $7,612 $5,353 $10,936 $3,121 $28,913 $1,810 $12,194 $590 $70,530
2017 $8,206 $10,296 $17,022 $4,165 $25,212 $2,831 $10,292 $420 $78,445
2018 $6,571 $5,794 $23,705 $6,185 $34,395 $2,565 $14,295 $414 $93,924
2019 $5,832 $4,592 $19,942 $2,859 $43,861 $2,273 $11,899 $407 $91,665
2020 $6,178 $5,077 $14,069 $3,911 $23,319 $2,703 $11,346 $399 $67,001
2021 $12,154 $3,951 $13,053 $4,646 $20,057 $2,355 $10,362 $394 $66,972
2022 $6,805 $4,863 $18,956 $3,747 $21,478 $2,622 $9,213 $388 $68,072
2023 $6,194 $5,778 $12,816 $3,991 $25,523 $2,452 $9,967 $383 $67,104
2024 $6,858 $6,316 $12,134 $4,339 $24,319 $2,402 $10,802 $378 $67,547
2025 $6,182 $7,795 $13,272 $5,010 $34,765 $2,479 $8,942 $371 $78,817
2026 $5,942 $4,200 $14,552 $3,936 $27,845 $2,325 $10,516 $365 $69,682
2027 $6,703 $5,533 $18,898 $3,451 $29,009 $2,288 $10,536 $356 $76,774
2028 $5,996 $4,902 $14,172 $2,899 $28,861 $2,347 $10,109 $349 $69,635
2029 $6,301 $6,517 $13,020 $6,010 $26,227 $2,396 $9,897 $345 $70,712
2030 $7,948 $5,176 $11,253 $2,867 $22,752 $2,279 $9,322 $337 $61,934
2031 $5,972 $3,595 $12,648 $3,429 $21,181 $2,199 $8,919 $329 $58,273
2032 $6,109 $4,238 $13,329 $3,797 $22,905 $2,203 $10,482 $326 $63,389
2033 $6,160 $4,461 $12,328 $3,931 $23,342 $2,219 $11,796 $319 $64,558
2034 $6,229 $5,971 $11,300 $3,798 $23,484 $2,253 $12,253 $316 $65,603
2035 $6,339 $4,214 $11,447 $2,625 $22,005 $2,286 $12,839 $306 $62,060
Total 2012-2016 $51,740 $28,409 $55,972 $16,992 $147,424 $17,714 $68,420 $2,961 $389,633
Total 2017-2035 $128,678 $103,268 $277,916 $75,598 $500,539 $45,479 $203,787 $6,902 $1,342,167
Average 2012-2016 $10,348 $5,682 $11,194 $3,398 $29,485 $3,543 $13,684 $592 $77,927

139
Exhibit 106: Surface and Lease Equipment (Base Case), Millions of 2015$
Exhibit 107: Surface and Lease Equipment (High Case), Millions of 2015$
$0
$5,000
$10,000
$15,000
$20,000
$25,000
$30,000
2012
2013
2014
2015
2016
2017
2018
2019
2020
2021
2022
2023
202
4
2025
2026
2027
2028
2029
2030
2031
2032
2033
2034
2035
Central Midwest Northeast Southeast
Southwest Western Offshore Alaska
$0
$5,000
$10,000
$15,000
$20,000
$25,000
$30,000
2012
2013
2014
2015
2016
2017
2018
2019
2020
2021
2022
2023
202
4
2025
2026
2027
2028
2029
2030
2031
2032
2033
2034
2035
Central Midwest Northeast Southeast
Southwest Western Offshore Alaska
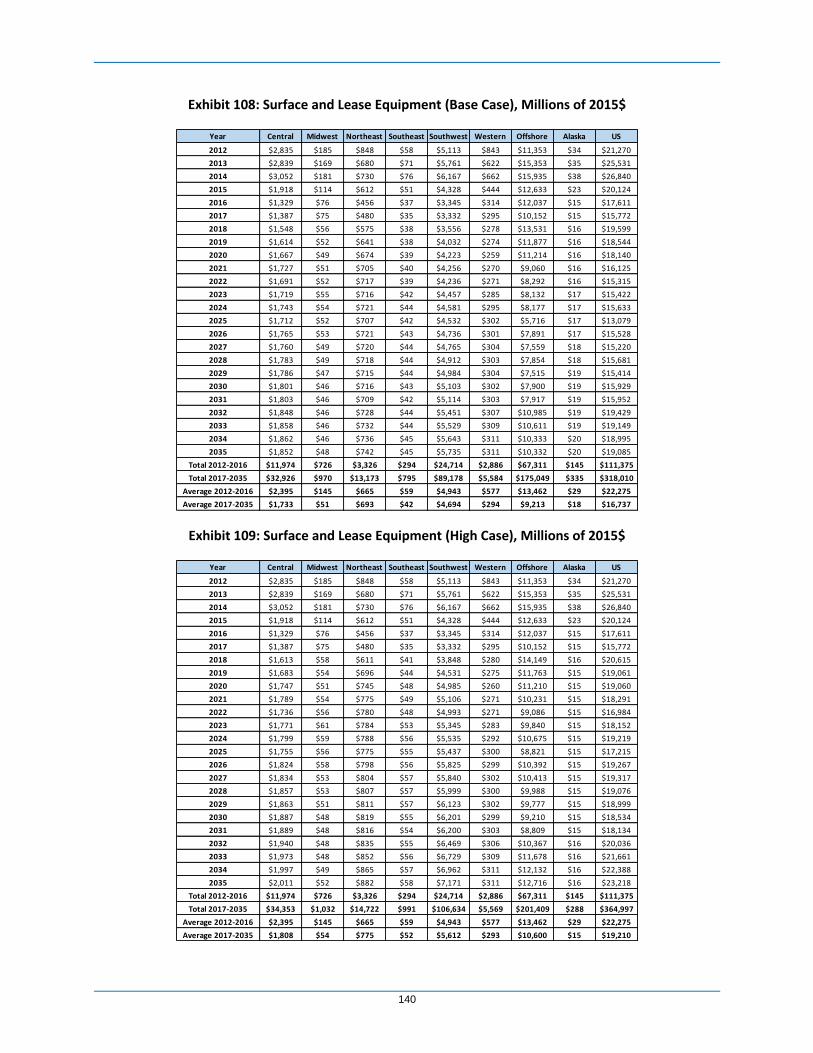
140
Exhibit 108: Surface and Lease Equipment (Base Case), Millions of 2015$
Exhibit 109: Surface and Lease Equipment (High Case), Millions of 2015$
Year Central Midwest Northeast Southeast Southwest Western Offshore Alaska US
2012 $2,835 $185 $848 $58 $5,113 $843 $11,353 $34 $21,270
2013 $2,839 $169 $680 $71 $5,761 $622 $15,353 $35 $25,531
2014 $3,052 $181 $730 $76 $6,167 $662 $15,935 $38 $26,840
2015 $1,918 $114 $612 $51 $4,328 $444 $12,633 $23 $20,124
2016 $1,329 $76 $456 $37 $3,345 $314 $12,037 $15 $17,611
2017 $1,387 $75 $480 $35 $3,332 $295 $10,152 $15 $15,772
2018 $1,548 $56 $575 $38 $3,556 $278 $13,531 $16 $19,599
2019 $1,614 $52 $641 $38 $4,032 $274 $11,877 $16 $18,544
2020 $1,667 $49 $674 $39 $4,223 $259 $11,214 $16 $18,140
2021 $1,727 $51 $705 $40 $4,256 $270 $9,060 $16 $16,125
2022 $1,691 $52 $717 $39 $4,236 $271 $8,292 $16 $15,315
2023 $1,719 $55 $716 $42 $4,457 $285 $8,132 $17 $15,422
2024 $1,743 $54 $721 $44 $4,581 $295 $8,177 $17 $15,633
2025 $1,712 $52 $707 $42 $4,532 $302 $5,716 $17 $13,079
2026 $1,765 $53 $721 $43 $4,736 $301 $7,891 $17 $15,528
2027 $1,760 $49 $720 $44 $4,765 $304 $7,559 $18 $15,220
2028 $1,783 $49 $718 $44 $4,912 $303 $7,854 $18 $15,681
2029 $1,786 $47 $715 $44 $4,984 $304 $7,515 $19 $15,414
2030 $1,801 $46 $716 $43 $5,103 $302 $7,900 $19 $15,929
2031 $1,803 $46 $709 $42 $5,114 $303 $7,917 $19 $15,952
2032 $1,848 $46 $728 $44 $5,451 $307 $10,985 $19 $19,429
2033 $1,858 $46 $732 $44 $5,529 $309 $10,611 $19 $19,149
2034 $1,862 $46 $736 $45 $5,643 $311 $10,333 $20 $18,995
2035 $1,852 $48 $742 $45 $5,735 $311 $10,332 $20 $19,085
Total 2012-2016 $11,974 $726 $3,326 $294 $24,714 $2,886 $67,311 $145 $111,375
Total 2017-2035 $32,926 $970 $13,173 $795 $89,178 $5,584 $175,049 $335 $318,010
Average 2012-2016 $2,395 $145 $665 $59 $4,943 $577 $13,462 $29 $22,275
Average 2017-2035 $1,733 $51 $693 $42 $4,694 $294 $9,213 $18 $16,737
Year Central Midwest Northeast Southeast Southwest Western Offshore Alaska US
2012 $2,835 $185 $848 $58 $5,113 $843 $11,353 $34 $21,270
2013 $2,839 $169 $680 $71 $5,761 $622 $15,353 $35 $25,531
2014 $3,052 $181 $730 $76 $6,167 $662 $15,935 $38 $26,840
2015 $1,918 $114 $612 $51 $4,328 $444 $12,633 $23 $20,124
2016 $1,329 $76 $456 $37 $3,345 $314 $12,037 $15 $17,611
2017 $1,387 $75 $480 $35 $3,332 $295 $10,152 $15 $15,772
2018 $1,613 $58 $611 $41 $3,848 $280 $14,149 $16 $20,615
2019 $1,683 $54 $696 $44 $4,531 $275 $11,763 $15 $19,061
2020 $1,747 $51 $745 $48 $4,985 $260 $11,210 $15 $19,060
2021 $1,789 $54 $775 $49 $5,106 $271 $10,231 $15 $18,291
2022 $1,736 $56 $780 $48 $4,993 $271 $9,086 $15 $16,984
2023 $1,771 $61 $784 $53 $5,345 $283 $9,840 $15 $18,152
2024 $1,799 $59 $788 $56 $5,535 $292 $10,675 $15 $19,219
2025 $1,755 $56 $775 $55 $5,437 $300 $8,821 $15 $17,215
2026 $1,824 $58 $798 $56 $5,825 $299 $10,392 $15 $19,267
2027 $1,834 $53 $804 $57 $5,840 $302 $10,413 $15 $19,317
2028 $1,857 $53 $807 $57 $5,999 $300 $9,988 $15 $19,076
2029 $1,863 $51 $811 $57 $6,123 $302 $9,777 $15 $18,999
2030 $1,887 $48 $819 $55 $6,201 $299 $9,210 $15 $18,534
2031 $1,889 $48 $816 $54 $6,200 $303 $8,809 $15 $18,134
2032 $1,940 $48 $835 $55 $6,469 $306 $10,367 $16 $20,036
2033 $1,973 $48 $852 $56 $6,729 $309 $11,678 $16 $21,661
2034 $1,997 $49 $865 $57 $6,962 $311 $12,132 $16 $22,388
2035 $2,011 $52 $882 $58 $7,171 $311 $12,716 $16 $23,218
Total 2012-2016 $11,974 $726 $3,326 $294 $24,714 $2,886 $67,311 $145 $111,375
Total 2017-2035 $34,353 $1,032 $14,722 $991 $106,634 $5,569 $201,409 $288 $364,997
Average 2012-2016 $2,395 $145 $665 $59 $4,943 $577 $13,462 $29 $22,275
Average 2017-2035 $1,808 $54 $775 $52 $5,612 $293 $10,600 $15 $19,210

141
Exhibit 110: Gathering and Processing (Base Case), Millions of 2015$
Exhibit 111: Gathering and Processing (High Case), Millions of 2015$
$0
$2,000
$4,000
$6,000
$8,000
$10,000
$12,000
$14,000
$16,000
$18,000
$20,000
2012
2013
2014
2015
2016
2017
2018
2019
2020
2021
2022
2023
202
4
2025
2026
2027
2028
2029
2030
2031
2032
2033
2034
2035
Central Midwest Northeast Southeast
Southwest Western Offshore Alaska
$0
$2,000
$4,000
$6,000
$8,000
$10,000
$12,000
$14,000
$16,000
$18,000
$20,000
2012
2013
2014
2015
2016
2017
2018
2019
2020
2021
2022
2023
202
4
2025
2026
2027
2028
2029
2030
2031
2032
2033
2034
2035
Central Midwest Northeast Southeast
Southwest Western Offshore Alaska

142
Exhibit 112: Gathering and Processing (Base Case), Millions of 2015$
Exhibit 113: Gathering and Processing (High Case), Millions of 2015$
Year Central Midwest Northeast Southeast Southwest Western Offshore Alaska US
2012 $2,933 $343 $3,744 $130 $6,843 $240 $199 $424 $14,855
2013 $3,110 $360 $5,142 $140 $7,689 $225 $183 $441 $17,290
2014 $3,290 $356 $5,151 $140 $8,128 $244 $162 $438 $17,907
2015 $3,154 $352 $3,948 $136 $6,684 $207 $127 $415 $15,024
2016 $2,330 $391 $4,510 $116 $5,437 $160 $119 $384 $13,448
2017 $2,303 $367 $4,958 $91 $5,040 $142 $102 $293 $13,296
2018 $2,249 $401 $6,922 $91 $5,593 $136 $107 $283 $15,782
2019 $2,231 $427 $5,693 $88 $5,583 $134 $100 $271 $14,528
2020 $2,226 $422 $6,354 $86 $5,673 $130 $97 $262 $15,248
2021 $1,938 $342 $5,209 $195 $4,756 $135 $89 $256 $12,919
2022 $1,948 $341 $5,013 $197 $5,070 $144 $86 $249 $13,048
2023 $1,985 $343 $4,142 $202 $4,972 $146 $84 $244 $12,118
2024 $1,973 $352 $4,113 $207 $5,043 $147 $83 $239 $12,156
2025 $1,880 $351 $3,554 $207 $4,585 $148 $74 $233 $11,033
2026 $1,963 $230 $4,839 $97 $4,922 $147 $80 $227 $12,506
2027 $1,938 $231 $4,646 $95 $4,697 $149 $77 $218 $12,051
2028 $1,944 $228 $4,126 $93 $4,839 $147 $78 $210 $11,665
2029 $1,906 $225 $3,751 $91 $4,781 $147 $75 $204 $11,180
2030 $1,933 $226 $3,847 $90 $4,907 $144 $77 $198 $11,423
2031 $1,922 $219 $3,617 $88 $4,336 $142 $77 $191 $10,590
2032 $2,084 $226 $4,539 $88 $4,848 $142 $89 $186 $12,202
2033 $2,047 $223 $4,138 $88 $4,638 $142 $88 $181 $11,545
2034 $2,009 $220 $3,931 $87 $4,557 $140 $88 $176 $11,207
2035 $1,966 $215 $3,918 $86 $4,539 $141 $88 $171 $11,125
Total 2012-2016 $14,816 $1,801 $22,495 $661 $34,781 $1,076 $790 $2,102 $78,524
Total 2017-2035 $38,445 $5,590 $87,312 $2,266 $93,378 $2,702 $1,638 $4,291 $235,621
Average 2012-2016 $2,963 $360 $4,499 $132 $6,956 $215 $158 $420 $15,705
Average 2017-2035 $2,023 $294 $4,595 $119 $4,915 $142 $86 $226 $12,401
Year Central Midwest Northeast Southeast Southwest Western Offshore Alaska US
2012 $2,933 $343 $3,743 $130 $6,843 $240 $199 $424 $14,855
2013 $3,110 $360 $5,142 $141 $7,689 $225 $183 $441 $17,290
2014 $3,290 $356 $5,150 $140 $8,128 $244 $162 $438 $17,907
2015 $3,154 $352 $3,948 $136 $6,684 $207 $127 $415 $15,024
2016 $2,330 $391 $4,510 $116 $5,437 $160 $119 $384 $13,448
2017 $2,316 $436 $5,005 $91 $5,128 $142 $102 $293 $13,513
2018 $2,375 $476 $7,770 $92 $6,029 $137 $107 $282 $17,267
2019 $2,312 $481 $6,054 $90 $5,964 $135 $96 $270 $15,402
2020 $2,336 $551 $5,716 $88 $6,184 $131 $92 $260 $15,357
2021 $2,129 $439 $5,923 $142 $5,553 $137 $87 $254 $14,662
2022 $2,045 $440 $5,701 $142 $5,812 $143 $82 $248 $14,613
2023 $2,129 $447 $5,079 $146 $5,783 $147 $82 $243 $14,056
2024 $2,155 $460 $5,177 $149 $5,948 $147 $82 $238 $14,356
2025 $2,042 $462 $4,665 $149 $5,558 $149 $76 $231 $13,333
2026 $2,185 $400 $6,508 $93 $5,859 $147 $79 $225 $15,496
2027 $2,177 $407 $6,529 $92 $5,779 $147 $78 $216 $15,423
2028 $2,174 $406 $5,973 $89 $5,782 $145 $76 $208 $14,852
2029 $2,147 $412 $5,633 $88 $5,899 $146 $74 $202 $14,599
2030 $2,148 $416 $5,730 $86 $5,939 $142 $73 $196 $14,729
2031 $2,112 $277 $5,428 $83 $5,335 $142 $71 $188 $13,636
2032 $2,237 $283 $6,002 $83 $5,579 $142 $75 $183 $14,584
2033 $2,277 $284 $5,923 $83 $5,759 $142 $79 $179 $14,725
2034 $2,281 $283 $5,937 $82 $5,821 $141 $81 $173 $14,799
2035 $2,289 $280 $6,082 $82 $5,889 $140 $83 $168 $15,014
Total 2012-2016 $14,816 $1,801 $22,493 $663 $34,781 $1,076 $790 $2,102 $78,524
Total 2017-2035 $41,864 $7,642 $110,834 $1,948 $109,600 $2,700 $1,575 $4,256 $280,418
Average 2012-2016 $2,963 $360 $4,499 $133 $6,956 $215 $158 $420 $15,705
Average 2017-2035 $2,203 $402 $5,833 $103 $5,768 $142 $83 $224 $14,759

143
Exhibit 114: Oil, Gas, and NGL Pipelines (Base Case), Millions of 2015$
Exhibit 115: Oil, Gas, and NGL Pipelines (High Case), Millions of 2015$
$0
$5,000
$10,000
$15,000
$20,000
$25,000
$30,000
2012
2013
2014
2015
2016
2017
2018
2019
2020
2021
2022
2023
202
4
2025
2026
2027
2028
2029
2030
2031
2032
2033
2034
2035
Central Midwest Northeast Southeast
Southwest Western Offshore Alaska
$0
$5,000
$10,000
$15,000
$20,000
$25,000
$30,000
2012
2013
2014
2015
2016
2017
2018
2019
2020
2021
2022
2023
202
4
2025
2026
2027
2028
2029
2030
2031
2032
2033
2034
2035
Central Midwest Northeast Southeast
Southwest Western Offshore Alaska

144
Exhibit 116: Oil, Gas, and NGL Pipelines (Base Case), Millions of 2015$
Exhibit 117: Oil, Gas, and NGL Pipelines (High Case), Millions of 2015$
Year Central Midwest Northeast Southeast Southwest Western Offshore Alaska US
2012 $1,102 $835 $3,672 $2,458 $5,093 $1,142 $34 $14 $14,349
2013 $3,283 $1,303 $5,475 $2,611 $13,945 $295 $46 $21 $26,980
2014 $4,257 $4,243 $4,859 $1,701 $8,046 $339 $32 $14 $23,491
2015 $2,530 $4,638 $4,382 $1,419 $7,463 $304 $169 $18 $20,922
2016 $1,595 $2,882 $4,660 $1,573 $4,809 $354 $38 $17 $15,929
2017 $3,594 $8,008 $6,541 $3,301 $5,364 $453 $38 $16 $27,315
2018 $687 $3,212 $13,344 $3,050 $5,302 $331 $40 $17 $25,982
2019 $728 $1,765 $11,553 $1,585 $2,728 $259 $40 $17 $18,675
2020 $864 $1,293 $5,874 $2,587 $2,546 $741 $44 $19 $13,968
2021 $6,901 $1,045 $4,060 $2,942 $1,913 $324 $44 $19 $17,247
2022 $1,278 $1,122 $5,730 $1,473 $2,096 $326 $44 $19 $12,089
2023 $852 $2,002 $2,484 $1,521 $2,079 $384 $45 $20 $9,387
2024 $880 $1,225 $3,664 $2,132 $2,955 $398 $45 $20 $11,317
2025 $838 $1,109 $2,513 $1,506 $2,036 $430 $45 $20 $8,496
2026 $731 $1,144 $2,899 $1,327 $2,023 $378 $45 $20 $8,567
2027 $1,499 $2,485 $4,042 $1,210 $1,941 $380 $45 $20 $11,622
2028 $734 $1,489 $2,536 $1,323 $2,047 $382 $46 $20 $8,576
2029 $735 $1,646 $2,115 $1,118 $1,896 $383 $46 $20 $7,960
2030 $577 $1,417 $2,305 $1,159 $1,645 $293 $39 $17 $7,451
2031 $719 $1,932 $2,143 $1,445 $1,349 $306 $39 $17 $7,950
2032 $817 $2,543 $2,895 $1,614 $1,878 $307 $40 $17 $10,111
2033 $836 $2,048 $2,594 $1,579 $1,729 $308 $40 $17 $9,150
2034 $906 $2,106 $2,571 $1,495 $1,629 $308 $40 $18 $9,072
2035 $922 $2,115 $2,505 $1,509 $1,654 $374 $40 $18 $9,136
Total 2012-2016 $12,767 $13,902 $23,047 $9,762 $39,356 $2,433 $319 $85 $101,670
Total 2017-2035 $25,094 $39,707 $82,365 $33,878 $44,809 $7,063 $804 $352 $234,072
Average 2012-2016 $2,553 $2,780 $4,609 $1,952 $7,871 $487 $64 $17 $20,334
Average 2017-2035 $1,321 $2,090 $4,335 $1,783 $2,358 $372 $42 $19 $12,320
Year Central Midwest Northeast Southeast Southwest Western Offshore Alaska US
2012 $1,102 $835 $3,672 $2,458 $5,093 $1,142 $34 $14 $14,349
2013 $3,283 $1,303 $5,475 $2,611 $13,945 $295 $46 $21 $26,980
2014 $4,257 $4,243 $4,859 $1,701 $8,046 $339 $32 $14 $23,491
2015 $2,530 $4,638 $4,382 $1,419 $7,463 $304 $169 $18 $20,922
2016 $1,595 $2,882 $4,660 $1,573 $4,809 $354 $38 $17 $15,929
2017 $3,594 $8,027 $6,617 $3,313 $5,407 $451 $38 $16 $27,461
2018 $725 $3,350 $14,169 $3,292 $5,740 $359 $40 $17 $27,691
2019 $799 $2,221 $12,062 $1,935 $3,146 $260 $40 $17 $20,481
2020 $1,060 $2,659 $6,481 $3,011 $4,723 $741 $44 $19 $18,739
2021 $7,153 $1,590 $5,443 $3,638 $2,832 $324 $44 $19 $21,043
2022 $1,595 $2,538 $11,252 $2,440 $2,836 $588 $44 $19 $21,312
2023 $1,259 $3,312 $6,064 $3,037 $3,608 $480 $45 $20 $17,824
2024 $1,841 $3,981 $5,282 $3,208 $4,589 $428 $45 $20 $19,393
2025 $1,370 $5,130 $6,758 $3,962 $8,517 $488 $45 $20 $26,291
2026 $947 $1,949 $6,372 $2,857 $4,391 $391 $45 $20 $16,972
2027 $1,732 $3,311 $10,705 $2,616 $4,099 $393 $45 $20 $22,923
2028 $969 $2,629 $6,201 $1,835 $4,949 $395 $46 $20 $17,044
2029 $1,102 $3,797 $5,484 $5,067 $3,573 $384 $46 $20 $19,474
2030 $2,823 $2,591 $3,671 $1,774 $3,737 $306 $39 $17 $14,959
2031 $989 $1,469 $5,525 $2,580 $3,324 $307 $39 $17 $14,252
2032 $940 $2,097 $5,399 $2,829 $3,315 $308 $40 $17 $14,944
2033 $932 $2,333 $4,491 $2,998 $3,404 $321 $40 $17 $14,536
2034 $942 $3,803 $3,600 $2,791 $3,098 $309 $40 $18 $14,601
2035 $1,081 $2,103 $3,613 $1,785 $2,613 $388 $40 $18 $11,639
Total 2012-2016 $12,767 $13,902 $23,047 $9,762 $39,356 $2,433 $319 $85 $101,670
Total 2017-2035 $31,854 $58,891 $129,189 $54,967 $77,902 $7,621 $804 $352 $361,579
Average 2012-2016 $2,553 $2,780 $4,609 $1,952 $7,871 $487 $64 $17 $20,334
Average 2017-2035 $1,677 $3,100 $6,799 $2,893 $4,100 $401 $42 $19 $19,030

145
Exhibit 118: Oil and Gas Storage (Base Case), Millions of 2015$
Exhibit 119: Oil and Gas Storage (High Case), Millions of 2015$
$0
$500
$1,000
$1,500
$2,000
$2,500
$3,000
2012
2013
2014
2015
2016
2017
2018
2019
202
0
2021
2022
2023
2024
2025
2026
2027
2028
2029
2030
2031
2032
2033
2034
2035
Central Midwest Northeast Southeast
Southwest Western Offshore Alaska
$0
$500
$1,000
$1,500
$2,000
$2,500
$3,000
2012
2013
2014
2015
2016
2017
2018
2019
202
0
2021
2022
2023
2024
2025
2026
2027
2028
2029
2030
2031
2032
2033
2034
2035
Central Midwest Northeast Southeast
Southwest Western Offshore Alaska

146
Exhibit 120: Oil and Gas Storage (Base Case), Millions of 2015$
Exhibit 121: Oil and Gas Storage (High Case), Millions of 2015$
Year Central Midwest Northeast Southeast Southwest Western Offshore Alaska US
2012 $655 $220 $135 $439 $525 $413 $0 $5 $2,394
2013 $313 $206 $133 $275 $1,223 $413 $0 $9 $2,572
2014 $294 $202 $403 $472 $726 $70 $0 $6 $2,172
2015 $376 $202 $266 $64 $646 $71 $0 $6 $1,630
2016 $263 $194 $147 $64 $729 $71 $0 $7 $1,474
2017 $117 $193 $128 $56 $475 $69 $0 $5 $1,044
2018 $114 $194 $130 $58 $503 $69 $0 $5 $1,073
2019 $111 $195 $131 $57 $379 $69 $0 $4 $947
2020 $109 $197 $132 $56 $814 $70 $0 $4 $1,381
2021 $106 $197 $132 $56 $317 $70 $0 $4 $882
2022 $461 $198 $381 $403 $781 $70 $0 $3 $2,297
2023 $106 $217 $133 $59 $428 $70 $0 $3 $1,016
2024 $130 $200 $133 $147 $387 $70 $0 $3 $1,069
2025 $103 $271 $286 $116 $304 $69 $0 $3 $1,152
2026 $101 $201 $134 $162 $379 $69 $0 $3 $1,049
2027 $99 $201 $134 $62 $297 $69 $0 $2 $864
2028 $97 $202 $379 $128 $331 $69 $0 $2 $1,208
2029 $96 $465 $258 $62 $289 $69 $0 $2 $1,242
2030 $138 $347 $189 $238 $286 $69 $0 $2 $1,268
2031 $94 $205 $136 $64 $282 $69 $0 $2 $851
2032 $92 $205 $261 $105 $279 $69 $0 $2 $1,013
2033 $91 $205 $136 $119 $275 $68 $0 $2 $896
2034 $89 $205 $136 $64 $272 $68 $0 $2 $836
2035 $88 $204 $135 $64 $328 $68 $0 $1 $889
Total 2012-2016 $1,901 $1,025 $1,084 $1,313 $3,849 $1,038 $0 $32 $10,242
Total 2017-2035 $2,342 $4,304 $3,484 $2,075 $7,406 $1,313 $0 $54 $20,977
Average 2012-2016 $380 $205 $217 $263 $770 $208 $0 $6 $2,048
Average 2017-2035 $123 $227 $183 $109 $390 $69 $0 $3 $1,104
Year Central Midwest Northeast Southeast Southwest Western Offshore Alaska US
2012 $655 $220 $135 $439 $525 $413 $0 $5 $2,394
2013 $313 $206 $133 $275 $1,223 $413 $0 $9 $2,572
2014 $294 $202 $403 $472 $726 $70 $0 $6 $2,172
2015 $376 $202 $266 $64 $646 $71 $0 $6 $1,630
2016 $263 $194 $147 $64 $729 $71 $0 $7 $1,474
2017 $117 $193 $128 $56 $597 $69 $0 $5 $1,166
2018 $114 $194 $133 $59 $598 $69 $0 $5 $1,173
2019 $137 $196 $135 $58 $465 $69 $0 $4 $1,065
2020 $150 $197 $138 $57 $750 $70 $0 $4 $1,366
2021 $156 $198 $140 $57 $367 $70 $0 $4 $990
2022 $532 $199 $469 $403 $658 $124 $0 $3 $2,389
2023 $147 $341 $140 $60 $499 $70 $0 $3 $1,261
2024 $176 $201 $139 $235 $708 $70 $0 $3 $1,531
2025 $119 $523 $320 $144 $447 $70 $0 $3 $1,627
2026 $118 $205 $138 $273 $648 $70 $0 $3 $1,455
2027 $116 $205 $138 $64 $355 $70 $0 $2 $951
2028 $110 $205 $444 $240 $563 $70 $0 $2 $1,634
2029 $264 $601 $323 $66 $334 $69 $0 $2 $1,660
2030 $174 $478 $271 $241 $608 $69 $0 $2 $1,843
2031 $105 $212 $139 $67 $307 $69 $0 $2 $899
2032 $105 $212 $348 $178 $303 $69 $0 $2 $1,216
2033 $105 $211 $324 $151 $299 $69 $0 $2 $1,160
2034 $103 $211 $141 $180 $307 $69 $0 $2 $1,012
2035 $102 $211 $140 $70 $466 $68 $0 $1 $1,059
Total 2012-2016 $1,901 $1,025 $1,084 $1,313 $3,849 $1,038 $0 $32 $10,242
Total 2017-2035 $2,951 $4,994 $4,147 $2,659 $9,278 $1,373 $0 $54 $25,456
Average 2012-2016 $380 $205 $217 $263 $770 $208 $0 $6 $2,048
Average 2017-2035 $155 $263 $218 $140 $488 $72 $0 $3 $1,340

147
Exhibit 122: Refining and Oil Products Transport (Base Case), Millions of 2015$
Exhibit 123: Refining and Oil Products Transport (High Case), Millions of 2015$
$0
$5,000
$10,000
$15,000
$20,000
$25,000
2012
2013
2014
2015
2016
2017
2018
2019
2020
2021
2022
2023
202
4
2025
2026
2027
2028
2029
2030
2031
2032
2033
2034
2035
Central Midwest Northeast Southeast
Southwest Western Offshore Alaska
$0
$5,000
$10,000
$15,000
$20,000
$25,000
2012
2013
2014
2015
2016
2017
2018
2019
2020
2021
2022
2023
202
4
2025
2026
2027
2028
2029
2030
2031
2032
2033
2034
2035
Central Midwest Northeast Southeast
Southwest Western Offshore Alaska

148
Exhibit 124: Refining and Oil Products Transport (Base Case), Millions of 2015$
Exhibit 125: Refining and Oil Products Transport (High Case), Millions of 2015$
Year Central Midwest Northeast Southeast Southwest Western Offshore Alaska US
2012 $1,674 $1,910 $1,237 $1,258 $6,384 $2,183 $0 $104 $14,751
2013 $2,012 $1,767 $912 $1,000 $6,704 $1,842 $0 $105 $14,342
2014 $1,522 $1,975 $954 $670 $6,260 $2,016 $0 $104 $13,500
2015 $2,980 $3,494 $1,478 $701 $8,067 $3,318 $0 $116 $20,154
2016 $2,095 $1,810 $931 $1,330 $9,090 $909 $0 $167 $16,333
2017 $753 $1,516 $697 $613 $5,388 $1,804 $0 $90 $10,861
2018 $1,619 $1,556 $715 $658 $5,650 $1,502 $0 $91 $11,791
2019 $777 $1,503 $692 $596 $5,140 $1,429 $0 $90 $10,227
2020 $745 $1,461 $673 $547 $5,011 $1,371 $0 $89 $9,898
2021 $832 $1,575 $724 $676 $5,351 $1,523 $0 $92 $10,773
2022 $819 $1,557 $716 $655 $5,294 $1,498 $0 $91 $10,630
2023 $798 $1,531 $704 $624 $5,213 $1,461 $0 $91 $10,422
2024 $785 $1,514 $696 $604 $5,159 $1,437 $0 $90 $10,286
2025 $766 $1,489 $685 $574 $5,083 $1,403 $0 $90 $10,091
2026 $753 $1,472 $678 $554 $5,028 $1,378 $0 $89 $9,952
2027 $751 $1,470 $677 $551 $5,020 $1,375 $0 $89 $9,932
2028 $752 $1,470 $677 $551 $5,020 $1,375 $0 $89 $9,934
2029 $800 $1,534 $706 $624 $5,212 $1,461 $0 $91 $10,428
2030 $796 $1,528 $703 $617 $5,193 $1,453 $0 $91 $10,380
2031 $753 $1,472 $678 $551 $5,022 $1,376 $0 $89 $9,941
2032 $753 $1,472 $678 $552 $5,023 $1,376 $0 $89 $9,942
2033 $753 $1,472 $678 $552 $5,023 $1,376 $0 $89 $9,943
2034 $777 $1,504 $692 $589 $5,119 $1,419 $0 $90 $10,190
2035 $768 $1,492 $687 $575 $5,084 $1,404 $0 $90 $10,101
Total 2012-2016 $10,282 $10,956 $5,512 $4,959 $36,505 $10,269 $0 $597 $79,081
Total 2017-2035 $15,551 $28,586 $13,154 $11,262 $98,035 $27,422 $0 $1,712 $195,722
Average 2012-2016 $2,056 $2,191 $1,102 $992 $7,301 $2,054 $0 $119 $15,816
Average 2017-2035 $818 $1,505 $692 $593 $5,160 $1,443 $0 $90 $10,301
Year Central Midwest Northeast Southeast Southwest Western Offshore Alaska US
2012 $1,674 $1,910 $1,237 $1,258 $6,384 $2,183 $0 $104 $14,751
2013 $2,012 $1,767 $912 $1,000 $6,704 $1,842 $0 $105 $14,342
2014 $1,522 $1,975 $954 $670 $6,260 $2,016 $0 $104 $13,500
2015 $2,980 $3,494 $1,478 $701 $8,067 $3,318 $0 $116 $20,154
2016 $2,095 $1,810 $931 $1,330 $9,090 $909 $0 $167 $16,333
2017 $792 $1,566 $719 $670 $5,540 $1,872 $0 $91 $11,251
2018 $1,744 $1,716 $786 $841 $6,133 $1,719 $0 $94 $13,034
2019 $901 $1,640 $758 $732 $5,805 $1,532 $0 $101 $11,468
2020 $886 $1,620 $749 $707 $5,752 $1,500 $0 $101 $11,314
2021 $927 $1,670 $772 $761 $5,939 $1,554 $0 $103 $11,726
2022 $898 $1,630 $755 $714 $5,829 $1,496 $0 $102 $11,424
2023 $888 $1,616 $749 $696 $5,796 $1,472 $0 $102 $11,320
2024 $887 $1,614 $748 $692 $5,799 $1,465 $0 $103 $11,308
2025 $895 $1,623 $753 $700 $5,836 $1,472 $0 $103 $11,382
2026 $868 $1,587 $737 $657 $5,736 $1,418 $0 $103 $11,106
2027 $844 $1,556 $723 $621 $5,638 $1,377 $0 $102 $10,861
2028 $886 $1,608 $747 $678 $5,822 $1,438 $0 $104 $11,283
2029 $925 $1,657 $769 $732 $5,998 $1,494 $0 $106 $11,682
2030 $916 $1,642 $763 $712 $5,984 $1,463 $0 $106 $11,586
2031 $877 $1,588 $740 $646 $5,855 $1,378 $0 $106 $11,192
2032 $887 $1,597 $745 $653 $5,917 $1,378 $0 $108 $11,286
2033 $874 $1,585 $738 $644 $5,829 $1,379 $0 $106 $11,154
2034 $906 $1,625 $757 $687 $5,976 $1,424 $0 $108 $11,482
2035 $855 $1,568 $729 $630 $5,705 $1,379 $0 $103 $10,970
Total 2012-2016 $10,282 $10,956 $5,512 $4,959 $36,505 $10,269 $0 $597 $79,081
Total 2017-2035 $17,655 $30,710 $14,238 $13,173 $110,890 $28,210 $0 $1,952 $216,829
Average 2012-2016 $2,056 $2,191 $1,102 $992 $7,301 $2,054 $0 $119 $15,816
Average 2017-2035 $929 $1,616 $749 $693 $5,836 $1,485 $0 $103 $11,412

149
Exhibit 126: Export Terminals (Base Case), Millions of 2015$
Exhibit 127: Export Terminals (High Case), Millions of 2015$
$0
$5,000
$10,000
$15,000
$20,000
$25,000
$30,000
2012
2013
2014
2015
2016
2017
2018
2019
2020
2021
2022
2023
202
4
2025
2026
2027
2028
2029
2030
2031
2032
2033
2034
2035
Central Midwest Northeast Southeast
Southwest Western Offshore Alaska
$0
$5,000
$10,000
$15,000
$20,000
$25,000
$30,000
2012
2013
2014
2015
2016
2017
2018
2019
2020
2021
2022
2023
202
4
2025
2026
2027
2028
2029
2030
2031
2032
2033
2034
2035
Central Midwest Northeast Southeast
Southwest Western Offshore Alaska

150
Exhibit 128: Export Terminals (Base Case), Millions of 2015$
Exhibit 129: Export Terminals (High Case), Millions of 2015$
Year Central Midwest Northeast Southeast Southwest Western Offshore Alaska US
2012 $0 $0 $70 $0 $683 $3 $0 $0 $756
2013 $0 $0 $70 $0 $680 $3 $0 $0 $753
2014 $0 $0 $70 $0 $679 $3 $0 $0 $752
2015 $0 $0 $69 $0 $673 $3 $0 $0 $745
2016 $0 $0 $232 $0 $5,502 $1 $0 $0 $5,735
2017 $0 $0 $4,073 $0 $5,008 $1 $0 $0 $9,082
2018 $0 $0 $236 $1,861 $11,846 $1 $0 $0 $13,944
2019 $0 $0 $238 $0 $23,747 $1 $0 $0 $23,986
2020 $0 $0 $239 $0 $518 $1 $0 $0 $759
2021 $0 $0 $0 $0 $96 $0 $0 $0 $96
2022 $0 $0 $0 $0 $97 $0 $0 $0 $97
2023 $0 $0 $0 $0 $97 $0 $0 $0 $97
2024 $0 $0 $0 $0 $98 $0 $0 $0 $98
2025 $0 $0 $0 $0 $3,098 $0 $0 $0 $3,098
2026 $0 $0 $0 $0 $140 $0 $0 $0 $140
2027 $0 $0 $0 $0 $3,140 $0 $0 $0 $3,140
2028 $0 $0 $0 $0 $140 $0 $0 $0 $140
2029 $0 $0 $0 $0 $140 $0 $0 $0 $140
2030 $0 $0 $0 $0 $140 $0 $0 $0 $140
2031 $0 $0 $0 $0 $65 $0 $0 $0 $65
2032 $0 $0 $0 $0 $65 $0 $0 $0 $65
2033 $0 $0 $0 $0 $65 $0 $0 $0 $65
2034 $0 $0 $0 $0 $65 $0 $0 $0 $65
2035 $0 $0 $0 $0 $65 $0 $0 $0 $65
Total 2012-2016 $0 $0 $511 $0 $8,218 $13 $0 $0 $8,742
Total 2017-2035 $0 $0 $4,786 $1,861 $48,632 $5 $0 $0 $55,284
Average 2012-2016 $0 $0 $102 $0 $1,644 $3 $0 $0 $1,748
Average 2017-2035 $0 $0 $252 $98 $2,560 $0 $0 $0 $2,910
Year Central Midwest Northeast Southeast Southwest Western Offshore Alaska US
2012 $0 $0 $70 $0 $683 $3 $0 $0 $756
2013 $0 $0 $70 $0 $680 $3 $0 $0 $753
2014 $0 $0 $70 $0 $679 $3 $0 $0 $752
2015 $0 $0 $69 $0 $673 $3 $0 $0 $745
2016 $0 $0 $232 $0 $5,502 $1 $0 $0 $5,735
2017 $0 $0 $4,073 $0 $5,208 $1 $0 $0 $9,282
2018 $0 $0 $236 $1,861 $12,046 $1 $0 $0 $14,145
2019 $0 $0 $238 $0 $23,949 $1 $0 $0 $24,188
2020 $0 $0 $239 $0 $925 $1 $0 $0 $1,165
2021 $0 $0 $0 $0 $260 $0 $0 $0 $260
2022 $0 $0 $0 $0 $1,350 $0 $0 $0 $1,350
2023 $0 $0 $0 $0 $4,490 $0 $0 $0 $4,490
2024 $0 $0 $0 $0 $1,740 $0 $0 $0 $1,740
2025 $0 $0 $0 $0 $8,969 $0 $0 $0 $8,969
2026 $0 $0 $0 $0 $5,386 $0 $0 $0 $5,386
2027 $0 $0 $0 $0 $7,298 $0 $0 $0 $7,298
2028 $0 $0 $0 $0 $5,746 $0 $0 $0 $5,746
2029 $0 $0 $0 $0 $4,299 $0 $0 $0 $4,299
2030 $0 $0 $0 $0 $283 $0 $0 $0 $283
2031 $0 $0 $0 $0 $161 $0 $0 $0 $161
2032 $0 $0 $0 $0 $1,322 $0 $0 $0 $1,322
2033 $0 $0 $0 $0 $1,322 $0 $0 $0 $1,322
2034 $0 $0 $0 $0 $1,322 $0 $0 $0 $1,322
2035 $0 $0 $0 $0 $160 $0 $0 $0 $160
Total 2012-2016 $0 $0 $511 $0 $8,218 $13 $0 $0 $8,742
Total 2017-2035 $0 $0 $4,786 $1,861 $86,235 $5 $0 $0 $92,887
Average 2012-2016 $0 $0 $102 $0 $1,644 $3 $0 $0 $1,748
Average 2017-2035 $0 $0 $252 $98 $4,539 $0 $0 $0 $4,889

151
Appendix D: Average Annual Values for Gross State Product and Taxes
Exhibit 130: Average Annual Values for Gross State Products and Taxes from Economic Impact Analysis, Base Case, Millions of 2015$
GDP
State/Local
Tax
Federal
Tax Total Tax GDP
State/Local
Tax
Federal
Tax Total Tax
U.S. $113,428 $17,367 $19,810 $37,177 $78,785 $12,442 $15,999 $28,441
Alabama $1,476 $222 $257 $480 $974 $152 $198 $350
Alaska $484 $141 $85 $225 $259 $78 $53 $131
Arizona $1,120 $153 $195 $348 $794 $112 $161 $273
Arkansas $1,066 $159 $186 $345 $578 $89 $117 $206
California $7,471 $1,187 $1,304 $2,491 $5,015 $825 $1,019 $1,844
Colorado $2,247 $321 $393 $714 $1,334 $197 $272 $469
Connecticut $1,053 $144 $184 $328 $743 $105 $151 $256
Delaware $311 $54 $54 $109 $276 $49 $56 $106
District of Columbia $127 $23 $22 $46 $94 $18 $19 $37
Florida $2,318 $311 $405 $715 $1,718 $238 $348 $586
Georgia $1,297 $175 $227 $402 $1,004 $140 $203 $343
Hawaii $128 $23 $22 $46 $89 $17 $18 $35
Idaho $327 $45 $57 $102 $260 $37 $53 $90
Il l inois $4,212 $644 $737 $1,380 $2,514 $397 $510 $907
Indiana $2,818 $420 $492 $912 $1,865 $287 $379 $666
Iowa $704 $118 $123 $241 $520 $90 $105 $195
Kansas $1,817 $284 $317 $601 $1,206 $195 $246 $441
Kentucky $1,141 $168 $199 $368 $805 $123 $163 $286
Louisiana $12,934 $1,978 $2,263 $4,241 $9,710 $1,539 $1,972 $3,511
Maine $397 $64 $69 $133 $284 $47 $58 $105
Maryland $1,075 $154 $188 $342 $887 $131 $178 $309
Massachusetts $1,712 $242 $299 $541 $1,202 $175 $244 $420
Michigan $3,040 $465 $531 $996 $2,075 $328 $421 $749
Minnesota $1,655 $276 $290 $566 $1,159 $200 $236 $436
Mississippi $903 $157 $158 $315 $609 $109 $124 $233
Missouri $1,084 $145 $189 $335 $790 $109 $160 $270
Montana $471 $69 $82 $151 $271 $41 $55 $96
Nebraska $447 $69 $78 $147 $358 $57 $73 $129
Nevada $284 $40 $50 $90 $205 $30 $42 $72
New Hampshire $306 $37 $54 $91 $219 $27 $45 $72
New Jersey $2,292 $351 $399 $750 $1,533 $242 $311 $554
New Mexico $1,586 $303 $277 $579 $938 $185 $191 $376
New York $5,037 $1,018 $880 $1,898 $3,485 $727 $707 $1,434
North Carolina $1,968 $298 $344 $642 $1,368 $214 $277 $491
North Dakota $1,578 $356 $275 $631 $752 $175 $153 $328
Ohio $5,427 $847 $951 $1,798 $3,878 $625 $787 $1,412
Oklahoma $3,191 $422 $557 $979 $1,899 $259 $387 $646
Oregon $855 $142 $149 $292 $581 $100 $118 $218
Pennsylvania $7,264 $1,057 $1,267 $2,324 $6,291 $944 $1,276 $2,221
Rhode Island $271 $43 $47 $90 $195 $32 $40 $71
South Carolina $1,978 $338 $345 $682 $1,400 $247 $284 $531
South Dakota $309 $39 $54 $93 $172 $22 $35 $57
Tennessee $1,541 $189 $269 $458 $1,102 $140 $224 $363
Texas $17,560 $2,391 $3,062 $5,453 $11,470 $1,619 $2,332 $3,950
Utah $1,007 $162 $175 $337 $625 $104 $127 $231
Vermont $164 $27 $29 $56 $121 $21 $25 $45
Virginia $1,605 $218 $281 $499 $1,278 $179 $258 $438
Washington $1,647 $241 $288 $528 $1,016 $154 $206 $360
West Virginia $1,208 $213 $211 $424 $1,122 $204 $227 $431
Wisconsin $1,665 $257 $291 $548 $1,134 $181 $231 $412
Wyoming $850 $170 $148 $318 $609 $126 $124 $250
Average 2017-2035Average 2013-2016

152
Exhibit 131: Average Annual Values for Gross State Products and Taxes from Economic Impact Analysis, High Case, Millions of 2015$
GDP
State/Local
Tax
Federal
Tax Total Tax GDP
State/Local
Tax
Federal
Tax Total Tax
U.S. $113,428 $17,367 $19,810 $37,177 $99,639 $15,753 $20,299 $36,052
Alabama $1,476 $222 $257 $480 $1,246 $194 $254 $448
Alaska $484 $141 $85 $225 $279 $84 $57 $141
Arizona $1,120 $153 $195 $348 $990 $140 $202 $341
Arkansas $1,066 $159 $186 $345 $859 $133 $176 $308
California $7,471 $1,187 $1,304 $2,491 $6,096 $1,004 $1,242 $2,246
Colorado $2,247 $321 $393 $714 $1,596 $236 $326 $562
Connecticut $1,053 $144 $184 $328 $948 $134 $193 $327
Delaware $311 $54 $54 $109 $358 $64 $73 $137
District of Columbia $127 $23 $22 $46 $124 $24 $25 $49
Florida $2,318 $311 $405 $715 $2,217 $308 $451 $759
Georgia $1,297 $175 $227 $402 $1,254 $175 $255 $430
Hawaii $128 $23 $22 $46 $112 $21 $23 $44
Idaho $327 $45 $57 $102 $313 $45 $64 $109
Il l inois $4,212 $644 $737 $1,380 $3,217 $509 $655 $1,164
Indiana $2,818 $420 $492 $912 $2,391 $369 $487 $856
Iowa $704 $118 $123 $241 $647 $112 $131 $244
Kansas $1,817 $284 $317 $601 $1,376 $223 $281 $504
Kentucky $1,141 $168 $200 $368 $1,162 $178 $237 $415
Louisiana $12,934 $1,978 $2,263 $4,241 $12,138 $1,927 $2,474 $4,401
Maine $397 $64 $69 $133 $366 $61 $75 $136
Maryland $1,075 $154 $188 $342 $1,091 $162 $220 $382
Massachusetts $1,712 $242 $299 $541 $1,531 $224 $312 $536
Michigan $3,040 $465 $531 $996 $2,619 $415 $533 $948
Minnesota $1,655 $276 $290 $566 $1,449 $250 $295 $545
Mississippi $902 $157 $158 $315 $778 $140 $159 $299
Missouri $1,084 $145 $189 $335 $982 $136 $200 $336
Montana $471 $69 $82 $151 $317 $47 $64 $112
Nebraska $447 $69 $78 $147 $439 $70 $89 $159
Nevada $284 $40 $50 $90 $255 $38 $52 $89
New Hampshire $306 $37 $54 $91 $286 $36 $58 $94
New Jersey $2,292 $351 $399 $750 $1,910 $303 $389 $692
New Mexico $1,586 $303 $277 $579 $1,145 $227 $234 $460
New York $5,037 $1,018 $880 $1,898 $4,488 $939 $914 $1,852
North Carolina $1,968 $298 $344 $642 $1,720 $270 $350 $620
North Dakota $1,578 $356 $275 $631 $825 $193 $168 $361
Ohio $5,427 $847 $951 $1,798 $5,011 $810 $1,020 $1,830
Oklahoma $3,191 $422 $557 $979 $2,507 $343 $512 $854
Oregon $855 $142 $149 $292 $732 $126 $149 $275
Pennsylvania $7,264 $1,057 $1,267 $2,324 $8,103 $1,220 $1,651 $2,871
Rhode Island $271 $43 $47 $90 $254 $42 $52 $93
South Carolina $1,978 $338 $345 $682 $1,779 $314 $362 $677
South Dakota $309 $39 $54 $93 $213 $28 $43 $71
Tennessee $1,541 $189 $269 $458 $1,538 $195 $314 $509
Texas $17,560 $2,391 $3,062 $5,453 $14,367 $2,032 $2,928 $4,960
Utah $1,007 $162 $175 $337 $765 $127 $156 $283
Vermont $164 $27 $29 $56 $161 $28 $33 $60
Virginia $1,605 $218 $281 $499 $1,584 $223 $322 $544
Washington $1,647 $241 $288 $528 $1,235 $187 $251 $438
West Virginia $1,208 $213 $211 $424 $1,654 $301 $337 $639
Wisconsin $1,665 $257 $291 $548 $1,470 $235 $300 $535
Wyoming $850 $170 $148 $318 $740 $153 $151 $305
Average 2017-2035Average 2013-2016

153
Appendix E: Approximate Economic Impacts of Pipeline and Gathering CAPEX
This appendix approximates total U.S. economic impacts of new and E/U/R/R pipeline and gathering line
infrastructure. Pipeline infrastructure includes oil, gas, NGL, and petroleum products transmission lines,
compressors for gas transmission lines, and pumps for oil, NGL, and petroleum product lines. Gathering
infrastructure includes oil and gas gathering pipes and compressors for gas gathering lines.
The approximate economic impacts (employment, GDP, and taxes) are calculated by multiplying the share
of total CAPEX – i.e., the ratio of pipeline and gathering line CAPEX to the total oil, gas, and NGL
infrastructure CAPEX – times the total oil, gas, and NGL infrastructure impacts. This method assumes the
same impact per CAPEX (e.g. employment per dollar CAPEX) between all infrastructure categories. Actual
economic impact, however, varies between the type of oil and gas infrastructure on the order of
plus/minus 10%.
Exhibit 132 compares economic impacts of pipeline and gathering CAPEX between the Base Case and the
High Case. In the Base Case, the projected pipeline and gathering line CAPEX that averages about $394
billion per year or 37% of the total oil, gas, and NGL infrastructure CAPEX over the course of the projection,
is estimated to produce an average of over 308,000 U.S. jobs per year. This investment is expected to
contribute over $557 billion to U.S. GDP, about $113 billion in Federal taxes, and roughly $88 billion in
state and local taxes over the 2017-2035 projection period, which equate to average annual values of
roughly $29 billion, $6 billion, and $5 billion, respectively.
The High Case projects $547 billion of pipeline and gathering line CAPEX or 41% of the total oil, gas, and
NGL infrastructure CAPEX. This investment would employ an average of roughly 427,000 individuals in the
U.S. on an annual basis. The investment is expected to contribute over $771 billion to U.S. GDP, about
$157 billion to Federal taxes, and nearly $122 billion to state and local taxes throughout the projection,
which equate to average annual values of roughly $41 billion, $8 billion, and $6 billion, respectively.

154
Exhibit 132: Approximate Economic Impacts of Pipeline and Gathering CAPEX (All Dollar Values in Million 2015$)
BASE CASEAverage Historical,
2013-2016
Average Projected,
2017-2035
Total Historical,
2013-2016
Total Projected,
2017-2035
CAPEX $31,348 $20,761 $125,392 $394,464
Total Employment 465,400 308,271 NA NA
Direct Employment 155,507 103,003 NA NA
Indirect Employment 120,716 79,927 NA NA
Induced Employment 189,178 125,341 NA NA
U.S. Gross Domestic Product $44,261 $29,322 $177,045 $557,124
Federal Taxes $7,714 $5,946 $30,855 $112,965
State and Local Taxes $6,776 $4,627 $27,105 $87,919
HIGH CASEAverage Historical,
2013-2016
Average Projected,
2017-2035
Total Historical,
2013-2016
Total Projected,
2017-2035
CAPEX $31,348 $28,784 $125,392 $546,896
Total Employment 465,400 426,581 NA NA
Direct Employment 155,507 142,523 NA NA
Indirect Employment 120,716 110,889 NA NA
Induced Employment 189,178 173,168 NA NA
U.S. Gross Domestic Product $44,261 $40,593 $177,045 $771,259
Federal Taxes $7,714 $8,267 $30,855 $157,071
State and Local Taxes $6,776 $6,416 $27,105 $121,905