u.s. research and development expenditures, by performing
TRANSCRIPT

National Science Board | Science & Engineering Indicators 2018
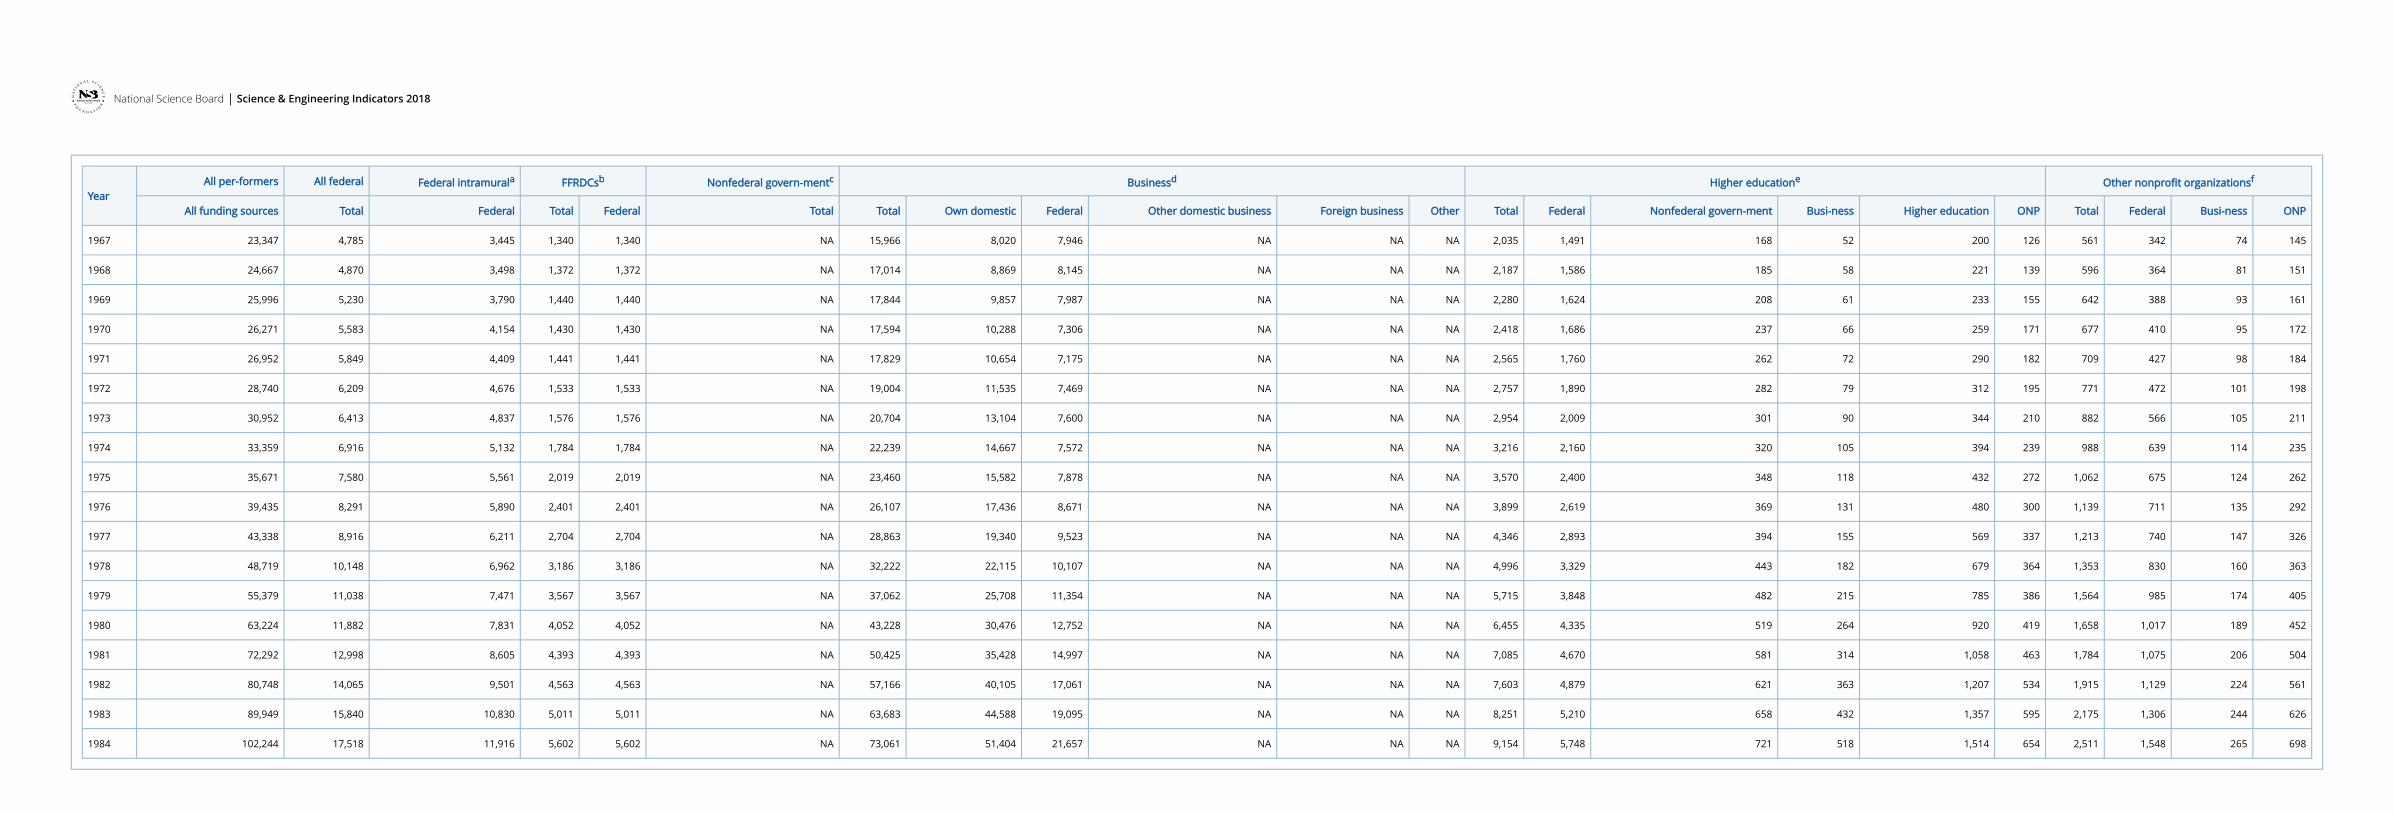
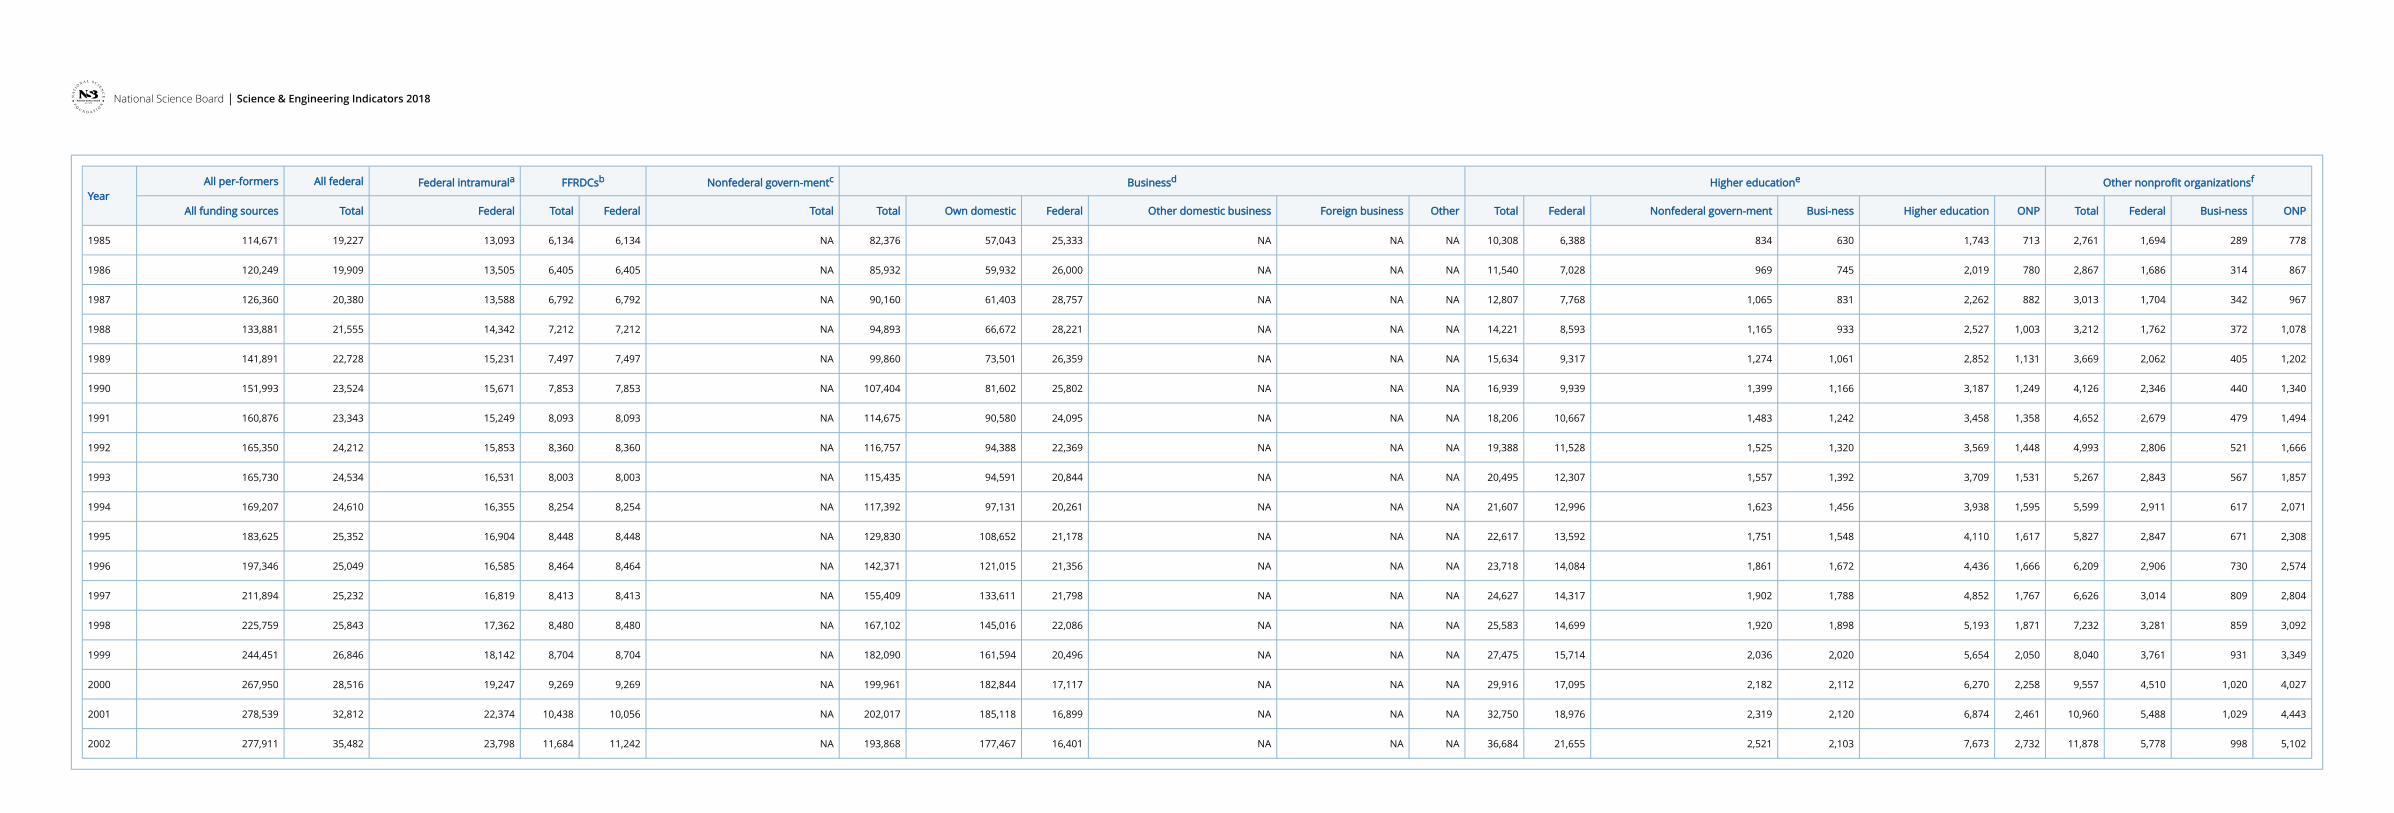
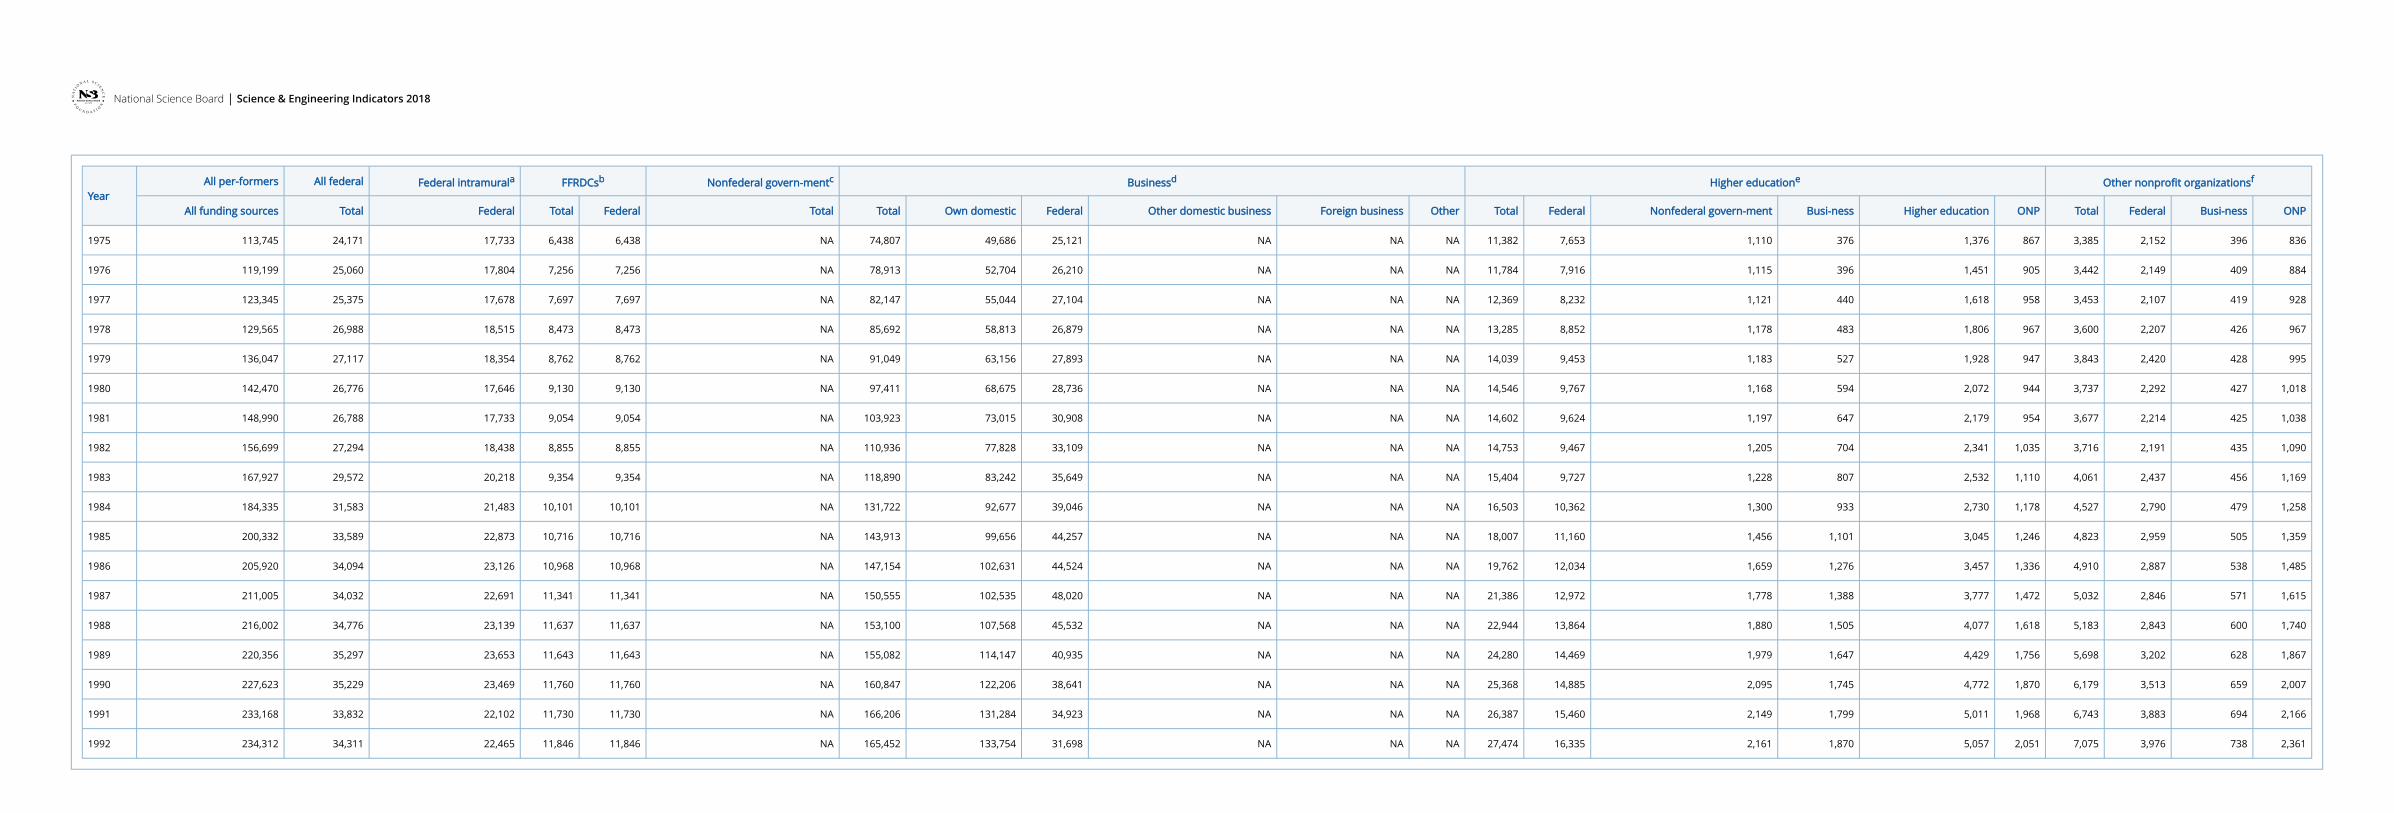
U.S. research and development expenditures, by performing sector and source of funds: 1953–2015
(Millions of current and of constant 2009 dollars)
YearAll per-formers All federal Federal intramurala FFRDCsb Nonfederal govern-mentc Businessd Higher educatione Other nonprofit organizationsf
All funding sources Total Federal Total Federal Total Total Own domestic Federal Other domestic business Foreign business Other Total Federal Nonfederal govern-ment Busi-ness Higher education ONP Total Federal Busi-ness ONP
Current $millions
1953 5,160 1,146 1,015 131 131 NA 3,630 2,200 1,430 NA NA NA 273 149 40 21 37 27 112 58 26 28
1954 5,621 1,127 963 165 165 NA 4,070 2,320 1,750 NA NA NA 301 165 45 24 40 29 123 61 31 31
1955 6,185 1,292 973 319 319 NA 4,420 2,460 1,960 NA NA NA 342 191 50 27 42 32 132 65 35 32
1956 8,501 1,692 1,131 561 561 NA 6,272 3,277 2,995 NA NA NA 391 221 57 32 46 36 146 71 37 38
1957 9,908 1,985 1,297 688 688 NA 7,324 3,396 3,928 NA NA NA 433 242 64 37 51 40 167 79 37 51
1958 10,915 2,163 1,507 657 657 NA 8,066 3,630 4,436 NA NA NA 491 280 72 39 56 45 195 95 38 62
1959 12,490 2,470 1,681 789 789 NA 9,200 3,983 5,217 NA NA NA 586 356 81 40 61 50 234 125 42 67
1960 13,711 2,711 1,801 910 910 NA 10,032 4,428 5,604 NA NA NA 705 453 90 40 67 55 264 148 48 68
1961 14,564 3,074 1,987 1,087 1,087 NA 10,353 4,668 5,685 NA NA NA 834 557 101 40 75 62 304 169 49 86
1962 15,636 3,244 2,188 1,056 1,056 NA 11,037 5,029 6,008 NA NA NA 993 687 112 41 84 70 363 200 54 109
1963 17,519 3,717 2,559 1,159 1,159 NA 12,216 5,360 6,856 NA NA NA 1,178 839 125 41 96 78 408 234 55 119
1964 19,103 4,263 2,966 1,297 1,297 NA 13,049 5,792 7,257 NA NA NA 1,375 995 138 41 114 88 417 250 55 112
1965 20,253 4,374 3,157 1,218 1,218 NA 13,812 6,445 7,367 NA NA NA 1,595 1,167 150 42 136 101 472 286 62 124
1966 22,072 4,525 3,308 1,217 1,217 NA 15,193 7,216 7,977 NA NA NA 1,818 1,335 160 45 165 114 537 329 70 138
APPENDIX TABLE 4-2
National Science Board | Science & Engineering Indicators 2018
YearAll per-formers All federal Federal intramurala FFRDCsb Nonfederal govern-mentc Businessd Higher educatione Other nonprofit organizationsf
All funding sources Total Federal Total Federal Total Total Own domestic Federal Other domestic business Foreign business Other Total Federal Nonfederal govern-ment Busi-ness Higher education ONP Total Federal Busi-ness ONP
1967 23,347 4,785 3,445 1,340 1,340 NA 15,966 8,020 7,946 NA NA NA 2,035 1,491 168 52 200 126 561 342 74 145
1968 24,667 4,870 3,498 1,372 1,372 NA 17,014 8,869 8,145 NA NA NA 2,187 1,586 185 58 221 139 596 364 81 151
1969 25,996 5,230 3,790 1,440 1,440 NA 17,844 9,857 7,987 NA NA NA 2,280 1,624 208 61 233 155 642 388 93 161
1970 26,271 5,583 4,154 1,430 1,430 NA 17,594 10,288 7,306 NA NA NA 2,418 1,686 237 66 259 171 677 410 95 172
1971 26,952 5,849 4,409 1,441 1,441 NA 17,829 10,654 7,175 NA NA NA 2,565 1,760 262 72 290 182 709 427 98 184
1972 28,740 6,209 4,676 1,533 1,533 NA 19,004 11,535 7,469 NA NA NA 2,757 1,890 282 79 312 195 771 472 101 198
1973 30,952 6,413 4,837 1,576 1,576 NA 20,704 13,104 7,600 NA NA NA 2,954 2,009 301 90 344 210 882 566 105 211
1974 33,359 6,916 5,132 1,784 1,784 NA 22,239 14,667 7,572 NA NA NA 3,216 2,160 320 105 394 239 988 639 114 235
1975 35,671 7,580 5,561 2,019 2,019 NA 23,460 15,582 7,878 NA NA NA 3,570 2,400 348 118 432 272 1,062 675 124 262
1976 39,435 8,291 5,890 2,401 2,401 NA 26,107 17,436 8,671 NA NA NA 3,899 2,619 369 131 480 300 1,139 711 135 292
1977 43,338 8,916 6,211 2,704 2,704 NA 28,863 19,340 9,523 NA NA NA 4,346 2,893 394 155 569 337 1,213 740 147 326
1978 48,719 10,148 6,962 3,186 3,186 NA 32,222 22,115 10,107 NA NA NA 4,996 3,329 443 182 679 364 1,353 830 160 363
1979 55,379 11,038 7,471 3,567 3,567 NA 37,062 25,708 11,354 NA NA NA 5,715 3,848 482 215 785 386 1,564 985 174 405
1980 63,224 11,882 7,831 4,052 4,052 NA 43,228 30,476 12,752 NA NA NA 6,455 4,335 519 264 920 419 1,658 1,017 189 452
1981 72,292 12,998 8,605 4,393 4,393 NA 50,425 35,428 14,997 NA NA NA 7,085 4,670 581 314 1,058 463 1,784 1,075 206 504
1982 80,748 14,065 9,501 4,563 4,563 NA 57,166 40,105 17,061 NA NA NA 7,603 4,879 621 363 1,207 534 1,915 1,129 224 561
1983 89,949 15,840 10,830 5,011 5,011 NA 63,683 44,588 19,095 NA NA NA 8,251 5,210 658 432 1,357 595 2,175 1,306 244 626
1984 102,244 17,518 11,916 5,602 5,602 NA 73,061 51,404 21,657 NA NA NA 9,154 5,748 721 518 1,514 654 2,511 1,548 265 698
National Science Board | Science & Engineering Indicators 2018
YearAll per-formers All federal Federal intramurala FFRDCsb Nonfederal govern-mentc Businessd Higher educatione Other nonprofit organizationsf
All funding sources Total Federal Total Federal Total Total Own domestic Federal Other domestic business Foreign business Other Total Federal Nonfederal govern-ment Busi-ness Higher education ONP Total Federal Busi-ness ONP
1985 114,671 19,227 13,093 6,134 6,134 NA 82,376 57,043 25,333 NA NA NA 10,308 6,388 834 630 1,743 713 2,761 1,694 289 778
1986 120,249 19,909 13,505 6,405 6,405 NA 85,932 59,932 26,000 NA NA NA 11,540 7,028 969 745 2,019 780 2,867 1,686 314 867
1987 126,360 20,380 13,588 6,792 6,792 NA 90,160 61,403 28,757 NA NA NA 12,807 7,768 1,065 831 2,262 882 3,013 1,704 342 967
1988 133,881 21,555 14,342 7,212 7,212 NA 94,893 66,672 28,221 NA NA NA 14,221 8,593 1,165 933 2,527 1,003 3,212 1,762 372 1,078
1989 141,891 22,728 15,231 7,497 7,497 NA 99,860 73,501 26,359 NA NA NA 15,634 9,317 1,274 1,061 2,852 1,131 3,669 2,062 405 1,202
1990 151,993 23,524 15,671 7,853 7,853 NA 107,404 81,602 25,802 NA NA NA 16,939 9,939 1,399 1,166 3,187 1,249 4,126 2,346 440 1,340
1991 160,876 23,343 15,249 8,093 8,093 NA 114,675 90,580 24,095 NA NA NA 18,206 10,667 1,483 1,242 3,458 1,358 4,652 2,679 479 1,494
1992 165,350 24,212 15,853 8,360 8,360 NA 116,757 94,388 22,369 NA NA NA 19,388 11,528 1,525 1,320 3,569 1,448 4,993 2,806 521 1,666
1993 165,730 24,534 16,531 8,003 8,003 NA 115,435 94,591 20,844 NA NA NA 20,495 12,307 1,557 1,392 3,709 1,531 5,267 2,843 567 1,857
1994 169,207 24,610 16,355 8,254 8,254 NA 117,392 97,131 20,261 NA NA NA 21,607 12,996 1,623 1,456 3,938 1,595 5,599 2,911 617 2,071
1995 183,625 25,352 16,904 8,448 8,448 NA 129,830 108,652 21,178 NA NA NA 22,617 13,592 1,751 1,548 4,110 1,617 5,827 2,847 671 2,308
1996 197,346 25,049 16,585 8,464 8,464 NA 142,371 121,015 21,356 NA NA NA 23,718 14,084 1,861 1,672 4,436 1,666 6,209 2,906 730 2,574
1997 211,894 25,232 16,819 8,413 8,413 NA 155,409 133,611 21,798 NA NA NA 24,627 14,317 1,902 1,788 4,852 1,767 6,626 3,014 809 2,804
1998 225,759 25,843 17,362 8,480 8,480 NA 167,102 145,016 22,086 NA NA NA 25,583 14,699 1,920 1,898 5,193 1,871 7,232 3,281 859 3,092
1999 244,451 26,846 18,142 8,704 8,704 NA 182,090 161,594 20,496 NA NA NA 27,475 15,714 2,036 2,020 5,654 2,050 8,040 3,761 931 3,349
2000 267,950 28,516 19,247 9,269 9,269 NA 199,961 182,844 17,117 NA NA NA 29,916 17,095 2,182 2,112 6,270 2,258 9,557 4,510 1,020 4,027
2001 278,539 32,812 22,374 10,438 10,056 NA 202,017 185,118 16,899 NA NA NA 32,750 18,976 2,319 2,120 6,874 2,461 10,960 5,488 1,029 4,443
2002 277,911 35,482 23,798 11,684 11,242 NA 193,868 177,467 16,401 NA NA NA 36,684 21,655 2,521 2,103 7,673 2,732 11,878 5,778 998 5,102

National Science Board | Science & Engineering Indicators 2018
YearAll per-formers All federal Federal intramurala FFRDCsb Nonfederal govern-mentc Businessd Higher educatione Other nonprofit organizationsf
All funding sources Total Federal Total Federal Total Total Own domestic Federal Other domestic business Foreign business Other Total Federal Nonfederal govern-ment Busi-ness Higher education ONP Total Federal Busi-ness ONP
2003 291,365 37,235 24,982 12,253 11,841 NA 200,724 182,926 17,798 NA NA NA 40,577 24,567 2,756 2,090 8,286 2,879 12,829 5,945 1,020 5,864
2004 302,731 37,685 24,898 12,788 12,471 NA 208,301 188,035 20,266 NA NA NA 43,296 26,624 2,896 2,148 8,637 2,993 13,448 6,537 1,041 5,870
2005 325,288 39,568 26,322 13,246 12,894 NA 226,159 204,250 21,909 NA NA NA 45,490 27,743 2,945 2,279 9,353 3,170 14,072 6,545 1,107 6,420
2006 350,908 41,610 28,240 13,370 12,969 309 247,669 223,365 24,304 NA NA NA 47,369 28,277 3,059 2,464 10,176 3,394 13,952 6,044 1,182 6,726
2007 377,890 44,132 29,859 14,273 13,845 388 269,267 242,682 26,585 NA NA NA 49,430 28,725 3,308 2,697 10,933 3,767 14,674 5,980 1,257 7,438
2008 404,773 45,649 29,839 15,810 15,369 491 290,680 225,848 36,360 12,181 15,533 758 52,054 29,635 3,567 2,954 11,738 4,161 15,898 6,236 1,301 8,362
2009 402,931 47,572 30,560 17,013 16,571 606 282,393 221,104 39,573 9,567 11,464 685 54,909 31,741 3,679 3,033 12,056 4,400 17,452 7,097 1,258 9,097
2010 406,580 50,798 31,970 18,828 18,409 691 278,977 218,187 34,199 11,013 14,532 1,046 58,084 34,682 3,673 2,953 12,262 4,515 18,030 7,093 1,265 9,672
2011 426,160 53,524 34,950 18,574 18,176 694 294,092 235,426 31,309 11,124 15,351 882 60,089 35,742 3,615 2,999 13,104 4,630 17,762 6,564 1,333 9,865
2012 433,619 52,144 34,017 18,128 17,727 665 302,251 242,674 30,621 11,624 16,699 633 60,896 34,968 3,560 3,169 14,300 4,899 17,663 6,239 1,366 10,059
2013 453,964 51,086 33,406 17,680 17,296 620 322,528 259,908 29,362 13,450 18,795 1,013 61,546 33,839 3,643 3,375 15,378 5,312 18,185 5,970 1,444 10,770
2014 475,426 52,687 34,783 17,903 17,523 583 340,728 277,272 26,554 13,227 22,544 1,131 62,354 33,121 3,715 3,601 16,217 5,701 19,075 6,135 1,520 11,420
2015g 495,144 54,322 35,673 18,649 18,287 610 355,821 289,892 26,990 14,595 23,102 1,242 64,653 33,546 3,772 3,842 17,334 6,159 19,738 6,189 1,572 11,978
Constant 2009 $millions
1953 34,048 7,562 6,697 864 864 NA 23,952 14,516 9,436 NA NA NA 1,798 983 261 135 241 178 736 379 172 185
1954 36,745 7,368 6,293 1,075 1,075 NA 26,608 15,167 11,441 NA NA NA 1,968 1,075 291 154 258 190 801 396 203 203
1955 39,748 8,300 6,253 2,047 2,047 NA 28,405 15,809 12,596 NA NA NA 2,198 1,227 321 174 270 206 845 415 225 206
1956 52,831 10,513 7,026 3,487 3,487 NA 38,981 20,367 18,614 NA NA NA 2,430 1,374 351 196 286 224 907 441 230 236

National Science Board | Science & Engineering Indicators 2018
YearAll per-formers All federal Federal intramurala FFRDCsb Nonfederal govern-mentc Businessd Higher educatione Other nonprofit organizationsf
All funding sources Total Federal Total Federal Total Total Own domestic Federal Other domestic business Foreign business Other Total Federal Nonfederal govern-ment Busi-ness Higher education ONP Total Federal Busi-ness ONP
1957 59,592 11,936 7,801 4,135 4,135 NA 44,050 20,425 23,625 NA NA NA 2,604 1,453 385 220 307 241 1,001 472 223 307
1958 64,206 12,724 8,862 3,862 3,862 NA 47,447 21,353 26,094 NA NA NA 2,888 1,647 424 229 326 262 1,147 559 224 365
1959 72,451 14,328 9,751 4,577 4,577 NA 53,369 23,105 30,264 NA NA NA 3,399 2,062 467 229 354 287 1,355 722 244 389
1960 78,453 15,509 10,302 5,207 5,207 NA 57,402 25,337 32,065 NA NA NA 4,031 2,589 515 229 383 315 1,511 847 275 389
1961 82,428 17,395 11,246 6,149 6,149 NA 58,595 26,419 32,175 NA NA NA 4,717 3,150 569 226 422 351 1,721 956 277 487
1962 87,421 18,134 12,230 5,904 5,904 NA 61,708 28,117 33,591 NA NA NA 5,549 3,838 626 226 470 389 2,030 1,118 302 609
1963 96,851 20,549 14,144 6,405 6,405 NA 67,534 29,632 37,902 NA NA NA 6,512 4,636 691 224 531 431 2,256 1,294 304 658
1964 104,011 23,208 16,146 7,062 7,062 NA 71,048 31,536 39,512 NA NA NA 7,484 5,418 749 221 618 479 2,270 1,361 299 610
1965 108,294 23,389 16,878 6,510 6,510 NA 73,855 34,463 39,393 NA NA NA 8,526 6,240 799 222 727 537 2,524 1,529 332 663
1966 114,799 23,532 17,205 6,327 6,327 NA 79,020 37,531 41,489 NA NA NA 9,456 6,943 832 234 856 590 2,790 1,709 364 718
1967 118,000 24,184 17,412 6,773 6,773 NA 80,695 40,535 40,161 NA NA NA 10,285 7,533 849 260 1,008 634 2,835 1,729 374 733
1968 119,577 23,606 16,955 6,651 6,651 NA 82,480 42,995 39,485 NA NA NA 10,602 7,689 894 279 1,069 671 2,889 1,765 393 732
1969 120,114 24,166 17,513 6,654 6,654 NA 82,449 45,545 36,904 NA NA NA 10,535 7,501 961 280 1,077 716 2,964 1,790 430 744
1970 115,302 24,504 18,231 6,274 6,274 NA 77,218 45,153 32,065 NA NA NA 10,610 7,397 1,040 287 1,135 750 2,969 1,797 417 755
1971 112,571 24,431 18,414 6,017 6,017 NA 74,467 44,499 29,968 NA NA NA 10,713 7,349 1,094 301 1,209 760 2,959 1,781 409 769
1972 115,066 24,857 18,720 6,138 6,138 NA 76,086 46,182 29,903 NA NA NA 11,038 7,567 1,129 316 1,247 779 3,085 1,888 404 793
1973 117,527 24,349 18,365 5,984 5,984 NA 78,614 49,757 28,858 NA NA NA 11,215 7,626 1,143 342 1,306 797 3,349 2,149 399 801
1974 116,224 24,097 17,881 6,215 6,215 NA 77,480 51,100 26,381 NA NA NA 11,205 7,525 1,113 364 1,371 831 3,442 2,225 398 820
National Science Board | Science & Engineering Indicators 2018
YearAll per-formers All federal Federal intramurala FFRDCsb Nonfederal govern-mentc Businessd Higher educatione Other nonprofit organizationsf
All funding sources Total Federal Total Federal Total Total Own domestic Federal Other domestic business Foreign business Other Total Federal Nonfederal govern-ment Busi-ness Higher education ONP Total Federal Busi-ness ONP
1975 113,745 24,171 17,733 6,438 6,438 NA 74,807 49,686 25,121 NA NA NA 11,382 7,653 1,110 376 1,376 867 3,385 2,152 396 836
1976 119,199 25,060 17,804 7,256 7,256 NA 78,913 52,704 26,210 NA NA NA 11,784 7,916 1,115 396 1,451 905 3,442 2,149 409 884
1977 123,345 25,375 17,678 7,697 7,697 NA 82,147 55,044 27,104 NA NA NA 12,369 8,232 1,121 440 1,618 958 3,453 2,107 419 928
1978 129,565 26,988 18,515 8,473 8,473 NA 85,692 58,813 26,879 NA NA NA 13,285 8,852 1,178 483 1,806 967 3,600 2,207 426 967
1979 136,047 27,117 18,354 8,762 8,762 NA 91,049 63,156 27,893 NA NA NA 14,039 9,453 1,183 527 1,928 947 3,843 2,420 428 995
1980 142,470 26,776 17,646 9,130 9,130 NA 97,411 68,675 28,736 NA NA NA 14,546 9,767 1,168 594 2,072 944 3,737 2,292 427 1,018
1981 148,990 26,788 17,733 9,054 9,054 NA 103,923 73,015 30,908 NA NA NA 14,602 9,624 1,197 647 2,179 954 3,677 2,214 425 1,038
1982 156,699 27,294 18,438 8,855 8,855 NA 110,936 77,828 33,109 NA NA NA 14,753 9,467 1,205 704 2,341 1,035 3,716 2,191 435 1,090
1983 167,927 29,572 20,218 9,354 9,354 NA 118,890 83,242 35,649 NA NA NA 15,404 9,727 1,228 807 2,532 1,110 4,061 2,437 456 1,169
1984 184,335 31,583 21,483 10,101 10,101 NA 131,722 92,677 39,046 NA NA NA 16,503 10,362 1,300 933 2,730 1,178 4,527 2,790 479 1,258
1985 200,332 33,589 22,873 10,716 10,716 NA 143,913 99,656 44,257 NA NA NA 18,007 11,160 1,456 1,101 3,045 1,246 4,823 2,959 505 1,359
1986 205,920 34,094 23,126 10,968 10,968 NA 147,154 102,631 44,524 NA NA NA 19,762 12,034 1,659 1,276 3,457 1,336 4,910 2,887 538 1,485
1987 211,005 34,032 22,691 11,341 11,341 NA 150,555 102,535 48,020 NA NA NA 21,386 12,972 1,778 1,388 3,777 1,472 5,032 2,846 571 1,615
1988 216,002 34,776 23,139 11,637 11,637 NA 153,100 107,568 45,532 NA NA NA 22,944 13,864 1,880 1,505 4,077 1,618 5,183 2,843 600 1,740
1989 220,356 35,297 23,653 11,643 11,643 NA 155,082 114,147 40,935 NA NA NA 24,280 14,469 1,979 1,647 4,429 1,756 5,698 3,202 628 1,867
1990 227,623 35,229 23,469 11,760 11,760 NA 160,847 122,206 38,641 NA NA NA 25,368 14,885 2,095 1,745 4,772 1,870 6,179 3,513 659 2,007
1991 233,168 33,832 22,102 11,730 11,730 NA 166,206 131,284 34,923 NA NA NA 26,387 15,460 2,149 1,799 5,011 1,968 6,743 3,883 694 2,166
1992 234,312 34,311 22,465 11,846 11,846 NA 165,452 133,754 31,698 NA NA NA 27,474 16,335 2,161 1,870 5,057 2,051 7,075 3,976 738 2,361

National Science Board | Science & Engineering Indicators 2018
YearAll per-formers All federal Federal intramurala FFRDCsb Nonfederal govern-mentc Businessd Higher educatione Other nonprofit organizationsf
All funding sources Total Federal Total Federal Total Total Own domestic Federal Other domestic business Foreign business Other Total Federal Nonfederal govern-ment Busi-ness Higher education ONP Total Federal Busi-ness ONP
1993 229,392 33,958 22,880 11,077 11,077 NA 159,777 130,926 28,851 NA NA NA 28,367 17,034 2,155 1,926 5,133 2,118 7,291 3,935 785 2,571
1994 229,321 33,353 22,166 11,187 11,187 NA 159,098 131,639 27,459 NA NA NA 29,283 17,612 2,199 1,973 5,337 2,161 7,588 3,945 836 2,806
1995 243,780 33,657 22,441 11,215 11,215 NA 172,361 144,246 28,116 NA NA NA 30,026 18,045 2,325 2,054 5,456 2,146 7,736 3,780 891 3,065
1996 257,299 32,658 21,623 11,035 11,035 NA 185,623 157,779 27,844 NA NA NA 30,923 18,363 2,426 2,179 5,783 2,171 8,096 3,788 952 3,355
1997 271,619 32,344 21,560 10,785 10,785 NA 199,213 171,271 27,942 NA NA NA 31,568 18,353 2,438 2,293 6,219 2,265 8,494 3,864 1,037 3,594
1998 286,282 32,771 22,017 10,754 10,754 NA 211,900 183,893 28,007 NA NA NA 32,441 18,640 2,435 2,407 6,585 2,373 9,170 4,160 1,089 3,921
1999 305,315 33,530 22,659 10,871 10,871 NA 227,427 201,828 25,599 NA NA NA 34,315 19,627 2,544 2,524 7,061 2,560 10,042 4,697 1,162 4,183
2000 327,218 34,823 23,504 11,319 11,319 NA 244,190 223,287 20,903 NA NA NA 36,533 20,876 2,665 2,579 7,656 2,757 11,671 5,508 1,245 4,918
2001 332,570 39,177 26,715 12,462 12,006 NA 241,204 221,027 20,177 NA NA NA 39,103 22,657 2,769 2,531 8,207 2,939 13,086 6,552 1,229 5,305
2002 326,805 41,724 27,984 13,740 13,219 NA 227,976 208,689 19,286 NA NA NA 43,138 25,464 2,965 2,473 9,023 3,213 13,967 6,794 1,174 5,999
2003 335,926 42,930 28,803 14,127 13,652 NA 231,422 210,902 20,520 NA NA NA 46,782 28,324 3,177 2,410 9,553 3,319 14,791 6,854 1,176 6,761
2004 339,690 42,286 27,937 14,349 13,993 NA 233,732 210,992 22,740 NA NA NA 48,582 29,874 3,249 2,410 9,691 3,358 15,090 7,335 1,168 6,587
2005 353,622 43,014 28,615 14,399 14,017 NA 245,858 222,041 23,817 NA NA NA 49,452 30,159 3,202 2,477 10,167 3,446 15,297 7,115 1,203 6,980
2006 370,102 43,886 29,784 14,101 13,678 325 261,216 235,583 25,633 NA NA NA 49,960 29,823 3,227 2,598 10,732 3,579 14,715 6,374 1,247 7,094
2007 388,229 45,339 30,676 14,663 14,224 399 276,634 249,322 27,312 NA NA NA 50,782 29,511 3,399 2,771 11,232 3,870 15,075 6,143 1,291 7,641
2008 407,848 45,995 30,066 15,930 15,485 495 292,888 227,564 36,636 12,274 15,651 764 52,450 29,860 3,594 2,976 11,827 4,193 16,019 6,283 1,310 8,426
2009 402,931 47,572 30,560 17,013 16,571 606 282,393 221,104 39,573 9,567 11,464 685 54,909 31,741 3,679 3,033 12,056 4,400 17,452 7,097 1,258 9,097
2010 401,673 50,185 31,584 18,601 18,187 683 275,610 215,554 33,786 10,880 14,357 1,033 57,383 34,263 3,629 2,917 12,114 4,460 17,812 7,008 1,250 9,555

National Science Board | Science & Engineering Indicators 2018
YearAll per-formers All federal Federal intramurala FFRDCsb Nonfederal govern-mentc Businessd Higher educatione Other nonprofit organizationsf
All funding sources Total Federal Total Federal Total Total Own domestic Federal Other domestic business Foreign business Other Total Federal Nonfederal govern-ment Busi-ness Higher education ONP Total Federal Busi-ness ONP
2011 412,503 51,809 33,830 17,978 17,593 672 284,667 227,881 30,306 10,768 14,859 854 58,163 34,597 3,499 2,902 12,684 4,482 17,193 6,354 1,290 9,549
2012 412,127 49,560 32,331 17,229 16,849 632 287,271 230,646 29,103 11,048 15,871 602 57,877 33,234 3,384 3,012 13,591 4,656 16,788 5,930 1,298 9,560
2013 424,610 47,783 31,246 16,537 16,178 580 301,673 243,102 27,463 12,580 17,580 947 57,566 31,650 3,407 3,156 14,383 4,969 17,009 5,584 1,351 10,074
2014 436,844 48,411 31,961 16,451 16,101 536 313,077 254,771 24,399 12,154 20,714 1,039 57,293 30,433 3,413 3,309 14,901 5,238 17,527 5,637 1,397 10,493
2015g 450,080 49,378 32,427 16,951 16,622 555 323,437 263,508 24,534 13,267 20,999 1,129 58,768 30,493 3,429 3,492 15,756 5,598 17,942 5,625 1,429 10,888
NA = not available.
FFRDC = federally funded research and development center; HE = higher education; ONP = other nonprofit organization.
a Includes expenditures for federal intramural R&D as well as costs associated with administering extramural R&D.
b The R&D expenditures of FFRDCs are chiefly federally funded; the small remainder ($362 million of the $18.6 billion total in 2015) reflects funding from state or local government, businesses, other nonprofit organizations, and other sources (see Appendix Table 4-6 for further detail on this nonfederal funding). Before 2001, the data did not distinguish federal and nonfederal funding for FFRDC R&D and are reported as all federal funding. In 1953–54, federal funding for business R&D did not separate out industry-administered FFRDCs, and the data for federal funding to business for these years includes the funding to these FFRDCs. Also in 1953–54, federal funding for other nonprofit organizations did not separate out nonprofit-administered FFRDCs, and the data for federal funding to other nonprofit organizations for these years include the funding to these FFRDCs.
c State intramural R&D performance includes state agency and department employees and also services performed by others in support of internal R&D projects. Includes funding from both federal and nonfederal government sources (see Appendix Table 4-6 for further detail). Data on state government intramural R&D became available starting in 2006.
d R&D performed in the domestic United States by all companies with five or more employees, publicly or privately held. In 2008 and later years, the data on business R&D come from the National Science Foundation's (NSF's) annual Business R&D and Innovation Survey (BRDIS). BRDIS distinguishes R&D performed and paid for by the company from R&D performed by the company but paid for by one or more others (i.e., the federal government, state or local government, domestic companies, foreign companies, foreign governments, other organizations inside or outside the United States). Before 2008, the data distinguished only federally and nonfederally funded business R&D; for these years, the own funding data column includes all nonfederal sources of funding. Business R&D performance in the United States paid for by foreign business includes funding from parent or unaffiliated
businesses outside the United States ($16.3 billion in 2015) and funding from U.S. businesses' foreign subsidiaries ($6.8 billion in 2015). Business R&D performance funded by other sources includes U.S. state government, foreign government, and all other sources in the United States and abroad.
e Before 2003, higher education R&D covered only S&E fields; in 2003 and later years, R&D in non-S&E fields is also included. (Non-S&E R&D was $1.4 billion in 2003 and $3.7 billion in 2015.) In 1998 and later years, the higher education R&D data have been adjusted to eliminate double counting of R&D funds passed through from academic institutions to other academic and nonacademic (businesses, nonprofit organizations, others) subrecipients. (In FY 1998, the total of pass-through funds reported was $994 million, with $479 million to other academic recipients and $337 million nonacademic recipients. In FY 2015, total pass-through was $5.640 billion, with $3.107 billion to other academic recipients and $2.537 billion to nonacademic recipients.) The nonfederal government funding category includes support from state and local government. The other nonprofit funding category includes
support from nonprofit organizations and other sources not elsewhere classified (in 2015, $4.139 billion was from nonprofit organizations, and $2.020 billion was from these unclassified other sources).
f The data on other nonprofit R&D funded by the federal government come from NSF's annual Federal Funds for R&D survey. The other nonprofit R&D funded by nonfederal government is included in the ONP category. The 1998–2015 data for other components funded by businesses and by the nonprofit sector itself are estimated, based on parameters from the 1996–97 Survey of R&D Funding and Performance by Nonprofit Organizations.
g Some data for 2015 are preliminary and may later be revised.
Note(s)
National Science Board | Science & Engineering Indicators 2018
Detail may not add to total because of rounding. Constant-dollar estimates are derived from unrounded data. For trend comparisons, use only the historical data reported in this table because some back-year data may have been revised. Except for the nonprofit sector, data are based on annual reports by performers in NSF's annual R&D expenditure surveys: Business R&D and Innovation Survey, Higher Education R&D Survey, Survey of Federal
Funds for R&D, FFRDC R&D Expenditures Survey, Survey of State Government R&D. R&D expenditures by business performers—and, before 2001, also industry-administered FFRDCs—are collected on a calendar year basis. Expenditures for other performers are calendar year approximations based on fiscal year data. For federal performers in 1977 and afterwards, the approximation equals 75% of the amount reported in the same fiscal year plus
25% of the amount reported in the subsequent fiscal year. Prior to 1977, the federal fiscal year began on 1 July, not 1 October, and the approximation is 50% of the amount reported in the same fiscal year plus 50% of the amount reported in the subsequent fiscal year. The fiscal year for higher education performers and state government performers generally begins 1 July, and the calendar year approximation is 50% of the amount reported in the
same fiscal year plus 50% of the amount reported in the subsequent fiscal year.
Source(s)
National Science Foundation, National Center for Science and Engineering Statistics, National Patterns of R&D Resources (annual series).
Science and Engineering Indicators 2018