u.s. trade policy since 1934 - usitc | united states ... · pdf fileu.s. trade policy since...
TRANSCRIPT

Chapter 3
U.S. Trade Policysince 1934
Introduction
U.S. trade policy has evolved greatly in the 75 years since the passageof the landmark 1934 Reciprocal Trade Agreements Act (RTAA). At thebeginning of this era, the United States and its trading partners had in placehigh import tariffs. There was no multinational international agreementthat set out rules of trade between nations, and the few trade agreementsthat existed had generally been negotiated on a bilateral basis. Tradenegotiations, when they occurred, were focused on manufactured goodsand the elimination of tariffs.
Since that time, the United States and its trading partners have reducedor removed many barriers to trade. Tariffs have been lowered or eliminatedon nearly all products, and average tariff rates for the United Statesdeclined from 18.4 percent in 1934 to 1.3 percent in 2007.1 Otherindustrialized countries have similarly lowered their tariffs. Trade hasbecome a larger component of U.S. GDP during this time (figure 3.1).
Significant strides have been made in international cooperation. Tradenegotiations now take place in an established multilateral framework thatprovides stability and continuity to the negotiations. An initial set of
1Data are weighted-average tariff rates as a percent of all imports. Compiled fromofficial statistics of the U.S. Department of Commerce.
59

60 CHAPTER 3 U.S. TRADE POLICY SINCE 1934
FIGURE 3.1 U.S. real GDP (top) and U.S. exports and imports as a share ofGDP (bottom), 1930–2008
Source: U.S. Dept. of Commmerce statistics.
1940 1960 1980 2000
5
10
15
% o
f G
DP
Export share
Import share
Trade shares
●●●●●●●●●●●●
●●●●●●●●●
●●●●●●●●●●
●●●●●
●●●●●●
●●●●●●
●●●●●●●●
●●●●
●●●●●●
●●●●●●●
●●●●●
●
5
10
Trill
ions o
f $
(base y
ear=
2000)
Real GDP
multilateral trade rules, embodied in the General Agreement on Tariffsand Trade, was negotiated in 1947 with the United States as one of the23 founding contracting parties.2 The General Agreement remained theprimary set of rules and organizational structure for nearly 50 years untilthe negotiation of the Uruguay Round Agreements and the establishmentof the World Trade Organization (WTO) in 1995.
Trade negotiations have been extended far beyond their initial emphasison manufactured goods and tariff rates. In recent decades, nontariffmeasures have taken on greater importance as tariffs have declined,and multilateral negotiations have included nontariff measures since thebeginning of the Kennedy Round in 1964. The Uruguay Round (1986–93) was the widest reaching of all and included significant reductions
2For purposes of this chapter, the term “General Agreement” refers to the agreementitself (the General Agreement on Tariffs and Trade) and the term “the GATT” refers to theorganization. However, the reader should be aware that the term “GATT 1947” is now usedto refer to the General Agreement as it existed before January 1, 1995, when the UruguayRound Agreements were implemented. The term “GATT 1994” is used to refer to theGeneral Agreement as it existed on and after January 1, 1995.

INTRODUCTION 61
in tariffs; the tariffication of quotas on agricultural goods; the phase-outof quotas on textiles and apparel; the expansion of the rules relating totrade in goods; the establishment of new rules relating to investment,intellectual property, and trade in services; a binding dispute settlementprocess; and the establishment of a permanent organization to administerthe agreements, the World Trade Organization.
A survey of the economic literature on trade provides a clear picture ofthe effects of trade policy on the United States. There is near unanimityin the literature that trade liberalization has broadly benefited the UnitedStates, although assessments differ considerably about its precise effects. Itis well recognized that the gains from trade liberalization are more widelydispersed than the losses, which may make the losses more apparent.However, the economy-wide benefits of trade liberalization are estimatedto be positive even after taking into account the costs of adjusting aneconomy to trade openness. Another observation made in the literatureis that further tariff reductions provide fewer gains to economic welfarewhen tariff barriers are already at very low levels.3 This is particularly truefor the United States and other developed countries as their average tariffrates edge toward zero. Finally, recent economic literature has begun toinclude analysis of services barriers and nontariff barriers; reductions inthese types of barriers are estimated to have a greater potential effect onwelfare than can be currently derived from additional reductions in tariffs.
This chapter provides an overview of U.S. trade policy since 1934and summarizes the literature on the economic effects of these policychanges on the United States. The first part, organized into four timeperiods, examines the key steps and results of U.S. trade policy since1934. The second part summarizes the economic literature on the effects oftrade liberalization, with brief discussions of economic theories and theirquantitative implications. For the purposes of this study, the referencedliterature was selected from peer-reviewed literature. For the section onthe history of U.S. trade, the literature review drew heavily on experts inthe fields of economic history, political economy and U.S. trade law. Thesection on economic effects focuses on analytical and rigorous studies,both theoretical and quantitative.4 Context and summary points have beenadded where necessary to provide the reader with a narrative structure.
3Welfare is used throughout this chapter in its economic sense; it correspondsapproximately to household income, taking into consideration the prices of goodspurchased by the household and the variety of goods available.
4The chapter will not, as a rule, explore the interplay of exchange rate policy and tradepolicy. For details on the exchange rate regime that prevailed until the mid 1970s when the

62 CHAPTER 3 U.S. TRADE POLICY SINCE 1934
A timeline of important legislation, policy changes, and related events isavailable at the end of this chapter.
History of U.S. Trade Policy since 1934
This section of the chapter provides a chronology of events sincepassage of the 1934 Reciprocal Trade Agreements Act (RTAA). Thischronology of the last 75 years documents the course of U.S. efforts toincrease trade openness. The period can be divided into four major eras.During the first era, from 1934 until the beginning of World War II, theUnited States began to reduce barriers and expand trade via a series ofbilateral agreements with its main trading partners to mutually reducetariffs. After World War II, trade policy shifted toward a multilateralapproach under the auspices of the GATT. Following the post-war periodof trade opening came a third era during which progress in multilateralnegotiations continued, with successive rounds of negotiations resultingin further tariff reductions and increasingly in rules regulating nontariffissues. As multilateral trade liberalization contributed to the growth of newexport-oriented industries in developing countries, the resulting disruptionsto importing countries gave rise to a series of measures in the formof voluntary export restraints and marketing arrangements, such as theMultifiber Arrangement for textiles and apparel.
Finally, the most recent period in U.S. trade policy has been markedby a renewed effort toward liberalization on multilateral, regional, andbilateral fronts after the United States completed a free trade agreementwith Israel in 1985. In 1989, the United States entered into a free tradeagreement with Canada and then in 1994 began implementing an expandedfree trade agreement that included Mexico (NAFTA). The Uruguay Roundnegotiations, concluded in 1994, further reduced tariffs on a global basisand included new agreements on issues of critical importance to manyU.S. industries, such as intellectual property, investments, and trade inservices. In the post-1995 period, the United States continued to negotiateand implement free trade agreements; chronologically, these agreementswere with Singapore, Chile, Australia, a group of Central American andCaribbean countries (CAFTA), Morocco, Bahrain, Oman, and Peru. Three
United States left the gold standard see Krugman and Obstfeld, International Economics,2000, chap. 18, and in particular, 557–61.

HISTORY OF U.S. TRADE POLICY SINCE 1934 63
additional agreements are awaiting approval at the time of this writing:Colombia, South Korea and Panama.
The Reopening of Trade (1934–1941)
After more than a decade of increasingly high barriers to U.S. imports,the 1934 RTAA signaled what was to be the beginning of a long push toliberalize trade. Before tracing that path, however, it is useful to step backa few years and look at the Tariff Act of 1930, commonly known as theSmoot-Hawley Act.
While economists have debated the precise impact of the Smoot-Hawley Tariff Act of 1930, it has come to epitomize the trade restrictingsentiment in the United States at the outset of the Great Depression.5
This legislation was originally intended to protect domestic agriculturalinterests from low-priced imports that arose from global surges in farmproduction in the aftermath of World War I.6 The stock market crashof 1929, however, prompted demands for increased protection from allsectors of the economy. What were initially seen as a series of limitedadjustments in duties affecting selected agricultural and manufacturingproducts escalated through “log rolling” into the more substantial tariffincreases incorporated into the Tariff Act of 1930.7 International retaliatorymoves led to a dramatic decline in the volume of world trade. Such actionsincluded an increase in tariffs by the United Kingdom, prohibitive Italiantariffs on automobiles, significantly increased Spanish duties on productslargely imported from the United States (e.g., automobiles, tires, tubes, andmotion pictures), and similar Canadian actions against U.S. imports.8
5Irwin notes, however, that the increase in average tariffs due to Smoot-Hawley wassomewhat more modest than often thought, at about a 23 percent increase (as applied toactual 1928 imports). For purposes of comparison, the Fordney-McCumber tariff increaseof just eight years earlier pushed the average tariff rate up by 64 percent. Nevertheless, thecumulative effect was to push tariff rates to historic levels. Irwin, “From Smoot-Hawley toReciprocal Trade Agreements,” 1998, 334.
6Chorev, Remaking U.S. Trade Policy, 2007, 44.7Taussig, The Tariff History of the United States, 1931, 498.8Eichengreen notes that the extent to which increased foreign trade restrictions were a
reaction to Smoot-Hawley versus a reflection of protectionist sentiments in those countriesis not completely clear. Eichengreen, “The Political Economy of the Smoot-Hawley Tariff,”August 1986, 47. Retaliatory moves are also discussed in great detail in Jones, TariffRetaliation, 1934.

64 CHAPTER 3 U.S. TRADE POLICY SINCE 1934
FIGURE 3.2 U.S. trade-weighted tariffs on dutiable imports and historicalperiods, 1930–2008
Source: USITC staff compilation from U.S. Dept. of Commerce statistics.
1940 1960 1980 2000
0
10
20
30
40
50
60
Avera
ge t
ari
ff o
n d
utiable
im
port
s (
%)
Reopening
of trade
WW II &
post−war
liberalization
Restructuring U.S.
trade policy
WTO &
proliferation
of FTAs
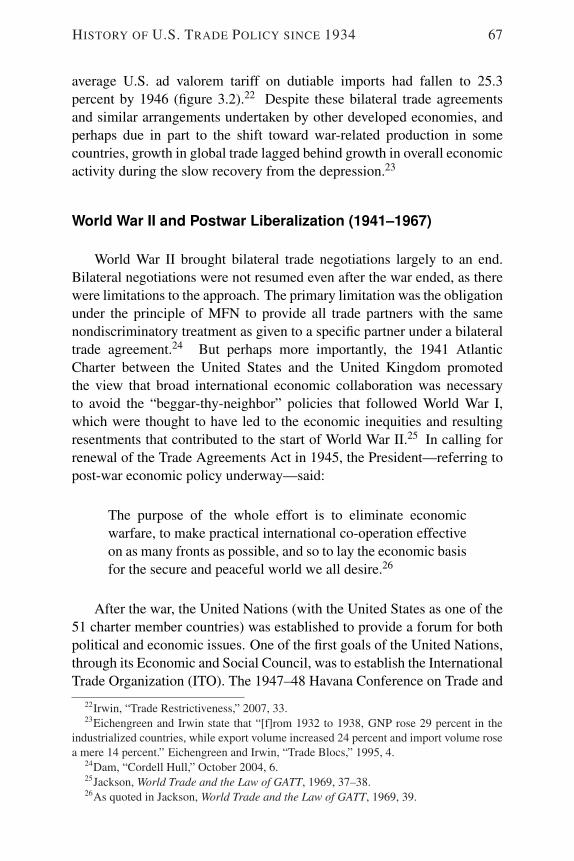
The average ad valorem equivalent tariff rose from 40.1 percent to 47.1percent from mid-1929 to mid-1930.9 More significantly, however, mosttariff rates incorporated in the 1930 act were specific duties (expressed asdollars per physical unit of the imported good) rather than a percentageof the import value. The effect of specific duties was such that reducingimport prices would increase the ad valorem equivalent tariff even with nochange in statutory tariff rates.10 Global price deflation in the early 1930stherefore led to further tariff increases in percentage terms, and the meanU.S. ad valorem tariff peaked at almost 60 percent in 1932 (figure 3.2).Two years after the Smoot-Hawley Act, the volume of both U.S. exportsand imports had fallen by approximately 41 percent.
9The average ad valorem equivalent tariff is the value of collected tariffs as a percentageof the value of dutiable imports. Irwin, “The Smoot-Hawley Tariff,” May 1998, 327.
10For example, an item worth $100 that has a specific duty of $10 would have an advalorem equivalent tariff of 10 percent. However, if deflation caused the item’s value todrop to $50, the item’s ad valorem equivalent tariff would then rise to 20 percent.

HISTORY OF U.S. TRADE POLICY SINCE 1934 65
Prior to the 1930 act, tariff changes were viewed as entirely thedomain of Congress.11 The depth of the global depression and the risein barriers imposed by foreign trading partners, however, made it clearthat international negotiations would be required to reverse these effects,as trading partners were unlikely to lower barriers to U.S. exports unlessthe United States acted in a similar manner. Although the President couldengage in multilateral negotiations, the need for a two-thirds majority inthe Senate to approve a resulting treaty made other countries less likely toengage in such negotiations.
The Roosevelt administration, which took office in 1933, was sym-pathetic to reducing tariffs, but in the midst of the depression, politicalsupport for unilateral reductions was lacking.12 The President thereforerequested, though not until March of 1934, that Congress authorize him tonegotiate bilateral or multilateral tariff-reduction agreements. The RTAAwas signed into law in June 1934.
The goal of the RTAA was export promotion, as its opening linestated it was “[f]or the purpose of expanding foreign markets for theproducers of the United States.”13 The RTAA permitted the Presidentto conclude bilateral, reciprocal trade agreements with a view towardreducing the tariffs of mutual interest to the United States and specific tradepartners.14 This allowed the President to engage in a more streamlinednegotiating process.15 The RTAA led to a series of bilateral tariff-reduction agreements, although these were not across-the-board cuts butrather selective reductions taking into account the possibility of injury toparticular industries. The U.S. reductions were generally applied accordingto the “most-favored-nation” (MFN) principle that had been in effect underU.S. trade law since 1923, in that tariff preferences granted to one countrywere automatically granted to imports into the United States from all
11Irwin, “From Smoot-Hawley to Reciprocal Trade Agreements,” 1998, 331.12Dam notes that Secretary of State Cordell Hull, a long-time proponent of low tariffs,
called for an “immediate unilateral reduction in U.S. tariffs” via a 1925 draft resolution inthe U.S. House of Representatives. Dam, “Cordell Hull,” October 2004, 2.
13Reciprocal Trade Agreements Act of 1934, Pub. L. No. 73-316 (1934).14These bilateral agreements did not need to be submitted for congressional approval.
Irwin, “From Smoot-Hawley to Reciprocal Trade Agreements,” 1998, 341.15The initial law was valid for a three-year period. It was renewed repeatedly and has
existed in some form since 1934 with a few major lapses: 1967–74, 1994–2002, andsince 2007. Currently, the President does not have this power, now called trade promotionauthority.

66 CHAPTER 3 U.S. TRADE POLICY SINCE 1934
other countries.16 “Free-riding”17 by other countries was minimized bystriking deals “only on commodities in which the negotiating country wasa ‘principal supplier’.”18
Tariff reduction necessitated finding alternate sources of governmentrevenues.19 While the share of federal revenues derived from customsduties had been steadily falling since the turn of the century (it was 40percent in 1910 before the 1913 ratification of the Sixteenth Amendmentestablished the modern system of income taxes), the percentage of federalrevenues coming from tariffs was still 14.5 percent in 1930.20 By 1940 thisshare fell to 4.8 percent and by 1950 to 1 percent (where it has remained todate).
Agreements had been signed under the RTAA with 21 countriesrepresenting approximately 60 percent of U.S. trade by June 1940.21 The
16Trebilcock and Howse present an extensive discussion of the rationale for and historyof MFN principles. There are both political and economic rationales for the principle,such as avoiding tensions among countries due to perceived discrimination in economicpolicy and inefficient distortions of trade flows that would result in its absence. Trebilcockand Howse, The Regulation of International Trade, 2005. The United States had longadhered to a “conditional” MFN policy in which tariff concessions negotiated with onecountry would be extended to others but only if those others made reciprocal concessions.Irwin, “From Smoot-Hawley to Reciprocal Trade Agreements,” 1998, 333. However, in1923, President Harding approved adoption of unconditional MFN in future commercialtreaties. The United States subsequently announced it would in the future adhere to an“unconditional” MFN policy–in which “any negotiated U.S. tariff reduction would beautomatically applied to all countries that had an MFN treaty with the United States.” Irwin,“The Smoot-Hawley Tariff,” 1998, 333; U.S. Tariff Commission, Operation of the TradeAgreements Program, Report No. 160, 1949.
17In other words, a country with MFN status could benefit without liberalizing any of itsown import tariffs.
18Irwin, “From Smoot-Hawley to Reciprocal Trade Agreements,” 1998, 27–28.19Taussig, in describing a phase-in period for a reduction in the sugar duty incorporated
in the Tariff Act of 1913 notes “the sugar duty contributed heavily to the customs revenue.The income tax, which was expected to make up for the loss in the customs revenue, wouldalmost certainly require time for working out its full yield.” Taussig, The Tariff History ofthe United States, 1914, 426.
20Personal and corporate income taxation provided a rapidly increasing share of federalrevenues, rising to 30 percent in 1935, to 77 percent in 1950, and to 93 percent today(including payroll taxes).
21Irwin, “From Smoot-Hawley to Reciprocal Trade Agreements,” 1998, 343; Beckett,The Reciprocal Trade Agreements Program, 1941, 32, 124. These countries (inchronological order of their effective dates) were: Cuba, Belgium, Haiti, Sweden,Brazil, Canada, the Netherlands, Switzerland, Honduras, Colombia, France, Guatemala,Nicaragua, Finland, El Salvador, Costa Rica, Czechoslovakia, Ecuador, the UnitedKingdom, Turkey, and Venezuela. Through 1945, 32 agreements were negotiated. Jackson,World Trade and the Law of GATT, 1969, 37.
HISTORY OF U.S. TRADE POLICY SINCE 1934 67
average U.S. ad valorem tariff on dutiable imports had fallen to 25.3percent by 1946 (figure 3.2).22 Despite these bilateral trade agreementsand similar arrangements undertaken by other developed economies, andperhaps due in part to the shift toward war-related production in somecountries, growth in global trade lagged behind growth in overall economicactivity during the slow recovery from the depression.23
World War II and Postwar Liberalization (1941–1967)
World War II brought bilateral trade negotiations largely to an end.Bilateral negotiations were not resumed even after the war ended, as therewere limitations to the approach. The primary limitation was the obligationunder the principle of MFN to provide all trade partners with the samenondiscriminatory treatment as given to a specific partner under a bilateraltrade agreement.24 But perhaps more importantly, the 1941 AtlanticCharter between the United States and the United Kingdom promotedthe view that broad international economic collaboration was necessaryto avoid the “beggar-thy-neighbor” policies that followed World War I,which were thought to have led to the economic inequities and resultingresentments that contributed to the start of World War II.25 In calling forrenewal of the Trade Agreements Act in 1945, the President—referring topost-war economic policy underway—said:
The purpose of the whole effort is to eliminate economicwarfare, to make practical international co-operation effectiveon as many fronts as possible, and so to lay the economic basisfor the secure and peaceful world we all desire.26
After the war, the United Nations (with the United States as one of the51 charter member countries) was established to provide a forum for bothpolitical and economic issues. One of the first goals of the United Nations,through its Economic and Social Council, was to establish the InternationalTrade Organization (ITO). The 1947–48 Havana Conference on Trade and
22Irwin, “Trade Restrictiveness,” 2007, 33.23Eichengreen and Irwin state that “[f]rom 1932 to 1938, GNP rose 29 percent in the
industrialized countries, while export volume increased 24 percent and import volume rosea mere 14 percent.” Eichengreen and Irwin, “Trade Blocs,” 1995, 4.
24Dam, “Cordell Hull,” October 2004, 6.25Jackson, World Trade and the Law of GATT, 1969, 37–38.26As quoted in Jackson, World Trade and the Law of GATT, 1969, 39.

68 CHAPTER 3 U.S. TRADE POLICY SINCE 1934
Employment concluded with the Havana Charter, an agreement by 52countries, which was to prepare the way for the ITO.27 However, the ITOconcept of a multilateral institution was abandoned when it became clearthat the United States would not accept the Havana Charter.28
Preparatory work on the ITO, however, did result in the set of traderules and disciplines embodied in the General Agreement on Tariffs andTrade, which was signed by 23 countries including the United States inOctober 1947.29 The General Agreement, and the informal organization(the GATT) created to oversee its implementation, became the vehiclefor multilateral trade negotiations for the next 50 years. The first GATTnegotiations, held in Geneva, led to U.S. tariff reductions, effective January1948, which brought the average U.S. ad valorem rate on dutiable importsdown to 13.9 percent from 19.4 percent in 1947, though a considerable partof that reduction was due to increased import prices rather than negotiatedreductions in specific duties.30
At the time the General Agreement was drafted, the United Stateswas a major exporter of agricultural goods. Moreover, it had in placea substantial set of price and quantity controls on agriculture establishedunder the 1933 Agricultural Adjustment Act. The General Agreement wasdrafted to exempt existing agricultural programs maintained by the UnitedStates and other parties. The United States played a significant role in thisexemption.31 After a 1951 amendment to the 1933 act that required certainimport quotas, the United States requested and received a waiver in 1955that permitted the new U.S. agricultural quotas.32
The Annecy (1949), Torquay (1950–51), Geneva (1955–56) and Dillon(1961–62) Rounds produced only small tariff reductions.33 However,these rounds slightly increased the number of signatories to the GATT andconsolidated the initial gains of the GATT by signaling the commitment ofthe members to the new structure of trade negotiations (see figure 3.3).34
27McGovern, International Trade Regulation, 1995, 1.11-1.28Diebold suggests that a variety of domestic groups, as well as the lack of political will
or power by the Truman administration, contributed to the charter’s failure to pass the U.S.Congress. Diebold, “The End of the ITO,” 1952, 3.
29The GATT was originally conceived as an agreement within the context of the ITO.Jackson, World Trade and the Law of the GATT,1969, 43.
30Irwin, “From Smoot-Hawley to Reciprocal Trade Agreements,” 1998, 346.31Jackson, World Trade and the Law of GATT, 1969, 733.32Jackson, World Trade and the Law of GATT, 1969, 734-735.33Irwin, “From Smoot-Hawley to Reciprocal Trade Agreements,” 1998, 346.34Table F.2, provides a detailed summary of all negotiating rounds under the GATT.

HISTORY OF U.S. TRADE POLICY SINCE 1934 69
FIGURE 3.3 GATT round summary: number of signatories (left axis) andweighted average tariff reductions (right axis)
Sources: World Trade Report and Hoekman and Kostecki.
Note: See table F.2 in appendix F for additional information regarding this figure.
Geneva
1947
Annecy
1949
Torquay
1951
Geneva
1956
Dillon
1962
Kennedy
1967
Tokyo
1979
Uruguay
1994
0
20
40
60
80
100
120
140
Num
ber
of
sig
nato
ries
0
10
20
30
40
% re
ductio
n
Signatories
Average tariff reduction
Several European countries attempted to create their own economiclinkages in order to reduce the possibility of renewed hostilities by formingthe European Coal and Steel Community (ECSC) in 1951 and the EuropeanEconomic Community (EEC) in 1957. These regional trading blocsencouraged subsequent multilateral trade negotiations as the United Stateswas unwilling to be shut out of the European market.35
The United States entered the 1960s in robust macroeconomic health.U.S. productivity growth was stable at an average annual rate of 3 percentduring the 1960s, and inflation remained low, with an average below3 percent over the same time frame.36 The strength of the economyrelied heavily on the country’s post-war manufacturing preeminence. TheEuropean and Japanese economies, decimated by World War II, began thedecade still lagging behind the United States but had made significantprogress rebuilding their manufacturing capabilities by the end of thedecade.
35Irwin, “The GATT in Historical Perspective,” 1995, 326.36Pearson, United States Trade Policy, 2004, 10.

70 CHAPTER 3 U.S. TRADE POLICY SINCE 1934
In the context of continued growth, the Trade Expansion Act of 1962was passed. The primary aim of the act was to authorize the President tonegotiate further reductions in duties. The act authorized the President tonegotiate across-the-board tariff-rate cuts37 as well as tariff reductions ofup to 50 percent, an increase from the 1958 extension of the RTAA thatonly allowed reductions of up to 20 percent. The Trade Expansion Actalso moved the locus of trade negotiations to the separate U.S. governmentoffice of the newly created Special Trade Representative.38 The 1962 TradeExpansion Act passed Congress with the support of the labor unions, whowere reassured by the inclusion of the new Trade Adjustment Assistance(TAA) program designed to help workers in industries adversely affectedby trade.39 However, the TAA program was subject to strict criteria, and nofavorable action was granted to workers seeking relief until 1969;40 eventhrough 1974 relatively few workers had obtained compensation under theTAA.41
Restructuring U.S. Trade Policy (1967–1989)
The 1967–89 period was marked by a struggle among domesticinterests over the trade liberalization framework. This domestic strugglearose out of the considerable pressures placed on U.S. manufacturers inimport-competing industries during the 1960s and 1970s when Europeanand Japanese firms emerged from their post-World War II rebuilding effortswith a greater level of competitiveness. Additionally, the late 1960sand 1970s presented a series of macroeconomic challenges, including theoil shocks, the end of fixed exchange rate regimes, and high inflation,which further disrupted U.S. industries. Domestic producers in certainvulnerable industries, particularly labor-intensive manufacturers, pushedfor legislation against imports, while export-oriented producers, includingcertain agricultural exporters, opposed new U.S. barriers that might leadto reciprocal barriers against U.S. exports. Those domestic producers infavor of restricting trade were initially successful in reducing imports from
37As noted by Chorev, this was a change from prior extensions of the RTAA thatpermitted only line-by-line negotiations. Chorev, Remaking U.S. Trade Policy, 2007, 61.
38Office of the USTR, “History of the U.S. Trade Representative,” undated (accessedFebruary 2, 2009).
39Destler, American Trade Politics, 1995, 23.40Baldwin, “The Changing Nature of U.S. Trade Policy,” 1984a, 13.41Fewer than 54,000 workers received compensation under the program through 1974.
Kenan, The International Economy, 2000, 228.

HISTORY OF U.S. TRADE POLICY SINCE 1934 71
a limited number of countries via quota-based agreements or voluntaryexport restraints (VERs).42 As will be explained in detail in this section,these practices were gradually applied to other vulnerable industries, aswell as to a broader set of countries. The effect was a significant lossof momentum in the reduction of trade barriers and an increase in tradebarriers in certain areas. However, this trend began to reverse itself towardthe end of the era, when a set of trade remedy laws was established toaddress the concerns of those in the import-competing industries, while atthe same time a broader liberalization agenda was revived.
Voluntary Export Restraints (VERs)
As early as the mid-1950s, certain import-competing industries beganlobbying for government action against imported goods. The mostvulnerable industries—those that employed domestic labor intensively,those that competed with foreign labor-intensive manufacturing processes,or those with easily adoptable technologies—were among the most ferventin their lobbying efforts. Much of this effort was initially directed againstJapan’s cotton textile manufacturers.43 In order to deflect charges of unfairtrade practices and to avoid punitive tariffs, Japan voluntarily agreed torestrict its exports to many of its trade partners. These VERs were initiallyapplied to certain cotton products in 1955 at the time of Japan’s accessionto the GATT. Even with the agreement in place, many GATT membersdeclined to grant MFN status to Japan.44 This was done via the “opt-out”clause of the GATT, which allowed any member to refuse to grant MFNstatus to any country at the time of that country’s accession.45 With thetrade restraints in place, Japan eventually achieved MFN status from GATTmembers. The VER agreements with the United States called for Japan torestrain its textiles exports to approximately 1.5 percent of U.S. domesticproduction of textiles, with a one-time 5.2 percent increase in exports
42Voluntary export restraints are restraints placed by exporting countries (usuallyexporters of low-priced goods) on their own goods, generally after considerable pressureby the importing country.
43Japan’s exports of cotton textiles increased sixfold from 1945 to 1955, providingsudden competition for U.S. manufacturers. Hunter and Macnaughtan, “Textile Workers inJapan,” 2008, 39. It should be noted, however, that by 1959 Japan had merely regained itsprewar share of textile world trade. Keesing and Wolf, Textile Quotas Against DevelopingCountries, 1980, 12.
44The United States did extend MFN status to Japan.45Jackson, The World Trading System, 1997, 60.

72 CHAPTER 3 U.S. TRADE POLICY SINCE 1934
permitted in 1959.46 Over time, U.S.-Japanese VER agreements expandedfrom narrowly defined product categories to agreements covering a diverseset of goods from tuna to kitchen utensils.47 Several other countries,including Australia, France and the United Kingdom also concluded VERswith Japan.48
The GATT Long-Term Arrangement Regarding International Trade inCotton Textiles (LTA) was established in 1962. This agreement included29 exporting and importing nations and imposed VERs on cotton textilesto the United States and several other developed countries.49 By 1972, newVER agreements had been made that included increasingly popular man-made fibers, as well as wool, and were applied to South Korea, Taiwan,Hong Kong, and Malaysia. The GATT Multifiber Arrangement (MFA)was implemented in 1974. The MFA initially comprised approximately40 countries, including nine developed country importers (including theUnited States).50 It restricted exporters to “orderly marketing agreements,”effectively VERs, on certain textile and apparel products including cotton,certain man-made fibers, and wool. The MFA, as with VERs, providedU.S. firms with an adjustment period, enabling them to revise theirproduction process to become more internationally competitive or to shiftproduction to a product more in line with their comparative advantage.The MFA was renewed multiple times until it was replaced by the WTOAgreement on Textiles and Clothing (ATC), to which the United States wasa party, under which textile quotas were phased out from 1995 to 2005.
Textile quotas and restraints were applied largely to benefit domesticinterests in the United States and other industrialized nations althoughbenefits also accrued to certain developing countries. For example,countries that were allocated quotas received guaranteed market accesseven for marginally efficient products. Quotas also provided incentivesfor developing countries to increase value added per unit as a way ofmaximizing the revenue from abroad.51
46McClenahan, “The Growth of Voluntary Export Restraints,” 1991, 183.47Ibid., 184.48Farrell, Japanese Investment in the World Economy, 179.49The LTA was preceded by an interim measure, the GATT Short-Term Arrangement
(STA), which provided terms on imports and exports of cotton textiles similar to those ofthe eventual LTA. The STA was drafted by representatives of 16 countries including theUnited States and was in effect from 1961 to 1962. USITC, The History and Current Statusof the Multifiber Arrangement, 1978, 8-9.
50Jackson, The World Trading System, 1997, 208.51For a lengthier treatment of the effects of textiles quotas on developing countries see
Keesing and Wolf, Textile Quotas Against Developing Countries, 1980, 122-128.
HISTORY OF U.S. TRADE POLICY SINCE 1934 73
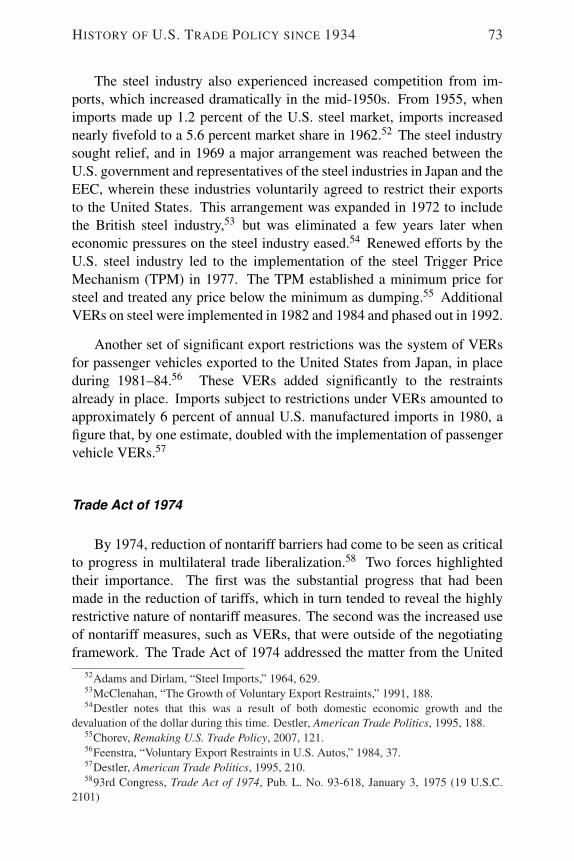
The steel industry also experienced increased competition from im-ports, which increased dramatically in the mid-1950s. From 1955, whenimports made up 1.2 percent of the U.S. steel market, imports increasednearly fivefold to a 5.6 percent market share in 1962.52 The steel industrysought relief, and in 1969 a major arrangement was reached between theU.S. government and representatives of the steel industries in Japan and theEEC, wherein these industries voluntarily agreed to restrict their exportsto the United States. This arrangement was expanded in 1972 to includethe British steel industry,53 but was eliminated a few years later wheneconomic pressures on the steel industry eased.54 Renewed efforts by theU.S. steel industry led to the implementation of the steel Trigger PriceMechanism (TPM) in 1977. The TPM established a minimum price forsteel and treated any price below the minimum as dumping.55 AdditionalVERs on steel were implemented in 1982 and 1984 and phased out in 1992.
Another set of significant export restrictions was the system of VERsfor passenger vehicles exported to the United States from Japan, in placeduring 1981–84.56 These VERs added significantly to the restraintsalready in place. Imports subject to restrictions under VERs amounted toapproximately 6 percent of annual U.S. manufactured imports in 1980, afigure that, by one estimate, doubled with the implementation of passengervehicle VERs.57
Trade Act of 1974
By 1974, reduction of nontariff barriers had come to be seen as criticalto progress in multilateral trade liberalization.58 Two forces highlightedtheir importance. The first was the substantial progress that had beenmade in the reduction of tariffs, which in turn tended to reveal the highlyrestrictive nature of nontariff measures. The second was the increased useof nontariff measures, such as VERs, that were outside of the negotiatingframework. The Trade Act of 1974 addressed the matter from the United
52Adams and Dirlam, “Steel Imports,” 1964, 629.53McClenahan, “The Growth of Voluntary Export Restraints,” 1991, 188.54Destler notes that this was a result of both domestic economic growth and the
devaluation of the dollar during this time. Destler, American Trade Politics, 1995, 188.55Chorev, Remaking U.S. Trade Policy, 2007, 121.56Feenstra, “Voluntary Export Restraints in U.S. Autos,” 1984, 37.57Destler, American Trade Politics, 1995, 210.5893rd Congress, Trade Act of 1974, Pub. L. No. 93-618, January 3, 1975 (19 U.S.C.
2101)

74 CHAPTER 3 U.S. TRADE POLICY SINCE 1934
States’ perspective. It provided relief from injury caused by importcompetition and provided other adjustment assistance for workers andfirms.59 At the same time, the 1974 act reduced the overall level of tradebarriers, reinstated the President’s authority to negotiate tariff reductionsin the Tokyo Round (1973–79), and extended trade negotiation authorityto the reduction of nontariff measures, which previous trade authorizationbills had not explicitly included.60 This renewal of trade negotiatingauthority was similar to the 1934 RTAA (which had finally lapsed in1962), although the 1974 act required greater consultation with Congressduring the negotiating process. The 1974 act provided so-called fast trackauthority under which Congress agreed that if the President submittedlegislation to implement a trade agreement and followed certain proceduralrequirements, Congress would veto or approve, but not amend, thelegislation. This authority signaled the seriousness of the administration’sintent when negotiating with trade partners and helped to speed upnegotiations by limiting Congress’s role to setting negotiating objectivesand active consultation.61
To address concerns from industries about increased competition fromabroad, the 1974 act relaxed the requirements for obtaining relief viavarious measures collectively called trade remedies. These trade remedies,as discussed below, had in some cases been available to firms since 1921.62
The intent of the legislation was to provide a rational framework forrelief from import competition to replace what some observers claimedhad become a series of exemptions for powerful industries.63 Althoughthe relaxed trade-remedy requirements enabled less-powerful industries tosuccessfully obtain relief, industries previously receiving favored treatmentcontinued to do so under the new legislation, and the 1974 act easedthe requirements somewhat for obtaining assistance under the TradeAdjustment Assistance program.64 The 1974 Trade Act changed the nameof the U.S. Tariff Commission—initially established in 1916—to the U.S.International Trade Commission to reflect the expansion of trade issuesbeyond tariffs. More substantively, the legislation authorized the President
5993rd Congress, Trade Act of 1974, Pub. L. No. 93-618, January 3, 1975 (19 U.S.C.2101).
60Destler, American Trade Politics, 1995, 312.61Ibid., 71.62The first, though rarely used, antidumping provision was in the Antidumping Law
of 1916, 15 U.S.C. §71 et seq. The law generally thought of as the basis for currentantidumping concepts is the Antidumping Act of 1921.
63Destler, American Trade Politics, 1995, 142.64Ibid., 140.
HISTORY OF U.S. TRADE POLICY SINCE 1934 75
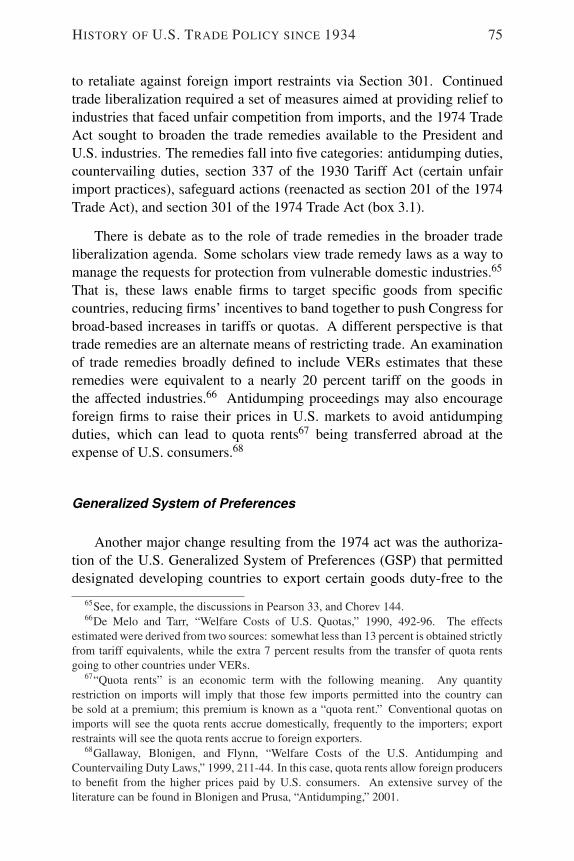
to retaliate against foreign import restraints via Section 301. Continuedtrade liberalization required a set of measures aimed at providing relief toindustries that faced unfair competition from imports, and the 1974 TradeAct sought to broaden the trade remedies available to the President andU.S. industries. The remedies fall into five categories: antidumping duties,countervailing duties, section 337 of the 1930 Tariff Act (certain unfairimport practices), safeguard actions (reenacted as section 201 of the 1974Trade Act), and section 301 of the 1974 Trade Act (box 3.1).
There is debate as to the role of trade remedies in the broader tradeliberalization agenda. Some scholars view trade remedy laws as a way tomanage the requests for protection from vulnerable domestic industries.65
That is, these laws enable firms to target specific goods from specificcountries, reducing firms’ incentives to band together to push Congress forbroad-based increases in tariffs or quotas. A different perspective is thattrade remedies are an alternate means of restricting trade. An examinationof trade remedies broadly defined to include VERs estimates that theseremedies were equivalent to a nearly 20 percent tariff on the goods inthe affected industries.66 Antidumping proceedings may also encourageforeign firms to raise their prices in U.S. markets to avoid antidumpingduties, which can lead to quota rents67 being transferred abroad at theexpense of U.S. consumers.68
Generalized System of Preferences
Another major change resulting from the 1974 act was the authoriza-tion of the U.S. Generalized System of Preferences (GSP) that permitteddesignated developing countries to export certain goods duty-free to the
65See, for example, the discussions in Pearson 33, and Chorev 144.66De Melo and Tarr, “Welfare Costs of U.S. Quotas,” 1990, 492-96. The effects
estimated were derived from two sources: somewhat less than 13 percent is obtained strictlyfrom tariff equivalents, while the extra 7 percent results from the transfer of quota rentsgoing to other countries under VERs.
67“Quota rents” is an economic term with the following meaning. Any quantityrestriction on imports will imply that those few imports permitted into the country canbe sold at a premium; this premium is known as a “quota rent.” Conventional quotas onimports will see the quota rents accrue domestically, frequently to the importers; exportrestraints will see the quota rents accrue to foreign exporters.
68Gallaway, Blonigen, and Flynn, “Welfare Costs of the U.S. Antidumping andCountervailing Duty Laws,” 1999, 211-44. In this case, quota rents allow foreign producersto benefit from the higher prices paid by U.S. consumers. An extensive survey of theliterature can be found in Blonigen and Prusa, “Antidumping,” 2001.

76 CHAPTER 3 U.S. TRADE POLICY SINCE 1934
BOX 3.1 Trade remedies
The antidumping provisions allow firms to seek relief from dumping (defined asselling imported products below their “fair” or “normal” value) if they are injured bythe dumped imports. The determination of whether dumping is occurring is oftenbased on a comparison of the U.S. price of the import with the home-market price,but in many cases is related to cost (specifically, cost plus a reasonable profitmargin). The determination of injury by imports was transferred from the U.S.Department of Treasury to the USITC (then called the Tariff Commission) in 1954under the Customs Simplification Act.a
The countervailing duty provisions may be applied when a foreign countrysubsidizes exports. An injury test was introduced in the 1974 Trade Act.
Antidumping and countervailing duty laws were strengthened in both the 1974 and1979 Trade Acts. Prior to the 1970s, neither measure had been used frequently.
Section 337 of the 1930 Tariff Act provided for relief against unfair practices inimport trade particularly with respect to infringement of intellectual property rights.The authority of the USITC was strengthened in the 1974 Trade Act to ban importsor issue cease and desist orders in addition to determining violations of the law.b
Section 201 of the 1974 Trade Act modified provisions of the existing “escapeclause” mechanism. The escape clause, also known as a safeguard action,originally provided recourse for domestic industries injured by a reduction in U.S.tariff rates. The previous mechanism found in the Trade Expansion Act of 1962 hadstrict requirements for demonstrating injury. A specific U.S. tariff concession had tobe the “major cause” of injury to an industry, meaning that the concession causedmore harm than all other factors combined.c The 1974 Trade Act relaxed thisrequirement. Under the new language, imports need only cause damage to theindustry to a degree “not less than any other cause.”d The act also removed theburden of linking the harm to a specific U.S. tariff concession.
United States. GATT signatories agreed to this type of program, and signeda waiver in 1971 permitting this exception to reciprocal trade concessionsas embodied in the MFN clause of the GATT, in favor of nonreciprocalconcessions for designated developing countries. Thereafter, most indus-trial countries, including the United States, introduced individual GSPprograms for the benefit of developing countries.69
69Hoekman and Kostecki note that developing countries did not receive special treatmentunder the original GATT structure. Several developing countries argued at the timethat they should be given special access and exemptions in order to be able to competeinternationally with products from more developed countries. The Haberler Report, in1958, was the first major initiative to discuss the needs and concerns specific to developingcountries at the multinational level. Hoekman and Kostecki, The Political Economy of theWorld Trading System, 2001, 385; Keck and Low, “Special and Differential Treatment inthe WTO,” 2004, 4.
HISTORY OF U.S. TRADE POLICY SINCE 1934 77
BOX 3.1 Trade remedies, continued
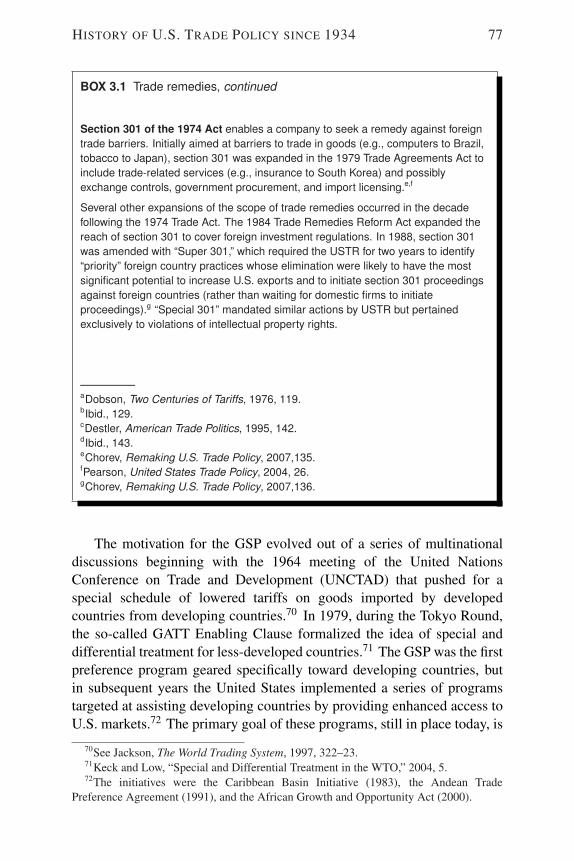
Section 301 of the 1974 Act enables a company to seek a remedy against foreigntrade barriers. Initially aimed at barriers to trade in goods (e.g., computers to Brazil,tobacco to Japan), section 301 was expanded in the 1979 Trade Agreements Act toinclude trade-related services (e.g., insurance to South Korea) and possiblyexchange controls, government procurement, and import licensing.e,f
Several other expansions of the scope of trade remedies occurred in the decadefollowing the 1974 Trade Act. The 1984 Trade Remedies Reform Act expanded thereach of section 301 to cover foreign investment regulations. In 1988, section 301was amended with “Super 301,” which required the USTR for two years to identify“priority” foreign country practices whose elimination were likely to have the mostsignificant potential to increase U.S. exports and to initiate section 301 proceedingsagainst foreign countries (rather than waiting for domestic firms to initiateproceedings).g “Special 301” mandated similar actions by USTR but pertainedexclusively to violations of intellectual property rights.
—————aDobson, Two Centuries of Tariffs, 1976, 119.bIbid., 129.cDestler, American Trade Politics, 1995, 142.dIbid., 143.eChorev, Remaking U.S. Trade Policy, 2007,135.fPearson, United States Trade Policy, 2004, 26.gChorev, Remaking U.S. Trade Policy, 2007,136.
The motivation for the GSP evolved out of a series of multinationaldiscussions beginning with the 1964 meeting of the United NationsConference on Trade and Development (UNCTAD) that pushed for aspecial schedule of lowered tariffs on goods imported by developedcountries from developing countries.70 In 1979, during the Tokyo Round,the so-called GATT Enabling Clause formalized the idea of special anddifferential treatment for less-developed countries.71 The GSP was the firstpreference program geared specifically toward developing countries, butin subsequent years the United States implemented a series of programstargeted at assisting developing countries by providing enhanced access toU.S. markets.72 The primary goal of these programs, still in place today, is
70See Jackson, The World Trading System, 1997, 322–23.71Keck and Low, “Special and Differential Treatment in the WTO,” 2004, 5.72The initiatives were the Caribbean Basin Initiative (1983), the Andean Trade
Preference Agreement (1991), and the African Growth and Opportunity Act (2000).
78 CHAPTER 3 U.S. TRADE POLICY SINCE 1934
to assist the developing countries by encouraging their economic growth,although the United States benefits as well.73
Addressing Nontariff Measures
A series of multilateral initiatives began in the late 1960s to counterthe proliferation of nontariff measures, in particular quotas and VERs. TheKennedy Round (1964–67) was the first multilateral round to deal withnontariff measures, although its success was limited. Several agreementswere reached, notably on antidumping measures and a unified method forcustoms valuation. However, the U.S. Congress never passed the agree-ments, and the agreements became voluntary. The President, according toCongress, exceeded his authority by attempting to implement the nontariffmeasures as an executive agreement. Congress insisted that nontariffmeasures negotiated during the subsequent Tokyo Round be submitted toit for final approval.74 The main accomplishment of the Kennedy Roundwas a reduction in tariffs, which participating countries cut in 1967 to anaverage of 8.7 percent, a decrease of 35 percent.75
The Tokyo Round (1973–79) raised the subject of nontariff measuresagain, and this time an agreement was reached. The agreements resultingfrom the Tokyo Round were in the form of so-called codes, which wereagreements signed by only a subset of GATT countries—generally theOECD countries plus a few developing countries. The codes includedagreements on a number of subjects: customs valuation, governmentprocurement, import licensing procedures, subsidies and countervailingduties, antidumping duties, standards (technical barriers to trade), anda civil aircraft agreement. This time, the U.S. Congress approved theagreements without difficulty.
73A body of literature seeks to quantify these benefits. Hoekman, Martin, and Braga(2006) summarize some of this literature. Dean and Wainio, in estimating the value ofthe preference programs for the developing countries, point out that, as trade barriersare reduced, countries that are the beneficiaries of preference programs no longer havean advantage vis-a-vis the rest of the world. However, the key question as to whetherpreference programs aid in integrating developing countries into the world economy hasnot yet been conclusively answered. Hoekman, Martin, and Braga, “Preference Erosion”,2006, 19; Dean and Wainio, “Quantifying the Value of U.S. Tariff Preferences,” 2006.
74Baldwin, “The Changing Nature of U.S. Trade Policy Since World War II,” 1984, 19.Jackson attributes this failure to “procedural devices engineered by domestic interests” touphold protection for their products. Jackson, The World Trading System, 1997, 75.
75Ibid., 74.

HISTORY OF U.S. TRADE POLICY SINCE 1934 79
TABLE 3.1 Trade-weighted average tariffs by selected regions and negotiatinground
Pre-Kennedy Kennedy Tokyo UruguayCountry Round Round Round Round
Japan 7.3 4.5 2.7 1.7United States 9.2 5.9 4.3 3.5European Union 7.7a 4.8a 4.6b 3.6c
Source: World Trade Report 2007, Table 8, 209.aEEC6: Germany, France, Italy, the Netherlands, Belgium, and Luxembourg.bEEC9: EEC6 plus Denmark, Ireland, and the United Kingdom.cEU12: EEC9 plus Greece, Portugal, and Spain.
Nonetheless, these codes produced only limited results for nontariffbarrier liberalization. In addition, an effective enforcement structure waslacking in that the codes were voluntary. Dispute settlement provisionslacked effective penalties for failure to uphold commitments. Majorissues, notably textile quotas and nontariff issues pertaining to the sensitiveagriculture sector, were left out of these Tokyo Round codes. Moreover, thecodes did not halt the spread of VERs, as new quantitative restrictions wereagreed upon shortly after the negotiations ended.
Meanwhile, tariff cuts continued apace. The Tokyo Round resultedin a decrease in average bound tariff rates of 34 percent by participatingcountries, with post-Tokyo Round tariffs averaging 6.3 percent in 1979.76
Although concrete progress on nontariff barriers was limited, the Kennedyand Tokyo Rounds provided continuity of negotiations and continued theprocess of liberalization (table 3.1 shows tariff levels for the Kennedy,Tokyo, and Uruguay Rounds for Japan, the European Union, and theUnited States).
The Trade Agreements Act of 1979 further eased the requirementsfor obtaining relief under domestic trade remedies. The 1979 TradeAct also shifted responsibility for administrating aspects of antidumpingand countervailing duty law (shared with the USITC) from the U.S.Department of the Treasury to the Department of Commerce.77 In addition,the act added a requirement of an injury test to most countervailingduty investigations and established streamlined procedures for both theCommerce Department and the USITC to complete preliminary and finalinvestigations much more rapidly than had been the case previously.
76Jackson, The World Trading System, 1997, 74.77USITC, Antidumping and Countervailing Duty Handbook, 2008.

80 CHAPTER 3 U.S. TRADE POLICY SINCE 1934
The 1988 Omnibus Trade and Competitiveness Act established theU.S. negotiating objectives for the Uruguay Round. Its overarchingobjectives were the reciprocal lowering of trade barriers and other tradedistortions and an improved system of dispute settlement. Specificobjectives were detailed in areas such as agriculture, services, intellectualproperty, and foreign direct investment.78 Another key component of the1988 act was an amendment to section 301 of the Trade Act of 1974 (seebox 3.1 for details). The 1988 act sought to increase exports via a setof domestic measures including promotion of technological competitive-ness. The act also promoted competitiveness in technology (e.g. federalresearch programs in semiconductor and other advanced manufacturingtechnologies) and expanded adjustment assistance for workers in industriesadversely affected by increased imports.
The World Trade Organization and the Proliferation of FreeTrade Agreements (since 1989)
The era since 1989 has been marked by several initiatives to revitalizetrade negotiations. During this period, the United States committedto multiple agreements and focused on expanding the reach of tradenegotiations into sensitive and technically difficult areas. The agreementsimplementing the results of the Uruguay Round of multilateral tradenegotiations and establishing the World Trade Organization were signedin 1993. The United States also signed a string of bilateral and regionalagreements, including the politically and economically significant NorthAmerican Free Trade Agreement.
The economic backdrop of these agreements was the increasinglyglobalized nature of trade. During the 1980s, worldwide exports grewon average 68 percent faster than global GDP, and in the 1990s, exportsgrew nearly 140 percent faster than global GDP.79 Improvements intransportation and communications, in addition to lower policy barriers,have expanded trade in goods (and increasingly in services) and facilitatedthe creation of widely dispersed production networks.80 Partly as a result ofthese lower trade costs and improved communication, firms began to break
78Omnibus Trade and Competitiveness Act of 1988, Pub. L. No. 100-418.79World Bank, World Development Indicators Online.80Feenstra provides a summary of the recent growth in international trade as well as a
detailed analysis of changes in international production methods. Feenstra, “Integration ofTrade,” 1998.
HISTORY OF U.S. TRADE POLICY SINCE 1934 81
apart their production processes and distribute them around the world.Companies sourced and produced parts internationally according to wherethe item could be made at a better quality or at a lower cost. This growingtrade in intermediate goods contributed to trade expanding more rapidlythan GDP and increased the number of players having a vested interestin lower trade barriers.81 Additionally, technical improvements permittedpreviously nontradable services to become increasingly traded.82 Tradeliberalization in this era saw a resurgence in the use of bilateral and regionalagreements, which contrasted with the prior era’s emphasis on multilateral,GATT-based negotiations. The GATT (primarily via Article XXIV ofGATT 1994) permits regional agreements provided that the countriesadhere to certain conditions, such as a commitment not to increase dutiesbetween the regional trade area and other WTO members. An extensivebody of literature debates whether free trade agreements (either regionalor bilateral) have had a beneficial effect on global trade.83 One branchof this literature84 argues that regional trade works against the drive forglobal integration because it undermines the motivation to reduce barriersto all countries and increases trade diversion.85 Another branch of the tradeliterature argues that regional trade blocs are a way of moving forward intrade liberalization when multilateral negotiations are temporarily blocked.Regional or bilateral trade agreements could persuade recalcitrant WTOmembers to reengage and are a forum to test ideas on new areas of tradeliberalization.
81Barton et al., The Evolution of the Trade Regime, 2006, 124.82Prime examples are technical developments in information technology that allow for
the tradability of software development and call centers.83A detailed exposition of this literature is found in Feenstra, Advanced International
Trade, 2004, 175–208. A less formal discussion appears in Krugman and Obstfeld,International Economics, 2000, 241–45.
84Krueger, “Are Preferential Trade Arrangements Trade-Liberalizing or Protectionist?”1999, provides a synthesis of the two sides; see Bhagwati, Krishna, and Panagariya,Trading Blocs, 1999, for a discussion regarding the issues brought about by free tradeagreements; and Baldwin, “The Causes of Regionalism,” 1997, for a counterpoint.
85If the United States applies uniform tariffs to all countries, it will import an item fromthe most efficient producer. However if it lowers tariffs through a free trade agreement toa country that is not an efficient producer, imports from that country will increase at theexpense of those from the efficient producer. This is called trade diversion.
82 CHAPTER 3 U.S. TRADE POLICY SINCE 1934
Trade Agreements in North America
The U.S.-Canada Free Trade Agreement, which entered into force in1989, was an important milestone in U.S. trade policy.86 It signaled arenewed U.S. interest in bilateral or regional free trade agreements, onethat had been largely absent from the trade policy agenda since the pre-World War II accords.87 Moreover, it implemented certain innovations,such as liberalization of financial services and a dispute-settlement process,ahead of the Uruguay Round negotiations. The agreement emerged fromCanada’s interest in greater access to the U.S. market and both countries’frustration with the multilateral process. It was hoped that the agreementwould spur the international community to a resolution of the UruguayRound.88 The U.S.-Canada agreement was formalized between the twocountries while talks were still ongoing at the multilateral level.
Soon after the U.S.-Canada Free Trade Agreement was signed, andpartly as a consequence, Mexico approached the United States for asimilar accord.89 As a result, the North American Free Trade Agreement(NAFTA), comprising the United States, Canada, and Mexico, was signedand entered into force in 1994.90 In many cases, tariffs on goods tradebetween NAFTA countries were lifted immediately, and others weregradually phased out. For example, U.S. restrictions on imports ofsugar were phased out over 15 years; Mexico received a tariff-free quotaallocation, which increased incrementally, and all restrictions on sugarwere finally eliminated at the beginning of 2008.91
At the same time, Mexico lowered its barriers to U.S. agriculturalproducts, reduced its restrictions on imports of automobiles, and applied
86A prior agreement, the 1965 U.S.-Canadian Automobile Agreement, was significant.It provided reciprocal duty-free access for newly manufactured automobiles and relatedparts between the United States and Canada. To qualify for duty-free treatment, NorthAmerican content of the automobiles had to be at least 50 percent, and Canada imposedcertain additional restrictions on manufacturers to ensure a minimum level of domesticproduction. Helmers, The United States-Canadian Automobile Agreement, 1967.
87The United States did sign two free trade agreements, with Israel in 1985 and withJordan in 2000 in which political considerations predominated, according to Rosen, “FreeTrade Agreements as Foreign Policy,” 2004, 53–55.
88Pearson, United States Trade Policy, 2004, 108.89Destler, American Trade Politics, 1995, 135.90The NAFTA Implementation Act was submitted to Congress on November 4,
1993. U.S. House of Representatives, Committee on Ways and Means, Overview andCompilation of U.S. Trade Statutes, 1995 ed., 199.
91Hearing transcript, January 8, 2009, 13 (testimony of Thomas Earley, Sweetener UsersAssociation).

HISTORY OF U.S. TRADE POLICY SINCE 1934 83
national treatment rules to foreign direct investment from the UnitedStates and Canada in services such as telecommunications and finance.92
To prevent circumvention of existing tariffs by other countries, the U.S.automobile and textile industries secured rules of origin requirements93
for their products.94 The rules of origin requirements for automobiles, forexample, required that 62.5 percent of a car’s production cost (calculatedaccording to specific formulas set out in the agreement) be produced withinthe free trade area to qualify for tariff-free entry into the United States.95
Within the United States, environmental organizations and organizedlabor strongly opposed NAFTA.96 Provisions safeguarding the interests oflabor and the environment were not incorporated into the main agreement.To address the opposition, the Clinton administration negotiated sideagreements on the environment, workers’ rights, and safeguards againstimport surges that were ultimately approved by Congress.
The Uruguay Round
Simultaneous with negotiations of the U.S.-Canada FTA and NAFTA,the United States also participated in trade negotiations in the UruguayRound (1986-93).97 The Uruguay Round agreement was concluded in late1993 and entered into force in January 1995. It is generally considered tohave been a highly beneficial agreement for the United States. This wasparticularly true for the agreements on services and intellectual propertyrights protection. U.S. negotiators, as well as observers, felt that it was
92Barton et al., The Evolution of the Trade Regime, 2006, 165.93Rules of origin requirements pertain to where a product is made and are important for
trade statistics and trade agreements. Because raw materials and parts may originate frommany points, determination of origin is not straightforward. Rules of origin requirementsin a free trade agreement may grant preferential tariff treatment to goods made wholly orin part in the beneficiary country or group of countries.
94Destler, American Trade Politics, 1995, 219.95Ibid., 227.96In addition to these well defined groups, there was a more general trepidation about
NAFTA; large segments of the middle class were worried by NAFTA’s potential effect onjobs. Destler, American Trade Politics, 1995, 223. This was manifested most strongly byRoss Perot’s surprising third-party candidacy in the 1992 presidential elections.
97The Omnibus Trade and Competitiveness Act of 1988 provided the Presidentwith the authority to enter into trade agreements before June 1, 1993, subject toimplementation under special “fast track” Congressional approval procedures. U.S. Houseof Representatives, Committee on Ways and Means, Overview and Compilation of U.S.Trade Statutes, 1993 ed., 162.

84 CHAPTER 3 U.S. TRADE POLICY SINCE 1934
in the interest of the United States to open foreign markets for servicesas it had a comparative advantage in several services sectors98 and hadsignificant growth potential in the export of services trade, particularly inthe areas that employed highly skilled labor.99 The lack of intellectualproperty rights abroad prior to the Uruguay Round was estimated to bevery costly to the United States; by one estimate, U.S. firms lost revenuesof $23.8 billion due to inadequate intellectual property rights protection.100
In addition to another round of tariff cuts, which reduced industrializedcountry tariffs by 38 percent,101 the Uruguay Round extended prior gainsin certain nontariff measures and expanded the range of topics negotiatedin a multilateral setting, most significantly trade in services and certainpolitically sensitive domestic regulatory issues. The Uruguay Roundalso established more robust multilateral administrative structures fornegotiations and trade policy review, and its dispute resolution systemprovided a stronger enforcement mechanism.
The Uruguay Round’s most obvious structural achievement was theestablishment of the WTO (in the Marrakech Agreement of 1994), aformal international organization that took the place of the ad hoc GATTadministration that had been set up after it had become clear that the ITOagreement would not be implemented.102
The second accomplishment of the Uruguay Round was the consolida-tion of the gains from prior rounds of negotiation.103 New tariff bindingswere added. Most of the voluntary codes of the Tokyo Round (ruleson import licensing; antidumping duties, subsidies, and countervailingmeasures; customs valuation methods; and standards on health, safety, and
98Hoekman and Kostecki, The Political Economy of the World Trading System, 237.99Congressional Budget Office, The GATT Negotiations and U.S. Trade Policy, 1987,
17.100USITC, Foreign Protection of Intellectual Property Rights and the Effect on U.S.
Industry and Trade, 1988, 4-3.101Jackson, The World Trading System, 1997, 74.102Countries were no longer able to “opt out” of agreements with which they did not
agree, as was the case during the Tokyo Round negotiations for nontariff measures. Onthe other hand, the possibility that fewer agreements will be reached is greater because anagreement requires a commitment by each member. Hoekman and Kostecki, The PoliticalEconomy of the World Trading System, 2001, 1.
103A detailed explanation of the WTO and the GATT in the context of the WTO is foundin Hoekman and Kostecki, The Political Economy of the World Trading System, 2001, 9–73.The following discussion summarizes some of their main points.
HISTORY OF U.S. TRADE POLICY SINCE 1934 85
consumer protection, among others) were amended, incorporated into themain body of the agreement, and made mandatory.104
The Uruguay Round also provided for the phase out, over a 10-yearperiod, of quotas on textiles and apparel, nearly half a century after aframework for their imposition was first implemented. The ATC, whichreplaced the MFA, phased out the textile quota system in four stages: by16 percent (by volume of imports) upon entry into force of the agreement,by an additional 17 percent within the first three years, a further 18 percentwithin seven years, and the rest by 2005. The agreement did not, however,mandate lowering tariffs on textiles and apparel.105
Finally, the scope of negotiations was expanded. This included majorstrides forward on trade liberalization with the General Agreement onTrade in Services (GATS), the Agreement on Trade Related Aspects ofIntellectual Property Rights (TRIPS), Trade Related Investment Measures(TRIMs), and the Agreement on Agriculture. Each of these broke newtopical ground at the multilateral level and increased the reach of tradenegotiations beyond the borders of countries and into their domesticgovernance structure.
The GATS addressed, for the first time in a multilateral setting, theopening of trade in services. Services present a unique set of challengesto trade negotiators, as their nonphysical and highly heterogeneous naturemakes them more difficult than goods to count and assess for tariffs.106
The obligations, subscribed to by all members, extended MFN princi-ples to services, with temporary exceptions made for preexisting freetrade agreements. In addition, member countries subscribed to sector-specific commitments, separated into national treatment and market accesscommitments. National treatment requires countries to treat foreign anddomestic firms equally under the law. Market access requires countries topermit both domestic and foreign firms to compete in a market. Restricted
104A few of the Tokyo Round codes were appended as plurilateral agreements; that is,they remained binding only on those that had previously committed to them. These werein the areas of government procurement, civil aircraft, select bovine products, and milkproducts. The agreements on the latter two were terminated in 1997 and are now covered bythe Sanitary and Phytosanitary agreement. WTO, “Sanitary and Phytosanitary Measures,”undated (accessed December 9, 2008).
105The sector reportedly continues to face high U.S. import tariffs and complex rules oforigin requirements. USITC, Hearing transcript, January 8, 2009, 7 (testimony of BrendaJacobs, Esquire, Sidley Austin LLP on behalf of U.S. Association of Importers of Textilesand Apparel).
106Hoekman, “Liberalizing Trade in Services,” 2006, 10–12.
86 CHAPTER 3 U.S. TRADE POLICY SINCE 1934
market access tends to be a particular problem in services, as it includessectors such as telecommunications and transportation that are frequentlymonopolies or restricted to a few firms.
The TRIPS Agreement dealt with intellectual property rights, the firsttime the international community sought to require governments to enforceinternational laws regarding intellectual property.107 The agreement in-cluded protection of copyrights, trademarks, patents, geographic indicatorsand certain other trade secrets.
TRIMs extended to foreign direct investment the GATT principle ofnational treatment of goods and the GATT rules limiting the use of quanti-tative restrictions.108 Resistance to addressing investment measures meantthat the resulting agreement was limited to rules on foreign investment inthe manufacture of goods, rather than including broader commitments oninvestment in services.109
The Agreement on Agriculture addressed, among other issues, sub-sidies and quotas on agricultural goods. Developed countries committedto reduce export subsidies by 21 percent by volume and 36 percent byvalue by 2000, while developing countries committed to reductions of14 percent by volume and 24 percent by value by 2004. Developedcountries also agreed to expand market access by 36 percent by 2000,while developing countries committed to expand market access by 15percent by 2000. Nontariff measures, including quotas, were convertedinto equivalent tariffs, and the United States and other countries introducedtwo-tiered tariff rate quotas (TRQs) that allowed limited imports at lowtariff rates and unlimited imports at higher rates. The point where the hightariff is first applied is referred to as the quota point, and the TRQs areusually designed so that only minimal imports enter at the high rate.110
Domestically, the Uruguay Round agreement proved less controversialfor the United States than NAFTA for several reasons. First, although thestructure was different, the legal implications—in particular, sovereigntyover trade issues—were not materially more onerous than the prior GATTcommitments.111 Second, much of the new agreement, such as the
107Ibid., 126.108Hoekman and Kostecki, The Political Economy of the World Trading System, 2001,
202.109Ibid., 202–03; also found in the WTO TRIMs Agreement.110WTO, “Agriculture: Fairer Markets for Farmers,” undated (accessed January 2, 2009).111Hoekman and Kostecki, The Political Economy of the World Trading System, 2001,
49.

HISTORY OF U.S. TRADE POLICY SINCE 1934 87
intellectual property and services agreements, was perceived to benefit theUnited States. The arrangement on intellectual property in particular wasinstrumental in obtaining U.S. support for the Uruguay Round, and in-dustry groups reliant on intellectual property protection—pharmaceuticals,software, semiconductors, and entertainment, in particular—were verysupportive.112 Labor and environmental groups remained opposed, butthis time free-trade supporters were more numerous and vocal than withNAFTA. Third, the round created a binding dispute settlement system,which was especially important to the United States. The Uruguay RoundAgreements Act passed the U.S. Congress and entered into force one yearafter NAFTA, in January 1995.
Fast track authority lapsed in 1993; the ensuing decade saw only theU.S.-Jordan FTA signed into law in 2001. Fast track authority was renewedunder the name trade promotion authority in the Trade Act of 2002, whenlanguage about the importance of labor and environmental standards wasplaced in the act as a result of the debate over these issues that aroseduring the approval of NAFTA.113 Under trade promotion authority of theTrade Act of 2002, President Bush signed into law eight bilateral tradeagreements and a regional free trade agreement with Central Americancountries (table 3.2). Trade promotion authority expired in 2007 and hasnot been reauthorized at the time of this report.114
The Doha Development Agenda
The current round of multilateral negotiations, the Doha DevelopmentAgenda (DDA or “Doha Round”) remains unfinished. The DDA was initi-ated at the Fourth Ministerial Conference of the World Trade Organizationin 2001. The declared development objectives, as suggested by its title,and the prominent role taken by developing countries are the new featuresof this round of negotiations.115 Many developing countries believe thatthe Uruguay Round disproportionately benefited the developed world.116
Developing countries believed that the issue of subsidized agriculturalcommodities in developed countries, which compete with exports from
112Chorev, Remaking U.S. Trade Policy, 2007, 159.113Ibid., 185.114See table F.1 for details on the successfully concluded agreements and their economic
effects.115Hoekman, “Strengthening the Global Trade Architecture,” 2002, 13.116Mehta, “The Doha Development Agenda,” 2003, 11.
88 CHAPTER 3 U.S. TRADE POLICY SINCE 1934
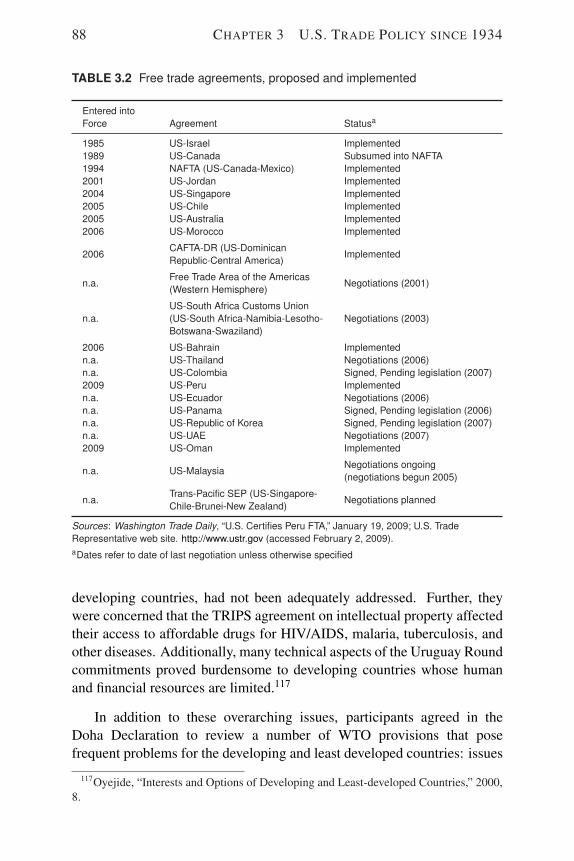
TABLE 3.2 Free trade agreements, proposed and implemented
Entered intoForce Agreement Statusa
1985 US-Israel Implemented1989 US-Canada Subsumed into NAFTA1994 NAFTA (US-Canada-Mexico) Implemented2001 US-Jordan Implemented2004 US-Singapore Implemented2005 US-Chile Implemented2005 US-Australia Implemented2006 US-Morocco Implemented
2006CAFTA-DR (US-Dominican
ImplementedRepublic-Central America)
n.a.Free Trade Area of the Americas
Negotiations (2001)(Western Hemisphere)
n.a.US-South Africa Customs Union
Negotiations (2003)(US-South Africa-Namibia-Lesotho-Botswana-Swaziland)
2006 US-Bahrain Implementedn.a. US-Thailand Negotiations (2006)n.a. US-Colombia Signed, Pending legislation (2007)2009 US-Peru Implementedn.a. US-Ecuador Negotiations (2006)n.a. US-Panama Signed, Pending legislation (2006)n.a. US-Republic of Korea Signed, Pending legislation (2007)n.a. US-UAE Negotiations (2007)2009 US-Oman Implemented
n.a. US-MalaysiaNegotiations ongoing(negotiations begun 2005)
n.a.Trans-Pacific SEP (US-Singapore-
Negotiations plannedChile-Brunei-New Zealand)
Sources: Washington Trade Daily, “U.S. Certifies Peru FTA,” January 19, 2009; U.S. TradeRepresentative web site. http://www.ustr.gov (accessed February 2, 2009).aDates refer to date of last negotiation unless otherwise specified
developing countries, had not been adequately addressed. Further, theywere concerned that the TRIPS agreement on intellectual property affectedtheir access to affordable drugs for HIV/AIDS, malaria, tuberculosis, andother diseases. Additionally, many technical aspects of the Uruguay Roundcommitments proved burdensome to developing countries whose humanand financial resources are limited.117
In addition to these overarching issues, participants agreed in theDoha Declaration to review a number of WTO provisions that posefrequent problems for the developing and least developed countries: issues
117Oyejide, “Interests and Options of Developing and Least-developed Countries,” 2000,8.

THE ECONOMIC EFFECTS OF TRADE LIBERALIZATION 89
concerning trade, debt, and finance; trade and the transfer of technology;technical cooperation and capacity building; and WTO provisions concern-ing special and differential treatment.
Negotiations in the DDA reached an impasse in July 2008; theproximate cause was a stalemate over special safeguards on agriculturalimports between a group including India, China, and other developingcountries and another group composed primarily of developed countries.118
The proposal on offer included a provision for a tariff increase of up to 15percent for an import “surge” (defined as a 40 percent increase in importsover the average of the previous three years). The tariff was to be applicableto only 2.5 percent of tariff lines. Developing countries countered with anoffer of a 30 percent tariff increase on up to 7 percent of tariff lines.119 Theissue could not be resolved, and negotiations were eventually suspended.
The Economic Effects of Trade Liberalization
This section summarizes the existing economic literature on trade withan emphasis on the quantitative assessments of trade policy over time.This literature suggests that the benefits of trade liberalization have beensignificant, although the size of the gains and the methods of analysis havechanged over time.
In the early years, both trade negotiations and the economic analysisof trade policies focused heavily on tariffs, with minimal emphasis onnontariff barriers. There is general agreement in the economic literaturethat the United States benefited as tariff barriers were lowered. Gains fromtrade were greater than the costs even after taking into consideration thelosses experienced by import-competing segments of the economy. TheTokyo Round (1973–79) was the first round to produce agreements onnontariff measures. Economic analysis during this period took on the newtask of attempting to compute the effects of these less easily quantifiedreductions in nontariff measures. To the extent that researchers have beenable to quantify these effects, their results suggest a significant increase inwelfare, compared with tariff-only liberalization.
The economic literature on trade has evolved at least as much as thesubject it examines. At the beginning of the period under examination, the
118Baldwin, “Resolving the Conflict,” September 25, 2008.119The proposal details are cited in Baldwin, “Resolving the Conflict,” 2008.
90 CHAPTER 3 U.S. TRADE POLICY SINCE 1934
economic literature was confined to highly abstract representations of theeconomy and had put forth only a limited number of theories to explainpatterns of international trade. The lack of detail meant that quantitativeassessments of trade policy were at best suggestive; indeed there were fewattempts at quantitative analysis. In contrast, models in the current era canbe enormous, complex, and require more computational power than waspreviously available.
This evolution in the literature has been driven by a number oftrends. First, the economic literature pertaining to trade was relativelyunderdeveloped in 1934; formal mathematical analysis in the field wasnot the norm. Second, even if theories were articulated in a mathematicalframework, models remained simple and had to be solved analyticallyrather than computationally, which limited the number of details that couldbe addressed. Over time computing power grew, and economists tookadvantage by constructing more computationally intensive models withmany sectors and goods. The economic literature also responded to newobservations in the trade data. For example, early theory suggested thata country would export those goods that it produces most efficiently andimport those that it produces least efficiently. However, trade data showedthat countries import and export the same types of goods. For instance, theUnited States both imports and exports automobiles. New hypotheses wereposited to explain this behavior. Finally, the literature evolved to addressissues of trade policy. For example, the Tokyo Round (1973–79) was thefirst round to include nontariff measures, and contemporary economiststook on the task of estimating the effects of policy changes in nontariffbarriers.
International trade is a dynamic field of research, and recently therehas been a considerable increase in theoretical work. Theories are stillbeing tested and modified, and researchers are grappling with technicalissues that arise when applying theories to obtain quantitative results.For example, the theory of product variety proposes that individuals havepreferences for a large number of goods and that the improved access tovariety made possible by increased trade improves welfare. Applying theseideas requires determining (or assuming) a great deal about individuals’preferences for a large number of goods (i.e. elasticities of substitutionacross goods).120 Yet, controversy and uncertainty about the details ofthe approach remain. Another difficulty faced by researchers, one that is
120This has been the subject of some recent research. See, for example, Broda andWeinstein, “Globalization and the Gains from Variety,” 2006.

THE ECONOMIC EFFECTS OF TRADE LIBERALIZATION 91
particularly problematic for the analysis of services, is the lack of adequatedata.121 The following section is divided into two parts. The first brieflysummarizes the types of assumptions and explanations currently prevalentin economic analysis. The second part proceeds chronologically throughthe empirical literature and summarizes the findings.
Approaches in the Literature
Evaluating trade policies requires that assumptions be made regardingthe channels through which these policies affect the economy, as well asassumptions regarding the underlying economy itself. The assumptionsselected can have significant consequences on the quantitative assessmentof trade policy. For example, current estimates of the U.S. welfare effectsof trade liberalization vary widely, from a fraction of a percent of GDP toas much as 13 percent, depending on the treatment of services, nontariffmeasures and other modeling specifications.
Table 3.3 provides some examples of these assumptions and ap-proaches and their effects on welfare outcomes. A note of caution mustbe sounded regarding this table in that it should be seen as a rule of thumbonly. The effects of the assumptions and approaches on welfare gains doindeed reflect the results of the majority of empirical studies; however,not all studies fall in line with these generalizations. Until recently,applied trade policy analysis was concentrated on elements of the left-hand column of table 3.3, which led to relatively modest estimates of gainsfrom liberalization. As new models gain acceptance, assumptions fromthe right-hand column are increasingly being used. These tend to result inrelatively larger gains from trade liberalization although newer models andtechniques do not universally show greater effects from trade liberalization.More practically but equally important, estimates change as computingpower and data availability improve. As a result of these changing factors,comparing model results across time periods can be difficult unless thosefactors are controlled for.
Partial versus full liberalization. Full liberalization, the elimination ofall trade barriers, is rarely if ever achieved in practice, but it is sometimesused in quantitative analysis in order to compare policies or countries’
121See, for example, Francois, Hoekman, and Woerz, “Does Gravity Apply toIntangibles?” 2007.

92 CHAPTER 3 U.S. TRADE POLICY SINCE 1934
TABLE 3.3 A sample of modeling assumptions and approaches
Effect: Fewer welfare gains More welfare gains
Partial liberalization −→ Full liberalizationStatic −→ Dynamic
Assumptions and Goods only −→ Goods and servicesapproaches: Tariffs only −→ Tariffs and nontariff measures
Low product variety −→ High product varietyConstant returns to scale −→ Increasing returns to scale
Source: Formulated by Commission staff.
Note: The labels “fewer” and “more” welfare gains only denote the general tendency ofthese assumptions’ impact on welfare. Conceivably the reverse could occur; however,most trade literature is in line with the relationships articulated in this table.
responses to a particular policy. Partial liberalization is often used to modelthe effects of particular trade agreements or trade in a particular sector.
Static versus dynamic modeling. A large share of empirical workis static, rather than dynamic. As such, it estimates the effect oneconomic variables during a single period of time. Although some issuescan realistically be examined in a static framework, it assumes perhapsunrealistically that capital investments can be set up and disassembled in-stantaneously. Models for evaluating trade policy increasingly incorporatedynamic elements and are better able to handle issues related to capitalstock, investment, savings, and growth.
Goods only versus goods and services; tariffs only versus tariffs andnontariff measures. As mentioned in the introduction to this section, earlyliterature and early trade negotiations focused on goods and on tariffson these goods. As trade policy negotiations were broadened to includeservices and nontariff measures, these issues have been increasinglyincorporated into the economic analysis.
Product variety and returns to scale. These assumptions refer torelatively recent advances in trade theory, which are explained in box 3.2along with a description of several other channels of the effects of tradeliberalization. Over time the economic literature has developed diverseexplanations of the observed patterns of international trade and how, inturn, changes in trade affect the domestic economy.

THE ECONOMIC EFFECTS OF TRADE LIBERALIZATION 93
Survey of Economic Literature
Examining the literature chronologically, three major periods emerge:the pre-Tokyo Round literature, the early computational literature, andthe recent complex and computationally intensive literature. The first isprimarily based on small models applying the classic gains from trade(or comparative advantage) literature to the liberalization questions of thetime. With some exceptions, the literature tends to apply theory to con-temporaneous problems rather than examining issues retrospectively.122
The second era saw the development of large-scale computer models withdetailed modeling of country- and sector-specific attributes. The thirdwave of literature combines the computational approaches with increasinginnovation in the economic literature of the channels through which tradeliberalization affects economies. Further, it increasingly incorporatesliberalization of the services sector. Box 3.3 explains some key issuesrelated to tariff data upon which many studies are based.
There are two general approaches to applied economic policy anal-ysis. The first is simulation of proposed changes in trade policy (oftenusing computable general equilibrium models), while the other involveseconometrically estimating a set of variables from historical or currentdata to explain changes in trade. The approaches are not exclusive, asthe parameters of a simulation model may be estimated econometrically,or work that is primarily econometric could be based on a model that isused for simulations.
Early Literature
There are only a few quantitative assessments of the effects of tradebarriers before World War II. Indeed, quantitative assessments remainscarce until the Kennedy Round (1964–67) for the reasons outlined in theintroduction to this section. The findings of these quantitative studies varysubstantially and are only suggestive of the effects of trade liberalization.
Irwin quantitatively examined tariff liberalization and its welfare ef-fects from the Civil War through 1961, just prior to the Kennedy Round.123
122Even with an ambitious researcher applying current methods to prior periods, newermethods are frequently more data-intensive and require data that were not collected in prioreras.
123Irwin, “Trade Restrictiveness,” 2007.

94 CHAPTER 3 U.S. TRADE POLICY SINCE 1934
BOX 3.2 Channels of the effects of trade liberalization
The theoretical literature forms the underpinnings of applied work. It also showsthe number of channels through which trade (and by extension trade barriers)affects an economy, including gains from trade, demand for variety, and productivityimprovements.
The classical benefits from trade liberalization result from comparative advantage,first articulated by David Ricardo in the early 19th century. In a two-good, two-countrymodel, the idea that a country that can produce a good with fewer resources or ata lower cost than another country will gain from specializing in the export of thatcommodity is fairly intuitive. However, two countries can still both gain from tradeeven when one of the countries can produce both goods more efficiently than theother country, if one of the countries produces one of the goods more efficientlythan the other good. Ricardo’s explanation was based on differences in technology,which allow one country to produce a certain good more efficiently than the othercountry. Similar results can be obtained when two countries have different factorendowments (i.e., land, labor, and capital).a
Recent work has built upon this foundation. The newer work takes the fundamentalprinciple of Ricardo, the differences in technology across countries, and generalizesit to a multicountry model with a more general structure encompassing differences intechnology across countries.b
Krugman introduced a different line of research, which analyzed the trade benefitsthat are achieved through greater variety. He noted that an individual obtainsgreater enjoyment from consuming a variety of, say, different automobiles thanbeing confined to domestically produced varieties, even when the total quantity ofautomobiles purchased remains the same.c In this model, countries are assumedto produce different varieties of goods; therefore, even two countries with the sameendowments and technology will want to trade with each other, unlike in the earlier,classical benefits literature. This provides an explanation for the prevalence ofintra-industry trade, for example why the United States both imports and exportsfruit. Individuals in both countries benefit both from lower prices and from anincrease in the available varieties of products.d
Trade liberalization can also improve a country’s welfare by increasing firmproductivity. This can occur in a variety of ways. One such way is via technologicaldiffusion, the movement of technological know-how across borders in a way thatbenefits the importing country. This may occur directly via a transfer of researchand development from one country to another, as in Grossman and Helpman.e
Alternatively, as in Eaton and Kortum,f the technological know-how may beembodied in intermediate and capital goods that are imported from abroad and thenused to produce another good domestically.

THE ECONOMIC EFFECTS OF TRADE LIBERALIZATION 95
BOX 3.2 Channels of the effects of trade liberalization, continued
Broader-based productivity gains may result from trade liberalization. A set ofpapers, originating with Melitz,g deals with productivity in the face of competition.When a country has many firms, each with its own level of productivity, the papershypothesize that the least-productive ones will go out of business when the countryopens itself up to foreign competition. Domestic productivity, as an average of theremaining firms, rises as a result, although there will be some negative distributionaleffects for the firms that go out of business.
Another productivity improvement can be seen through increasing-returns-to-scalefirms (or firms that require very large markets to operate efficiently). Certainindustries (for example, aircraft manufacturing) have enormous start-up costs, andsuch industries require large markets to recoup their investment. Reducing tradebarriers allows such firms to access international markets and sell more products,thereby increasing the firms’ per-unit productivity. Although unusual, potentialnegative effects could occur, for example if such a firm overtakes a foreign market,drives out local firms, and then uses its monopoly power to raise prices and lowerproduction.
Another potential benefit of trade liberalization is the procompetitive effect. Whena firm within a country has monopoly power, it will choose to sell fewer goods atpremium prices. The result is a loss in welfare to the country as a whole, althoughthe monopoly itself gains. Opening up to trade will allow competition into the industryand force the domestic firm to behave in a more competitive manner, improving thecountry’s overall welfare.
—————aMore detailed explanations of this literature can be found in textbooks oninternational economics; for example, Caves, Frankel, and Jones, World Trade andPayments, 2002; and Krugman, “Ricardo’s Difficult Idea,” 1996 (accessed April 20,2009).bEaton and Kortum “Technology, Geography, and Trade,” 2002.cKrugman, “Increasing Returns,” 1979; Krugman, “Scale Economies,” 1980.dThis is obtained from the assumptions in the paper regarding increasing returns toscale and monopolistic competition.eGrossman and Helpman, “Technology and Trade,” 1995.fEaton and Kortum, “Trade in Capital Goods,” 2001.gMelitz, “The Impact of Trade,” 2003.
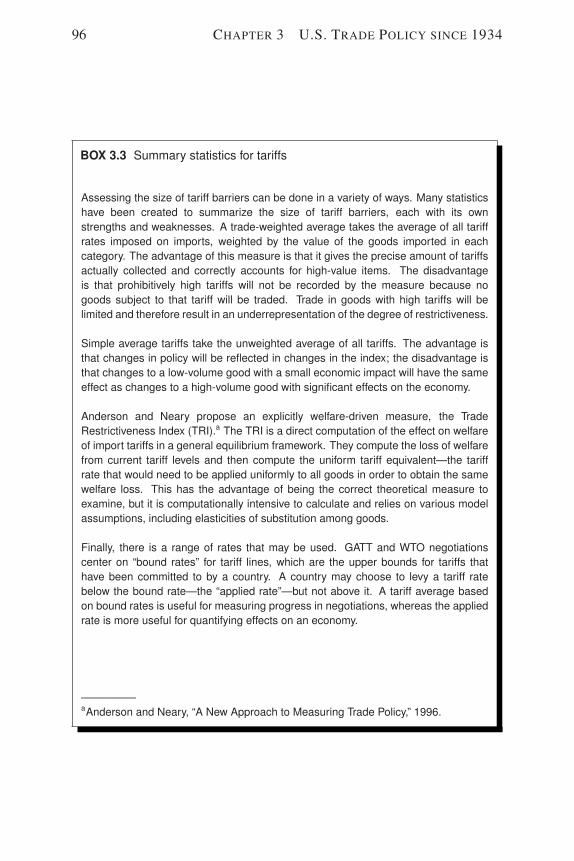
96 CHAPTER 3 U.S. TRADE POLICY SINCE 1934
BOX 3.3 Summary statistics for tariffs
Assessing the size of tariff barriers can be done in a variety of ways. Many statisticshave been created to summarize the size of tariff barriers, each with its ownstrengths and weaknesses. A trade-weighted average takes the average of all tariffrates imposed on imports, weighted by the value of the goods imported in eachcategory. The advantage of this measure is that it gives the precise amount of tariffsactually collected and correctly accounts for high-value items. The disadvantageis that prohibitively high tariffs will not be recorded by the measure because nogoods subject to that tariff will be traded. Trade in goods with high tariffs will belimited and therefore result in an underrepresentation of the degree of restrictiveness.
Simple average tariffs take the unweighted average of all tariffs. The advantage isthat changes in policy will be reflected in changes in the index; the disadvantage isthat changes to a low-volume good with a small economic impact will have the sameeffect as changes to a high-volume good with significant effects on the economy.
Anderson and Neary propose an explicitly welfare-driven measure, the TradeRestrictiveness Index (TRI).a The TRI is a direct computation of the effect on welfareof import tariffs in a general equilibrium framework. They compute the loss of welfarefrom current tariff levels and then compute the uniform tariff equivalent—the tariffrate that would need to be applied uniformly to all goods in order to obtain the samewelfare loss. This has the advantage of being the correct theoretical measure toexamine, but it is computationally intensive to calculate and relies on various modelassumptions, including elasticities of substitution among goods.
Finally, there is a range of rates that may be used. GATT and WTO negotiationscenter on “bound rates” for tariff lines, which are the upper bounds for tariffs thathave been committed to by a country. A country may choose to levy a tariff ratebelow the bound rate—the “applied rate”—but not above it. A tariff average basedon bound rates is useful for measuring progress in negotiations, whereas the appliedrate is more useful for quantifying effects on an economy.
—————aAnderson and Neary, “A New Approach to Measuring Trade Policy,” 1996.

THE ECONOMIC EFFECTS OF TRADE LIBERALIZATION 97
TABLE 3.4 Pre-Tokyo Round studies
Author (datepublished) Focus country
Estimatedeffects
(% of GNP) Remarks
Stern (1964) United States < 0.11Efficiency gains from the removal of allU.S. tariffs in 1960 (ignoring the termsof trade effects)
Balassa and Several indus-< 1.0 Gains from Kennedy Round tariff cuts
Kreinin (1967) trial countries
Magee (1972) United States 1.0Gains from removing all trade barriers(ignoring the terms of trade effects)
Source: Panagariya, “Alternative Approaches to Measuring the Cost of Protection,” table1, 2002, 5.
This paper computed the restrictiveness of existing tariffs and estimated theresulting effects on welfare for the entire time period. Irwin found that U.S.tariffs were equivalent to an across-the-board tariff of 32.2 percent in 1934.From this high rate, the index fell steadily over the years to 12.5 percentin 1961, a drop of nearly two-thirds. Irwin estimated that welfare lossesimposed by even the highest tariffs were modest; even in 1934, the losswas less than 1 percent (0.21) of GDP because the share of internationaltrade in the overall U.S. economy was low.124 This welfare loss decreasedto 0.04 percent of GDP in 1961. As noted, these are single-period staticeffects based on classical gains from trade.
Panagariya provided a summary of several other papers that estimatethe negative effects of trade barriers on GNP during this period (table3.4).125 The researchers modeled only a small number of goods andgenerally assumed a small open economy (that is, an economy whoseimports or exports are not large enough to affect prices). The welfare gainsderived from assumptions of differences in technology, initial endowments,or demand for goods.
Tokyo Round and Computational Models
In the 1970s, computational power became more available for inten-sive, detailed calculations. In this era, researchers began using large scaleCGE models (box 3.4). Beginning with the Tokyo Round (1973–79), the
124Ibid., 2.125Panagariya, “Alternative Approaches to Measuring the Cost of Protection,” 2002.
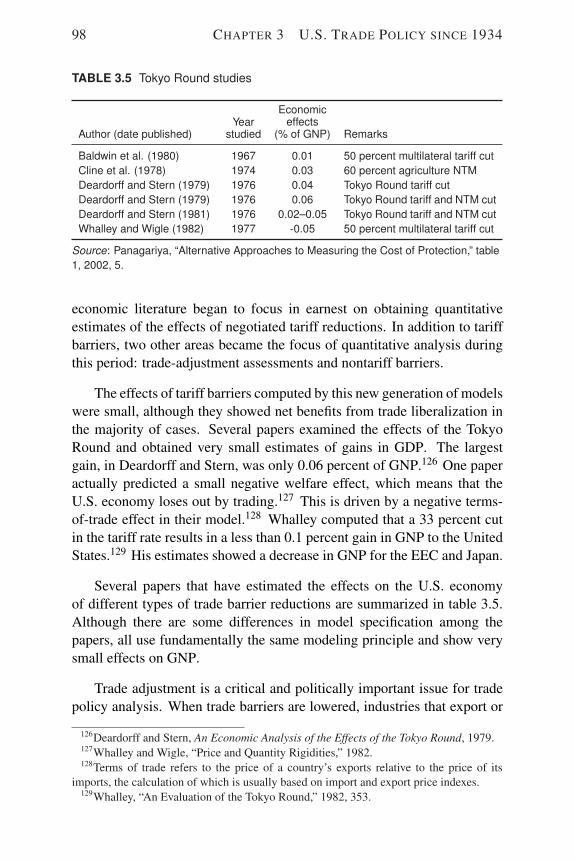
98 CHAPTER 3 U.S. TRADE POLICY SINCE 1934
TABLE 3.5 Tokyo Round studies
Author (date published)Year
studied
Economiceffects
(% of GNP) Remarks
Baldwin et al. (1980) 1967 0.01 50 percent multilateral tariff cutCline et al. (1978) 1974 0.03 60 percent agriculture NTMDeardorff and Stern (1979) 1976 0.04 Tokyo Round tariff cutDeardorff and Stern (1979) 1976 0.06 Tokyo Round tariff and NTM cutDeardorff and Stern (1981) 1976 0.02–0.05 Tokyo Round tariff and NTM cutWhalley and Wigle (1982) 1977 -0.05 50 percent multilateral tariff cut
Source: Panagariya, “Alternative Approaches to Measuring the Cost of Protection,” table1, 2002, 5.
economic literature began to focus in earnest on obtaining quantitativeestimates of the effects of negotiated tariff reductions. In addition to tariffbarriers, two other areas became the focus of quantitative analysis duringthis period: trade-adjustment assessments and nontariff barriers.
The effects of tariff barriers computed by this new generation of modelswere small, although they showed net benefits from trade liberalization inthe majority of cases. Several papers examined the effects of the TokyoRound and obtained very small estimates of gains in GDP. The largestgain, in Deardorff and Stern, was only 0.06 percent of GNP.126 One paperactually predicted a small negative welfare effect, which means that theU.S. economy loses out by trading.127 This is driven by a negative terms-of-trade effect in their model.128 Whalley computed that a 33 percent cutin the tariff rate results in a less than 0.1 percent gain in GNP to the UnitedStates.129 His estimates showed a decrease in GNP for the EEC and Japan.
Several papers that have estimated the effects on the U.S. economyof different types of trade barrier reductions are summarized in table 3.5.Although there are some differences in model specification among thepapers, all use fundamentally the same modeling principle and show verysmall effects on GNP.
Trade adjustment is a critical and politically important issue for tradepolicy analysis. When trade barriers are lowered, industries that export or
126Deardorff and Stern, An Economic Analysis of the Effects of the Tokyo Round, 1979.127Whalley and Wigle, “Price and Quantity Rigidities,” 1982.128Terms of trade refers to the price of a country’s exports relative to the price of its
imports, the calculation of which is usually based on import and export price indexes.129Whalley, “An Evaluation of the Tokyo Round,” 1982, 353.
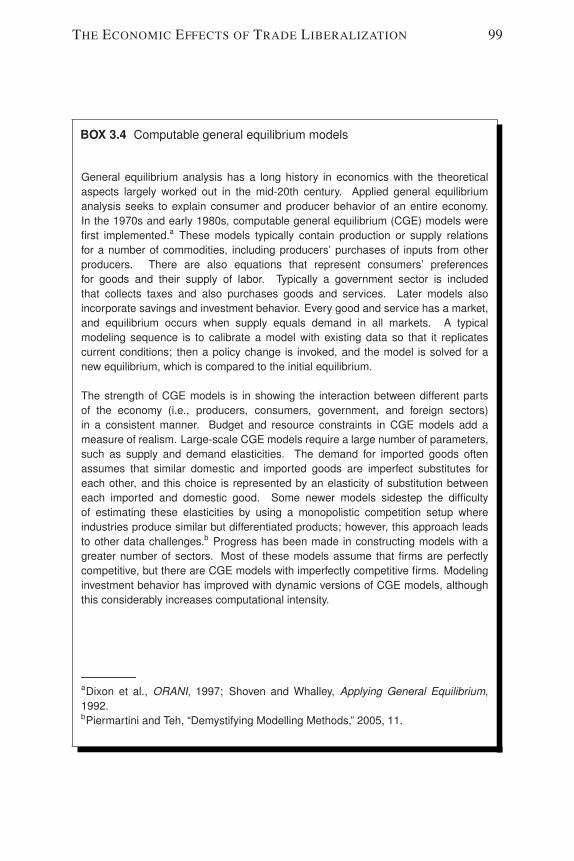
THE ECONOMIC EFFECTS OF TRADE LIBERALIZATION 99
BOX 3.4 Computable general equilibrium models
General equilibrium analysis has a long history in economics with the theoreticalaspects largely worked out in the mid-20th century. Applied general equilibriumanalysis seeks to explain consumer and producer behavior of an entire economy.In the 1970s and early 1980s, computable general equilibrium (CGE) models werefirst implemented.a These models typically contain production or supply relationsfor a number of commodities, including producers’ purchases of inputs from otherproducers. There are also equations that represent consumers’ preferencesfor goods and their supply of labor. Typically a government sector is includedthat collects taxes and also purchases goods and services. Later models alsoincorporate savings and investment behavior. Every good and service has a market,and equilibrium occurs when supply equals demand in all markets. A typicalmodeling sequence is to calibrate a model with existing data so that it replicatescurrent conditions; then a policy change is invoked, and the model is solved for anew equilibrium, which is compared to the initial equilibrium.
The strength of CGE models is in showing the interaction between different partsof the economy (i.e., producers, consumers, government, and foreign sectors)in a consistent manner. Budget and resource constraints in CGE models add ameasure of realism. Large-scale CGE models require a large number of parameters,such as supply and demand elasticities. The demand for imported goods oftenassumes that similar domestic and imported goods are imperfect substitutes foreach other, and this choice is represented by an elasticity of substitution betweeneach imported and domestic good. Some newer models sidestep the difficultyof estimating these elasticities by using a monopolistic competition setup whereindustries produce similar but differentiated products; however, this approach leadsto other data challenges.b Progress has been made in constructing models with agreater number of sectors. Most of these models assume that firms are perfectlycompetitive, but there are CGE models with imperfectly competitive firms. Modelinginvestment behavior has improved with dynamic versions of CGE models, althoughthis considerably increases computational intensity.
—————aDixon et al., ORANI, 1997; Shoven and Whalley, Applying General Equilibrium,1992.bPiermartini and Teh, “Demystifying Modelling Methods,” 2005, 11.

100 CHAPTER 3 U.S. TRADE POLICY SINCE 1934
that use imported inputs are likely to grow via increased export demand orreduced production costs. Industries that compete with imports will likelywitness a decline as foreign goods become relatively more competitive.The transition to this new equilibrium where some industries are largerand others smaller is not instantaneous, but the adjustment costs of movingto the new equilibrium are predicted to be smaller than the positive benefitsfrom freer trade to the country. There are effectively two types of negativeeffects. One is the immediate loss of jobs and wages; the second is the needto revamp factories, or make other changes to the capital structure, and toretrain workers. This is costly, as resources are required for retraining, andsome existing capital goods may be useless in a new industry. Becauseadjustment costs tend to be small relative to the benefits, income transfersare possible, so that everyone can be made better off through liberalization.
Several papers have computed these adjustment costs for the TokyoRound. Baldwin, Mutti, and Richardson calculated that 50 percentmultilateral cuts in tariffs would lead to labor adjustment costs of $3million (1967 dollars) and capital adjustment costs of $2.3 million versusan approximate consumer surplus gain of $610 million.130 Despitethe overall benefit, difficulties occur because these costs tend to beconcentrated either geographically or within an industry; five negativelyaffected industries were projected to lose more than 10 percent of theirworkforce.131 Baldwin reviewed several other contemporary studies ofadjustment costs.132 He cited Mutti’s 1977 estimate that there is roughly$1.30 in benefits for every $1 in adjustment costs. Other values are muchhigher: a 28-to-1 ratio from Baldwin and an 8-to-1 ratio from Cline.
Reforms of the Tokyo Round were also estimated to have a netpositive effect on employment. Deardorff and Stern calculated that theUnited States would gain approximately 15,000 jobs, or a 0.02 percent netincrease in the labor force as a result of Tokyo Round reforms.133 Thisfigure includes sectors with net job losses as well as sectors with net jobgains.134 Industrialized nations as a whole were projected to see a netgain of 134,000 jobs due to the Tokyo Round agreement. In making theseestimates, Deardorff and Stern included liberalization of a few nontariffbarriers, such as quotas and restrictions on government procurement.
130Baldwin, Mutti, and Richardson, “Welfare Effects on the United States,” 1980.131Ibid., 419.132Baldwin, “Trade Policies in Developed Countries,” 1984b, 593.133Deardorff and Stern, An Economic Analysis of the Effects of the Tokyo Round, 1979.134Ibid., V, table 1.

THE ECONOMIC EFFECTS OF TRADE LIBERALIZATION 101
TABLE 3.6 Imports affected by NTMs, 1966 and 1986
Share of total imports (%) Import value (billions of $)
Area 1966 1986 1966 1986
United States 36.4 45.0 9.4 103.1All countriesa 25.3 48.0 29.5 355.5
Source: Laird and Yeats (1990), table 6.a“All Countries” refers to the European Community, Finland, Japan, Norway, Switzerland,and the United States.
As discussed in the history section, the Tokyo Round was the first todeal substantively with nontariff issues. This was reflected in the focus ofsome researchers in estimating nontariff barriers. The notable result wasthat the effects of lowering these barriers often dwarfed the effects fromlowering tariff barriers.
Nontariff barriers, now increasingly called nontariff measures (NTMs),are much more difficult to quantify. As the first round to deal with NTMs,the Tokyo Round was uniquely difficult to assess. This difficulty wascompounded by vague wording and relatively weak commitments. As anexample of the difficulty, one NTM code of the Tokyo Round discussedthe importance of maintaining international standards in health and safety“whenever possible,” (Technical Barriers to Trade, Article 2) and containedother similarly vague language. Laird and Yeats were among the first toconstruct quantitative measures of NTMs.135 They constructed measuresof such barriers by examining the number of products (at the SITC four-digit level136) that have nontariff barriers attached to them. They found thatthe value of imports affected by NTMs (and their associated shares of totalimports) increased between 1966 and 1986 both for the United States andall countries (table 3.6). Their estimates are somewhat exaggerated relativeto the individual tariff lines (that is, at the SITC five-digit level); if anytariff line is restricted, then every line within that group is considered to be“affected.” Although their aggregation procedure overstates the effects ofNTMs, it remains clear that NTMs affected an increasing share of importsbetween 1966 and 1986.
135Laird and Yeats, “Trends in Nontariff Barriers of Developed Countries, 1966–1986,”1990.
136SITC refers to the Standard International Trade Classification, which is a commodityclassification system of the United Nations. It is hierarchical. For example, suppose that1111 is four-digit code; then any commodity defined by a five-digit code whose first fourdigits are 1111 is a subset of the aggregate commodity 1111.

102 CHAPTER 3 U.S. TRADE POLICY SINCE 1934
To compute the changes in welfare when evaluating the effects ofthe Tokyo Round, Whalley incorporated NTMs into a CGE model andcomputed the effects of their removal.137 He quantified a particular NTMby estimating a tariff equivalent of the distorting effect of the NTM, thatis, the tariff rate that would have a similar effect on the economy. Whalleyincorporated only those NTMs for which reasonably good estimates of thetariff equivalent could be made, although substantial subjectivity remained.For example, “buy domestic” restrictions on government procurement wereincorporated into the model as a 50 percent tariff on imports for the EECand Japan.138 Moreover, government procurement does not behave strictlylike a tariff; in certain circumstances—for example, if there is a suddenbout of inflation—the government may not be willing to pay as much forits supplies, which implies a smaller tariff equivalent.
Empirical studies of the Uruguay Round’s effects were largely focusedon the more readily quantifiable trade policies of tariff and quota reduction.Table 3.7, reproduced from Piermartini and Teh, summarizes several keystudies.
Recent Literature
There has been an explosion of research in recent years on the effectsof trade liberalization. Three areas of research have received increasinginterest. The first area is services, which are increasingly being traded. Thesecond area is NTMs, which have been given more attention as they havegrown in prominence during trade negotiations. In the current literature,the definition of NTMs is expanding, and more careful attention is paidto modeling the incidence and behavior of NTMs.139 The third areais the channels of trade benefits, where a number of theoretical papershave proposed new approaches to quantifying the benefits from trade.These papers tended to project larger benefits from trade liberalizationcompared with previous literature. According to many papers, the effectsof liberalizing NTMs eclipse those of liberalizing tariff measures. Similarlarge effects have been found from liberalization of the services industries,which were largely ignored in the foregoing literature. Empirical studies
137Whalley, “An Evaluation of the Tokyo Round Trade Agreement,” 1982.138Ibid., 350.139Nearly all services barriers fall into the category of nontariff barriers; however, as
services are a critical component of modern economies, it is frequently worth defining anddescribing them separately.

THE ECONOMIC EFFECTS OF TRADE LIBERALIZATION 103
TABLE 3.7 Uruguay Round studies
Author (datepublished) Model assumptions
Liberalizationassumptions
Increasein U.S.
GDP (%)
Brown, Deardorff,Fox, and Stern(1996)
Static; perfect competition inagriculture; monopolisticcompetition and increasingreturns to scale inmanufacturing
Manufacturing, agri-culture as scheduled;services barriersreduced by 25 percent
0.9
Francois,McDonald, andNordstrom (1996)
Dynamic; increasing returnsto scale and monopolisticcompetition
Manufacturing, agri-culture as scheduled;MFA quotas lifted
0.6
Goldin and van derMensbrugghe(1996)
Static; perfect competition;primary focus on agriculture
Manufacturing, agri-culture as scheduled
0.1
Hertel, Martin,Yanagishima, andDimaranan (1996)
Static; perfect competition,constant returns to scale
Manufacturing, agri-culture as scheduled;MFA quotas lifted
0.4
Harrison,Rutherford, andTarra (1995)
Static; perfect competition,constant returns to scale
Manufacturing, agri-culture as scheduled
0.4
Source: Piermartini and Teh, “Demystifying Modelling Methods,” table 2, 2005, 23–24.aThis paper differs from that of Hertel et al. (1996) principally in that it assumes a greaternumber of sectors and regions.
tend to focus on two distinct aspects. The first is an assessment of the sizeof trade barriers, and the second is the effect of a partial or total removal ofthe barriers.
Nontariff measures are not always directly observable in the waythat tariff barriers are. However, researchers have devoted considerableefforts to finding indirect ways of estimating these barriers. Ferrantino, insummarizing these methods, found that, broadly speaking, researchers lookat anomalies in either prices or quantities to determine the extent to whichtrade is impeded.140 Economic theory predicts that prices for a given good,adjusted for transportation costs, should be the same everywhere, providedthere are no impediments to trade,141 and that any difference in price shouldimply the presence of such impediments. Determining the trade barrier,
140Ferrantino, “Quantifying the Trade and Economic Effects,” 2006.141This is often referred to as the law of one price.

104 CHAPTER 3 U.S. TRADE POLICY SINCE 1934
however, is not as simple as looking at price differences across countriesbecause prices vary due to a number of nonpolicy reasons. Moreover, inthe case of a good that is produced in only a few countries, determiningthe world price (i.e., what the price of the good would be in an unfetteredmarket) is not a straightforward exercise.
More attention has been paid to modeling services since the UruguayRound, when it emerged as a dominant agenda item. Generally, servicesrequire special treatment and cannot be modeled simply as a different typeof good because of their complex interindustry linkages. Several papersattempt to quantify the effect of reducing barriers to trade in services.Robinson, Wang, and Martin attempted to quantify barriers in severalservices sectors while at the same time carefully laying out the difficultiesof the exercise.142 These authors found a 50 percent cut in services barriersleads to a slightly less than 1 percent increase in welfare.143 Brown,Deardorff, and Stern simulated a 33 percent reduction to barriers to tradein services and found a 1.45 percent positive effect on U.S. welfare.144
Both studies were based on CGE models with service barriers constructedsimilarly to tariff barriers.
Services liberalization may provide greater gains from liberalizationthan those generated by goods liberalization, particularly where tariffson goods have already reached low levels. Several papers suggest thatlowering barriers to trade in services can produce a welfare effect 8 to12 times greater than an equivalent decrease in goods barriers.145 Theresult from Robinson, Wang, and Martin was something of an anomaly:they estimate up to 124 times greater benefits for services liberalization,primarily because they estimated an unusually small effect from goodsliberalization.
To illustrate a potential best-case scenario, Bradford, Grieco, andHufbauer used a number of elements from the right hand column of table3.3 and arrived at several extremely large values for the benefits fromtrade liberalization.146 For example, they calculated that trade policyliberalization after World War II had increased U.S. GDP by between 7
142Robinson, Wang, and Martin, “Capturing the Implications of Services TradeLiberalization,” 2002.
143Ibid., 23.144Brown, Deardorff, and Stern, “Multilateral, Regional and Bilateral Trade Policy,”
2003.145Hoekman, “Liberalizing Trade in Services,” 2006, 24.146Bradford, Grieco, and Hufbauer, “The Payoff to America from Globalisation,” July
2006.

THE ECONOMIC EFFECTS OF TRADE LIBERALIZATION 105
and 13 percent. Also, they found that the removal of all remaining traderestrictions will raise U.S. GDP by an additional 4 to 12 percent annually.This calculation provides a useful illustration of potential gains, althoughcaution is in order as economists have not yet completely delineatedeach individual channels’ contribution to the domestic economy, andthere are likely overlapping effects that must be dealt with carefully. Itmay, however, establish an upper bound on the economic effects of tradeliberalization.
There is also a considerable body of econometric work that useshistorical data to determine the effect of a past policy decision on aneconomy. Many of these studies focused on NAFTA, as well as theU.S.-Canada Free Trade Agreement. The consensus is that trade amongpartners increased after signing NAFTA, although this effect was generallymore pronounced between the United States and Mexico. However,the research was divided between those that estimate a small level oftrade diversion and those that estimate significant trade diversion. Thepotential for trade diversion is a major drawback of free trade agreements(FTAs). For example, suppose that the United States has historicallyimported a good from Malaysia when the tariffs imposed on Malaysianand Mexican goods were the same (presumably because Malaysia is themost efficient producer). NAFTA, by reducing Mexican tariffs, createsan incentive to purchase Mexican goods, even if they are produced ina less efficient manner. As a result, even if trade between two partnersincreases subsequent to a trade agreement, some of this increase couldsimply be replacing trade with countries outside of the free trade area.Romalis found evidence on the trade diversion side of the debate, arguingthat despite significant increases in trade among NAFTA signatories, alarge portion of this was made up of trade diversion, implying only smallnet gains from NAFTA.147 On the other hand, Clausing estimated only asmall trade diversion effect, with far more significant net welfare effects.148
Aside from these agreements, a series of bilateral agreements have beenstruck since 2002. These agreements, while generally having economicsignificance for the partner country and political significance for boththe United States and the partner country, have small effects on U.S.welfare.149
147Romalis, “NAFTA’s and CUSFTA’s Impact on International Trade,” 2005.148Clausing, “Trade Creation and Trade Diversion,” 2001. See USITC, The Impact of
Trade Agreements, 2003, 93–100, for a detailed summary of the literature addressing thisquestion.
149See table F.1 for a summary of these agreements.

106 CHAPTER 3 U.S. TRADE POLICY SINCE 1934
Negotiations for the Doha Round, assuming that they continue, havebeen estimated to provide little in the way of specific benefits to membercountries. Two papers provided analysis of the economic effects ofproposed tariff rate changes. Anderson and Martin examined the potentialeffects on agriculture,150 while Gootiiz and Mattoo examined services, andboth papers come to similar results.151 Currently, many countries have setmany of their tariffs below the bound rates (rates that define the upperbound on tariffs that a country can levy) agreed upon in the UruguayRound. The bound rates proposed in the DDA are substantially lower thanthose in the Uruguay Round, but are mostly still well above the currentapplied rates. As Gootiiz and Mattoo point out, the DDA therefore doesnot increase liberalization; rather it formalizes the current status, which ata minimum prevents future increases in tariffs.
Decreux and Fontagne used a CGE model to measure the potentialeffects of the DDA. Given that no agreements have been reached, theauthors focused on a large number of potential scenarios, including tariffreductions on agriculture, nonagricultural market access, and services.Applied tariff rates were used, with assumptions made regarding the effectof lowering the bound rates. As with the literature for the Uruguay Round,these authors also found that cuts in services barriers have a much largereffect on welfare than do cuts in goods barriers; for example, servicesbarriers may only need to be cut by a mere 25 percent to provide thesame welfare gains as a 70 percent cut in goods barriers.152 The models(summarized in table 3.8) provide additional estimates of the potentialeffects of the DDA. Trade facilitation is modeled as a reduction in tradecosts of between 1 to 3 percent of total world trade.153 The main differencebetween the results obtained by Brown, Deardorff, and Stern and thosefound by Francois, Hoekman, and Woerz is in the effects of servicesbarriers, where the former obtain far higher gains from liberalization witha more modest liberalization assumption (33 percent for Brown, Deardorff,and Stern, versus 50 percent for Francois, Hoekman, and Woerz).
150Anderson and Martin, “Agricultural Trade Reform,” 2005.151Gootiiz and Mattoo, “Services in Doha,” 2008.152Decreux and Fontagne, “A Quantitative Assessment of the Outcome of the Doha
Development Agenda,” 2006, 6.153Piermartini and Teh, “Demystifying Modelling Methods,” 2005, 35.
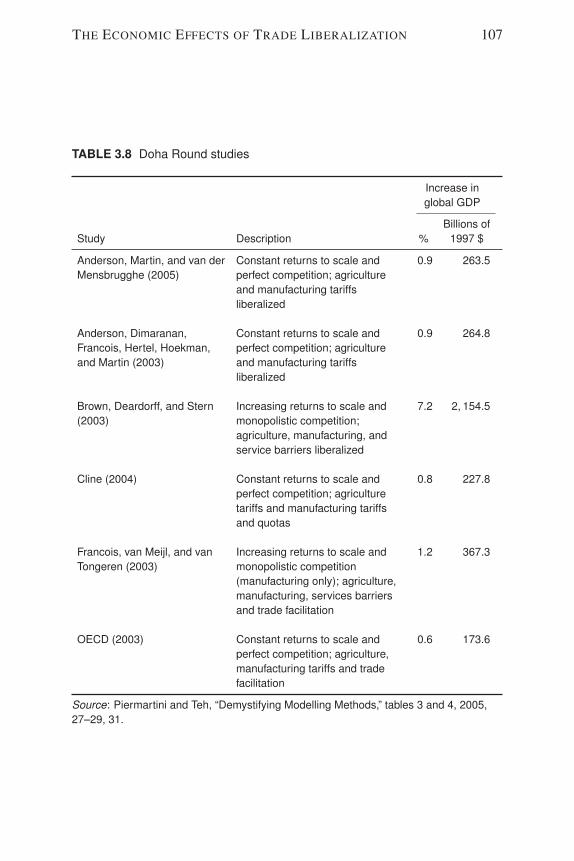
THE ECONOMIC EFFECTS OF TRADE LIBERALIZATION 107
TABLE 3.8 Doha Round studies
Increase inglobal GDP
Billions ofStudy Description % 1997 $
Anderson, Martin, and van derMensbrugghe (2005)
Constant returns to scale andperfect competition; agricultureand manufacturing tariffsliberalized
0.9 263.5
Anderson, Dimaranan,Francois, Hertel, Hoekman,and Martin (2003)
Constant returns to scale andperfect competition; agricultureand manufacturing tariffsliberalized
0.9 264.8
Brown, Deardorff, and Stern(2003)
Increasing returns to scale andmonopolistic competition;agriculture, manufacturing, andservice barriers liberalized
7.2 2, 154.5
Cline (2004) Constant returns to scale andperfect competition; agriculturetariffs and manufacturing tariffsand quotas
0.8 227.8
Francois, van Meijl, and vanTongeren (2003)
Increasing returns to scale andmonopolistic competition(manufacturing only); agriculture,manufacturing, services barriersand trade facilitation
1.2 367.3
OECD (2003) Constant returns to scale andperfect competition; agriculture,manufacturing tariffs and tradefacilitation
0.6 173.6
Source: Piermartini and Teh, “Demystifying Modelling Methods,” tables 3 and 4, 2005,27–29, 31.

108 CHAPTER 3 U.S. TRADE POLICY SINCE 1934
Conclusion and Timeline
An enormous amount of constructive work has been done to establishtrade liberalization as a common international goal and to constructthe necessary regulations and institutions to support that goal. Asidefrom the tangible and quantifiable reductions in barriers to trade and theestablishment of the World Trade Organization, the liberalization processhas resulted in a legacy of conventions and procedures intended to reducethe possibility of reversals of trade liberalization commitments. Therehave, of course, been obstacles along the way. These include domesticeconomic and political struggles within negotiating countries that spill overinto international trade negotiations and conflicts between developed anddeveloping nations regarding the role of international trade in development.The economic literature has extensively evaluated the progress of tradeliberalization. The consensus of this literature is that the United States hasbenefited substantially from past tariff liberalization. Moreover, significantfuture gains are expected as liberalization of services and other nontariffmeasures are negotiated.
Currently trade liberalization faces three potential obstacles. TheDoha Development Agenda faces an uncertain future. These talks havebeen ongoing since 2001 and may still be completed, but it is farfrom certain when, or if, this will occur. The President’s authority topresent agreement-implementing legislation to Congress for a simple up-or-down vote—trade promotion authority—has lapsed, and it is unclearwhen this will be reinstated by Congress. Finally, the global financialcrisis has raised the possibility of an increase in protectionist sentiment.There are a large number of institutional mechanisms in place thatwill make a retreat to the levels of protection seen during the GreatDepression unlikely; nevertheless, the current economic situation mayhave a substantial influence on the future direction of trade policy.
Important legislation, policy changes, and events of the past 75 yearsof U.S. trade policy are summarized in a timeline below.

CONCLUSION AND TIMELINE 109
Timeline of Important U.S. Legislation, Policy Changes andRelated Events
June 17, 1930 The U.S. Tariff Act of 1930 (Smoot-Hawley Tariff, Pub. L. No.71-361) is enacted.
June 12, 1934 The U.S. Act to Amend the Tariff Act of 1930 (ReciprocalTrade Agreements Act, Pub. L. No. 73-316) is enacted.
Aug. 22, 1947 The United Nations Economic and Social Council approves theDraft Charter for the International Trade Organization (ITO) ofthe United Nations in Geneva, Switzerland.
Oct. 30, 1947 Participating governments sign the General Agreement onTariffs and Trade (GATT), which consists of broad tradeprovisions to govern particular concessions made during theGeneva Round of multilateral tariff negotiations.
Jan. 1, 1948 The GATT enters into force.
Mar. 24, 1948 Participants at the United Nations Conference on Trade andEmployment in Havana, Cuba sign the draft charter to create theITO.
Dec. 8, 1950 After submitting the Draft Charter for the ITO to the U.S.Congress the previous year, President Truman withdraws it fromcongressional consideration and does not resubmit it.
June 16, 1951 The Trade Agreements Extension Act of 1951 (Pub. L. No.82-50) is enacted, establishing a statutory “escape clause”procedure.
Sept. 10, 1955 Japan accedes to the GATT.
Nov. 1, 1955 Japan begins to place voluntary export restraints on cottontextiles, plywood, and other goods to the United States to avoidpossible restrictive import measures to protect U.S. domesticmarkets.
Jan. 1, 1958 The Treaty Establishing the European Economic Community(“Treaty of Rome”) enters into force.
Aug. 20, 1958 The U.S. Trade Agreements Extension Act of 1958 (Pub. L. No.85-686) is enacted, establishing procedures that limit thepresident’s authority to reduce tariff rates when negotiating aforeign trade agreement.
Sept. 1, 1960 The GATT Dillon Round of multilateral trade negotiationsbegins.

110 CHAPTER 3 U.S. TRADE POLICY SINCE 1934
May 2, 1961 President Kennedy announces a program to help the U.S. textileindustry that was hurt by increased imports.
July 21, 1961 The Short-Term Arrangement on Cotton Textiles is negotiatedand established under the GATT.
July 1, 1962 The European Economic Community’s (EEC) CommonAgricultural Policy enters into force.
Oct. 1, 1962 The Long-Term Arrangement on Cotton Textiles is negotiatedand established under the GATT.
Oct. 11, 1962 The U.S. Trade Expansion Act of 1962 (Pub. L. No. 87-794) isenacted, establishing the Office of the Special TradeRepresentative and the Trade Adjustment Assistance Program.
Jan. 7, 1964 The United States suspends concessions on goods importedfrom the EEC (e.g., light trucks) in response to theimplementation of the EEC Common Agricultural Policy thatsharply raises import duties on U.S. exports of poultry to theEEC (U.S.-EEC “chicken war”).
May 4, 1964 The GATT Kennedy Round of multilateral trade negotiationsbegins.
Jan. 16, 1965 U.S.-Canada Agreement Concerning Automotive Products issigned.
Jan. 1, 1969 Japan and the members of the European Coal and SteelCommunity agree to place voluntary export restraints on steelproducts destined for the United States.
Aug. 16, 1971 The United States suspends the convertibility of the U.S. dollarinto gold; imposes temporary U.S. wage and price controls, aswell as import surcharges.
Oct. 1, 1971 The United States reaches voluntary export restraint agreementswith Hong Kong, Japan, South Korea, and Taiwan for textilesmade with wool and man-made fibers.
Dec. 18, 1971 The “Smithsonian Agreement” enters into force in Dec. 1971and provides a temporary realignment of currency exchangerates; the Aug. 1971 U.S. import surcharges are subsequentlyterminated.
Dec. 31, 1971 The United States records its first merchandise trade deficit inthe 20th century–a deficit of approximately $2.5 billion in 1971.
Sept. 14, 1973 The GATT Tokyo Round of multilateral trade negotiationsbegins.
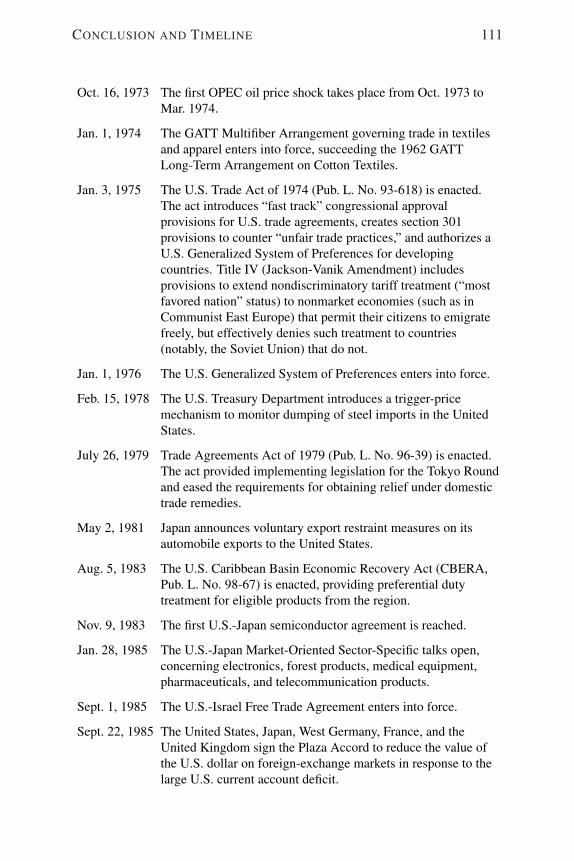
CONCLUSION AND TIMELINE 111
Oct. 16, 1973 The first OPEC oil price shock takes place from Oct. 1973 toMar. 1974.
Jan. 1, 1974 The GATT Multifiber Arrangement governing trade in textilesand apparel enters into force, succeeding the 1962 GATTLong-Term Arrangement on Cotton Textiles.
Jan. 3, 1975 The U.S. Trade Act of 1974 (Pub. L. No. 93-618) is enacted.The act introduces “fast track” congressional approvalprovisions for U.S. trade agreements, creates section 301provisions to counter “unfair trade practices,” and authorizes aU.S. Generalized System of Preferences for developingcountries. Title IV (Jackson-Vanik Amendment) includesprovisions to extend nondiscriminatory tariff treatment (“mostfavored nation” status) to nonmarket economies (such as inCommunist East Europe) that permit their citizens to emigratefreely, but effectively denies such treatment to countries(notably, the Soviet Union) that do not.
Jan. 1, 1976 The U.S. Generalized System of Preferences enters into force.
Feb. 15, 1978 The U.S. Treasury Department introduces a trigger-pricemechanism to monitor dumping of steel imports in the UnitedStates.
July 26, 1979 Trade Agreements Act of 1979 (Pub. L. No. 96-39) is enacted.The act provided implementing legislation for the Tokyo Roundand eased the requirements for obtaining relief under domestictrade remedies.
May 2, 1981 Japan announces voluntary export restraint measures on itsautomobile exports to the United States.
Aug. 5, 1983 The U.S. Caribbean Basin Economic Recovery Act (CBERA,Pub. L. No. 98-67) is enacted, providing preferential dutytreatment for eligible products from the region.
Nov. 9, 1983 The first U.S.-Japan semiconductor agreement is reached.
Jan. 28, 1985 The U.S.-Japan Market-Oriented Sector-Specific talks open,concerning electronics, forest products, medical equipment,pharmaceuticals, and telecommunication products.
Sept. 1, 1985 The U.S.-Israel Free Trade Agreement enters into force.
Sept. 22, 1985 The United States, Japan, West Germany, France, and theUnited Kingdom sign the Plaza Accord to reduce the value ofthe U.S. dollar on foreign-exchange markets in response to thelarge U.S. current account deficit.

112 CHAPTER 3 U.S. TRADE POLICY SINCE 1934
Sept. 2, 1986 The second U.S.-Japan semiconductor agreement is reached.
Sept. 20, 1986 The GATT Uruguay Round of multilateral trade negotiationsbegins.
Feb. 22, 1987 The United States, Japan, West Germany, France, the UnitedKingdom, and Canada sign the Louvre Accord to stabilize thevalue of the U.S. dollar on foreign-exchange markets, whosedecline began after the Plaza Accord 18 months earlier.
Aug. 23, 1988 The U.S. Omnibus Trade and Competitiveness Act of 1988(Pub. L. No. 100-418) is enacted, establishing the negotiatingprinciples for the next multilateral round of trade talks, includinga focus on services, intellectual property rights, and investmentsas well as the establishment of an improved dispute settlementmechanism. The act also introduced “super” and “special”section 301 trade provisions and requires annual reports onforeign trade barriers. The act also included provisions topromote domestic competitiveness and to enact the HTS.
Dec. 31, 1988 The U.S. trade deficit declines for the first time in seven years,from $170.3 billion in 1987 to $119.1 billion in 1988.
Jan. 1, 1989 The U.S.-Canada Free Trade Agreement enters into force.
Dec. 4, 1991 The U.S. Andean Trade Preference Act (ATPA, Pub. L. No.102-182) is enacted, providing preferential duty treatment foreligible products from Bolivia, Colombia, Ecuador, and Peru.
Jan. 9, 1992 A U.S.-Japan agreement on auto and auto parts is reached tovoluntarily increase Japanese imports of U.S.-made automobileparts.
Oct. 21, 1992 The U.S. Export Enhancement Act of 1992 (Pub. L. No.102-429) is enacted, calling for a government-wide strategy forU.S. export promotion that is announced in Sept. 1993 as theNational Export Strategy.
Dec. 15, 1993 The GATT Uruguay Round of multilateral trade negotiationsconcludes, with 125 countries signing the Uruguay RoundAgreements.
Jan. 1, 1994 The North American Free Trade Agreement (NAFTA) entersinto force.
Dec. 11, 1994 The Summit of the Americas is held, in which participantspledge to complete negotiations for a free trade agreement of theAmericas by 2005.

CONCLUSION AND TIMELINE 113
Jan. 1, 1995 The World Trade Organization (WTO) is established as asuccessor to the General Agreement on Tariffs and Trade.
July 1, 1997 The WTO Information Technology Agreement enters into force.
Feb. 6, 1998 The WTO Basic Telecommunications Agreement enters intoforce.
Jan. 29, 1999 The WTO Financial Services Agreement enters into force.
Dec. 3, 1999 The WTO Ministerial Conference at Seattle, Washington, failsto launch a new Millennium Round of multilateral tradenegotiations.
May 18, 2000 The U.S. Trade and Development Act of 2000 (Pub. L. No.106-200) is enacted, providing duty-free treatment for eligibleproducts from designated developing countries and territories.Title I of the act is the African Growth and Opportunity Act(AGOA) which amends the U.S. GSP program to provide duty-and quota-free treatment for certain products from eligiblesub-Sahara African beneficiary countries.
Oct. 1, 2000 The U.S. Caribbean Basin Trade Partnership Act amends the1984 CBERA to authorize duty- and quota-free treatment forapparel from qualifying CBERA countries.
Nov. 14, 2001 The WTO Ministerial Conference at Doha, Qatar, launches theDoha Development Agenda (DDA or Doha Round) ofmultilateral trade negotiations.
Dec. 17, 2001 The U.S.-Jordan Free Trade Agreement enters into force.
Mar. 20, 2002 The United States imposes increased tariffs and tariff-ratequotas on 14 steel products under Section 201 (“safeguard” or“escape clause”) provisions of the U.S. Trade Act of 1974.
May 13, 2002 The U.S. Farm Security and Rural Investment Act of 2002(Pub. L. No. 107-17) is enacted and increases domestic supportfor U.S. farmers.
Aug. 6, 2002 The Trade Act of 2002 is enacted (Pub. L. No. 107-210),including the authorization of trade promotion (formerly fasttrack) authority and the reauthorization of trade adjustmentassistance.
Sept. 14, 2003 The WTO Ministerial Conference at Cancun, Mexico, closeswithout consensus, largely because of disputes about reductionsin agricultural support payments and a tariff-cutting formula toliberalize market access for nonagricultural products.

114 CHAPTER 3 U.S. TRADE POLICY SINCE 1934
Jan. 1, 2004 The U.S.-Singapore Free Trade Agreement enters into force.
Jan. 1, 2004 The U.S.-Chile Free Trade Agreement enters into force.
Jan. 1, 2005 The U.S.-Australia Free Trade Agreement enters into force.
Nov. 8, 2005 The U.S.-China Memorandum of Understanding is signed,limiting exports of Chinese textiles and clothing to the UnitedStates during 2006-08.
Jan. 1, 2006 The U.S.-Central America-Dominican Republic Free TradeAgreement enters into force.
Jan. 1, 2006 The U.S.-Morocco Free Trade Agreement enters into force.
July 24, 2006 The WTO Doha Round of multilateral trade negotiations issuspended over the inability to agree on market-accessliberalization for agricultural and nonagricultural products andreductions in agricultural support.
Aug. 1, 2006 The U.S.-Bahrain Free Trade Agreement enters into force.
Nov. 22, 2006 The United States signs the U.S.-Colombia Free TradeAgreement, which is pending congressional approval in 2009.
June 22, 2007 The WTO Doha Round resumes in Feb. 2007 but is suspendedagain in June 2007 after failing to agree on issues ofmarket-access liberalization for agricultural and nonagriculturalproducts.
June 28, 2007 The United States signs the U.S.-Panama Trade PromotionAgreement, which is pending congressional approval in 2009.
June 30, 2007 The United States signs the U.S.-Korea Free Trade Agreement,which is pending congressional approval in 2009.
July 30, 2008 The WTO Doha Round resumes in Feb. 2008 but is suspendedagain in July 2008 after failing to agree on issues ofmarket-access liberalization for agricultural and nonagriculturalproducts and, in particular, a special safeguard mechanism fordeveloping country agricultural imports.
Jan. 1, 2009 The U.S.-Oman Free Trade Agreement enters into force.
Feb. 1, 2009 The U.S.-Peru Trade Promotion Agreement enters into force.
BIBLIOGRAPHY 115
Bibliography
Adams, Walter, and Joel B. Dirlam. “Steel Imports and VerticalOligopoly Power.” The American Economic Review 54, no. 5(1964): 626–55.
Anderson, James E., and J. Peter Neary. “A New Approach toMeasuring Trade Policy.” Review of Economic Studies 63, no. 1(1996): 107–25.
Anderson, Kym, and Will Martin. “Agricultural Trade Reform and theDoha Development Agenda.” The World Economy 28, no. 9 (2005):1301–27.
Baldwin, Robert E. “Resolving the Conflict Leading to the Collapse ofthe Doha Round.” Vox, September 25, 2008.http://www.voxeu.org/index.php?q=node/1697 (accessed December9, 2008).
———. “The Causes of Regionalism.” The World Economy 20, no. 7(1997): 865–88.
———. “The Changing Nature of U.S. Trade Policy Since World WarII.” In The Structure and Evolution of Recent U.S. Trade Policy,edited by Robert E. Baldwin and Anne Krueger, 5–31. Chicago:University of Chicago Press, 1984a.
———. “Trade Policies in Developed Countries.” In Handbook ofInternational Economics Volume I International Trade, edited byRonald W. Jones and Peter B. Kenan, 571–619. Amsterdam:North-Holland, 1984b.
Baldwin, Robert E., John H. Mutti, and J. David Richardson. “WelfareEffects on the United States of a Significant Multilateral TariffReduction.” Journal of International Economics 10 (1980):405–23.
Barton, John H., Judith L. Goldstein, Timothy E. Josling, and RichardH. Steinberg. The Evolution of the Trade Regime: Politics, Law andEconomics of the GATT and the WTO. Princeton, NJ: PrincetonUniversity Press, 2006.
Beckett, Grace. The Reciprocal Trade Agreements Program. New York:Columbia University Press, 1941.

116 CHAPTER 3 U.S. TRADE POLICY SINCE 1934
Bergsten, C. Fred. “A Renaissance for U.S. Trade Policy?” ForeignAffairs 81, no. 6 (2002): 86–98.
Bhagwati, Jagdish, Pravin Krishna, and Arvind Panagariya. TradingBlocs: Alternative Approaches to Analyzing Preferential TradeAgreements. Cambridge, MA: MIT Press, 1999.
Blonigen, Bruce A., and Thomas J. Prusa. “Antidumping.” NBERWorking Paper 8398, 2001.
Bradford, Scott C., Paul L.E. Grieco, and Gary C. Hufbauer. “ThePayoff to America from Globalisation.” The World Economy 29,no. 7 (July 2006): 893–916.
Broda, Christian, and David E. Weinstein. “Globalization and the Gainsfrom Variety.” Quarterly Journal of Economics 121, no. 2 (2006):541–85.
Brown, Drusilla, Alan Deardorff, and Robert M. Stern. “Multilateral,Regional and Bilateral Trade Policy Options for the United States.”The World Economy 26, no. 6 (2003): 803–28.
Caves, Richard E., Jeffrey A. Frankel, and Ronald W. Jones. WorldTrade and Payments: An Introduction. 9th ed. Boston: AddisonWesley, 2002.
Chorev, Nitsan. Remaking U.S. Trade Policy: From Protectionism toGlobalization. Ithaca and London: Cornell University Press, 2007.
Clausing, Kimberly A. “Trade Creation and Trade Diversion in theCanada-U.S. Free Trade Agreement.” The Canadian Journal ofEconomics 34, no. 3 (2001): 677–96.
Congressional Budget Office (CBO). The GATT Negotiations and U.S.Trade Policy, CBO Study. Washington, D.C.: Congress of theUnited States, Budget Office, 1987.
Dam, Kenneth W. “Cordell Hull, the Reciprocal Trade Agreement Act,and the WTO.” John M. Olin Law and Economics Working Paper228, October 2004.
Dean, Judith M., and John Wainio. “Quantifying the Value of U.S.Tariff Preferences for Developing Countries.” World Bank PolicyResearch Working Paper 3977, 2006.

BIBLIOGRAPHY 117
Deardorff, Alan V., and Robert M. Stern. “A Disaggregated Model ofWorld Production and Trade: An Estimate of the Impact of theTokyo Round.” Journal of Policy Modeling 3, no. 2 (1981): 127–52.
———. An Economic Analysis of the Effects of the Tokyo Round ofMultilateral Trade Negotiations on the United States and the OtherMajor Industrialized Countries. MTN Studies no. 5. Committee onFinance, U.S. Senate 96th Congress, 1st Session.Washington, D.C.: U.S. Government Printing Office, 1979.
Decreux, Yvan, and Lionel Fontagne. “A Quantitative Assessment ofthe Outcome of the Doha Development Agenda.” CEPII WorkingPaper 2006-10, 2006.
Destler, I.M. American Trade Politics. 3d ed. New York: The TwentiethCentury Fund, 1995.
De Melo, Jaime, and David Tarr. “Welfare Costs of U.S. Quotas inTextiles, Steel and Autos.” The Review of Economics and Statistics72 (1990): 489–97.
Diebold, William. “The End of the ITO.” In Essays in InternationalFinance 16. Princeton, NJ: Princeton University Press, 1952.
Dixon, Peter, Brian Parmenter, John Sutton, and Dave Vincent. ORANI:A Multisectoral Model of the Australian Economy. Amsterdam:North Holland, 1997.
Dobson, John M. Two Centuries of Tariffs. Washington, D.C.: USITC,1976.
Eaton, Jonathan, and Samuel Kortum. “Technology, Geography, andTrade.” Econometrica 70, no. 5 (2002): 1741–79.
———. “Trade in Capital Goods.” European Economic Review 45,no. 7 (2001): 1195–1235.
Economist. “The WTO Under Fire,” September 18, 2003.
Eichengreen, Barry. “The Political Economy of the Smoot-HawleyTariff.” NBER Working Paper 2001, August 1986.
Eichengreen, Barry, and Douglas A. Irwin. “Trade Blocs, CurrencyBlocs, and the Reorientation of World Trade in the 1930s.” Journalof International Economics 38 (February 1995): 1–24.
118 CHAPTER 3 U.S. TRADE POLICY SINCE 1934
Farrell, Roger. Japanese Investment in the World Economy: A Study ofStrategic Themes in the Internationalization of Japanese Industry.Cheltenham, UK: Edward Elgar Publishing, 2008.
Feenstra, Robert C. Advanced International Trade: Theory andEvidence. Princeton, NJ: Princeton University Press, 2004.
———. “Integration of Trade and Disintegration of Production in theGlobal Economy,” Journal of Economic Perspectives 12 no. 4(1998): 31–50.
———. “Voluntary Export Restraints in U.S. Autos, 1980-81: Quality,Employment, and Welfare Effects.” In Structure and Evolution ofRecent U.S. Trade Policy, edited by Robert E. Baldwin and Anne O.Krueger, 35–59. Chicago: University of Chicago Press, 1984.
Ferrantino, Michael. “Quantifying the Trade and Economic Effects ofNon-Tariff Measures.” OECD Trade Policy Working Paper 28,2006.
Francois, Joseph, Bernard Hoekman, and Julia Woerz. “Does GravityApply to Intangibles? Measuring Openness in Services.” Paperpresented at the CEPII-OECD Workshop on Recent Developmentsin International Trade in Services, Paris, 2007.
Gallaway, Michael P., Bruce A. Blonigen, and Joseph E. Flynn.“Welfare Costs of the U.S. Antidumping and Countervailing DutyLaws.” Journal of International Economics 49 (1999): 211–44.
Gootiiz, Batshur, and Aaditya Mattoo. “Services in Doha: What’s onthe Table?” Development Economics Research Group WorkingPaper, 2008.
Grossman, Gene M., and Elhanan Helpman. “Technology and Trade.”In Handbook of International Economics, Volume III, edited byGene M. Grossman and Elhanan Helpman, 1279–1337.Amsterdam: North-Holland, 1995.
Helmers, Henrik O. The United States-Canadian AutomobileAgreement: A Study in Industry Adjustment. Michigan InternationalCommerce Reports 1. Ann Arbor, MI: Bureau of BusinessAdministration, University of Michigan, 1967.
BIBLIOGRAPHY 119
Hertel, T., Martin, W., Yanagishima, K. and B. Dimaranan.“Liberalizing Manufactures in a Changing World Economy.” In TheUruguay Round and the Developing Economies, edited by W.Martin and L.A. Winters, 183–215. Cambridge: CambridgeUniversity Press, 1996.
Hoekman, Bernard. “Liberalizing Trade in Services: A Survey.” WorldBank Policy Research Working Paper 4030, 2006.
———. “Strengthening the Global Trade Architecture forDevelopment.” World Trade Review 1, no. 1 (2002): 2–45.
Hoekman, Bernard M., and Michael M. Kostecki. The PoliticalEconomy of the World Trading System: The WTO and Beyond. 2nded. Oxford: Oxford University Press, 2001.
Hoekman, Bernard M., William J. Martin, and Carlos A. Primo Braga.“Preference Erosion: The Terms of the Debate.” In Trade, Dohaand Development, edited by Richard Newfarmer, 329-40.Washington DC: World Bank, 2005.
Hunter, Janet, and Helen Macnaughtan. “Textile Workers in Japan.” InThe Ashgate Companion to the History of Textile Workers, edited byLex Heerma van Voss, Els Hiemstra-Kuperus and Elise vanNederveen Meerkerk, forthcoming. Surrey, UK: AshgatePublishers. http://www.iisg.nl/research/japan-rev.doc
Irwin, Douglas A. “From Smoot-Hawley to Reciprocal TradeAgreements: Changing the Course of U.S. Trade Policy in the1930s.” In The Defining Moment: The Great Depression and theAmerican Economy in the Twentieth Century, edited by Michael D.Bordo, Claudia Goldin, and Eugene N. White, 325-352. Chicago:University of Chicago Press for the NBER, 1998.
———. “The GATT in Historical Perspective.” American EconomicReview Papers and Proceedings 85, no. 2 (1995): 323–28.
———. “The Smoot-Hawley Tariff: A Quantitative Assessment.” TheReview of Economics and Statistics 80, no. 2 (May 1998): 326–34.
———. “Trade Restrictiveness and Deadweight Losses from U.S.Tariffs, 1859–1961.” NBER Working Paper 13450, 2007.
120 CHAPTER 3 U.S. TRADE POLICY SINCE 1934
Jackson, John H. The World Trading System: Law and Policy ofInternational Economic Relations. 2nd ed. Cambridge, MA: MITPress, 1997.
———. World Trade and the Law of GATT. Indianapolis, IN:Bobbs-Merrill, 1969.
Jones, Joseph M. Tariff Retaliation: Repercussions of the Hawley-SmootBill. Philadelphia: University of Pennsylvania Press, 1934.
Keck, Alexander, and Patrick Low. “Special and Differential Treatmentin the WTO: Why, Where and How?” WTO Staff Working PaperERSD-2004-03, 2004.
Keesing, Donald B., and Martin Wolf. Textile Quotas AgainstDeveloping Countries. London: Trade Policy Research Centre,1980.
Kenan, Peter B. The International Economy. 4th ed. Cambridge:Cambridge University Press, 2000.
Krueger, Anne O. “Are Preferential Trade ArrangementsTrade-Liberalizing or Protectionist?” The Journal of EconomicPerspectives 13, no. 4 (1999): 105–24.
Krugman, Paul. “Increasing Returns, Monopolistic Competition, andInternational Trade.” Journal of International Economics 9, no. 4(1979): 469–79.
———. “Ricardo’s Difficult Idea,” paper for the ManchesterConference on Free Trade, March 1996.http://web.mit.edu/krugman/www/ricardo.htm (accessed April 20,2009).
———. “Scale Economies, Product Differentiation, and the Pattern ofTrade.” The American Economic Review 70, no. 5 (1980): 950–59.
Krugman, Paul, and Maurice Obstfeld. International Economics:Theory and Policy. 5th ed. Boston: Addison-Wesley, 2000.
Laird, Sam, and Alexander Yeats. “Trends in Nontariff Barriers ofDeveloped Countries, 1966–1986.” Review of World Economics126, no. 2 (1990): 299–325.

BIBLIOGRAPHY 121
McClenahan, William. “The Growth of Voluntary Export Restraints andAmerican Foreign Economic Policy, 1956–1969.” Business andEconomic History, 2nd ser. 20 (1991): 180–90.
McGovern, Edmond. International Trade Regulation. 3d ed. Exeter:Globefeld Press, 1995.
Mehta, Pradeep S. “The Doha Development Agenda: The Road Ahead.”In Canadian Development Report 2003. Ottawa: The North-SouthInstitute, 2003.
Melitz, Marc J. “The Impact of Trade on Intra-Industry Reallocationsand Aggregate Industry Productivity.” Econometrica 71, no. 6(2003): 1695–1725.
Office of the U.S. Trade Representative (USTR). “History of the U.S.Trade Representative,” undated. http://www.ustr.gov/ (accessedFebruary 2, 2009).
Oyejide, T. Ademola. “Interests and Options of Developing andLeast-developed Countries in a New Round of Multilateral TradeNegotiations.” G-24 Discussion Paper Series 2. United NationsConference on Trade and Development–Center for InternationalDevelopment, Harvard University. 2000.
Panagariya, Arvind. “Alternative Approaches to Measuring the Cost ofProtection.” 2002. Mimeo.
Pearson, Charles S. United States Trade Policy: A Work in Progress.Hoboken, NJ: John Wiley & Sons, 2004.
Piermartini, Roberta, and Robert Teh. “Demystifying ModellingMethods for Trade Policy.” WTO Discussion Papers 10, 2005.
Robinson, Sherman, Zhi Wang, and Will Martin. “Capturing theImplications of Services Trade Liberalization.” Economic SystemsResearch 14, no. 1 (2002): 3–33.
Romalis, John. “NAFTA’s and CUSFTA’s Impact on InternationalTrade.” NBER Working Paper 11059, 2005.
Rosen, Howard. “Free Trade Agreements as Foreign Policy Tools: TheU.S.-Israel and U.S.-Jordan FTAs.” In Free Trade Agreements: U.S.Strategies and Priorities, edited by Jeffrey J. Schott, 53–58.Washington, D.C.: Peterson Institute, 2004.

122 CHAPTER 3 U.S. TRADE POLICY SINCE 1934
Shoven, John B. and John Whalley. Applying General Equilibrium.Cambridge: Cambridge University Press, 1992.
Taussig, Frank W. The Tariff History of the United States. 6th ed. NewRochelle: G.P. Putnam’s Sons, 1914.
Taussig, Frank W. The Tariff History of the United States. 8th ed. NewRochelle: G.P. Putnam’s Sons, 1931.
Trebilcock, Michael J., and Robert Howse. The Regulation ofInternational Trade. 3rd ed. London and New York: Routledge,2005.
U.S. Department of Commerce. U.S. Census Bureau. Official U.S. tradestatistics. http://www.census.gov/foreign-trade/download/dvd/index.html#merch (accessed monthly).
U.S. House of Representatives. Committee on Ways and Means.Overview and Compilation of U.S. Trade Statutes, 1993 ed.
U.S. House of Representatives. Committee on Ways and Means.Overview and Compilation of U.S. Trade Statutes, 1995 ed.
U.S. Tariff Commission. Operation of the Trade Agreements Program,June 1934 to April 1948 – Part II. History of the Trade AgreementsProgram. Report no. 160, Second Series. Washington, D.C.: U.S.Tariff Commission, 1949.
U.S. International Trade Commission (USITC). Antidumping andCountervailing Duty Handbook. 13th ed. USITC Publication 4056.Washington, D.C.: USITC, 2008.
———. Hearing transcript in connection with inv. no. 332-325, TheEconomic Effects of Significant U.S. Import Restraints: SixthUpdate, January 8, 2009.
———. Foreign Protection of Intellectual Property Rights and theEffect on U.S. Industry and Trade. USITC Publication 2065.Washington, D.C.: USITC, 1988.
———. The History and Current Status of the Multifiber Arrangement,USITC Publication 850. Washington, D.C.: USITC, 1978.

BIBLIOGRAPHY 123
———. The Impact of Trade Agreements: Effect of the Tokyo Round,U.S.-Israel FTA, U.S.-Canada FTA, NAFTA, and the UruguayRound on the U.S. Economy, USITC Publication 3621.Washington, D.C.: USITC, 2003.
Washington Trade Daily. “US Certifies Peru FTA.” Volume 18. no 13.January 19, 2009. Trade Reports International Group.
Whalley, John. “An Evaluation of the Tokyo Round Trade AgreementUsing General Equilibrium Computational Methods.” Journal ofPolicy Modeling 4, no. 3 (1982): 341–61.
Whalley, John, and R. Wigle. “Price and Quantity Rigidities inAdjustment to Trade Policy Changes: Alternative Formulation andInitial Calculations.” 1982. Mimeo (cited in Baldwin (1984)).
World Bank Group. World Development Indicators Online.http://go.worldbank.org/3SGLDH5V10 (accessed February 2,2009).
World Trade Organization (WTO). “Agriculture: Fairer Markets forFarmers,” undated.http://www.wto.org/english/thewto e/whatis e/tif e/agrm3 e.htm(accessed January 2, 2009).
———. “Sanitary and Phytosanitary Measures: Gateway,” undated.http://www.wto.org/english/tratop e/sps e/sps e.htm (accessedDecember 9, 2008).
———. World Trade Report 2007. Geneva: WTO Publications, 2007.http://www.wto.org/english/res e/reser e/wtr arc e.htm.