us update - national gridinvestors.nationalgrid.com/~/...ir-v2/seminar...presentation-2015.pdf ·...
TRANSCRIPT

12 November 2015
US Update
Investor Seminar

Investor Seminar November 2015
Cautionary statement
2
This presentation contains certain statements that are neither reported financial results nor other historical information. These statements are forward-looking statements within the
meaning of Section 27A of the Securities Act of 1933, as amended, and Section 21E of the Securities Exchange Act of 1934, as amended. These statements include information with
respect to National Grid’s financial condition, its results of operations and businesses, strategy, plans and objectives. Words such as ‘anticipates’, ‘expects’, ‘should’, ‘intends’, ‘plans’,
‘believes’, ‘outlook’, ‘seeks’, ‘estimates’, ‘targets’, ‘may’, ‘will’, ‘continue’, ‘project’ and similar expressions, as well as statements in the future tense, identify forward-looking statements.
These forward-looking statements are not guarantees of National Grid’s future performance and are subject to assumptions, risks and uncertainties that could cause actual future results
to differ materially from those expressed in or implied by such forward-looking statements. Many of these assumptions, risks and uncertainties relate to factors that are beyond National
Grid’s ability to control or estimate precisely, such as changes in laws or regulations, announcements from and decisions by governmental bodies or regulators (including the timeliness
of consents for construction projects); the timing of construction and delivery by third parties of new generation projects requiring connection; breaches of, or changes in, environmental,
climate change and health and safety laws or regulations, including breaches or other incidents arising from the potentially harmful nature of its activities; network failure or interruption,
the inability to carry out critical non network operations and damage to infrastructure, due to adverse weather conditions including the impact of major storms as well as the results of
climate change, due to counterparties being unable to deliver physical commodities, or due to the failure of or unauthorised access to or deliberate breaches of National Grid’s IT
systems and supporting technology; performance against regulatory targets and standards and against National Grid’s peers with the aim of delivering stakeholder expectations
regarding costs and efficiency savings, including those related to investment programmes and internal transformation and remediation plans; and customers and counterparties
(including financial institutions) failing to perform their obligations to the Company. Other factors that could cause actual results to differ materially from those described in this
presentation include fluctuations in exchange rates, interest rates and commodity price indices; restrictions and conditions (including filing requirements) in National Grid’s borrowing and
debt arrangements, funding costs and access to financing; regulatory requirements for the Company to maintain financial resources in certain parts of its business and restrictions on
some subsidiaries’ transactions such as paying dividends, lending or levying charges; inflation or deflation; the delayed timing of recoveries and payments in National Grid’s regulated
businesses and whether aspects of its activities are contestable; the funding requirements and performance of National Grid’s pension schemes and other post-retirement benefit
schemes; the failure to attract, train or retain employees with the necessary competencies, including leadership skills, and any significant disputes arising with the National Grid’s
employees or the breach of laws or regulations by its employees; and the failure to respond to market developments, including competition for onshore transmission, and grow the
Company’s business to deliver its strategy, as well as incorrect or unforeseen assumptions or conclusions (including unanticipated costs and liabilities) relating to business development
activity, including assumptions in connection with joint ventures. For further details regarding these and other assumptions, risks and uncertainties that may impact National Grid, please
read the Strategic Report section and the ‘Risk factors’ on pages 173 to 176 of National Grid’s most recent Annual Report and Accounts, as updated by National Grid’s unaudited half-
year financial information for the six months ended 30 September 2015 published on 10 November 2015. In addition, new factors emerge from time to time and National Grid cannot
assess the potential impact of any such factor on its activities or the extent to which any factor, or combination of factors, may cause actual future results to differ materially from those
contained in any forward-looking statement. Except as may be required by law or regulation, the Company undertakes no obligation to update any of its forward-looking statements,
which speak only as of the date of this presentation.

Steve Holliday
Chief Executive National Grid

Dean Seavers
Chief Executive Officer US

Investor Seminar November 2015
A significant business
5
3 states
$20bn regulatory
assets
7 million distribution customers
14,000 employees
139,000 KM of
electricity cable 57,000 KM
of gas pipeline

Investor Seminar November 2015
A favourable environment
6
Abundance of natural gas
Cleaner energy sources
Improving infrastructure
Distributed energy sources
Distribution investment
New connections
$

Investor Seminar November 2015
Our ambition over the medium term
15.0
16.3
17.2
2013 2014 2015
Historic rate base growth
$bn
7
Asset growth: around 7%
7%

Investor Seminar November 2015
Our ambition over the medium term
Expect return on equity of around 8% in 2015
Current returns reflect recent hiatus in filings
Filing process underway - benefit expected in fiscal 2017/18
8
Target returns at 95% of the allowed level
2014 returns
11.5%
9.0% 8.5%
7.8% 6.5%
4.6%
Narragansett Gas 11.6%
FERC
NiMo Electric
Narragansett Electric 9.5%
KEDNY
NiMo Gas 8.3%
Mass
Gas
KEDLI Mass
Elec
$0 $17.2bn
Allowed
returns

Investor Seminar November 2015
2015
2016
2017
Today Mass
elec
filing Downstate NY
rate filings
Mass elec
filing results Downstate
NY filing
results Potential Mass
gas & RI filings
Re-start of rate filings
Quality data enables restart of rate filings
9

Investor Seminar November 2015
Stronger regulatory interface
Managing relationships with our key stakeholders is extremely important
Since switching to our jurisdictional model we have strengthened relationships with our regulators
Added more visibility and accountability
10
Local businesses, with synergies and benefits
from being part of a world class utility
Functional
Support
Core
Processes NG
US
C
orp
ora
te NY MA RI FERC

Investor Seminar November 2015
Organic growth opportunities
Significant requirements for gas mains replacement
Potential to add new gas customers
Replacement of ageing electricity distribution assets
11
$bn
Growth in distribution rate base
FY13
Electric rate base
9
7
6
5
4
8
FY14 FY15 FY13 FY14 FY15
Gas rate base

Investor Seminar November 2015
1000
1500
2000
2500
FY13 FY14 FY15
Transmission & FERC opportunities
Potential to almost double size of FERC business
Projects to − reduce bottlenecks
− resolve network issues
− reduce commodity costs
12
Growth in FERC Rate base
$m Significant growth potential

Investor Seminar November 2015
Clean energy innovation
13
New England New York
Reforming the Energy Vision (REV)
Number of pilot schemes
Worcester smart grid trial
Grid modernisation proposal in Massachusetts
Data and intelligence from the pilots increases our ability to respond
Consumer expectation
De-carbonisation of the industry
Advances in technology

Investor Seminar November 2015
Strong customer focus and efficiency improvement
Focus on operational efficiencies
Customer satisfaction a key performance indicator for our regulators
Capitalising on incremental improvement opportunities
Focus on sustainable and replicable improvements
14

Investor Seminar November 2015
Summary
A significant business with a favourable environment
Restart of rate filings
Strong customer focus and efficiency improvement
Multiple growth opportunities
15

Peggy Smyth
Chief Financial Officer US

Investor Seminar November 2015
Significant asset base and capital investment programme
$bn
1.00
1.25
1.50
1.75
2.00
2.25
2.50
2.75
2011/12 2012/13 2013/14 2014/15 2015/16
Capital investment $17.2 bn rate base*
$bn
e
17
* As at March 2015
0
2
4
6
8
10
12
FERC
Rhode Island New York
Massachusetts
Investor Seminar November 2015
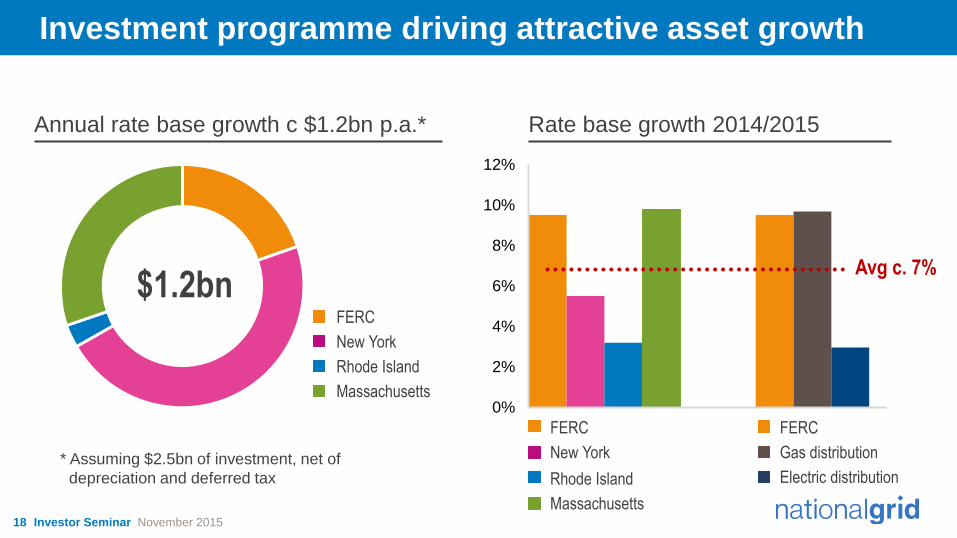
Investment programme driving attractive asset growth
$1.2bn
0%
2%
4%
6%
8%
10%
12%
FERC
New York
Rhode Island
Massachusetts
Avg c. 7%
FERC
New York
Rhode Island
Massachusetts
FERC
Gas distribution
Electric distribution
Rate base growth 2014/2015 Annual rate base growth c $1.2bn p.a.*
* Assuming $2.5bn of investment, net of
depreciation and deferred tax
18

Investor Seminar November 2015
Recent financial performance - IFRS
Operating profit $1.8bn p.a. − maintained in 2014/15
despite increased gas repair and bad debt costs following cold winter
19
$m FY 14/15 FY 13/14
Net Revenue 6,433 6,274
Regulated controllable operating costs (2,246) (2,220)
Post-retirement costs (120) (117)
Bad debts (188) (90)
Other operating costs and provisions (1,330) (1,347)
Depreciation and amortisation (713) (678)
Operating profit 1,836 1,822
Less: Timing impact (47) (16)
Operating profit excluding timing 1,789 1,806
Investor Seminar November 2015
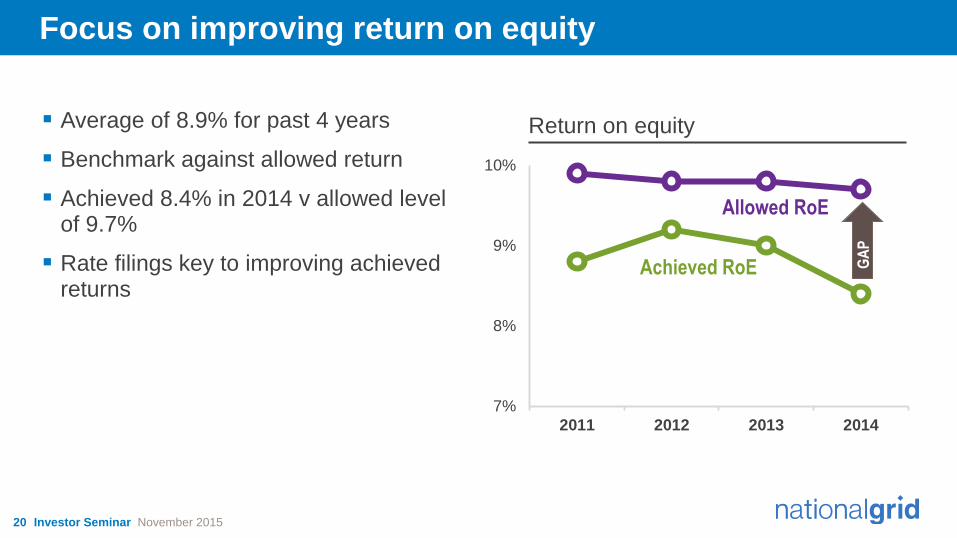
Focus on improving return on equity
Average of 8.9% for past 4 years
Benchmark against allowed return
Achieved 8.4% in 2014 v allowed level of 9.7%
Rate filings key to improving achieved returns
7%
8%
9%
10%
2011 2012 2013 2014
GA
P
Return on equity
Achieved RoE
Allowed RoE
20

Investor Seminar November 2015
Background on regulatory rate filing mechanism
No fixed “price control periods” − companies elect to file for new rates
Test year of data used to generate forecasts − rate base
− operating costs
Comprehensive review and hearings process
Revenue allowance set until next rate filing
Jurisdiction Ratemaking
Mechanism
Massachusetts Historic
Rhode Island Forward looking
New York Forward looking
FERC (transmission) Formula rates
Growth in operating costs and in rate base leads to downward pressure on returns
Regular rate filings increase revenues in line with cost and asset growth
21

Investor Seminar November 2015
National Grid rate filings since 2012
2015
2016
Last full rate filings
in Niagara Mohawk
and Rhode Island April 2012
Downstate
New York rate
filing expected Jan 2016
2012
2013 2014
Hiatus in rate filings
Massachusetts
Electric rate filing Nov 2015
22
Massachusetts − Grid modernisation − Changes in Commission
Niagara Mowhawk − Three year rate plans
KEDNY − Rate plan extended
Rhode Island − ISR mechanisms
Financial system implementation

Investor Seminar November 2015
Proactive steps to support returns between rate filings
Cost control initiatives
Improvement through filing extensions
Overall - partial mitigation measures
Targeting additional rate mechanisms
Capex trackers
Cost true ups
23

Investor Seminar November 2015
Additional rate mechanisms
Adjust revenues (current and/or future) to reflect growing rate base
Depreciation and WACC return
24
Capex trackers
Reflect differences in actual operating costs compared to allowance
Give rise to deferral balances
Company files for recovery of deferrals
Cost true ups
Downstate
New York
Gas (KEDNY/KEDLI)
Upstate
New York (NiMo
Electric/Gas)
Massachusetts
Gas
Massachusetts
Electric
Rhode
Island Gas
Rhode Island
Electric
Capital
Investment /
Plant in Service
Tracker
Property tax
true-up
Bad Debt
commodity
element true -
up
Environmental
deferrals
Pensions and
OPEBs* true-up
* OPEB: Other post employment benefits

Investor Seminar November 2015
Full rate filings required to recover operating costs and meet target returns
$2.2bn regulated controllable operating costs
Test years date back to 2008 in some cases
Growth above rate plan levels − Property taxes
− Healthcare costs
− Gas mains repair
− Underlying annual cost inflation
Cost pressures concentrated in Massachusetts and Downstate New York
25
Focus for return improvement
by jurisdiction
KEDLI
Massachusetts Electric
Other
KEDNY
Rate filing Nov 2015
New rates Oct 2016
Rate filing Jan 2016
New rates Jan 2017
Rate filing Jan 2016
New rates Jan 2017
reflects 2014 gap to group average allowed return

Investor Seminar November 2015
Regulated operating profit growth profile to deliver return improvement
Over $350m required in 2017/18 to match return aspirations and asset growth
Mix of trackers and rate filings
26
0
100
200
300
400$m
2015 gap
Reflecting $1.2bn annual rate base growth
$100m p.a. growth 2015
gap
illustrative 2015 2016 2017
Regulated operating profit

Investor Seminar November 2015
Deferrals will create difference in timing of profit recognition
Executive Director, US
US GAAP and RoE IFRS
Incur expense:
recovery deferred
Defer cost to an
offsetting regulatory
asset
No net impact on
profit
Recognise cost
as incurred
Negative impact
on profit
Receive associated
revenue under
deferral mechanism
Recognise revenue
and reduce
regulatory asset
No net impact on
profit
Recognise
revenue as
collected
Positive impact
on profit
True ups and trackers give rise to “deferrals”
Regulatory asset/liability created under US GAAP
Additional cost and subsequent recovery have no impact on profit
No regulatory assets, liabilities or deferrals
Costs and revenues recognised when incurred/collected
IFRS and US GAAP accounting
27

Investor Seminar November 2015
2014/15 2015/16 2016/17 2017/18
Impact of deferrals on IFRS operating profit
Deferral creation and recoveries may affect IFRS profile
Deferral creation and recoveries do not affect RoE improvement
28
2018/19
IFRS operating
profit ($m)

Dean Seavers
Chief Executive Officer US

Investor Seminar November 2015
Today’s sessions
Ken Daly New York
Marcy Reed Massachusetts
Tim Horan Rhode Island
Rudy Wynter FERC
30

12 November 2015
Q&A
Investor Seminar