u.s. voters feel good about economy, but not … · u.s. voters feel good about economy, but not...
TRANSCRIPT

FOR RELEASE: OCTOBER 11, 2017
U.S. VOTERS FEEL GOOD ABOUT ECONOMY, BUT NOT TRUMP,
QUINNIPIAC UNIVERSITY NATIONAL POLL FINDS;
VOTERS TAKE A KNEE FOR BOTH TRUMP AND NFL PLAYERS
American voters feel better about the economy and good about their own pocketbooks, but still
disapprove 56 – 38 percent of the job President Donald Trump is doing, according to a
Quinnipiac University national poll released today.
Today’s approval rating compares to a 57 – 36 percent disapproval in a September 27
survey by the independent Quinnipiac (KWIN-uh-pe-ack) University.
Voters today say 55 – 43 percent that Trump is not fit to serve as president, compared to
56 – 42 percent not fit two weeks ago.
On his job approval, President Trump gets 81 – 12 percent support from Republicans,
55 – 40 percent backing from white voters with no college degree and 52 – 43 percent from
white men. Every other listed party, gender, education, age and racial group disapproves.
American voters are divided on Trump’s handling of the economy, as 48 percent approve
and 46 percent disapprove.
A total of 61 percent of voters – close to an all-time high – say the nation’s economy is
“excellent” or “good,” while 37 percent say it is “not so good” or “poor.”
Their personal financial situation is “excellent” or “good,” 73 percent of voters say, while
26 percent say it is “not so good” or “poor.”
But only 27 percent of voters are “very satisfied” or “somewhat satisfied” with the way
things are going in the nation today, while 72 percent are “somewhat dissatisfied” or “very
dissatisfied.”
Anti-Twitter sentiment hits a new high as 70 percent of voters say the president should
stop tweeting from his personal account.
“After a turbulent stretch of heartbreaking tragedies, President Donald Trump is still deep
in negative territory,” said Tim Malloy, assistant director of the Quinnipiac University Poll.
“President Trump may not be fit, but the economy is, voters say. They remain troubled
by the president’s competence, but see the economy booming along under his stewardship.”
-more-
Tim Malloy, Assistant Director
(203) 645-8043
Rubenstein
Pat Smith (212) 843-8026

2
Quinnipiac University Poll/October 11, 2017 – page 2
American voter opinions of most Trump qualities remain negative:
56 – 40 percent that he is not honest;
59 – 38 percent that he does not have good leadership skills;
54 – 44 percent that he does not care about average Americans;
67 – 29 percent that he is not level headed;
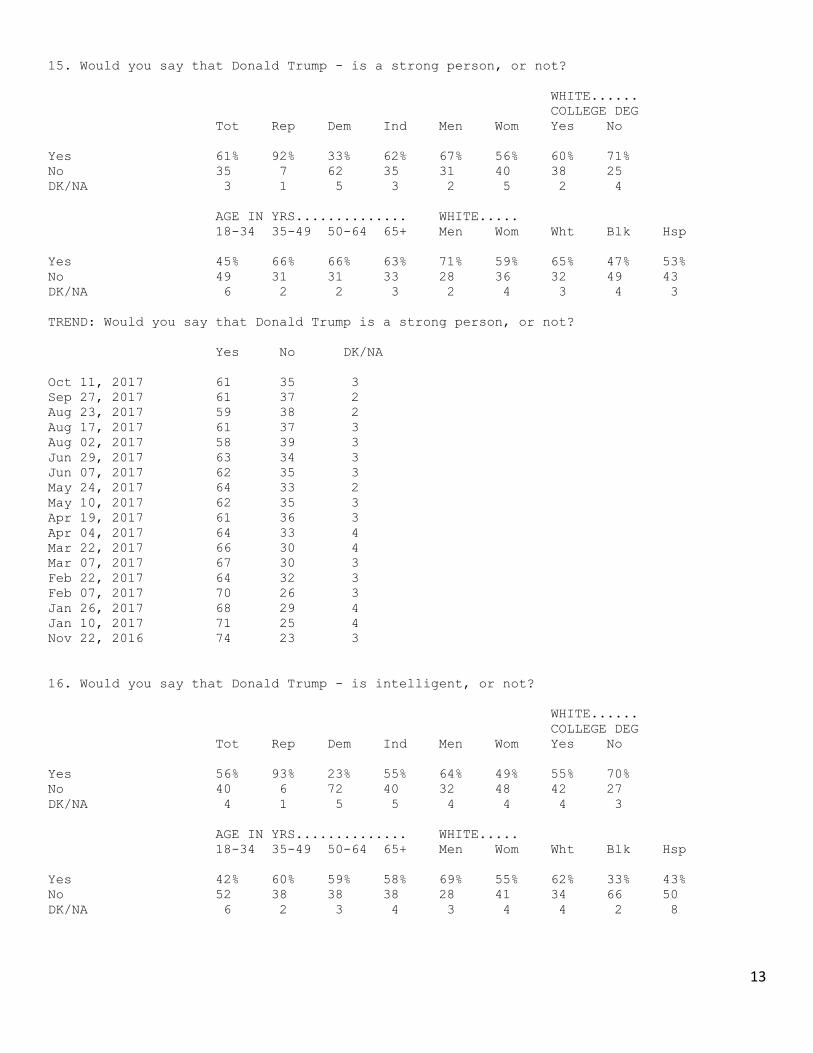
61 – 35 percent that he is a strong person;
56 – 40 percent that he is intelligent;
60 – 37 percent that he does not share their values.
NFL Protests
American voters say 58 – 34 percent that Trump’s comments on NFL protests were not
appropriate. Republicans say 67 – 21 percent the remarks were appropriate and white voters
with no college degree are divided 46 – 45 percent. Every other party, gender, education, age
and racial group listed says the remarks were not appropriate.
Voters also disapprove 52 – 43 percent of NFL players taking a knee during the National
Anthem. There are wide gender, age and racial gaps:
Men disapprove 57 – 39 percent while women are divided 48 – 48 percent;
Voters 18 to 34 years old approve 66 – 27 percent, while voters over 65 years old
disapprove 62 – 34 percent;
White voters disapprove 60 – 37 percent, as black voters approve 79 – 18 percent.
Hispanic voters are divided 46 – 45 percent.
Voters are divided 48 – 46 percent on their approval of Trump’s handling of terrorism.
He gets mostly negative approval ratings for handling other key issues:
38 – 58 percent for handling foreign policy;
39 – 56 percent for immigration;
35 – 59 percent for race relations;
37 – 49 percent for taxes.
From October 5 – 10, Quinnipiac University surveyed 1,482 voters nationwide with a
margin of error of +/- 3 percentage points, including the design effect. Live interviewers call
landlines and cell phones.
The Quinnipiac University Poll, directed by Douglas Schwartz, Ph.D., conducts
nationwide public opinion surveys, and statewide polls in Pennsylvania, New York, New Jersey,
Connecticut, Florida, Ohio, Virginia, Iowa and Colorado as a public service and for research.
Visit poll.qu.edu or www.facebook.com/quinnipiacpoll
Call (203) 582-5201, or follow us on Twitter @QuinnipiacPoll.

3

4
1. Do you approve or disapprove of the way Donald Trump is handling his job as President?
WHITE......
COLLEGE DEG
Tot Rep Dem Ind Men Wom Yes No
Approve 38% 81% 3% 35% 45% 32% 36% 55%
Disapprove 56 12 95 58 49 64 58 40
DK/NA 5 7 2 7 6 5 7 5
AGE IN YRS.............. WHITE.....
18-34 35-49 50-64 65+ Men Wom Wht Blk Hsp
Approve 17% 42% 44% 42% 52% 39% 45% 7% 21%
Disapprove 74 53 53 53 43 55 49 93 70
DK/NA 9 5 3 5 5 6 6 - 9
TREND: Do you approve or disapprove of the way Donald Trump is handling his job as
President?
App Dis DK/NA
Oct 11, 2017 38 56 5
Sep 27, 2017 36 57 6
Aug 23, 2017 35 59 6
Aug 17, 2017 39 57 4
Aug 02, 2017 33 61 5
Jun 29, 2017 40 55 5
Jun 07, 2017 34 57 9
May 24, 2017 37 55 7
May 10, 2017 36 58 6
Apr 19, 2017 40 56 4
Apr 04, 2017 35 57 8
Mar 22, 2017 37 56 7
Mar 07, 2017 41 52 7
Feb 22, 2017 38 55 7
Feb 07, 2017 42 51 7
Jan 26, 2017 36 44 19
1a. Do you approve or disapprove of the way Donald Trump is handling his job as
President? COMBINED WITH: (If approve/disapprove q1) Do you strongly or somewhat
approve/disapprove?
WHITE......
COLLEGE DEG
Tot Rep Dem Ind Men Wom Yes No
Approve strongly 27% 60% 2% 23% 33% 22% 23% 41%
Approve smwht 11 20 2 12 12 10 12 14
Disapprove smwht 6 3 6 8 7 6 6 6
Disapprove strongly 50 9 88 50 41 57 51 34
DK/NA 6 7 3 7 7 5 7 5
AGE IN YRS.............. WHITE.....
18-34 35-49 50-64 65+ Men Wom Wht Blk Hsp
Approve strongly 11% 25% 33% 31% 37% 26% 32% 5% 15%
Approve smwht 6 17 10 11 14 12 13 3 6
Disapprove smwht 13 4 5 6 7 6 6 7 8
Disapprove strongly 61 49 48 47 36 49 42 84 62
DK/NA 10 6 4 5 6 7 6 1 9

5
TREND: Do you approve or disapprove of the way Donald Trump is handling his job as
President? COMBINED WITH: (If approve/disapprove) Do you strongly or somewhat
approve/disapprove?
App App Dis Dis
Strngly Smwht Smwht Strngly DK/NA
Oct 11, 2017 27 11 6 50 6
Sep 27, 2017 26 10 8 49 7
Aug 23, 2017 27 8 4 54 7
Aug 17, 2017 26 12 5 52 5
Aug 02, 2017 23 10 6 55 6
Jun 29, 2017 28 12 6 48 5
Jun 07, 2017 25 9 6 51 9
May 24, 2017 28 9 7 49 8
May 10, 2017 25 10 8 51 7
Apr 19, 2017 28 11 6 50 5
Apr 04, 2017 25 9 7 49 9
Mar 22, 2017 26 10 6 50 8
Mar 07, 2017 31 10 6 45 8
Feb 22, 2017 29 9 6 49 8
Feb 07, 2017 33 9 6 45 8
Jan 26, 2017 29 6 4 40 20
2. Do you approve or disapprove of the way the Republicans in Congress are handling their
job?
WHITE......
COLLEGE DEG
Tot Rep Dem Ind Men Wom Yes No
Approve 17% 37% 3% 14% 17% 17% 16% 18%
Disapprove 77 55 92 82 78 77 78 74
DK/NA 6 7 5 4 5 6 6 7
AGE IN YRS.............. WHITE.....
18-34 35-49 50-64 65+ Men Wom Wht Blk Hsp
Approve 15% 21% 17% 14% 17% 18% 17% 14% 14%
Disapprove 77 73 78 79 77 75 76 83 78
DK/NA 7 5 4 7 6 7 7 3 7
TREND: Do you approve or disapprove of the way the Republicans in Congress are handling
their job?
App Dis DK/NA
Oct 11, 2017 17 77 6
Sep 27, 2017 15 78 7
Jun 29, 2017 25 70 5
Jun 08, 2017 19 73 7
May 25, 2017 21 70 9
May 10, 2017 22 71 7
Apr 19, 2017 24 68 7
Apr 04, 2017 21 70 9
Mar 22, 2017 29 64 7
Feb 22, 2017 31 62 8
Link to full trend on website

6
3. Do you approve or disapprove of the way the Democrats in Congress are handling their
job?
WHITE......
COLLEGE DEG
Tot Rep Dem Ind Men Wom Yes No
Approve 28% 8% 53% 22% 20% 35% 30% 20%
Disapprove 65 86 39 71 72 58 63 72
DK/NA 8 6 9 7 8 7 7 8
AGE IN YRS.............. WHITE.....
18-34 35-49 50-64 65+ Men Wom Wht Blk Hsp
Approve 24% 30% 28% 29% 17% 33% 25% 46% 24%
Disapprove 64 63 67 63 75 60 68 50 65
DK/NA 12 7 5 9 8 7 7 5 11
TREND: Do you approve or disapprove of the way the Democrats in Congress are handling
their job?
App Dis DK/NA
Oct 11, 2017 28 65 8
Sep 27, 2017 29 63 8
Jun 29, 2017 29 64 7
Jun 08, 2017 28 63 9
May 25, 2017 28 63 9
May 10, 2017 34 58 9
Apr 19, 2017 29 63 7
Apr 04, 2017 34 57 9
Mar 22, 2017 30 60 10
Feb 22, 2017 32 59 8
Link to full trend on website
4. Is your opinion of Donald Trump favorable, unfavorable or haven't you heard enough
about him?
WHITE......
COLLEGE DEG
Tot Rep Dem Ind Men Wom Yes No
Favorable 39% 82% 4% 35% 45% 33% 37% 55%
Unfavorable 57 14 92 61 50 64 60 42
Hvn't hrd enough 2 2 3 2 3 2 2 2
REFUSED 2 2 1 3 2 2 2 1
AGE IN YRS.............. WHITE.....
18-34 35-49 50-64 65+ Men Wom Wht Blk Hsp
Favorable 19% 41% 44% 43% 51% 40% 46% 6% 24%
Unfavorable 76 56 52 53 45 57 51 90 66
Hvn't hrd enough 4 1 2 3 2 2 2 1 6
REFUSED 2 2 2 1 1 1 1 2 4

7
TREND: Is your opinion of Donald Trump favorable, unfavorable or haven't you heard enough
about him?
Fav Unfav HvntHrd REF
Oct 11, 2017 39 57 2 2
Sep 27, 2017 36 57 4 2
Aug 23, 2017 36 60 3 2
Aug 17, 2017 39 58 2 1
Aug 02, 2017 34 61 2 2
Jun 29, 2017 41 55 1 2
Jun 07, 2017 35 60 2 3
May 24, 2017 37 57 4 2
May 10, 2017 35 58 4 2
Apr 19, 2017 39 56 3 2
Apr 04, 2017 36 59 3 2
Mar 22, 2017 36 57 5 2
Mar 07, 2017 43 53 3 1
Feb 22, 2017 39 55 4 2
Feb 07, 2017 43 52 3 2
Jan 26, 2017 39 52 6 2
Jan 10, 2017 37 51 8 4
Nov 22, 2016 44 46 6 3
5. Is your opinion of Rex Tillerson favorable, unfavorable or haven't you heard enough
about him?
WHITE......
COLLEGE DEG
Tot Rep Dem Ind Men Wom Yes No
Favorable 31% 45% 18% 33% 34% 28% 39% 32%
Unfavorable 22 8 34 23 23 22 25 16
Hvn't hrd enough 45 46 46 42 42 48 34 50
REFUSED 2 1 2 2 1 2 3 2
AGE IN YRS.............. WHITE.....
18-34 35-49 50-64 65+ Men Wom Wht Blk Hsp
Favorable 5% 25% 39% 44% 38% 33% 35% 13% 17%
Unfavorable 30 24 21 17 20 20 20 26 29
Hvn't hrd enough 65 49 38 36 40 43 42 61 53
REFUSED - 2 2 3 2 3 2 - 1
6. Is your opinion of James Mattis favorable, unfavorable or haven't you heard enough
about him?
WHITE......
COLLEGE DEG
Tot Rep Dem Ind Men Wom Yes No
Favorable 33% 40% 24% 36% 39% 27% 40% 33%
Unfavorable 9 3 14 10 8 10 10 6
Hvn't hrd enough 57 56 61 53 52 62 49 60
REFUSED 1 - 1 1 1 1 1 -
AGE IN YRS.............. WHITE.....
18-34 35-49 50-64 65+ Men Wom Wht Blk Hsp
Favorable 19% 32% 37% 38% 42% 31% 37% 9% 30%
Unfavorable 12 11 9 7 8 9 8 18 4
Hvn't hrd enough 69 57 54 54 49 59 54 73 65
REFUSED - - 1 1 1 1 1 - 1

8
7. Is your opinion of Jeff Sessions favorable, unfavorable or haven't you heard enough
about him?
WHITE......
COLLEGE DEG
Tot Rep Dem Ind Men Wom Yes No
Favorable 22% 45% 6% 19% 27% 17% 26% 26%
Unfavorable 45 17 67 48 43 46 51 33
Hvn't hrd enough 31 36 27 29 27 34 21 37
REFUSED 3 3 1 3 3 2 2 3
AGE IN YRS.............. WHITE.....
18-34 35-49 50-64 65+ Men Wom Wht Blk Hsp
Favorable 8% 19% 29% 27% 31% 21% 26% 6% 14%
Unfavorable 49 47 45 42 41 44 42 60 39
Hvn't hrd enough 43 31 24 28 25 32 29 34 45
REFUSED - 4 2 3 3 3 3 1 2
TREND: Is your opinion of Jeff Sessions favorable, unfavorable or haven't you heard
enough about him?
Fav Unfav HvntHrd REF
Oct 11, 2017 22 45 31 3
Aug 02, 2017 27 41 29 2
Mar 08, 2017 23 43 33 1
8. If the election were today, would you want to see the Republican Party or the
Democratic Party win control of the United States House of Representatives?
WHITE......
COLLEGE DEG
Tot Rep Dem Ind Men Wom Yes No
Republican Party 41% 93% 2% 34% 48% 34% 42% 55%
Democratic Party 49 4 94 46 41 57 51 35
DK/NA 10 3 3 20 11 9 8 10
AGE IN YRS.............. WHITE.....
18-34 35-49 50-64 65+ Men Wom Wht Blk Hsp
Republican Party 26% 39% 48% 44% 54% 42% 48% 6% 35%
Democratic Party 60 49 46 46 37 49 43 83 56
DK/NA 14 12 6 10 9 9 9 10 9
TREND: If the election were today, would you want to see the Republican Party or the
Democratic Party win control of the United States House of Representatives?
Rep Dem
Party Party DK/NA
Oct 11, 2017 41 49 10
Sep 27, 2017 38 47 15
Aug 24, 2017 38 50 11
Aug 17, 2017 40 50 10
Aug 03, 2017 38 52 10
Jun 29, 2017 41 51 9
Jun 08, 2017 39 51 10
May 10, 2017 38 54 8

9
9. If the election were today, would you want to see the Republican Party or the
Democratic Party win control of the United States Senate?
WHITE......
COLLEGE DEG
Tot Rep Dem Ind Men Wom Yes No
Republican Party 43% 93% 4% 37% 50% 35% 43% 55%
Democratic Party 49 5 94 46 40 57 50 35
DK/NA 8 3 2 17 9 7 7 9
AGE IN YRS.............. WHITE.....
18-34 35-49 50-64 65+ Men Wom Wht Blk Hsp
Republican Party 27% 41% 50% 45% 56% 42% 49% 11% 36%
Democratic Party 61 50 45 46 36 49 43 84 55
DK/NA 12 10 5 9 8 8 8 5 9
TREND: If the election were today, would you want to see the Republican Party or the
Democratic Party win control of the United States Senate?
Rep Dem
Party Party DK/NA
Oct 11, 2017 43 49 8
Sep 27, 2017 40 49 12
Aug 24, 2017 40 51 9
Aug 17, 2017 41 51 8
Aug 03, 2017 39 53 8
Jun 29, 2017 41 51 8
Jun 08, 2017 39 52 8
Link to full trend on website
10. In general, how satisfied are you with the way things are going in the nation today;
are you very satisfied, somewhat satisfied, somewhat dissatisfied, or very dissatisfied?
WHITE......
COLLEGE DEG
Tot Rep Dem Ind Men Wom Yes No
Very satisfied 3% 8% - 2% 4% 3% 4% 4%
Smwht satisfied 24 47 4 23 30 19 25 31
Smwht dissatisfied 29 28 27 30 31 26 30 30
Very dissatisfied 43 15 68 45 34 51 41 33
DK/NA 1 2 1 1 1 2 1 2
AGE IN YRS.............. WHITE.....
18-34 35-49 50-64 65+ Men Wom Wht Blk Hsp
Very satisfied 4% 3% 4% 3% 4% 3% 4% 1% 5%
Smwht satisfied 18 28 24 24 34 23 28 7 15
Smwht dissatisfied 35 28 25 29 32 28 30 21 27
Very dissatisfied 43 41 46 42 29 45 37 70 50
DK/NA - - 3 1 1 2 1 1 3

10
TREND: In general, how satisfied are you with the way things are going in the nation
today; are you very satisfied, somewhat satisfied, somewhat dissatisfied, or very
dissatisfied?
Very Smwht Smwht Very
sat sat dis dis DK/NA
Oct 11, 2017 3 24 29 43 1
Sep 27, 2017 2 22 33 41 1
Aug 24, 2017 3 19 27 50 1
Aug 17, 2017 6 26 26 42 1
Aug 03, 2017 5 27 29 39 1
Jun 28, 2017 4 27 26 41 1
Jun 08, 2017 4 25 24 46 2
May 24, 2017 4 29 29 37 2
May 10, 2017 5 28 25 41 1
Apr 19, 2017 7 26 27 38 2
Apr 04, 2017 3 25 27 44 1
Mar 22, 2017 5 26 27 39 2
Mar 07, 2017 6 26 29 37 2
Feb 22, 2017 6 25 28 39 2
Feb 07, 2017 8 24 26 38 3
Jan 26, 2017 6 26 30 36 3
Jan 10, 2017 3 27 35 33 2
Nov 28, 2016 5 22 30 42 2
11. Would you say that Donald Trump - is honest, or not?
WHITE......
COLLEGE DEG
Tot Rep Dem Ind Men Wom Yes No
Yes 40% 80% 8% 35% 45% 34% 38% 53%
No 56 15 90 59 49 62 58 42
DK/NA 5 5 2 6 6 4 4 5
AGE IN YRS.............. WHITE.....
18-34 35-49 50-64 65+ Men Wom Wht Blk Hsp
Yes 25% 43% 41% 43% 51% 39% 45% 15% 25%
No 70 54 54 51 44 56 50 83 68
DK/NA 4 3 5 5 4 5 5 1 7
TREND: Would you say that Donald Trump is honest, or not?
Yes No DK/NA
Oct 11, 2017 40 56 5
Sep 27, 2017 37 59 4
Aug 23, 2017 36 61 4
Aug 17, 2017 37 59 4
Aug 02, 2017 34 62 5
Jun 29, 2017 38 57 5
Jun 07, 2017 36 59 6
May 24, 2017 36 59 5
May 10, 2017 33 61 5
Apr 19, 2017 37 58 5
Apr 04, 2017 34 61 6
Mar 22, 2017 35 60 5
Mar 07, 2017 39 55 6
Feb 22, 2017 40 55 5
Feb 07, 2017 42 54 3
Jan 26, 2017 39 56 5
Jan 10, 2017 39 53 8
Nov 22, 2016 42 52 6

11
12. Would you say that Donald Trump - has good leadership skills, or not?
WHITE......
COLLEGE DEG
Tot Rep Dem Ind Men Wom Yes No
Yes 38% 77% 7% 36% 45% 32% 36% 51%
No 59 22 91 61 53 65 61 48
DK/NA 2 1 2 3 2 3 3 1
AGE IN YRS.............. WHITE.....
18-34 35-49 50-64 65+ Men Wom Wht Blk Hsp
Yes 29% 39% 42% 38% 49% 37% 43% 12% 37%
No 69 58 56 60 49 61 55 84 61
DK/NA 2 4 2 2 2 2 2 4 2
TREND: Would you say that Donald Trump has good leadership skills, or not?
Yes No DK/NA
Oct 11, 2017 38 59 2
Sep 27, 2017 38 60 3
Aug 23, 2017 37 61 2
Aug 17, 2017 39 59 2
Aug 02, 2017 34 63 3
Jun 29, 2017 44 54 2
Jun 07, 2017 39 58 3
May 24, 2017 40 57 3
May 10, 2017 41 56 3
Apr 19, 2017 40 55 4
Apr 04, 2017 40 55 4
Mar 22, 2017 40 55 5
Mar 07, 2017 47 50 4
Feb 22, 2017 42 55 3
Feb 07, 2017 47 50 4
Jan 26, 2017 49 46 5
Jan 10, 2017 49 44 6
Nov 22, 2016 56 38 6
13. Would you say that Donald Trump - cares about average Americans, or not?
WHITE......
COLLEGE DEG
Tot Rep Dem Ind Men Wom Yes No
Yes 44% 87% 7% 42% 51% 37% 43% 61%
No 54 11 92 56 47 61 55 37
DK/NA 2 2 1 2 2 2 2 2
AGE IN YRS.............. WHITE.....
18-34 35-49 50-64 65+ Men Wom Wht Blk Hsp
Yes 25% 47% 48% 48% 58% 45% 51% 10% 28%
No 73 53 50 50 40 53 46 89 72
DK/NA 3 1 1 3 2 2 2 1 -

12
TREND: Would you say that Donald Trump cares about average Americans, or not?
Yes No DK/NA
Oct 11, 2017 44 54 2
Sep 27, 2017 42 56 2
Aug 23, 2017 40 57 3
Aug 17, 2017 42 56 2
Aug 02, 2017 39 59 2
Jun 29, 2017 44 55 2
Jun 07, 2017 40 58 3
May 24, 2017 42 56 2
May 10, 2017 38 59 3
Apr 19, 2017 42 57 2
Apr 04, 2017 39 57 4
Mar 22, 2017 40 57 3
Mar 07, 2017 46 52 3
Feb 22, 2017 44 53 3
Feb 07, 2017 45 52 3
Jan 26, 2017 44 53 3
Jan 10, 2017 44 52 3
Nov 22, 2016 51 45 3
14. Would you say that Donald Trump - is level headed, or not?
WHITE......
COLLEGE DEG
Tot Rep Dem Ind Men Wom Yes No
Yes 29% 60% 4% 27% 35% 24% 26% 41%
No 67 34 94 70 60 72 70 54
DK/NA 4 6 2 3 4 4 3 5
AGE IN YRS.............. WHITE.....
18-34 35-49 50-64 65+ Men Wom Wht Blk Hsp
Yes 14% 29% 34% 33% 39% 28% 34% 8% 21%
No 82 67 64 62 57 68 62 91 73
DK/NA 4 4 2 5 4 4 4 1 6
TREND: Would you say that Donald Trump is level headed, or not?
Yes No DK/NA
Oct 11, 2017 29 67 4
Sep 27, 2017 30 67 3
Aug 23, 2017 29 68 3
Aug 17, 2017 30 67 2
Aug 02, 2017 26 71 3
Jun 29, 2017 34 63 3
Jun 07, 2017 29 68 3
May 24, 2017 31 65 4
May 10, 2017 29 66 5
Apr 19, 2017 33 63 4
Apr 04, 2017 29 66 5
Mar 22, 2017 30 66 4
Mar 07, 2017 34 61 5
Feb 22, 2017 33 63 4
Feb 07, 2017 35 60 5
Jan 26, 2017 33 62 5
Jan 10, 2017 33 62 5
Nov 22, 2016 38 57 5
13
15. Would you say that Donald Trump - is a strong person, or not?
WHITE......
COLLEGE DEG
Tot Rep Dem Ind Men Wom Yes No
Yes 61% 92% 33% 62% 67% 56% 60% 71%
No 35 7 62 35 31 40 38 25
DK/NA 3 1 5 3 2 5 2 4
AGE IN YRS.............. WHITE.....
18-34 35-49 50-64 65+ Men Wom Wht Blk Hsp
Yes 45% 66% 66% 63% 71% 59% 65% 47% 53%
No 49 31 31 33 28 36 32 49 43
DK/NA 6 2 2 3 2 4 3 4 3
TREND: Would you say that Donald Trump is a strong person, or not?
Yes No DK/NA
Oct 11, 2017 61 35 3
Sep 27, 2017 61 37 2
Aug 23, 2017 59 38 2
Aug 17, 2017 61 37 3
Aug 02, 2017 58 39 3
Jun 29, 2017 63 34 3
Jun 07, 2017 62 35 3
May 24, 2017 64 33 2
May 10, 2017 62 35 3
Apr 19, 2017 61 36 3
Apr 04, 2017 64 33 4
Mar 22, 2017 66 30 4
Mar 07, 2017 67 30 3
Feb 22, 2017 64 32 3
Feb 07, 2017 70 26 3
Jan 26, 2017 68 29 4
Jan 10, 2017 71 25 4
Nov 22, 2016 74 23 3
16. Would you say that Donald Trump - is intelligent, or not?
WHITE......
COLLEGE DEG
Tot Rep Dem Ind Men Wom Yes No
Yes 56% 93% 23% 55% 64% 49% 55% 70%
No 40 6 72 40 32 48 42 27
DK/NA 4 1 5 5 4 4 4 3
AGE IN YRS.............. WHITE.....
18-34 35-49 50-64 65+ Men Wom Wht Blk Hsp
Yes 42% 60% 59% 58% 69% 55% 62% 33% 43%
No 52 38 38 38 28 41 34 66 50
DK/NA 6 2 3 4 3 4 4 2 8

14
TREND: Would you say that Donald Trump is intelligent, or not?
Yes No DK/NA
Oct 11, 2017 56 40 4
Sep 27, 2017 55 42 4
Aug 23, 2017 55 43 3
Aug 17, 2017 58 40 2
Aug 02, 2017 55 42 3
Jun 29, 2017 58 39 3
Jun 07, 2017 57 40 3
May 24, 2017 57 40 3
May 10, 2017 56 41 3
Apr 19, 2017 58 38 4
Apr 04, 2017 60 35 5
Mar 22, 2017 59 36 5
Mar 07, 2017 64 32 4
Feb 22, 2017 58 38 4
Feb 07, 2017 65 31 4
Jan 26, 2017 65 32 3
Jan 10, 2017 68 27 5
Nov 22, 2016 74 21 4
17. Would you say that Donald Trump - is someone who shares your values, or not?
WHITE......
COLLEGE DEG
Tot Rep Dem Ind Men Wom Yes No
Yes 37% 79% 4% 31% 43% 30% 34% 51%
No 60 18 95 64 53 67 63 45
DK/NA 3 3 1 5 4 3 3 4
AGE IN YRS.............. WHITE.....
18-34 35-49 50-64 65+ Men Wom Wht Blk Hsp
Yes 20% 34% 41% 44% 49% 36% 42% 12% 26%
No 77 61 56 55 48 61 54 88 73
DK/NA 3 5 3 1 4 3 4 - 1
TREND: Would you say that Donald Trump is someone who shares your values, or not?
Yes No DK/NA
Oct 11, 2017 37 60 3
Sep 27, 2017 36 61 3
Aug 23, 2017 34 63 3
Aug 17, 2017 37 61 2
Aug 02, 2017 34 63 3
Jun 29, 2017 38 59 3
Jun 07, 2017 33 64 3
May 24, 2017 36 62 2
May 10, 2017 32 64 4
Apr 19, 2017 35 61 4
Apr 04, 2017 34 61 5
Mar 22, 2017 35 61 4
Mar 07, 2017 38 58 4
Feb 22, 2017 37 60 3
Feb 07, 2017 38 58 4
Link to full trend on website

15
18. Do you think Donald Trump is fit to serve as president, or not?
WHITE......
COLLEGE DEG
Tot Rep Dem Ind Men Wom Yes No
Yes 43% 87% 5% 41% 53% 34% 43% 59%
No 55 12 93 57 45 64 55 40
DK/NA 2 1 2 2 2 2 2 2
AGE IN YRS.............. WHITE.....
18-34 35-49 50-64 65+ Men Wom Wht Blk Hsp
Yes 28% 45% 46% 46% 59% 42% 50% 5% 33%
No 70 53 53 52 40 56 48 95 67
DK/NA 2 2 1 2 1 3 2 1 -
TREND: Do you think Donald Trump is fit to serve as president, or not?
Yes No DK/NA
Oct 11, 2017 43 55 2
Sep 27, 2017 42 56 2
19. Do you feel that Donald Trump is doing more to unite the country as president, or
doing more to divide the country as president?
WHITE......
COLLEGE DEG
Tot Rep Dem Ind Men Wom Yes No
Unite 37% 78% 3% 33% 43% 31% 34% 52%
Divide 58 18 95 59 52 65 61 43
DK/NA 5 5 2 8 6 4 5 5
AGE IN YRS.............. WHITE.....
18-34 35-49 50-64 65+ Men Wom Wht Blk Hsp
Unite 21% 38% 41% 39% 48% 38% 43% 6% 27%
Divide 73 58 55 56 47 58 52 92 67
DK/NA 6 4 4 5 6 4 5 2 6
TREND: Do you feel that Donald Trump is doing more to unite the country as President, or
doing more to divide the country as President? (* "will do more")
Unite Divide DK/NA
Oct 11, 2017 37 58 5
Sep 27, 2017 35 60 5
Aug 23, 2017 31 62 7
Apr 19, 2017 36 59 6
Apr 04, 2017 34 61 6
Mar 07, 2017 39 56 5
Feb 22, 2017 36 58 6
Feb 07, 2017 37 58 5 *
Jan 26, 2017 40 55 5 *
Jan 10, 2017 40 54 6 *
Nov 22, 2016 47 49 5 *

16
20. Does having Donald Trump as President of the United States make you feel more safe,
less safe, or doesn't it have an impact on how safe you feel?
WHITE......
COLLEGE DEG
Tot Rep Dem Ind Men Wom Yes No
More safe 30% 66% 2% 25% 36% 23% 27% 43%
Less safe 49 11 86 49 38 59 52 32
No impact 21 22 12 26 26 17 20 25
DK/NA - 1 - - 1 - 1 -
AGE IN YRS.............. WHITE.....
18-34 35-49 50-64 65+ Men Wom Wht Blk Hsp
More safe 13% 29% 33% 35% 41% 29% 35% 4% 19%
Less safe 54 49 48 48 33 52 42 81 65
No impact 33 21 18 16 26 19 23 13 15
DK/NA - - 1 - 1 - - 1 1
TREND: Does having Donald Trump as President of the United States make you feel more
safe, less safe, or doesn't it have an impact on how safe you feel?
More Less No
Safe Safe Impact DK/NA
Oct 11, 2017 30 49 21 -
Aug 23, 2017 28 52 19 -
21. Do you think that President Trump's comments on the NFL protests were appropriate, or
not?
WHITE......
COLLEGE DEG
Tot Rep Dem Ind Men Wom Yes No
Yes/Appropriate 34% 67% 5% 33% 41% 27% 32% 46%
No 58 21 91 61 52 65 61 45
DK/NA 8 12 4 6 8 8 7 9
AGE IN YRS.............. WHITE.....
18-34 35-49 50-64 65+ Men Wom Wht Blk Hsp
Yes/Appropriate 16% 33% 40% 38% 44% 33% 39% 7% 29%
No 73 58 56 54 49 57 53 88 64
DK/NA 11 10 5 9 7 10 8 5 7

17
22. Would you describe the state of the nation's economy these days as excellent, good,
not so good, or poor?
WHITE......
COLLEGE DEG
Tot Rep Dem Ind Men Wom Yes No
Excellent 9% 18% 2% 8% 12% 6% 10% 11%
Good 52 63 38 55 59 45 61 50
Not so good 28 13 44 28 22 34 22 27
Poor 9 5 13 8 6 13 5 9
DK/NA 2 1 3 1 1 2 1 3
AGE IN YRS.............. WHITE.....
18-34 35-49 50-64 65+ Men Wom Wht Blk Hsp
Excellent 6% 10% 9% 11% 14% 8% 11% 2% 7%
Good 43 53 54 51 61 51 56 30 43
Not so good 35 30 26 26 20 30 25 50 34
Poor 14 7 10 8 5 9 7 16 15
DK/NA 3 - 2 3 1 3 2 1 1
TREND: Would you describe the state of the nation's economy these days as excellent,
good, not so good, or poor?
Not so
Exclnt Good Good Poor DK/NA
Oct 11, 2017 9 52 28 9 2
Aug 17, 2017 7 55 26 10 2
Jun 28, 2017 4 50 33 12 1
May 10, 2017 3 53 29 14 2
Apr 20, 2017 4 49 31 14 2
Apr 04, 2017 4 48 32 13 2
Mar 22, 2017 3 56 28 11 1
Mar 07, 2017 4 51 33 10 2
Feb 22, 2017 5 55 26 12 2
Jan 10, 2017 4 42 34 19 2
Nov 28, 2016 2 37 37 23 1
Link to full trend on website
23. Would you describe your financial situation these days as excellent, good, not so
good, or poor?
WHITE......
COLLEGE DEG
Tot Rep Dem Ind Men Wom Yes No
Excellent 12% 18% 7% 12% 14% 10% 17% 10%
Good 61 69 55 61 64 58 69 61
Not so good 20 9 28 19 15 24 11 19
Poor 6 3 8 6 6 7 2 8
DK/NA 1 1 2 1 1 2 - 2
AGE IN YRS.............. WHITE.....
18-34 35-49 50-64 65+ Men Wom Wht Blk Hsp
Excellent 6% 12% 12% 15% 15% 13% 14% 3% 12%
Good 61 65 58 61 67 63 65 43 49
Not so good 24 17 21 17 13 18 15 42 28
Poor 8 4 7 6 5 4 5 12 10
DK/NA 1 1 1 1 1 2 1 - 1

18
TREND: Would you describe your financial situation these days as excellent, good, not so
good, or poor?
Not so
Exclnt Good Good Poor DK/NA
Oct 11, 2017 12 61 20 6 1
Aug 17, 2017 13 61 17 7 2
Jun 28, 2017 15 62 14 8 2
May 10, 2017 13 60 19 7 1
Apr 20, 2017 13 63 17 7 1
24. Do you approve or disapprove of the way Donald Trump is handling - the economy?
WHITE......
COLLEGE DEG
Tot Rep Dem Ind Men Wom Yes No
Approve 48% 89% 10% 49% 58% 39% 51% 61%
Disapprove 46 8 82 46 36 55 42 34
DK/NA 6 2 8 5 5 6 7 5
AGE IN YRS.............. WHITE.....
18-34 35-49 50-64 65+ Men Wom Wht Blk Hsp
Approve 33% 52% 51% 51% 64% 47% 56% 15% 34%
Disapprove 57 44 45 43 31 45 38 81 57
DK/NA 11 4 4 6 5 7 6 4 9
TREND: Do you approve or disapprove of the way Donald Trump is handling the economy?
App Dis DK/NA
Oct 11, 2017 48 46 6
Sep 27, 2017 48 44 8
Aug 24, 2017 45 49 6
Aug 17, 2017 46 46 7
Aug 02, 2017 41 52 7
Jun 29, 2017 45 49 6
Jun 07, 2017 39 53 8
May 24, 2017 44 50 6
May 10, 2017 40 52 8
Apr 19, 2017 42 49 10
Apr 04, 2017 41 48 11
Mar 22, 2017 42 48 10
Mar 07, 2017 49 41 11
Feb 22, 2017 47 41 13
Feb 07, 2017 44 41 14

19
25. Do you approve or disapprove of the way Donald Trump is handling - foreign policy?
WHITE......
COLLEGE DEG
Tot Rep Dem Ind Men Wom Yes No
Approve 38% 80% 4% 36% 47% 30% 37% 53%
Disapprove 58 17 94 59 50 66 60 44
DK/NA 4 2 2 5 3 4 4 3
AGE IN YRS.............. WHITE.....
18-34 35-49 50-64 65+ Men Wom Wht Blk Hsp
Approve 21% 41% 44% 41% 53% 36% 45% 8% 25%
Disapprove 75 56 55 54 45 59 52 90 70
DK/NA 4 3 1 5 2 5 3 2 6
TREND: Do you approve or disapprove of the way Donald Trump is handling foreign policy?
App Dis DK/NA
Oct 11, 2017 38 58 4
Sep 27, 2017 38 57 5
Aug 24, 2017 38 58 4
Aug 17, 2017 39 58 3
Aug 02, 2017 36 59 5
Jun 29, 2017 38 57 5
Jun 08, 2017 35 60 5
May 24, 2017 38 56 7
May 10, 2017 36 59 6
Apr 19, 2017 40 56 4
Apr 04, 2017 33 58 9
Mar 22, 2017 34 58 7
Mar 07, 2017 38 54 8
Feb 22, 2017 36 56 7
Feb 07, 2017 38 56 6
26. Do you approve or disapprove of the way Donald Trump is handling - terrorism?
WHITE......
COLLEGE DEG
Tot Rep Dem Ind Men Wom Yes No
Approve 48% 89% 9% 48% 59% 38% 47% 63%
Disapprove 46 8 82 47 36 55 47 32
DK/NA 6 3 9 5 5 7 6 5
AGE IN YRS.............. WHITE.....
18-34 35-49 50-64 65+ Men Wom Wht Blk Hsp
Approve 35% 49% 52% 50% 63% 46% 55% 18% 39%
Disapprove 56 44 44 43 32 48 40 73 55
DK/NA 9 6 3 7 5 6 5 9 6

20
TREND: Do you approve or disapprove of the way Donald Trump is handling terrorism?
App Dis DK/NA
Oct 11, 2017 48 46 6
Sep 27, 2017 47 45 8
Aug 24, 2017 46 49 4
Aug 17, 2017 47 48 5
Aug 02, 2017 46 47 7
Jun 29, 2017 47 47 6
Jun 07, 2017 46 48 7
May 24, 2017 47 45 8
May 10, 2017 45 48 7
Apr 19, 2017 44 51 5
Apr 04, 2017 42 49 10
Mar 22, 2017 42 50 8
Mar 07, 2017 45 46 9
Feb 22, 2017 44 49 7
Feb 07, 2017 44 49 7
27. Do you approve or disapprove of the way Donald Trump is handling - immigration
issues?
WHITE......
COLLEGE DEG
Tot Rep Dem Ind Men Wom Yes No
Approve 39% 81% 6% 36% 47% 32% 37% 55%
Disapprove 56 15 91 61 49 64 58 41
DK/NA 4 4 4 4 4 4 5 3
AGE IN YRS.............. WHITE.....
18-34 35-49 50-64 65+ Men Wom Wht Blk Hsp
Approve 19% 45% 44% 42% 53% 39% 46% 11% 23%
Disapprove 77 51 53 53 43 57 50 86 73
DK/NA 4 4 3 5 4 5 4 3 5
TREND: Do you approve or disapprove of the way Donald Trump is handling immigration
issues?
App Dis DK/NA
Oct 11, 2017 39 56 4
Sep 27, 2017 38 59 3
Aug 24, 2017 40 58 2
Aug 17, 2017 43 56 2
Aug 02, 2017 38 59 3
Jun 29, 2017 42 56 3
Jun 07, 2017 37 60 3
May 24, 2017 41 57 3
May 10, 2017 35 62 3
Apr 19, 2017 39 58 2
Apr 04, 2017 39 57 4
Mar 22, 2017 38 60 3
Mar 07, 2017 41 56 3
Feb 22, 2017 40 58 2
Feb 07, 2017 41 56 3

21
28. Do you approve or disapprove of the way Donald Trump is handling - race relations?
WHITE......
COLLEGE DEG
Tot Rep Dem Ind Men Wom Yes No
Approve 35% 77% 2% 32% 41% 30% 31% 51%
Disapprove 59 18 94 62 54 64 62 43
DK/NA 6 5 4 6 5 6 7 6
AGE IN YRS.............. WHITE.....
18-34 35-49 50-64 65+ Men Wom Wht Blk Hsp
Approve 18% 35% 41% 39% 46% 36% 41% 8% 26%
Disapprove 77 60 55 53 49 57 53 92 67
DK/NA 5 5 4 8 5 7 6 - 7
TREND: Do you approve or disapprove of the way Donald Trump is handling race relations?
App Dis DK/NA
Oct 11, 2017 35 59 6
Sep 27, 2017 32 62 6
Aug 23, 2017 31 63 6
29. Do you approve or disapprove of the way Donald Trump is handling - taxes?
WHITE......
COLLEGE DEG
Tot Rep Dem Ind Men Wom Yes No
Approve 37% 78% 5% 33% 44% 30% 37% 50%
Disapprove 49 10 82 50 42 55 50 34
DK/NA 14 12 13 17 14 14 13 16
AGE IN YRS.............. WHITE.....
18-34 35-49 50-64 65+ Men Wom Wht Blk Hsp
Approve 21% 39% 42% 39% 49% 37% 43% 12% 21%
Disapprove 64 47 45 45 37 48 42 77 65
DK/NA 16 15 13 15 14 15 15 10 14
TREND: Do you approve or disapprove of the way Donald Trump is handling - taxes?
App Dis DK/NA
Oct 11, 2017 37 49 14
May 11, 2017 34 54 13

22
37. As you may know, some athletes and teams in the NFL are choosing to kneel during the
national anthem as a form of protest. Do you approve or disapprove of this form of
protest?
WHITE......
COLLEGE DEG
Tot Rep Dem Ind Men Wom Yes No
Approve 43% 8% 75% 45% 39% 48% 45% 28%
Disapprove 52 89 20 51 57 48 52 68
DK/NA 4 2 5 4 5 4 3 4
AGE IN YRS.............. WHITE.....
18-34 35-49 50-64 65+ Men Wom Wht Blk Hsp
Approve 66% 44% 38% 34% 34% 39% 37% 79% 46%
Disapprove 27 53 59 62 62 57 60 18 45
DK/NA 7 3 3 4 4 4 4 3 9
50. As president, do you think Donald Trump should continue tweeting from his personal
Twitter account, or not?
WHITE......
COLLEGE DEG
Tot Rep Dem Ind Men Wom Yes No
Yes/Should 27% 45% 9% 28% 34% 20% 27% 32%
No 70 53 88 68 63 77 70 64
DK/NA 3 3 3 3 3 3 3 4
AGE IN YRS.............. WHITE.....
18-34 35-49 50-64 65+ Men Wom Wht Blk Hsp
Yes/Should 21% 24% 30% 25% 37% 22% 30% 12% 16%
No 74 74 68 71 60 74 67 87 81
DK/NA 5 2 1 4 3 4 3 - 3
TREND: As president, do you think Donald Trump should continue tweeting from his personal
Twitter account, or not?
Yes No DK/NA
Oct 11, 2017 27 70 3
Sep 27, 2017 26 69 4
Aug 23, 2017 28 69 4
Aug 17, 2017 31 66 3
Aug 02, 2017 27 69 4
Jun 29, 2017 32 61 7
May 10, 2017 33 61 6
Apr 19, 2017 28 68 4