u.s. vulnerability to an oil import curtailment (part 6 of 10)
TRANSCRIPT

Chapter IV
Fuel Switching
Contents
PageIntroduction. . . . . . . . . . . . . . . . . . . . . . . . . . . . . 57
Options Considered . . . . . . . . . . . . . . . . . . . . . . 58
Technologies . . . . . . . . . . . . . . . . . . . . . . . . . . . . 59Electric Heat Pumps . . . . . . . . . . . . . . . . . . . . . 59Conversion to Solid Fuels . . . . . . . . . . . . . . . . 60Ethanol . . . . . . . . . . . . . . . . . . . . . . . . . . . . . . . 62Compressed Natural Gas in Motor Vehicles . 64Liquefied Petroleum Gas in Motor Vehicles . 64Mobile Gasifiers . . . . . . . . . . . . . . . . . . . . . . . . 66
Fuel and Grain Supplies . . . . . . . . . . . . . . . . . . . 67Coal . . . . . . . . . . . . . . . . . . . . . . . . . . . . . . . . . 68Wood and Other Solid Biomass . . . . . . . . . . . 69Natural Gas . . . . . . . . . . . . . . . . . . . . . . . . . . . 70Liquefied Petroleum Gas . . . . . . . . . . . . . . . . . 71Enhanced Oil Recovery . . . . . . . . . . . . . . . . . . 71Grain . . . . . . . . . . . . . . . . . . . . . . . . . . . . . . . . . 73
Deployment of Fuel Switching Technologies 75Electric Utilities . . . . . . . . . . . . . . . . . . . . . . . . 78
PageResidential and Commercial Space Heat and
Hot Water, . . . . . . . . . . . . . . . . . . . . . . . . . . 83Industrial Boilers . . . . . . . . . . . . . . . . . . . . . . . 86Mobile Engines. . . . . . . . . . . . . . . . . . . . . . . . . 89Summary . . . . . . . . . . . . . . . . . . . . . . . . . . . . . . 93
Environmental Impacts . . . . . . . . . . . . . . . . . . . . 93
Appendix A–Reasons for Excluding Various OilReplacement Technologies FromDetailed Consideration. . . . . . . . . . . . . . . . . 94
Fossil Synthetic Fuels . . . . . . . . . . . . . . . . . . . . 94Active Solar Systems . . . . . . . . . . . . . . . . . . . . 95Photovoltaics . . . . . . . . . . . . . . . . . . . . . . . . . . 95Electricity From Wind . . . . . . . . . . . . . . . . . . . 96Solar Thermal Electric Generation . . . . . . . . . 96Electric Vehicles. . . . . . . . . . . . . . . . . . . . . . . . 96Ethanol From Food Processing Wastes . . . . . . 96
Appendix B–Addition Considerations RegardingEthanol’s Net Energy Balance ., , . . . . . . . . 96

TABLES
Table No. Page6.
7.
8.
9.
10
11.
12.
13.
14.
15.
16.
Oil Replacement Technologies Selected forScreening Evaluation . . . . . . . . . . . . . . . . . . . 58Categories of Oil Replacement TechnologiesEvaluated in Detail . . . . . . . . . . . . . . . . . . . . 58Potential Wood Energy Production byRegion, Assuming 10 QuadrillionBtu/yr Increment . . . . . . . . . . . . . . . . . . . . . . 70Estimated 1985 Oil Consumption byRegion and End Use. . . . . . .. ... . . . . . . 77Electric Generating Capacity of FacilitiesConverted From Oil to Coal and NewGenerating Capacity Scheduled forCompletion Between 1985 and 1990 . . . . . 81Potential Utility Oil Consumption WithConversion to Natural Gas and Coal. . . . . . 82Potential Increase in Natural Gas Use forSpace Heating and Hot Water. . . . . . . . . . . 84Potential Reduction in Oil Use in theResidential and Commercial SectorsThrough Conversion to Natural Gas,Electricity, and Solid Fuels . . . . . . . . . . . . . . 84Potential Reduction in Oil Used inIndustrial Boilers Through Conversionto Solid Fuels and Natural Gas . . . . . . . . . . 88Potential Reduction in Fuel Use inSurface Transportation andMobile Industrial Engines . . . . . . . . . . . . . . . 91Summary of Potential Reduction inOil Use Through Fuel Switching . . . . . . . . . 93
FIGURES
Figure No. Page18. Principle of an Electric Heat Pump . . . . . . . 5919. Coal Gasification Plant–Block
Flow Diagram . . . . . . . . . . . . . . . . . . . . . . . . 60
Figure No. Page20.
21.
22.23.24.
25.26.
27.
28.
29.
30.
31
32.
33.
34,
Schematic Flow Diagram of a Coal-Water -
Mixture Preparation Plant. . . . . . . . . . . . . . . 61Process Diagram for the Production ofFuel Ethanol From Grain . . . . . . . , . . . , . . . 63Components of CNG Vehicle Conversion. . 65Components of LPG Vehicle Conversion . . 66Basic Elements of the MobileGasifier-Engine System . . . . . . . , . . . . . . . . . 68Federal Regions . . . . . . . . . . . . . . . . . . . . . . . 70Schedule for Accelerated EOR C02
Flooding Project . . . . . . . . . . . . . . . . . . . . . . 72Schedule for Accelerated EORSteam Flooding Project . . . . . . . . . . . . . . . . . 73Potential Oil Production Rate forEnhanced Oil Recovery ., . . . . . . . . . . . . . . 74Schedule for Engineering andConstruction: Utility Boiler Conversionto CWM-Firing. . . . . . . . . . . . . . . . . . . . . . . . 80Schedule for Engineering andConstruction: Central CWM PreparationPlant for Industrial Boilers . . . . . . . . . . . . . . 80Potential Nonoil-Fired Electric GeneratingCapacity and 1990 Peak ElectricDemand for Selected Regions . . . . . . . . . . . 82Schedule for Engineering and Construction:Coal- or Wood-Firing Steam GeneratingSystem, Fuel-Handling Facilities, andParticulate Control System . . . . . . . . . . . . . . 87Schedule for Engineering andConstruction: Industrial BoilerConversion to Solid Fuels. . . . . . . . . . . . . . . 88Schedule for Engineering andConstruction of a 50 Million Gal/yrEthanol Plant , ., ., , , . . . . . . . . . . . . . . . . . . 91
Chapter IV
Fuel Switching
INTRODUCTION
Fuel use patterns in the United States havechanged several times in the past 150 years. Dur-ing the late 1800s, coal overtook wood as theprincipal fuel; and in this century oil and thennatural gas use surpassed coal consumption.
In more recent years, however, the trend
towards more oil and gas use has been reversed,at least temporarily. Between 1978 and 1982, oiluse in the electric utility sector, as a percent oftheir total energy consumption, dropped from 17percent in 1978 to 7 percent in 1982, while gasuse remained relatively constant. Because elec-tricity sales remained nearly constant, the dropin oil use was accompanied by an increase in coalconsumption and, to a lesser extent, increasedgeneration from hydroelectric facilities. (Nuclearpower output remained nearly constant duringthe period.1)
At the same time, residential and commercialconsumption of oil, as a percent of total energyuse (including wood2), dropped from 1s percentin 1978 to 9 percent in 1982, while natural gas’sshare of total consumption remained relativelyconstant. The drop in oil use was accompaniedby an increase in electricity and, to a lesser ex-tent, wood consumption.
Fuel use patterns in the industrial and transpor-tation sectors, on the other hand, remained rela-tively constant during this period. In the indus-trial sector, oil and gas use, as a percent of totalenergy consumption, dropped by about 1 per-centage point each between 1978 and 1982. Thetransportation sector remained primarily depend-
1 “Monthly Energy Review, ” Energy Information Administration,
DOE/ElA-0035(83/10), October 1983.“’Estimates of Wood Energy Consumption From 1949 to 1981 ,“
Energy Information Administration, DOE/EIA-0341, August 1982.
ent on petroleum (except for natural gas used topump gas through pipelines), although the useof natural gas and ethanol in cars and trucks in-creased slightly.
In all, petroleum consumption dropped from47 percent of the total U.S. energy consumptionin 1978 to 41 percent in 1982. Natural gas’ shareremained constant at 25 percent and coal’s shareincreased from 17 to 21 percent in this period.The remainder was made up primarily of smallincreases in the shares of hydroelectric and nu-clear generation and wood. These changes in themix of fuels used, defined as “fuel switching, ”together with increased efficiency and reduceddemand for energy services lowered U.S. de-mand for petroleum from 18.8 million barrels perday (MMB/D) in 1978 to 15.3 MMB/D in 1982,or about 19 percent.
In the event of a large oil shortfall, continuedand accelerated fuel switching away from oil willbe an important means of restoring the energyservices formerly supplied by oil. Fuel switchingoften involves installation of new equipment, mayrequire expansion of alternative fuel delivery sys-tems, and always involves increased supplies ofthe alternative fuel.
In this chapter OTA considers several types offuel switching in order to estimate their poten-tial for replacing the petroleum lost in an oil short-fall. The next two sections summarize the fuelswitching options examined and describe someof the technologies involved. Fuel supply con-straints, including the potential for enhanced oilrecovery, are then analyzed, followed by esti-mates of the rates that various technologies canbe deployed. The chapter concludes with a briefsummary of environmental impacts.
57
37-833 0 - 84 - 5

58 . U.S. Vulnerability to an Oil Import Curtailment: The Oil Replacement Capability
OPTIONS CONSIDERED
The oil replacement potential through fuelswitching was assessed in a two-stage process.First a comprehensive list of major near-term fuelswitching options (table 6) was screened to iden-tify those options with the greatest potential forreplacing large quantities of oil in a relatively shortperiod of time. The options surviving the screen-ing process were then examined in detail to esti-mate more precisely the quantities of oil that eachcould replace and the rate at which the technol-ogies could be deployed.
For the purposes of this study, the options thatwere eliminated from further consideration werethose that seemed least likely to be able to re-place more than about 0.2 MMB/D of petroleumwithin 5 years after the onset of an oil shortfall
Table 6.—Oil Replacement Technologies Selectedfor Screening Evaluation
Energy supply/technology-description Remarks/examplesNatural gas in buildings,
industries and electricutilities
Electricity in buildings
Coal and/or wood inbuildings
Coal and solid wastes inindustries and electricutilities
Coal-liquid mixtures
Coal gasification
Coal liquefactionOil shale, tar sandsSolar energy
Wood in industries andelectric utilities
Biomass liquid fuels intransportation
Natural gas and LPG intransportation
Electricity in transportationMobile coal and wood
gasifiers fortransportation
Enhanced oil recoveryIncreased natural gas
production storage anddelivery
Switch over from distillate/residual fuel oil tonatural gas
Use of heat pumps,resistance heaters andspace heaters
—
Direct firing of coal
Coal-oil, coal-watermixtures
Low- and medium-Btugasification
Use in buildings,industries and electricutilities
Direct-firing bothsectors; gasification inindustries
Use of ethanol from corn
——
——
—SOURCE: Office of Technology Assessment
beginning in 1985. Although most of the optionslisted in table 6 could replace significant quanti-ties of oil if sufficient resources were devoted todeploying them, and some of the options elimi-nated could be important in specific localities,the screening process identified options most like-ly to be used extensively throughout the coun-try. Some of the options eliminated and the spe-cific reasons for eliminating them are given inappendix A to this chapter.
The remaining fuel switching technologies,grouped into the aggregated categories whichhave been considered in more detail, are listedin table 7. The major options involve convertingstationary uses of oil to electricity, natural gas,coal, and solid biomass. These fuels can also beused as replacements for liquid fuels in the trans-portation sector, but the constraints are consid-erably more severe than for stationary oil uses.3
Ethanol from grain is also included for more de-tailed consideration, because it is a well-estab-lished technology that produces a high-grade liq-uid fuel, the Ieadtime for constructing distilleriesis normally less than 3 years, and the distillerydoes not need to depend directly on oil or natu-ral gas as a fuel.
3Electric vehicles were also eliminated from detailed Considersra-tion because of the severity of these constraints.
Table 7.—Categories of Oil ReplacementTechnologies Evaluated in Detail
Sector Technologies
Electric utilities Conversions to solid fuelsand natural gas
Completion of newgenerating facilitiescurrently underconstruction
Residential and commercial Conversion to natural gas,space heat and hot electricity, and solidwater fuels
Industry Conversion of boilers tosolid fuels and naturalgas
Transportation Conversion to compressednatural gas, liquefiedpetroleum gas, and solidfuels (with mobilegasifiers)
Increased ethanolproduction
All Enhanced oil recoverySOURCE: Office of Technology Assessment.

Ch. IV—Fuel Switching • 59
TECHNOLOGIES
Several of the fuel switching technologies, suchas conversion to natural gas, are widely under-stood and wiII not be considered i n this section.Others, however, require some explanation; andthey are described below in order to provide anunderstanding of some of the factors that affectpotential oil replacement through fuel switching.
Electric Heat Pumps
Heat pumps are devices for space heating4 thatare based on the fact that the temperature ofmany gases increases when they are compressed,and their temperature drops when they are de-compressed. The heat pump works by circulatinga gas through a tube that runs partly inside andpartly outside of the building that is being heated(see fig. 18). The gas is compressed in the partof the tube that is inside the building so that itis hotter than the inside air and releases heat tothat air. The gas is decompressed in the part ofthe tube outside the building so that it is colderthan and absorbs heat from the outside air. Thenet result is that heat has been transferred or“pumped” from the outside air to the inside air.(Obviously, by running the pump in reverse–compressing the gas in the tube outside of thebuilding and decompressing it in the inside partof the tube-heat can be pumped out of thebuilding, and the device becomes an air-condi-tioner, )
As long as the difference between the insideand outside air temperatures is not too great, aheat pump can pump more energy in the formof heat into a building than is consumed in theform of electricity to run the device. Its efficiency,or heat delivered to the inside air divided by theenergy consumed to run the device, can then begreater than 100 percent. However, when theoutside temperature drops, the efficiency alsodrops; and below certain outside temperatures,usually around 200 to 300 F, it is more efficientto use electric resistance heating (which has anefficiency of 90 to 100 percent). Consequently,heat pumps are usually equipped with electric—.—. --— ——
4Heat pumps can also be used for hot water heating, but onlyspace heating IS described here.
Figure 18.—Principle of an Electric Heat Pump
The function of most heat pumps is based on the fact that thetemperature of most fluids rises when the fluid is compressed andfalls when the pressure on the fluid is reduced,a
In the above diagram the fluid in the tube is compressed by amechanical pump (A) as it enters the building. This raises the fluid’stemperature to a level that is above the inside air temperature, caus-ing heat to flow from the working fluid into the air inside the building(B), The fluid then passes through the constriction (C) as it leaves thebuilding, causing the pressure on the fluid to drop. The apparatus isdesigned so that the pressure drop is sufficient to cool the fluid toa temperature which is below the outside air temperature, causingheat to flow from the outside air into the working fluid (D), The proc-ess is then repeated.
aA common example of this occurs in bicycle pumps. When air is compressedin the pump to fill a bicycle tire, the air’s temperature rises causing the pumpto become hot
SOURCE: Office of Technology Assessment.
resistance heaters, which are used when the out-side temperature is low. Nevertheless, practicalheat pumps, which are not designed to doubleas air-conditioners in the summer, can usuallyachieve an overall efficiency of about 200 per-cent. Designing heat pumps for both heating andcooling involves some design tradeoffs, which re-duce overall heating efficiency to about 150percent.
By way of comparison, oil heating has an effi-ciency of about 65 percent. Consequently, an ef-
60 ● U.S. Vulnerability to an Oil Import Curtailment: The Oil Replacement Capability
ficient heat pump requires about one-third asmuch energy (in the form of electricity) as an oilfurnace requires (in the form of oil) to deliver thesame amount of heat. As long as the electricityis generated from nonpremium fuels (i.e., coal,nuclear, or hydroelectric), the heat pump is anattractive alternative for replacing premium fuels.if, however, the electricity is generated with nat-ural gas or oil, for which the efficiency of con-verting fuel to electricity is about 32 percent, thispotential gain in premium fuel replacement islost, since it would require at least as much oilor gas to produce the electricity as would be re-placed by the heat pump. Consequently, in termsof oil replacement, heat pumps are attractive onlywhere marginal electricity is generated from fuelsother than oils
5lf the oil used for electric generation is residual fuel oil, the situ-ation is somewhat more complicated. Upgrading residual oil to mid-dle distillates and gasoline is only about 70 percent efficient (Pur-vin & Gertz, Inc., “An Analysis of Potential for Upgrading DomesticRefining Capacity, ” prepared for the American Gas Association,1980). Consequently, in principle, some increase in the suppliesof refined liquid fuels could be achieved by burning residual oilfor electricity and using the electricity for heat pumps to replace
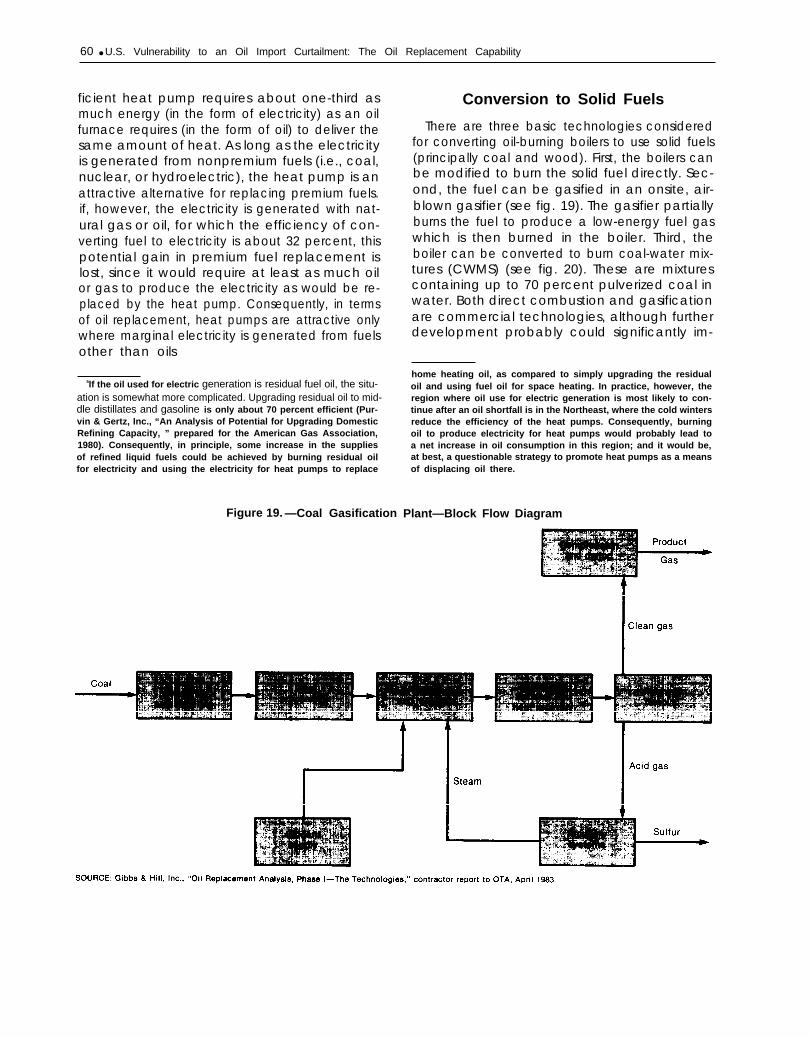
Figure 19. —Coal Gasification
Conversion to Solid Fuels
There are three basic technologies consideredfor converting oil-burning boilers to use solid fuels(principally coal and wood). First, the boilers canbe modified to burn the solid fuel directly. Sec-ond, the fuel can be gasified in an onsite, air-blown gasifier (see fig. 19). The gasifier partiallyburns the fuel to produce a low-energy fuel gaswhich is then burned in the boiler. Third, theboiler can be converted to burn coal-water mix-tures (CWMS) (see fig. 20). These are mixturescontaining up to 70 percent pulverized coal inwater. Both direct combustion and gasificationare commercial technologies, although furtherdevelopment probably could significantly im-
home heating oil, as compared to simply upgrading the residualoil and using fuel oil for space heating. In practice, however, theregion where oil use for electric generation is most likely to con-tinue after an oil shortfall is in the Northeast, where the cold wintersreduce the efficiency of the heat pumps. Consequently, burningoil to produce electricity for heat pumps would probably lead toa net increase in oil consumption in this region; and it would be,at best, a questionable strategy to promote heat pumps as a meansof displacing oil there.
Plant—Block Flow Diagram

Ch. IV—Fuel Switching ● 6 1
Figure 20.—Schematic Flow Diagram of a Coal-Water Mixture Preparation Plant
Coal from
crusher house
CWM mix tankBurner pump
Recirculating pump
SOURCE: Gibbs & Hill, Inc., “Oil Replacement Analysis, Phase l—The Technologies,” contractor report to OTA, April 1983.
prove the gasifiers. CWM technologies are cur-rently being tested, and they are likely to be com-mercial by 1985,
All three technologies require the installationof ash recovery and disposal systems and partic-ulate control systems (to reduce particulate emis-sions) at the boiler site. Direct combustion andair gasification also require solid fuel storage andhandling facilities at or near the boiler site.CWMs, however, can be prepared at off-siteCWM plants. Because the CWM is a liquid, muchof the oil storage and metering system can beused for the CWM after various valves and pumpshave been replaced. This is a principal advantageof CWMs over the other technologies because
it reduces the space requirements for conversionto the use solid fuel.
Converting boilers to solid fuels often leads toa derating of the boiler—i. e., the boiler’s maxi-mum steam output per unit time is reduced. Thisresults from various combinations of: 1 ) the needto reduce the speed with which the combustiongases pass through the heat exchanger in orderto reduce the abrasive effects of the ash containedin these gases, 2) lower flame temperatures, and3) larger combustion gas volumes (as comparedto oil or natural gas). Depending on the boilerdesign, the derating can range from negligibleamounts to over 50 percent of the output beforethe conversion. Where the derating is large, con-

62 Ž U.S. Vulnerability to an Oil Import Curtailment: The Oil Replacement Capability
version to solid fuels would be less attractive andthe end users may require the installation of ad-ditional solid fuel boilers in order to make up thelost steam output.
In the utility sector, there are three basic typesof boilers, and each type requires somewhat dif-ferent modifications. First are the boilers that wereoriginally designed for coal but were subsequent-ly converted to oil. (These are usually the easiestto reconvert to coal and generally experience thesmallest debating. ) The oil-designed boilers areof two types, called type 1 and type 2. The type1 boilers are similar to coal-designed boilers interms of hearth configuration,6 heat exchangertube spacing, and other important factors; andthese boilers can also be converted to solid fuels.However, type 2 boilers (about 35 percent of theoil-designed boiler population) require such ex-tensive modifications that generally it is not prac-tical to convert them. Consequently, for the pur-poses of this study, OTA has assumed that onlythe coal-designed and type 1 oil-designed utilityboilers would be converted to solid fuels.
The population of industrial boilers has notbeen surveyed in the same detail as utility boilers.Consequently, OTA has simply assumed that 50percent of the large (greater than 50 million Btuper hour (MM Btu/hr)) industrial boilers currentlyburning oil are suitable for conversion to solidfuels. Although there will be exceptions,8 OTAalso assumed that most of the small (less than 50MMBtu/hr) industrial boilers would not be con-verted to solid fuels because of space limitationsand the inconvenience and extra labor associatedwith solid fuel combustion.
Ethanol
Ethanol is a high-octane liquid fuel that can beused to fuel engines designed or modified for its
6Particularly the size of the hearth, which determines the lengthof time that the fuel remains in the combustion zone for a givenair and fuel flow rate. Coal and wood react more slowly than doesoil, so they require a longer residence time in this zone.
7“Survey of Oil-Fired Utility Boilers–Potential for Coal-Oil Mix-ture Conversion, ” prepared by MITRE Corp. for U.S. Departmentof Energy, DOE/FE/531 79-01 UC-90E, July 1980.
SR. Hodam, R. Williams, and M. Lesser, “Engineering and ECO-nomic Characteristics of Commercial Wood Gasifiers in NorthAmerica, ” Hodam Associates, Inc., SER1/TR-231 -1459, November1982.
use, or it can be blended with gasoline and theblends can be used in unmodified gasoline en-gines. Currently, the major use of fuel ethanol(about 500 million gallons per year) is as an oc-tane-boosting additive to gasoline. These blends,which consist of 10 percent ethanol and 90 per-cent unleaded gasoline, were originally called“gasohol” but now are usually referred to as“premium unleaded gasoline with ethanol.”
Ethanol is currently produced from ethylene (abyproduct of oil refining) and from biomass. U.S.production of petrochemical ethanol was about200 million gallons in 1981,9 almost all of whichwas used for chemical and pharmaceutical pur-poses. Although 1981 ethylene production (29billion pounds10) would have been sufficient for7 billion gallons of ethanol, using it to producefuel ethanol would have diverted it from its highervalue chemical uses. Consequently, this optionhas not been considered for fuel production.
Ethanol from biomass, the main source of fuelethanol, is produced by fermenting a sugar solu-tion and then distilling the solution to concen-trate and purify the ethanol (see fig. 21). The sugarsolution can be obtained from sugar crops, thestarch in grains, or cellulose (contained in wood,plant herbage, the paper and wood in munici-pal waste, etc.). However, cellulose-derived sugaris relatively expensive because the processeseither give low yields of sugar or consume largequantities of expensive chemicals and require ex-pensive equipment.11 The economics also gener-ally favor the use of grain, principally corn, oversugar crops as the source of sugar in the UnitedStates, although there are site-specific exceptionsto this.
A byproduct of producing ethanol from grainis a substance called “distillers’ dry grain” (DDG),which contains most of the protein originally con-tained in the grain. The DDG can be used as asubstitute for soybean meal and other proteinconcentrates in animal feeds. Above about 2 bil-lion gallons per year of ethanol production, how-
9Chemical & Engineering News, June 14, 1982.‘oIbid.I IEnergy From Biological Processes, Volume 11— Technical and
Environment/ Analyses (Washington, DC: U.S. Congress, Officeof Technology Assessment, OTA-E-1 28, September 1980).

Ch. IV—Fuel Switching ● 6 3
Figure 21 .—Process Diagram for the Production ofFuel Ethanol From Grain
ever, the U.S. animal feed markets would beginto saturate; and this would have an adverse ef-fect on the economics of ethanol production andincrease the agricultural impacts of supplying thegrain. (See “Fuel and Grain Supplies” below.)
Another concern is whether ethanol can re-place more oil than is consumed in producing it–i.e., its net oil replacement. This involves threemajor areas: 1 ) distillery fuel use, 2) energy creditsfor ethanol’s octane-boosting properties, and3) grain production.
New, large-scale ethanol distilleries are gener-ally fueled with coal, and their oil consumptionis negligible. Experience to date, however, indi-cates that small, onfarm distilleries are usuallyfueled with oil;12 and this is likely to result indistillery oil consumption that is at least half the
12’’Fuel Alcohol on the Farm–A Primer on Production and Use,”U.S. National Alcohol Fuels Commission, Washington, DC, 1980.
energy content of the ethanol produced .11 Conse-quently, unless onfarm ethanol production isnegligible or small-scale distillers begin to usesolid fuels, distillery oil consumption could re-duce the net quantity of oil replaced by ethanolsignificantly. For the purposes of this study, how-ever, OTA assumes that most of the ethanol willbe produced in large, coal-fired distilleries.
The second factor in ethanol’s oil replacementpotential involves its octane-boosting properties.Under more or less normal circumstances, ad-dition of ethanol to gasoline enables the refinerto produce a lower octane gasoline and therebyreduce the refinery energy use. This energy“credit” typically amounts to 5 to 50 percent ofthe energy content of the ethanol .14 As discussedin appendix B of this chapter, however, changesin the product mix and processing needs at re-fineries following a large oil shortfall could reducesignificantly or eliminate this energy credit. Con-sequently, OTA does not include a refinery ener-gy credit when calculating ethanol’s net oil re-placement under conditions of a large shortfall.
The third factor is the fuel used to produce thegrain, which is discussed in detail under “Fueland Grain Supplies” below. When this agricul-tural energy use is included, the combined resultsindicate that ethanol production can, at best, leadto a net oil replacement equal to about half theenergy content of the ethanol. And if the in-creased demand for grain leads to unfavorable(from an energy point of view) shifts in agricul-tural production and/or the distilleries are fueledwith oil or natural gas, ethanol production willprobably not reduce oil consumption and it couldeven lead to an increased demand for oil.
13Fuel consumption reported by the small-scale distillers is less
than this, but the numbers reported probably do not include mashpreparation, distillery sterilization, and DDG drying. OTA’s esti-mate of the energy consumption is based on the best available tech-nology for all the processes involved in ethanol fermentation anddistillation; and inefficiencies in small-scale operations would prob-ably increase their energy consumption above our estimate.
14Energy From Biological processes, VO/UlT7e 11, op. cit.
64 ● U.S. Vulnerability to an Oil Import Curtailment: The Oil Replacement Capability
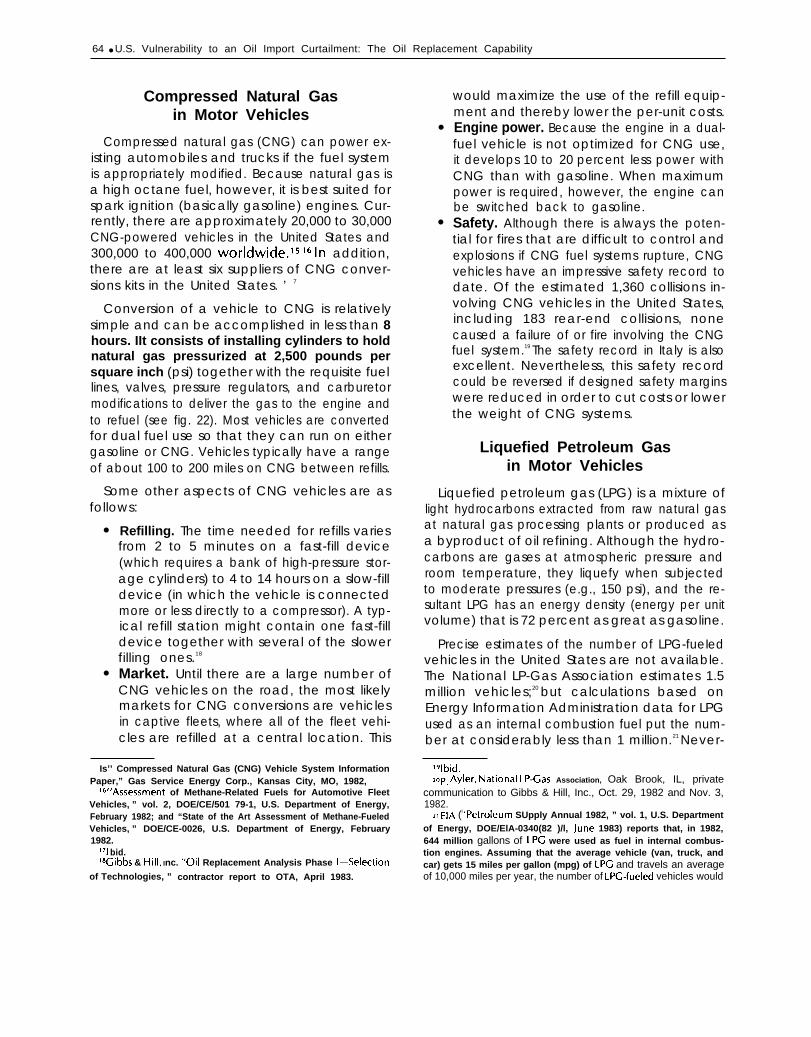
Compressed Natural Gasin Motor Vehicles
Compressed natural gas (CNG) can power ex-isting automobiles and trucks if the fuel systemis appropriately modified. Because natural gas isa high octane fuel, however, it is best suited forspark ignition (basically gasoline) engines. Cur-rently, there are approximately 20,000 to 30,000CNG-powered vehicles in the United States and300,000 to 400,000 worldwide.ls lb In addition,there are at least six suppliers of CNG conver-sions kits in the United States. ’ 7
Conversion of a vehicle to CNG is relativelysimple and can be accomplished in less than 8hours. IIt consists of installing cylinders to holdnatural gas pressurized at 2,500 pounds persquare inch (psi) together with the requisite fuellines, valves, pressure regulators, and carburetormodifications to deliver the gas to the engine andto refuel (see fig. 22). Most vehicles are convertedfor dual fuel use so that they can run on eithergasoline or CNG. Vehicles typically have a rangeof about 100 to 200 miles on CNG between refills.
Some other aspects of CNG vehicles are asfollows:
●
●
Refilling. The time needed for refills variesfrom 2 to 5 minutes on a fast-fill device(which requires a bank of high-pressure stor-age cylinders) to 4 to 14 hours on a slow-filldevice (in which the vehicle is connectedmore or less directly to a compressor). A typ-ical refill station might contain one fast-filldevice together with several of the slowerfilling ones.18
Market. Until there are a large number ofCNG vehicles on the road, the most likelymarkets for CNG conversions are vehiclesin captive fleets, where all of the fleet vehi-cles are refilled at a central location. This
Is’’ Compressed Natural Gas (CNG) Vehicle System InformationPaper,” Gas Service Energy Corp., Kansas City, MO, 1982,
‘G’’Assessment of Methane-Related Fuels for Automotive FleetVehicles, ” vol. 2, DOE/CE/501 79-1, U.S. Department of Energy,February 1982; and “State of the Art Assessment of Methane-FueledVehicles, ” DOE/CE-0026, U.S. Department of Energy, February1982.
‘71 bid.laGibbs & Hill, Inc. “oil Replacement Analysis Phase l—selection
of Technologies, ” contractor report to OTA, April 1983.
●
●
would maximize the use of the refill equip-ment and thereby lower the per-unit costs.Engine power. Because the engine in a dual-fuel vehicle is not optimized for CNG use,it develops 10 to 20 percent less power withCNG than with gasoline. When maximumpower is required, however, the engine canbe switched back to gasoline.Safety. Although there is always the poten-tial for fires that are difficult to control andexplosions if CNG fuel systems rupture, CNGvehicles have an impressive safety record todate. Of the estimated 1,360 collisions in-volving CNG vehicles in the United States,including 183 rear-end collisions, nonecaused a failure of or fire involving the CNGfuel system.19 The safety record in Italy is alsoexcellent. Nevertheless, this safety recordcould be reversed if designed safety marginswere reduced in order to cut costs or lowerthe weight of CNG systems.
Liquefied Petroleum Gasin Motor Vehicles
Liquefied petroleum gas (LPG) is a mixture oflight hydrocarbons extracted from raw natural gasat natural gas processing plants or produced asa byproduct of oil refining. Although the hydro-carbons are gases at atmospheric pressure androom temperature, they liquefy when subjectedto moderate pressures (e.g., 150 psi), and the re-sultant LPG has an energy density (energy per unitvolume) that is 72 percent as great as gasoline.
Precise estimates of the number of LPG-fueIedvehicles in the United States are not available.The National LP-Gas Association estimates 1.5million vehicles;20 but calculations based onEnergy Information Administration data for LPGused as an internal combustion fuel put the num-ber at considerably less than 1 million.21 Never-
lglbid.ZOp. Ayler, National LP-Gas Association, Oak Brook, IL, private
communication to Gibbs & Hill, Inc., Oct. 29, 1982 and Nov. 3,1982.
Z1 HA (l Jpetroleum SUpply Annual 1982, ” vol. 1, U.S. Departmentof Energy, DOE/ElA-0340(82 )/l, June 1983) reports that, in 1982,644 million gallons of LPG were used as fuel in internal combus-tion engines. Assuming that the average vehicle (van, truck, andcar) gets 15 miles per gallon (mpg) of LPG and travels an averageof 10,000 miles per year, the number of LPG-fueled vehicles would
Ch. IV—Fuel Switching ● 6 5
Figure 22.—Components of CNG Vehicle Conversion
1.
2.
3.
4.
5.
6.
7.
8.
9.
CNG Storage Cylinders: CNG is stored on board the converted vehicle at 2,400 psi in the U.S. Depart-ment of Transportation 3AA rated cylinders.Manual Shut-Off Valve: Each CNG storage cylinder is equipped with a high pressure ball valve whichallows manual shut-off of CNG as an added safety feature.Fuel Supply Line: The CNG supply line is made of high pressure steel tubing with a minimum workingpressure rating of not less than 3,000 psi and a test pressure rating of 12,000 psi. It is ¼” thick and ismanufactured to Society of Automotive Engineers specifications.First Stage Regulator: The primary regulator reduces CNG from 2,400 psi storage pressure down to 60psi. It is tested to withstand pressures in excess of 15,000 psi.Second Stage Regulator: The secondary regulator reduces CNG from 60 psi down to less than onepound working pressure. This regulator design has been used by the gas utility industry for many yearsand is rated for inlet pressures up to 125 psi.CNG Solenoid Valve: A 12 volt DC pilot-operated solenoid, located between the first and second stageregulators, controls the flow of CNG into the system.Vapor Hose: The vapor hose supplies CNG from the second stage regulator to the gas/air mixer. It is im-pervious to CNG and capable of sustaining five times the maximum service pressure.Gas/Air Mixer This specially designed unit operates on the diaphragm controlled variable venturi princi-ple. It meters CNG into the carburetor as required for combustion and maintains the proper fuel to airratio at all levels of engine demand.Carburetor Adaptor: This unit adapts the gas/air mixer to the standard carburetor in a straight-set or off-set configuration.Fuel Selector Control Panel and Gauge: The dash-mounted panel incorporates a sturdy push-pull cable10.with a handle for switching from one-fuel to the other. A pressure gauge indicates the amount of CNGremaining in the vehicle.
11. Gauge Isoiator The isoiator is installed in the high pressure fuel supply line behind the pressure gaugeto prevent CNG from entering the passenger compartment.
12. Combination Valve: The combination check and fill valve allows CNG to flow through the fuel supplyline to the storage cylinders and functions as a relief device to guard against overpressurization. It alsoautomatically seals the system after refueling.
13. Refueling Connection: The refueling connection is designed to receive a probe-type refueling couplingand is equipped with an interlock switch to prevent the vehicle from being started inadvertently duringrefueling.
SOURCE: “The Dual Fuel BiPac System — Vehicle Conversion,” Dual Fuel Systems Inc., Culver City, CA, 1981

66 ● U.S. Vulnerability to an Oil Import Curtailment: The Oil Replacement Capability
theless, there have been reports that as many as300,000 vehicles were converted to use LPG in1981.22 Furthermore, Ford Motor Co. began sell-ing LPG-fueled cars in 1982, and they expect their1982 sales of 1,500 vehicles to rise to 6,000 in1983.23
Converting a gasoline-fueled vehicle to LPG en-tails installing an LPG fuel tank, fuel lines and fil-ter, a device to vaporize the LPG and regulatethe gas pressure, and a gas air mixer (see fig. 23).The conversion can be done in a few hours, andthe converted vehicles generally can burn eithergasoline or LPG. Furthermore, the National FireProtection Association (NFPA) has developed
be about 966,000. However, some of this LPG is used for stationaryengines, the 15 mpg average fuel efficiency is probably too high,and 10,000 miles per vehicle year may be too low. All of these po-tential errors would tend to exaggerate the number of LPG-fueledvehicles. In fact in its Annual Report to Congress, EIA lists LPG usein transportation at 0,01 quad/yr or 110 million gallons. This wouldput the number of transportation vehicles at perhaps 170,000; butother vehicles in construction, mining, and agriculture would in-crease the total.
22’’Vehicle Conversions to LP-Gas Fuel: Is It Worth It?” PublicWok, June 1982.
23’ Gas Burner, ” 1982; and R. Nichols, Ford Motor Co., communication to Gibbs& Hill, Inc., Mar. 17, 1983.
standards governing the installation proceduresand major LPG fuel system components, and theNational LP-Gas Association has a program thatcertifies installers to the NFPA standards.
Refueling with LPG is somewhat more complexthan with gasoline, because the filling station andvehicle tanks are pressurized. However, becauseLPG is liquid and the pressures involved are notgreat, refueling can be done quickly and presentsno unusual difficulties.
Mobile Gasifiers
Gasifiers are devices that partially burn solidfuels to produce a low-energy fuel gas. For thepurposes of this report, OTA defines mobile gas-ifiers as gasifiers attached to motor vehicles inwhich the fuel gas powers the vehicle. The gasi-fier can be mounted directly to the vehicle–e.g.,on a bumper, inside the vehicle shell, in a truck’sbed–or it may be mounted on a trailer drawnbehind the vehicle.
During World War 11, mobile gasifiers wereused in several industrialized countries, includingEngland, France, Italy, Germany, Sweden, andJapan. By 1943 there probably were several hun-
Figure 23.—Components of LPG Vehicle Conversion
SOURCE: “Vehicle Conversion to LP-Gas Fuel: Is It Worth It?,” Public Works, January 1982

Ch. IV—Fuel Switching . 67
dred thousand (and perhaps as many as 1 mil-lion) vehicles fueled by gasifiers.24 Nevertheless,additional development is required in order tooptimize designs for modern vehicles and to es-tablish design standards, but this does not pre-sent any serious problems. Consequently, whilemobile gasifiers are not a commercial technol-ogy at present, there are no fundamental barriersthat would prevent them from becoming com-mercial within a relatively short time.
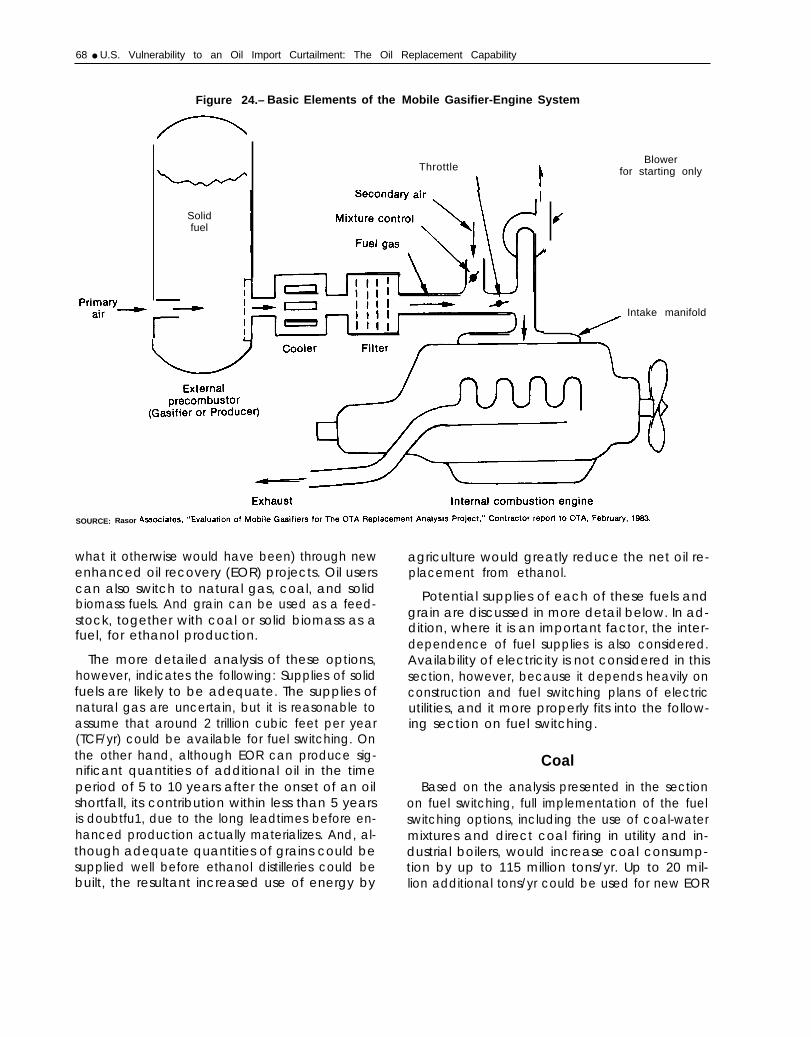
A typical gasifier fuel system would consist ofthe gasifier, heat exchanger to cool the fuel gas,25
a filter system to remove particulate from the gas,tubing to deliver the gas to the engine, and a de-vice to mix the gas with appropriate quantitiesof air before it enters the engine (see fig. 24). Inmost cases, the gasifier system would be installedin a way that would allow the engine to run eitheron petroleum or on the fuel gas. In gasoline en-gines, the fuel gas would be ignited by the en-gine’s spark plugs, and no gasoline would be nec-essary when the gasifier is operating. For dieselengines, however, small amounts of diesel fuelwould have to be injected in order to ignite thefuel gas; and modifications to the diesel injectionsystem might be necessary to limit the power out-put at full throttle so as to avoid excessive en-gine wear. The installation and any necessary
24 Rasor Associates, Inc., “Evaluation of Mobile Gasifiers for theOTA Oil Replacement Analysis Project,” contractor report to OTA,July 1983.
25The gas has to be cooled to increase its energy density and toprevent misfiring. Without gas cooling, engine performance wouldnot be acceptable.
modifications, however, could probably be com-pleted in one day.
The size of the gasifier will depend on the pow-er and driving range needed, but the gasifier foran average passenger car might be a cylinder thatis about 1.5 ft in diameter and 4 ft long. Such agasifier would provide a driving range of about300 miles on coal or 75 miles on wood.26 Theheat exchanger and filter would be somewhatsmaller than the gasifier and might typically bethe size of the vehicle’s radiator. Other designsare both possible and likely, however.
After the ash is removed and the gasifier is filledwith fuel, the fuel is ignited with a small flare. Airthen must be drawn through the gasifier for 2 to5 minutes before the exhaust gas can be ignited,and full power does not develop until after about20 minutes of operation. Even with full gasifieroutput, however, the power of the vehicle enginewould be less than 60 to 70 percent of its powerwhen operating on gasoline, or, in the case ofa diesel engine, about 80 percent of the power(if diesel injection is minimized). In addition, thegasifier operates best when its power output isreasonably constant and it responds slowly (rela-tive to gasoline engines) to changes in power re-quirements. Although petroleum fuel could beused when the engine is first started and whenfull power is needed, the limitations of gasifiersindicate that they are best suited to long trips withrelatively stable power needs, such as in inter-city driving.
ZbRaSOr Associates, Inc., OP. cit.
FUEL AND GRAIN SUPPLIES
Following the postulated oil shortfall, there willbe an increase in conventional oil and gas ex-ploration and development. Enhanced oil recov-ery projects started before the shortfall will beginto produce, and any surge production capacitywill be utilized to maximize domestic oil pro-duction.
OTA has not assessed the potential quantitiesof oil from these sources, but has assumed thatthese activities will, at best, keep domestic oil pro-
duction constant during a 5-year period follow-ing the onset of a shortfall. To the extent that ac-tual production differs from this assumption, itwould be roughly equivalent to a less or moresevere oil shortfall.
Beyond this assumed baseline for domestic oilproduction, several other fuel sources have beenidentified for more detailed study as replacementsfor the petroleum lost in an oil shortfall. Domes-tic oil production can be increased (relative to
68 ● U.S. Vulnerability to an Oil Import Curtailment: The Oil Replacement Capability
Figure 24.– Basic Elements of the
Solidfuel
Mobile Gasifier-Engine System
ThrottleBlower
for starting only
Intake manifold
SOURCE: Rasor
what it otherwise would have been) through newenhanced oil recovery (EOR) projects. Oil userscan also switch to natural gas, coal, and solidbiomass fuels. And grain can be used as a feed-stock, together with coal or solid biomass as afuel, for ethanol production.
The more detailed analysis of these options,however, indicates the following: Supplies of solidfuels are likely to be adequate. The supplies ofnatural gas are uncertain, but it is reasonable toassume that around 2 trillion cubic feet per year(TCF/yr) could be available for fuel switching. Onthe other hand, although EOR can produce sig-nificant quantities of additional oil in the timeperiod of 5 to 10 years after the onset of an oilshortfall, its contribution within less than 5 yearsis doubtfu1, due to the long Ieadtimes before en-hanced production actually materializes. And, al-though adequate quantities of grains could besupplied well before ethanol distilleries could bebuilt, the resultant increased use of energy by
agriculture would greatly reduce the net oil re-placement from ethanol.
Potential supplies of each of these fuels andgrain are discussed in more detail below. In ad-dition, where it is an important factor, the inter-dependence of fuel supplies is also considered.Availability of electricity is not considered in thissection, however, because it depends heavily onconstruction and fuel switching plans of electricutilities, and it more properly fits into the follow-ing section on fuel switching.
Coal
Based on the analysis presented in the sectionon fuel switching, full implementation of the fuelswitching options, including the use of coal-watermixtures and direct coal firing in utility and in-dustrial boilers, would increase coal consump-tion by up to 115 million tons/yr. Up to 20 mil-lion additional tons/yr could be used for new EOR

Ch. IV-Fuel Switching • 69
projects. OTA assumed that to prevent an in-crease in sulfur emissions without the use of fluegas desulfurization, those who switch from oil tocoal would use low-sulfur coal (less than 1 per-cent sulfur), which would account for 65 milliontons/yr of the increase in coal use. The remain-ing increase would be in new coal-fired power-plants and for increased electricity productionin existing powerplants, together with smalleramounts for space heating and hot water.
In 1978, U.S. coal production was 665 milliontons,27 of which 219 million tons contained lessthan 0.8 percent sulfur and 143 million tons con-tained 0.9 to 1.2 percent sulfur.28 Consequent-ly, over 40 percent of the total shipments con-tained less than 1 percent sulfur. Of this low-sulfurcoal, about half was eastern coal .29 By 1982 coalproduction had grown to 833 million tons, with707 million tons consumed domestically and, al-though explicit data are not available, the pro-portion of low-sulfur coal and low-sulfur easterncoal was probably similar to the 1978 data. Fur-thermore, in 1974 the U.S. Demonstrated Re-serves Base30 of low-sulfur coal amounted toabout 200 billion tons, of which 33 billion tonswere estimated to exist in Appalachian and Mid-western coal fields. More recent studies31 indicatethat recoverable reserves (the most restricted cat-egory) of Appalachian low-sulfur coal amount to14 billion tons. Consequently, although low-sulfurcoal production would have to increase by about25 to 30 percent to meet the maximum projecteddemand, coal supplies appear to be adequate;and, if necessary new mines couId be openedwell within the 5-year time period.
Wood and Other Solid Biomass
Potential supplies of wood and other solid bio-mass show large variations from region to region.Wood supplies are greatest in the South, Great—- — -— ——
27Of Which 4 percent went to exports and 11 percent were forcoke plants.
‘8’’ Sulfur Content in Coal Shipments 1978,” DOE/ElA-0263(78),June 1981.
Z91bid.JOThe Demonstrated Reserve Base represents the amount of coal
contained in coal beds that meet certain criteria of geologicalassurance, depth, and seam thickness.
3’ R. L. Carmichael, “Report on Recoverable Reserves and 1978ProductIon of Low Sulfur Bituminous Coal Fields in the EasternStates,” Oak Ridge National Laboratory for U.S. Department ofEnergy, january 1981.
Lakes region, and the Northeast, with lesser sup-plies in the Pacific and Rocky Mountain regions.The potential for energy from crop residues isconcentrated in the agricultural regions of theMidwest, South, and Pacific coast regions. Poten-tial supplies of forage grasses are mainly in theregions east of the Mississippi River.32 Suppliesof municipal solid waste are, of course, largestin the large metropolitan areas.
Wood is currently the largest source of energyfrom solid biomass in the United States. Poten-tial future supplies of wood also appear to be con-siderably larger than those of crop residues,grasses, and municipal solid waste taken together;and the technologies for using wood are morewidely disseminated and better understood thanthose for the other sources of solid biomass. Con-sequently, of these sources, wood appears tohave the greatest potential for displacing petro-leum during an oil shortfall in this decade.
If harvested as part of an integrated forest man-agement program, the potential wood energysupplies in each region are more than adequateto supply the projected incremental demand forall solid fuels (including coal) as replacements foroil, although individual States may have to im-port from neighboring States. (See fig. 25 for theStandard Department of Energy regions used inthis report and table 8 for wood energy potentialby region.) The tightest supplies would be in theNew York/New Jersey region, where the incre-mental demand for solid fuel could be aboutequal to the potential wood supply; but addition-al wood could be imported from regions 1 and3, which have the potential for large surpluses.if the wood is harvested in a haphazard manner,however, supplies would be considerably smaller(following initial clearing of existing forests), woodenergy markets could divert commercial timber(used for lumber and paper pulp) from the for-est products markets, and environmental dam-age could be extensive.
In practice, market confusion surrounding arapid growth in demand for wood would be likelyto cause at least temporary shortages of wood innumerous locations. However, since wood (and
jzEnergy From Biological Processes (Washington, DC: U.S. Con-gress, Office of Technology Assessment, OTA-E-1 24, )UIY 1980).

70 ● U.S. Vulerability to an Oil Import Curtailment: The Oil Replacement Capability
Figure 25.—Federal Regions
SOURCE: U.S. Department of Energy
Table 8.-Potential Wood Energy Production byRegion, Assuming 10 Quadrillion Btu/Yr Increment
QuantityRegion (1015 Btu/yr)
1 0.68. . . . . . . . . . . . . . . . . . . . . . . . . . . . . . . . . . . . .2 0.36. . . . . . . . . . . . . . . . . . . . . . . . . . . . . . . . . . . . .3 1.0. . . . . . . . . . . . . . . . . . . . . . . . . . . . . . . . . . . . .4 2.8. . . . . . . . . . . . . . . . . . . . . . . . . . . . . . . . . . . . .5 . . . . . . . . . . . . . . . . . . . . . . . . . . . . . . . . . . . . . 0.886 1.2. . . . . . . . . . . . . . . . . . . . . . . . . . . . . . . . . . . . .7 . . . . . . . . . . . . . . . . . . . . . . . . . . . . . . . . . . . . . 0.228 0.57. . . . . . . . . . . . . . . . . . . . . . . . . . . . . . . . . . . . .9 . . . . . . . . . . . . . . . . . 0.52
10 : : : : : : : : : : : : : : : : : : : : ... , . . . . . . . . . . . . 1.76Total . . . . . . . . . . . . . . . . . . . . . . . . . . . . . . . . 10.0
SOURCE: Office of Technology Assessment.
other solid biomass) would be competing withcoal for the available markets, it is likely thatwood use would be concentrated primarily inlocations where the potential supplies are verymuch larger than the demand, such as in heavilywooded areas. Thus, it is highly unlikely that theavailability of wood or other solid biomass wouldconstrain the deployment of technologies for re-placing oil with solid fuels.
Natural Gas
The American Gas Association recently esti-mated that the United States currently could pro-

Ch. IV—Fuel Switching • 71
duce about 2.7 TCF/yr more natural gas than the18 TCF/yr consumed in 1982.33 OTA’s assessmentof natural gas availability,34 however, indicatesthat future supplies are extremely uncertain. Con-sequently, rather than attempting to derive ahighly uncertain estimate, OTA has assumed thatthere will be a 2 TCF/yr of natural gas availableto replace oil. (This amount of gas is equivalentin energy content to 1 MM B/D of oil.) To the ex-tent that this gas is not available from domesticproduction (including unconventional sources)and various domestic conservation measures,OTA assumes that imports from Canada and Mex-ico can be increased to provide the supply. Itshould be noted, however, that feasible increasesin efficiency of natural gas use in the industrial,residential, and commercial sectors, could re-place about 2 TCF/yr of gas currently being usedin those sectors (see ch. V). Consequently, if do-mestic production can be kept constant and theefficiency changes are implemented, this supplyof gas would be available without increasedi m ports.
Because natural gas availability is assumed tobe limited, it is necessary to postulate how it willbe allocated among the various consuming sec-tors. To do this OTA first assumed that the resi-dential/commercial sectors would have priorityover the other sectors for the use of natural gas.Based on this assumption, OTA found that about0.9 TCF/yr could be used in the residential andcommercial sectors for heat and hot water. Theremaining 1.1 TCF was then distributed betweenthe industrial and utility sectors in proportion toamount of oil they would be consuming after fea-sible conversions to coal had been completed.This resulted in an allocation of 0.9 TCF/yr to theindustrial sector35 and 0.2 TCF/yr to electricutiIities.
JJ’’NatUral Gas procfuctiorl Capability in 1983, ” American GasAssociation, May 27, 1983.
34u.s, Natural Gas Availability: Conventional Gas Supply Through
the Year 2000-A Technical Memorandum (Washington, DC: U.S.Congress, Office of Technology Assessment, OTA-TM-E-12, Sep-tember 1983).
J51f 5 billion ~[/yr of ethanol are produced (with an energy equ iv-
alent of 0.2 MMB/D), then natural gas use for fertilizer productionwould increase by about 0.05 MMB/D. Although this gas use woulddecrease the amount of gas available for other uses in the industri-al sector, use of the ethanol would free up some additional 011 thatcould be used In the industrial sector. By using a net energy ap-
Liquefied Petroleum Gas
Increased domestic production of natural gaswould also lead to increased supplies of liquefiedpetroleum gas (LPG) from natural gas plant liq-uids (NGPL). In 1981, NGPL production wasabout 11 percent of natural gas production, onan energy basis.36 Newly discovered supplies ofnatural gas generally contain less NGPL, how-ever. Assuming that the new gas production is9 percent NGPL, that 60 percent of the NGPL isLPG, and that 75 percent of the LPG is suitablefor internal combustion engines, an increase of2 TCF/yr in natural gas production would resultin an additional 0.04 MM B/D oil equivalent ofLPG suitable for engines. This would also resultin 0.05 MMB/D oil equivalent of NGPL and LPGnot suitable for engines, but which could be usedfor some stationary fuel purposes. To the extentthat the natural gas is made available through in-creased efficiency of natural gas use, however,less incremental LPG would be available.
Enhanced Oil Recovery
The total amount of oil recovered from someoil fields can be increased through enhanced oilrecovery (EOR). The process consists of injectinga fluid (generally carbon dioxide (C02) or steam)into an oil field through a series of injection holes.Approximately 2 years after injection begins, oilproduction from the field starts to increase,
Two areas of the United States that are majorcandidates for EOR are Texas and California. InTexas the fields would be injected with CO2 thatcould come from natural CO2 fields i n Coloradoand New Mexico and the recovery of CO2 fromthe effluents of chemical plants (notably ammoniaplants) and, possibly, electric powerplants. TheIeadtime for constructing the necessary equip-ment and pipelines and drilling the injection holesis about 2 years 37 (see fig. 26).
preach (i.e., assuming that this ethanol would lead to a net reductionin oil consumption equal to 0.1 MMB/D), this Increased agricul-tural use of gas as well as oil is accounted for; and no inconsisten-cies are introduced by adding the oil replaced by ethanol (O. 1MMB/D) to the industrial oil replaced by gas (0.9 TCF or 0.45MM B/D).
“’’Petroleum Supply Annual, ” op. cit.
‘7Gibbs A Hill, Inc., “Oil Replacement Analysis, phase I l–Eval-
uation of Selected Tech nologles, ’ contractor report to OTA, August1983.

72 ● U.S. Vulnerability to an Oil Import Curtailment: The Oil Replacement Capability—.-
Year I 1 2
Month 2 4 6 8 10 12 14 16 18 20 22 24 26 28 30 32 34 36
Reservoirscreening -
,I
Equipment design● Lab tests
Planning Reservoir modelingCost estimates
Permitting
r ● Pressure vessels
SOURCE Off Ice of Technology Assessment
In California, steam would be injected, T h eIeadtime for erecting the boilers and other equip-ment and drilling the injection wells would beabout 1¾ years without flue gas desulfurization(scrubbers) and at least 2½ years with scrubbers38
(see fig. 27).
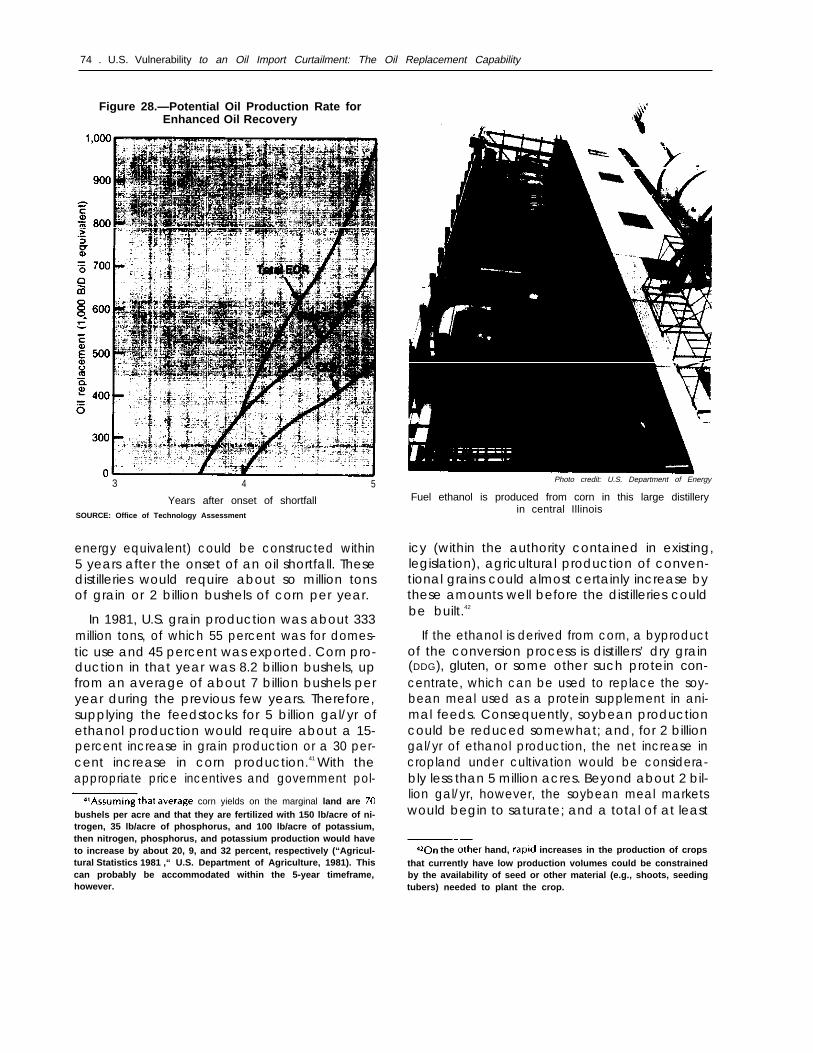
With the time required for construction and thedelay before enhanced recovery materializes, atleast 4 years would be required before any ad-ditional oil could be produced through new EORprojects. Once enhanced production begins,however, it could increase rapidly to as much as0.8 MMB/D within a year, as illustrated in figure28. If oil rather than coal is used to produce the. .- - .——
‘flbld
3 4
steam i n the California EOR projects, as is nowthe practice, net oil production would be re-duced by over 0.1 MMB/D.
Numerous complications could easily delaythese projects by a year or more, however. InTexas there could be delays in securing cooper-ative agreements with electric utiIities and chem-ical plants and in securing rights of way for thepipelines. In California virtually all of the produc-tion would occur in Kern County, where the cur-rent levels of sulfur dioxide (SO2, carbon monox-ide, particulate, and oxidants in the air all ex-ceed the ambient air quality standards (AAQS).39
~9-Frank T. PrlnCiott~, Director, I ndustnal Enwron mental ResearchLaboratory, U S, Environmental Protection Agency, ResearchTriangle Park, NC, prikate communlcatlon, July 8, 1983.

Ch. IV-Fuel Switching ● 7 3
Figure 27.—Schedule for Accelerated EOR Steam Flooding Project
Year 1
Month
21
,
Procurement Particulate control systemCoal handling system
Construction
Steaminjection
SOURCE: Office of Technology Assessment.
Furthermore, the ambient nitrogen oxide (NO,)level is about 95 percent of the AAQS.40 Conse-quently, permitting delays are likely, particularlyif a large number of projects are started simul-taneously. in addition, the EOR projects will haveto compete with the industrial oil users that areswitching to solid fuels for much of the equip-ment they will need and they will have to com-pete with conventional oil and gas explorationand development for drilling rigs.
Because of the long Ieadtime before enhancedoil production begins and because of the possi-bilities for delay, the potential for new EOR proj-ects within 5 years after the beginning of an oilshortfall is highly uncertain. In OTA’s judgment,— . . —
401 bid.
4
these characteristics of EOR put it more nearlyin the category of long Ieadtime technologies withhigh production potentials, such as synfuels, thanin the area of short-term responses, which are be-ing emphasized in this assessment. Therefore, po-tential oil production from new EOR projects isnot included as one of the short-term responsesin this assessment; although it, together with fossilsynfuels, could provide large quantities of liquidfuels in the time period of 5 to 10 years or morefollowing an oil shortfall.
Grain
OTA’s analysis of ethanol production indicatesthat distilleries capable of producing up to almost5 billion gal/yr of ethanol (about 0.2 MMB/D
B7-833 O - 84 - 6
74 . U.S. Vulnerability to an Oil Import Curtailment: The Oil Replacement Capability
Figure 28.—Potential Oil Production Rate forEnhanced Oil Recovery
3 4 5
Years after onset of shortfallSOURCE: Office of Technology Assessment
energy equivalent) could be constructed within5 years after the onset of an oil shortfall. Thesedistilleries would require about so million tonsof grain or 2 billion bushels of corn per year.
In 1981, U.S. grain production was about 333million tons, of which 55 percent was for domes-tic use and 45 percent was exported. Corn pro-duction in that year was 8.2 billion bushels, upfrom an average of about 7 billion bushels peryear during the previous few years. Therefore,supplying the feedstocks for 5 billion gal/yr ofethanol production would require about a 15-percent increase in grain production or a 30 per-cent increase in corn production.41 With theappropriate price incentives and government pol-
corn yields on the marginal land are bushels per acre and that they are fertilized with 150 lb/acre of ni-trogen, 35 lb/acre of phosphorus, and 100 lb/acre of potassium,then nitrogen, phosphorus, and potassium production would haveto increase by about 20, 9, and 32 percent, respectively (“Agricul-tural Statistics 1981 ,“ U.S. Department of Agriculture, 1981). Thiscan probably be accommodated within the 5-year timeframe,however.
Photo credit: U.S. Department of Energy
Fuel ethanol is produced from corn in this large distilleryin central Illinois
icy (within the authority contained in existing,legislation), agricultural production of conven-tional grains could almost certainly increase bythese amounts well before the distilleries couldbe built.42
If the ethanol is derived from corn, a byproductof the conversion process is distillers’ dry grain(DDG), gluten, or some other such protein con-centrate, which can be used to replace the soy-bean meal used as a protein supplement in ani-mal feeds. Consequently, soybean productioncould be reduced somewhat; and, for 2 billiongal/yr of ethanol production, the net increase incropland under cultivation would be considera-bly less than 5 million acres. Beyond about 2 bil-lion gal/yr, however, the soybean meal marketswould begin to saturate; and a total of at least
the hand, increases in the production of cropsthat currently have low production volumes could be constrainedby the availability of seed or other material (e.g., shoots, seedingtubers) needed to plant the crop.

Ch. IV—Fuel Switching ● 7 5
20 million acres of new cultivation would be re-quired to satisfy corn demand for the productionof 5 billion gal/yr of ethanol .43
With this level of increase, one would expectsignificant shifts in the quantities of agriculturalcommodities produced in the various regions;and with it there could be subtle, though signifi-cant, changes in agricultural energy use. Further-more, oil refinery operations and needs wouldchange during the postulated oil shortfall; and thiswouId affect the energy credits that couId be as-cribed to ethanol for its octane-boosting proper-ties under more normal circumstances. These ef-fects are discussed in more detail in appendix Bto this chapter.
The net result is that after changes in agricul-tural energy use are accounted for, productionof 5 billion gal/yr of ethanol (energy equivalentof 0.2 MMB/D of oil) could result in anywherefrom a 0.15 MM B/D reduction to a 0.12 MM B/Dincrease in oil consumption. The former wouldoccur if only minimal shifts in agricultural pro-duction from one region to another occur andthere is a surplus of natural gas (used to producefarm fertilizers and pesticides). The latter wouldoccur if there are modest, but unfavorable (froman energy point of view) shifts in agricultural pro-duction and there is no surplus of natural gas (so
~~Note that this additional acreage cannot be accommodated sole-ly with existing set-aside acreage, Additional set-aside acreage wouldbe needed In order to stabillze year-to-year tluctuat]ons in gratnprices and In order for the corresponding farm price support pro-grams to function. In fact, because the crop yields from the addi-tional acreage under cultivation would fluctuate more from yearto year than does average cropland, the average amount of set-aside acreage probably wou Id have to increase i n order to main-taln the same overall stability In grain prices as exists now.
that use of this fuel in agriculture limits the switch-ing from oil to gas in other sectors).
In OTA’s opinion, it is unlikely that there wouldcontinue to be surpluses of natural gas severalyears after the onset of the oil shortfall. And in-creasing corn production by the quantitiesneeded for 5 billion gal/yr of ethanol synthesiswould almost certainly lead to some interregionalshifts in agricultural production, such as in theexample given in appendix B. Consequently,OTA considers it highly unlikely that productionof 5 billion gal/yr of ethanol from corn could re-place more than 0.1 MMB/D of oil; and it is pos-sible that it would replace 0.05 MM B/D or less.(See box on Calculating Ethanol’s Energy Balance.)
Use of significant quantities of other grains asfeedstocks would differ from the use of corn intwo respects. The oil and gas used to grow a givenamount of grain could vary from 20 to 25 per-cent less than corn (e. g., wheat, oats, barley) toabout 15 percent more than corn (e. g., grain sor-ghum). But in all cases, the yields per acre culti-vated are significantly less than that for corn, andthe amount of cropland under cultivation wouldhave to increase proportionately more. Depend-ing on how the agricultural system adjusted tothis new demand, the net oil replacement (pergallon of ethanol) from other grains could rangefrom about the same as to significantly less thanthat from corn.
Consequently, although the agricultural systemcould supply the grain needed for the maximumlevels of ethanol production that are technicallyfeasible within 5 years after an oil shortfall, theincreased energy consumption in agriculturewould greatly reduce the potential oil re-placement.
DEPLOYMENT OF FUEL SWITCHING TECHNOLOGIES
The above analysis indicates that, with the ex- In this section, end-use equipment and, whereception of natural gas, fuel and grain supplies are appropriate, fuel delivery systems are examinednot likely to limit the deployment of the major in order to estimate the rate at which they canfuel switching technologies studied. In the case be installed and the oil replaced. The general pro-of natural gas, future supplies are too uncertain cedure is to estimate the market penetration ofto make a definite judgment. each technology and determine the equipment

Ch. IV—Fuel Switching ● 7 7
and manpower needed to deploy that technol-ogy. Potential deployment rates are then esti-mated by comparing the equipment and man-power needs to historical production and fuelswitching data and industry estimates of whatcould be accomplished in a crisis.
The starting point for this analysis is OTA’s esti-mate of 1985 oil consumption by end-use cate-gory and sector. These estimates are shown intable 9 and are broken down into the Departmentof Energy regions shown in figure 25. The esti-mates are based on Energy Information Admin-istration (E IA) projections44 and data,45 OTA’sassessment of automobile fuel efficiency,46 andOTA’s judgment.47
44”1 981 Annual Report to Congress, ” DOE/EIA-01 73(81), May1982.
qSData from Regional Councils submitted to Energy Information
Administration under form EP-411, April 1983.qb/ncreased Automob;/e Fuel Efficiency and Synthetic Fuels: Alter-
natives for Reducing Oi/ /reports (Washington, DC: U.S. Congress,Office of Technology Assessment, OTA-E-185, September 1982).
q~he major difference between EIA projections and the valuesshown in table 9 are in the electric utility sector. EIA assumed anaverage growth in demand of 3 percent between 1981 and 1985.However, since demand actually dropped between 1981 and 1982,demand would have to grow by 4.7 percent annually between 1982and 1985 to arrive at ElA’s 1985 projections. OTA, on the other
Several categories of oil use are not includedexplicitly in table 9, because it would be particu-larly difficult to switch from these oil uses to alter-natives within the 5-year time period consideredin this assessment. These include aviation andmarine fuels, petrochemical feedstocks, asphalt,petroleum coke, and lubricating oils.da However,the categories shown, which are the major can-
hand, has assumed a 1.5 percent annual demand growth between1982 and 1985. We have also assumed that the conversions andnew powerplants plannned to be completed by 1985, as reportedto EIA under form EP-41 1, will be completed by that date.
48Because of weight and space limitations, aviation fuel substi-tutes would be limited to high-grade synthetic fuels. Because ofspace limitations and, in some cases, boiler derating, substitutesfor marine fuels would require synthetic fuels or extensive end-usemodifications. Substitutions for petrochemical feedstocks and lu-bricating oils would have to be some forms of synthetic fuel. Al-though asphalt could be replaced by concrete and other materials,it would require extensive changes in paving and surface repairprocedures. Moreover, petroleum coke is a normal byproduct ofpetroleum refining. Most of it is used for heat at the refinery, whilethe remainder is used for metallurgical purposes. Although the met-allurgical coke could be replaced with high-grade coal, convertingthe coke to liquid fuels would be no easier than converting thecoal to a synthetic fuel. Consequently, although substitutes existfor all of these uses of oil, the Ieadtimes for replacing large quanti-ties of oil are likely to be considerably longer than 5 years, and,in some cases, the substitution makes little practical sense.
Table 9.—Estimated 1985 Oil Consumption by Region and End Use (thousand B/D)
Region
Sector Total 1 2 3 4 5 6 7 8 9 10
Electric utilities:Distillate oil . . . . . . . . . . . .Residual oil . . . . . . . . . . . . .
Residential andcommercial heatand hot water:Distillate oil . . . . . . . . . . . .Kerosene . . . . . . . . . . . . . . .LPG . . . . . . . . . . . . . . . . . . .Residual oil . . . . . . . . . . . . .
Industrial boilers:Distillate oil . . . . . . . . . . . .Residual oil . . . . . . . . . . . . .
Surface transportationand mobile industrialengines:Gasoline . . . . . . . . . . . . . . .Diesel . . . . . . . . . . . . . . . . . .
Subtotal . . . . . . . . . . . . . . . .Other . . . . . . . . . . . . . . . . . .
50590
775110170210
250710
5,7001,830
10,4005,600
a
175
160aa
15
3590
27040
790—
a 15170 50
170 145a aa 10
65 15
80 25150 65
445 555100 155
1,190 1,030— —
1080
60253510
25160
1,065315
1,790—
10 1015 a
140 4525 1535 25
5 55
25 3575 120
1,130 755320 375
1,785 1,430— —
a aa a 9
15 10 a
15 a a
30 10 10a a 35
10 a 10a 20 15
335 215 720145 105 190— — —560 370 1,090— — —
aa
25aaa
a
10
21590
355—
aLess than 10,000 B/D.
SOURCE: Office of Technology Assessment,

78 • U.S. Vulnerability to an Oil Import Curtailment: The Oil Replacement Capability
didates for fuel switching, do include about 70percent of the oil use projected for 1985.
In the following, each of the major end-use sec-tors is considered separately to derive estimatesof the rate that oil replacement technologiescould be deployed and the amount of oil that canbe replaced. Electric utilities are considered firstin order to provide estimates of the amount ofelectricity not generated by oil that could be avail-able for fuel switching in other sectors. Heat andhot water in the residential and commercial sec-tors are considered next, followed by industrialboiler fuels and mobile engines for transporta-tion and other uses.
Electric Utilities
In 1981, electric utilities consumed about 1.1MMB/D of oil. Ninety-four percent of this, orslightly more than 1 MMB/D, was residual oilused in base and intermediate load utility boilers.The remainder, or about 60,000 B/D was distillateoil used in combustion turbines and diesel en-gines for peak electric generation. With a mod-est increase in demand for electricity (1.5 percentper year on average), utility residual consump-tion could drop to 0.6 MMB/D by 1985 as newnonoil-fired plants are brought on line, while thedistillate use is likely to remain relatively constant.
Beyond 1985, as in the past, oil consumptionby electric utilities will depend critically on thedemand for electricity. Because oil is the marginalfuel for electricity generation in many regions,small percentage changes in the demand for elec-tricity can result in much larger percentagechanges in oil consumption. (For example, a 1.5percentage point change in the annual demandgrowth for electricity between 1980 and 1985would change the projected 1985 utility oil con-sumption by about 0.5 MMB/D.) It is notoriouslydifficult, however, to predict future demand; andthe difficulties are compounded during times ofrapidly changing energy prices such as those thatwould exist following a large oil shortfall. Con-sequently, for the purposes of this analysis, OTAperformed the calculations using two differentlevels of change in demand for electricity, At thelower end, it was assumed that the depressedeconomic climate following the oil supply short-
fall would result in relatively constant demandfor electricity between 1985 and 1990. At the up-per end, the estimates given by the North Amer-ican Electric Reliability Council (N ERC)49 wereused. NERC projected that demand for electri-city will grow by about 2 percent per year, onaverage.
The major actions electric utilities can take toreduce their oil consumption are to switch to nat-ural gas and coal and to complete constructionof nonoil-fired powerplants that are currentlyunder construction and scheduled for comple-tion between 1985 and 1990.50 The actual mixof actions taken will vary among the utilities andregions, but the broad outlines of a potential re-sponse can be discerned.
Utilities can begin almost immediately to usemore natural gas in the boilers that are equippedto burn both oil and natural gas. OTA estimatedthe amount of this dual-fuel capacity from the1981 utility fuel use profiles51 by assuming thatthe powerplants that burned significant quantitiesof both oil and gas in 1981 but were not sched-uled for retirement or conversion to other fuelsby 1985 would be capable of burning both oiland gas in 1985. These estimates indicate that,of the regions consuming large quantities of oilfor electric generation (table 9), regions 2,4, and9 have by far the most dual-fuel capacity. Regions1 and 3 have only small amounts of dual-fuel ca-pacity, and much of it is scheduled for retirementor conversion by 1985.
Based on 1981 oil consumption,52 the dual-fuelboilers could replace about 60,000 B/D of oil inregion 2, 75,000 B/D in region 4, and 65,000 B/Din region 9 within a short time, say 6 months, fol-lowing an oil cutoff. This would require a totalof about 0.4 TCF/yr of natural gas or the energyequivalent of 0.2 MMB/D. Although this is twicethe 0.2 TCF/yr of surplus natural gas allocated to
49’’ Electric Power Supply and Demand 1983-1992, ” North Amer-ican Electric Reliability Council, Princeton, Nj, 1983.
SoAnother possibili~ is to construct new power lines frOm utili-ties with excess nonoil capacity to regions dependent on oil. Theconstraints here, however, are primarily institutional; and the uncer-tainties are large. Consequently, this option has not been includedin OTA estimates.
51 Data from Energy Information Administration form 759.S* Ibid.
Ch. IV—Fuel Switching • 79
electric utilities (see section on “Natural Gas”under “Fuel and Grain Supplies”), later replace-ment of some of this gas through conversions tocoal and so forth could bring the incremental util-ity consumption of gas down to its allocated levelbefore the gas would be required by the com-mercia l/residential and industrial sectors. Con-sequently, it would be possible for the electricutilities to use 0.4 TCF/yr of gas initially, withoutviolating OTA’s allocation of the assumed 2 TCF/yr of surplus natural gas.
Following this initial response, regional natu-ral gas use will change as new gas pipelines arebuilt, coal technologies are deployed, and newpowerplants and interties are completed. It isprobable, however, that gas prices will rise as aresult of the increased demand for gas by utili-ties and other sectors; and much of the increaseduse of gas by utilities will eventually be replacedby other technologies.
A second type of fuel switching available to util-ities is to convert oil-burning boilers to coal andcoal water mixtures (CWMS) (see section on“Technologies”). Some utility boilers currentlyburning oil use coal as an alternative fuel and canswitch quickly when oil prices rise, but the totalamount of oil consumed in these boilers is notgreat.53 Most oil-burning boilers will have to bemodified to use solid fuels, either directly or asCWMs.
As explained in the section on “Technologies,”the boilers that are suitable for conversion to solidfuels are those that were originally designed forcoal but were subsequently converted to oil, andthose that were originally designed for oil but aretechnically similar to coal-designed boilers. Of theboilers that are technically suitable for conver-sion, OTA assumed that only those that werebrought into service on or after 1960 will actuallybe converted. This assumption reflects the factthat major investments are not likely to be madein the older generating plants because the re-maining life of the facilities is too short to justifythe expenditures. Based on these assumptions
JJAccOrcflng to EII+ data (I bicf. ), electric utilities in K?glOn 3 COn -
sume the largest amount of oil in boilers that burn significant quan-tities of both oil and coal. The boilers in this region that were coalcapable in 1981 and are not scheduled to be retired or replacedby 1985 consumed slightly less than 12,000 B/D of oil on average.
and the survey of utility boilers,54 OTA identified114 utility boilers in regions 1 through 4 and 9that are suitable for conversion from oil to solidfuels.
Provided that the permits needed for the boilerconversion can be obtained in 10 months, a typ-ical schedule for converting a utility boiler to solidfuel (including CWMs) might look something likethat shown in figure 29.55A corresponding sched-ule for construction of a CWM preparation plantis shown in figure 30. CWM plant constructionrequires less time than boiler conversion; and be-cause of this, the fraction of utility boilers thatwill convert to CWM as opposed to direct firingof the solid fuel does not have to be specified.Both conversions will require comparable lead-times. As mentioned before, however, plants withlimited space for coal-handling facilities wouldbe more likely to convert to CWM.
Historically, the boiler industry has sold asmany as 350 electric generating units to foreignand domestic utilities over a 5-year period; 56 andmanufacturers of particulate control systems (tocontrol particulate emissions) believe they caneasily supply the necessary systems for 114 boilerconversions. Based on the historical rate, it is rea-sonable to assume that the conversion processcould begin on half of the boilers during the firstyear after the onset of an oil shortfall, and theremaining half could be initiated the followingyear. The first boilers to be converted would thencome on line a little over 2 years after the short-fall, and the conversions could all be completedwithin about 4 years.57
The generating capacity of facilities that can beconverted from oil to coal (assuming that the con-verted boilers have 65 percent of the capacity
———54’’ Survey of Oil-Fired Utility Boilers, ” op. cit.SsTest burns can Ofien be carried out with considerably shorter
Ieadtimes than those shown in figure 21, For full commercial con-version, however, more permanent and time-consuming modifica-tions are needed.
5Zibbs & Hill, Inc., “Oil Replacement Analysis, Phase 11,” op. cit.‘To complete the conversions, the boiler wou Id have to be out
of operation for 3 to 6 months while the modifications in the boilerand (probably) needed repairs discovered when the boiler is openedare carried out. Generally, however, there is sufficient reserve ca-pacity in utility systems to make up for the lost power as long asthis phase of the conversion is carried out during the utility’s off-peak season.

80 ● U.S. Vulnerability to an Oil Import Curtailment: The Oil Replacement Capability
Figure 29.-Schedule for Engineering and Construction: Utility Boiler Conversion to CWM-Firing
SOURCE: Office of Technology Assessment.
Figure 30.-Schedule for Engineering and Construction: Central CWM preparation Plant for Industrial Boilers
SOURCE: Off Ice of Technology Assessment.
they had when burning oil) is shown in table 10, peak winter and summer demands for the twotogether with the capacity of new generating fa- Ievels of 1990 demand described above (fig. 31).cilities scheduled for completion between 1985 The total amount of electric energy that couldand 1990. The new and converted capacity was be generated by the nonoil-fired facilities (assum-then added to the 1985 nonoil-fired generating ing 60 percent capacity factors for the new andcapacity to determine the total nonoil capacity converted capacity) was also compared to thein each region. This capacity was compared to 1990 demands for electricity.
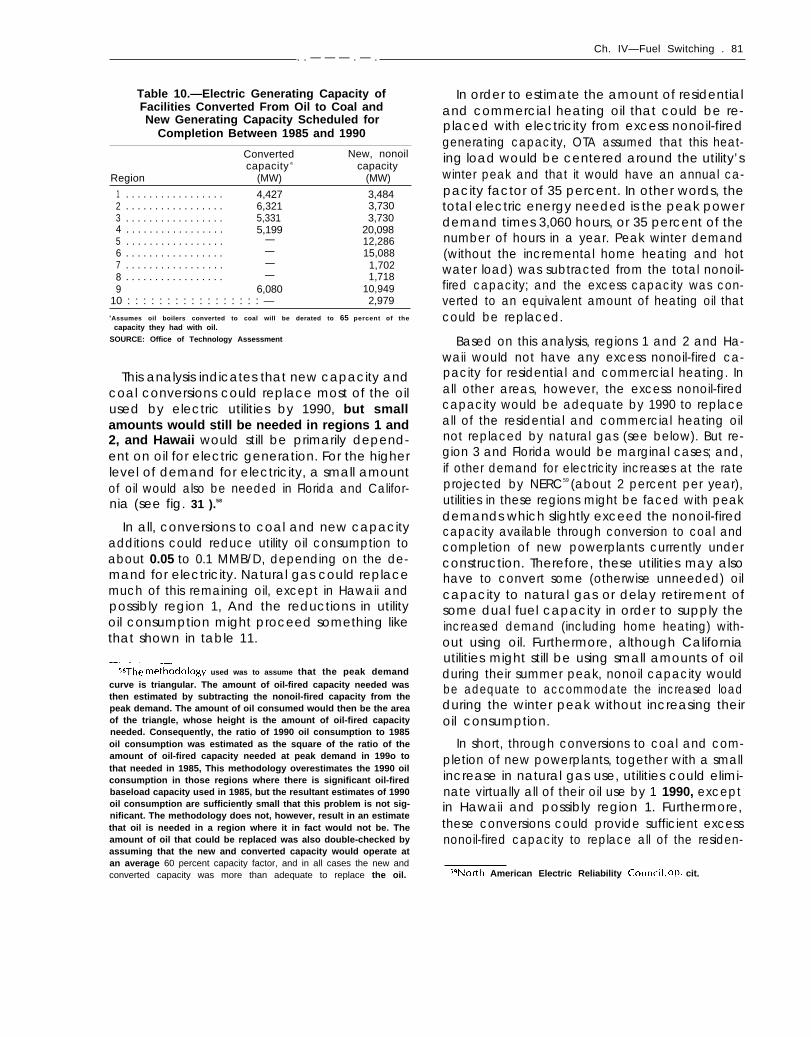
Ch. IV—Fuel Switching . 81. . — — — . — .
Table 10.—Electric Generating Capacity ofFacilities Converted From Oil to Coal andNew Generating Capacity Scheduled for
Completion Between 1985 and 1990
Converted New, nonoilcapacity a capacity
Region (MW) (MW)
1 . . . . . . . . . . . . . . . . . 4,427 3,4842 . . . . . . . . . . . . . . . . . 6,321 3,7303 . . . . . . . . . . . . . . . . . 5,331 3,7304 . . . . . . . . . . . . . . . . . 5,199 20,0985 . . . . . . . . . . . . . . . . . — 12,2866 . . . . . . . . . . . . . . . . . — 15,0887 . . . . . . . . . . . . . . . . . — 1,7028 . . . . . . . . . . . . . . . . . — 1,7189 6,080 10,949
10 : : : : : : : : : : : : : : : : : — 2,979aAssumes oil boilers converted to coal will be derated to 65 percent of the
capacity they had with oil.
SOURCE: Office of Technology Assessment
This analysis indicates that new capacity andcoal conversions could replace most of the oilused by electric utilities by 1990, but smallamounts would still be needed in regions 1 and2, and Hawaii would still be primarily depend-ent on oil for electric generation. For the higherlevel of demand for electricity, a small amountof oil would also be needed in Florida and Califor-nia (see fig. 31 ).58
In all, conversions to coal and new capacityadditions could reduce utility oil consumption toabout 0.05 to 0.1 MMB/D, depending on the de-mand for electricity. Natural gas could replacemuch of this remaining oil, except in Hawaii andpossibly region 1, And the reductions in utilityoil consumption might proceed something likethat shown in table 11.
—.—————sBThe methodology used was to assume that the peak demand
curve is triangular. The amount of oil-fired capacity needed wasthen estimated by subtracting the nonoil-fired capacity from thepeak demand. The amount of oil consumed would then be the areaof the triangle, whose height is the amount of oil-fired capacityneeded. Consequently, the ratio of 1990 oil consumption to 1985oil consumption was estimated as the square of the ratio of theamount of oil-fired capacity needed at peak demand in 199o tothat needed in 1985, This methodology overestimates the 1990 oilconsumption in those regions where there is significant oil-firedbaseload capacity used in 1985, but the resultant estimates of 1990oil consumption are sufficiently small that this problem is not sig-nificant. The methodology does not, however, result in an estimatethat oil is needed in a region where it in fact would not be. Theamount of oil that could be replaced was also double-checked byassuming that the new and converted capacity would operate atan average 60 percent capacity factor, and in all cases the new andconverted capacity was more than adequate to replace the oil.
In order to estimate the amount of residentialand commercial heating oil that could be re-placed with electricity from excess nonoil-firedgenerating capacity, OTA assumed that this heat-ing load would be centered around the utility’swinter peak and that it would have an annual ca-pacity factor of 35 percent. In other words, thetotal electric energy needed is the peak powerdemand times 3,060 hours, or 35 percent of thenumber of hours in a year. Peak winter demand(without the incremental home heating and hotwater load) was subtracted from the total nonoil-fired capacity; and the excess capacity was con-verted to an equivalent amount of heating oil thatcould be replaced.
Based on this analysis, regions 1 and 2 and Ha-waii wouId not have any excess nonoil-fired ca-pacity for residential and commercial heating. Inall other areas, however, the excess nonoil-firedcapacity would be adequate by 1990 to replaceall of the residential and commercial heating oilnot replaced by natural gas (see below). But re-gion 3 and Florida would be marginal cases; and,if other demand for electricity increases at the rateprojected by NERC59 (about 2 percent per year),utilities in these regions might be faced with peakdemands which slightly exceed the nonoil-firedcapacity available through conversion to coal andcompletion of new powerplants currently underconstruction. Therefore, these utilities may alsohave to convert some (otherwise unneeded) oilcapacity to natural gas or delay retirement ofsome dual fuel capacity in order to supply theincreased demand (including home heating) with-out using oil. Furthermore, although Californiautilities might still be using small amounts of oilduring their summer peak, nonoil capacity wouldbe adequate to accommodate the increased loadduring the winter peak without increasing theiroil consumption.
In short, through conversions to coal and com-pletion of new powerplants, together with a smallincrease in natural gas use, utilities could elimi-nate virtually all of their oil use by 1 1990, exceptin Hawaii and possibly region 1. Furthermore,these conversions could provide sufficient excessnonoil-fired capacity to replace all of the residen-
sqNorth American Electric Reliability Council, op. cit.

—.
82 Ž U.S. Vulnerability to an Oil Import Curtailment: The Oil Replacement Capability
Figure 31.– Potential Nonoil-Fired Electric Generating Capacity and 1990 Peak Electric Demand
70
for Selected Regions
Nonoil capacity Shaded area indicates additional power demand if high
Summer peak
Winter peak
Region 1 Region 2
SOURCE: Office of Technology Assessment.
Region 3 Florida
Region
Table 11.—Potential Utility Oil Consumption With Conversion toNatural Gas and Coal (thousand B/D)
Region/year 1985 1986a 1987 1988 1989 1990
1 . . . . . . . . . . . . . . . . . . . . 1752 . . . . . . . . . . . . . . . . . . . . 1693 . . . . . . . . . . . . . . . . . . . . 634 . . . . . . . . . . . . . . . . . . . . 895 . . . . . . . . . . . . . . . . . . . . 286 . . . . . . . . . . . . . . . . . . . . 157 b. . . . . . . . . . . . . . . . . . . .
8 b. . . . . . . . . . . . . . . . . . . .
9 9810 : : : : : : : : : : : : : : : : : : : : b
17510963142815
b
b
33b
1396745
b
18bbb
28b
62b
19b
10b
b
b
20b
41bbbbbbb
16b
41b
b
b
b
b
b
b
16b
Region 9
aThe sharP drop is due to switching to natural gas in dual fueled boilers.bLess than 10,000 BID.cAssumes half of the oil used for electric peaking is replaced by naturat gas within 2 Years.
SOURCE: Office of Technology Assessment.

——. —...———
tial and commercial oil not replaced by naturalgas, except in regions 1 and 2 and Hawaii.
The above results are particularly sensitive toactual developments in regions 1 and 2, however.Delays in conversions or completion of power-plants currently under construction could in-crease oil consumption in these regions signifi-cantly. On the other hand, construction of newpower lines and increased purchases of electri-city from Canada and region 5 would reducethese regions’ oil dependence and possibly pro-vide some excess capacity for residential andcommercial space heating and hot water.
Residential and Commercial SpaceHeat and Hot Water
Almost 1.3 MMB/D of oil was consumed in1981 for space heating and hot water in the resi-dential and commercial sectors. Over 60 percentof this, or 0.8 MMB/D, was distillate fuel oil. Theremainder was divided among LPG (0.2 MMB/D),residual fuel oil in commercial buildings (0.2MMB/D), and kerosene (0.1 MMB/D).60 Althoughdemand for oil in these sectors dropped slightlyin 1982 and 1983, it is unclear how much wasdue to short-term behavioral changes and howmuch was due to fuel switching and increasedefficiency. Consequently, for the purposes of thisanalysis, OTA made the conservative assumptionthat residential and commercial demand for thesefuels will be about the same in 1985 as it was in1981.
The major fuel switching options open to theresidential and commercial sectors are conver-sions to natural gas, electricity (where surplusnonoil-fired capacity exits), and solid fuels. Nat-ural gas conversions are considered first, followedby conversions to electricity. Conversions to solidfuels are then examined for the regions wherethe combination of gas and electricity cannot re-place all of the oil use within 5 years.
Conversion to Natural Gas
In 1980, about 14 million households in theUnited States used fuel oil or kerosene for heat.61
6110EI,4 “Annual Report to Congress, ” Op. cit.c’ “Residential Energy Conservation Survey: Housing Character-
istics 1980, ” DOE/EIA-01 34, June 1982; and “Residential EnergyConsumption Survey, ” DOE/EIA-0262 /l, April 1981.
Ch. IV—Fuel Switching . 83—
About 36 percent of these are in rural areas,62
which are generally too far from existing naturalgas lines and where the population densities aretoo small to justify the cost of constructing dis-tribution lines to these houses. Similarly, most ofthe households using LPG are located in ruralareas and are not candidates for conversion tonatural gas.
Many of the urban households that use oil forheating, however, are already connected to gaslines and use gas for hot water and/or cooking;and most of the others are located near existinggas lines. If 80 percent of the urban householdscould be converted to gas, about half of all resi-dential users of fuel oil and kerosene could con-vert. If we assume a similar market penetrationfor commercial users of these fuels, conversionsfrom oil to gas could replace about 0.44 MMB/Dof oil (see table 9).
These conversions to natural gas would requirethe installation of about 7 million burners in res-idential households and about 1 million burnersin commercial establishments, together withabout 1 million new boilers where the old oil-fired ones required replacement.63 In addition,about 5 million customers would require the in-stallation of new distribution lines, while 2 mil-lion to 3 million are already connected to gaslines. 64
Current production capacity for natural gasburners is about 1.5 million units per year;65 andthe highest historical rate for connecting new gascustomers is about 1 million per year. Conse-quently, with only a modest growth in these rates,all of the potential gas customers could be sup-plied with new distribution lines (where needed)and gas burners within about 4 to 5 years. Withthis rate of deployment, new gas boilers wouldnot be a constraint, since current production ca-pacity is about 0.4 million units per year66 andthe needed supply could be provided within 2.5years.
In addition to these generic constraints, gas usefor heating in New England (region 1) is currently
621 bid.bJGibbs & Hill, Inc., “oil Replacement Analysis, Phase ],” Op. cit.b4Gibbs & Hill, Inc., “Oil Replacement Analysis, Phase 11, op. cit.651 bid.661 bid.
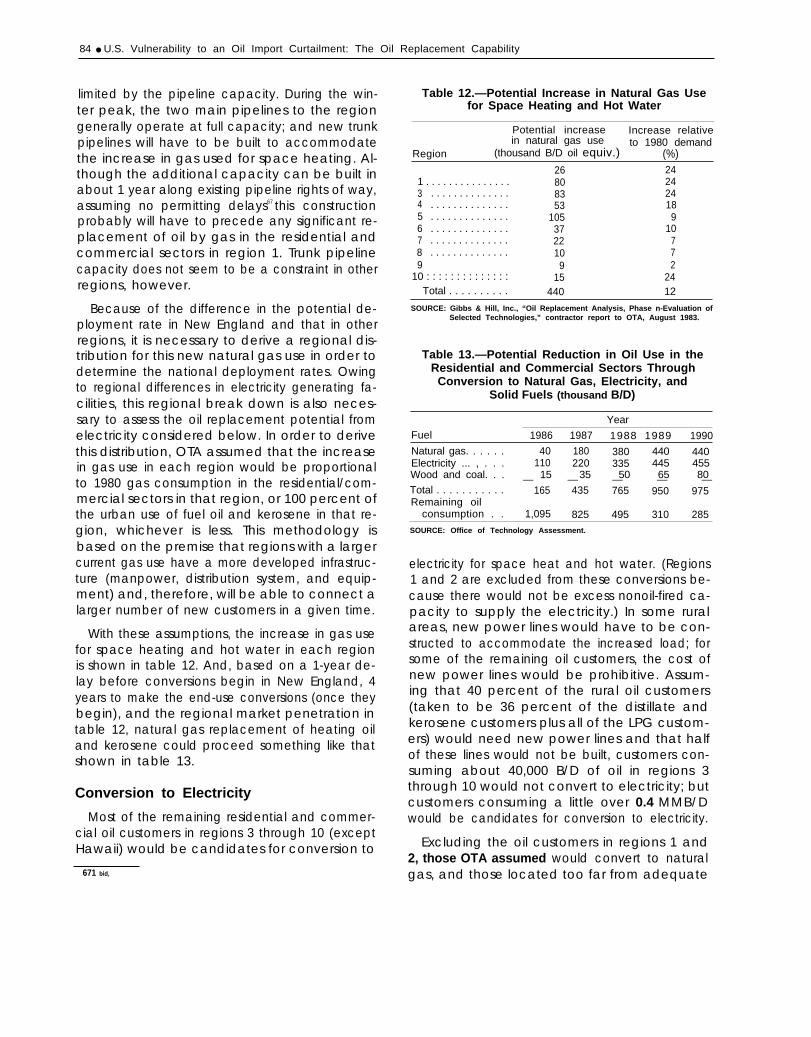
84 ● U.S. Vulnerability to an Oil Import Curtailment: The Oil Replacement Capability
limited by the pipeline capacity. During the win-ter peak, the two main pipelines to the regiongenerally operate at full capacity; and new trunkpipelines will have to be built to accommodatethe increase in gas used for space heating. Al-though the additional capacity can be built inabout 1 year along existing pipeline rights of way,assuming no permitting delays67 this constructionprobably will have to precede any significant re-placement of oil by gas in the residential andcommercial sectors in region 1. Trunk pipelinecapacity does not seem to be a constraint in otherregions, however.
Because of the difference in the potential de-ployment rate in New England and that in otherregions, it is necessary to derive a regional dis-tribution for this new natural gas use in order todetermine the national deployment rates. Owingto regional differences in electricity generating fa-cilities, this regional break down is also neces-sary to assess the oil replacement potential fromelectricity considered below. In order to derivethis distribution, OTA assumed that the increasein gas use in each region would be proportionalto 1980 gas consumption in the residential/com-mercial sectors in that region, or 100 percent ofthe urban use of fuel oil and kerosene in that re-gion, whichever is less. This methodology isbased on the premise that regions with a largercurrent gas use have a more developed infrastruc-ture (manpower, distribution system, and equip-ment) and, therefore, will be able to connect alarger number of new customers in a given time.
With these assumptions, the increase in gas usefor space heating and hot water in each regionis shown in table 12. And, based on a 1-year de-lay before conversions begin in New England, 4years to make the end-use conversions (once theybegin), and the regional market penetration intable 12, natural gas replacement of heating oiland kerosene could proceed something like thatshown in table 13.
Conversion to Electricity
Most of the remaining residential and commer-cial oil customers in regions 3 through 10 (exceptHawaii) would be candidates for conversion to
671 bid,
Table 12.—Potential Increase in Natural Gas Usefor Space Heating and Hot Water
Potential increase Increase relativein natural gas use to 1980 demand
Region (thousand B/D oil equiv.) (%)26 24
1 . . . . . . . . . . . . . . . 80 243 . . . . . . . . . . . . . . 83 244 . . . . . . . . . . . . . . 53 185 . . . . . . . . . . . . . . 105 96 . . . . . . . . . . . . . . 37 107 . . . . . . . . . . . . . . 22 78 . . . . . . . . . . . . . . 10 79 9 2
10 : : : : : : : : : : : : : : 15 24Total . . . . . . . . . . 440 12
SOURCE: Gibbs & Hill, Inc., “Oil Replacement Analysis, Phase n-Evaluation ofSelected Technologies,” contractor report to OTA, August 1983.
Table 13.—Potential Reduction in Oil Use in theResidential and Commercial Sectors Through
Conversion to Natural Gas, Electricity, andSolid Fuels (thousand B/D)
Year
Fuel 1986 1987 1988 1989 1990
Natural gas. . . . . . 40 180 380 440 440Electricity ... , . . . 110 220 335 445 455Wood and coal. . . 15 35 50 65 80— — — — —Total . . . . . . . . . . . 165 435 765 950 975Remaining oil
consumption . . 1,095 825 495 310 285SOURCE: Office of Technology Assessment.
electricity for space heat and hot water. (Regions1 and 2 are excluded from these conversions be-cause there would not be excess nonoil-fired ca-pacity to supply the electricity.) In some ruralareas, new power lines would have to be con-structed to accommodate the increased load; forsome of the remaining oil customers, the cost ofnew power lines would be prohibitive. Assum-ing that 40 percent of the rural oil customers(taken to be 36 percent of the distillate andkerosene customers plus all of the LPG custom-ers) would need new power lines and that halfof these lines would not be built, customers con-suming about 40,000 B/D of oil in regions 3through 10 would not convert to electricity; butcustomers consuming a little over 0.4 MMB/Dwould be candidates for conversion to electricity.
Excluding the oil customers in regions 1 and2, those OTA assumed would convert to naturalgas, and those located too far from adequate

Ch. IV-Fuel Switching Ž 85
power lines, a little over 8 million customerscould convert to electricity. Of these customers,about 35 percent or 3 million also used oil forhot water.68 Consequently, the switch to electri-city would require space heating for 8 millionhouseholds and commercial establishments andabout 3 million electric hot water heaters.
In 1980, about 13.4 million portable electricheaters and 2.8 million fixed electric baseboardheaters were shipped.69 If manufacturing facili-ties for these devices were operating at 70 per-cent of capacity in 1980, current manufacturingcapacity could supply 19 million space heatersand 4 million baseboard heaters per year.
Furthermore, it has been estimated that, in1981, about 0.5 million central heat pumps (forheating) and 1.5 million central air-conditioningsystems were installed .70 Because of the similar-ity between heat pumps and air-conditioners,manufacturers of central air-conditioners couldeasily convert to making heat pumps. If manu-facturing facilities were operating at 70 percentof capacity and one-third of the air-conditionermanufacturers can convert to heat pump manu-facturing, about 1.5 million central heat pumpscould be manufactured and installed per year.By an analogous reasoning process, 1981 instal-lations of unitary (window-mounted) heat pumpsand air-conditioners (estimated at 0.5 million and3.7 million, respectively 71) imply a production ca-pacity of 2.5 million unitary heat pumps per year.
Between 1970 and 1980, the number of house-holds with hot water heaters increased by 17 mil-lion; and the number with electric hot water heat-ers increased by 10 million .72 I n addition, anunknown number of hot water heaters were in-stalled as replacements for existing heaters; andmany of the manufacturers of nonelectric unitscould easily convert to produce electric units.Consequently, the production capacity for elec-tric hot water heaters is probably at least 2 mil-
GBThiS assumes that the prc3pOrt iOn of cOIYImerclal Oil CUStOrTlerS
who use oil for both heat and hot water is the same as it is for resi-dential oil customers.
bq’’Selected Heating Equipment, ” MA34N, U.S. Bureau of theCensus.
70 Gibbs & Hill, Inc., “Oil Replacement Analysis, Phase l,” op. cit.71 Ibid.72’’ Housing Characteristics, ” U.S. Bureau of the Census, 1970;
and “Provisional Estimate of Social, Economic and Housing Char-acterlstics, ’’PHC 80-51-1, 1980.
lion units per year, and perhaps considerablylarger. 73
If 50 percent of the customers converting toelectricity go to central heat pumps, 25 percentgo to unitary heat pumps (4 to 5 units per cus-tomer), and the remaining needs are supplied byelectric resistance heating, the necessary equip-ment for the 8 million space heating conversionscould be supplied in less than 4 years; and the3 million hot water heaters could easily be sup-plied in this time or less. If the equipment wereinstalled within 4 years in each region, the oilreplacement by electricity could proceed like thatshown in table 13. If, however, more electric re-sistance heating were used, the initial oil replace-ment could be somewhat greater than that shownin the table. For example, if 75 percent of the cus-tomers go to electric resistance heating, over 70percent of the total oil replacement shown for1990 could be achieved by 1987.
Conversion to Solid Fuels
A third option open to residential and commer-cial oil users is to switch to solid fuels, primarilywood and coal. This option is most important inregions 1 and 2 because of the large supplies ofwood and the lack of other options for residen-tial and commercial customers. For these reasonsswitching to solid fuels is considered in detail forthese regions. Elsewhere, however, most of theoil could be replaced by switching to natural gasand electricity. Consequently, while a detailedconsideration of solid fuel switching would in-crease the initial rate that oil is replaced in re-gions 3 through 10,74 it would not significantly
TJlgnoring replacements and assuming that half of the manufac-
turers of nonelectric hot water heaters converted to the produc-tion of electric heaters and that the manufacturing facilities oper-ated at 70 percent of capacity during the 1970s, current productioncapacity would be 1.35 + 0.7 = 1.9 million units per year.
‘qBetween 1978 and 1980, the years when residential and com-mercial use of wood increased the fastest, wood energy use in thesesectors increased by the equivalent of about 40 MB/D (thousandbarrels per day) annually in regions 3 through 10 (EIA, “Estimatesof Wood Energy Consumption 1949 to 1981 ,“ op. cit.). At the sametime coal consumption in these sectors dropped by the equivalentof 15 MB/D annually. Ignoring the drop in coal consumption andassuming that this rate of wood use increase could be doubled andthat wood heating is half as efficient as oil heating, then the totaloil replacement shown in table 13 could be increased by about35 MB/D in 1986, 70 MB/D in 1987, and 105 MB/D in 1988 throughinclusion of this rate of switching to wood in regions 3-10. The 1989and 1990 totals, however, would be unaffected.

86 ● U.S. Vulnerability to an Oil Import Curtailment: The Oil Replacement Capability
affect the total amount of oil replaced by 199o.Therefore, for the purposes of this analysis, OTAhas simply assumed that half of the remainingresidential and commercial oil use in regions 3through 10, or about 20,000 B/D, could be re-placed with solid fuels.
Historically, the largest increase in the use ofwood in the residential and commercial sectorsoccurred between 1978 and 1980 and amountedto the energy equivalent of about 4,000 B/D an-nual increase in each of regions 1 and 2.75 Assum-ing that this rate of increase in wood use couldbe doubled and that wood heating is half as effi-cient as oil heating, then wood could replace anadditional 40,000 B/D of oil in regions 1 and 2.
Although national coal use in the residentialand commercial sectors has declined each yearsince at least 1950, coal consumption by thesesectors in regions 1 and 2 experienced a 1-yearincrease around 1980 by the energy equivalentof 1,000 B/D of oil in region 1 and 3,000 B/D inregion 2.76 Assuming this annual increase couldbe doubled and that coal heating is equivalentto wood heating in efficiency, then coal couldreplace another 20,000 B/D of oiI within 5 years.
As shown in table 13, inclusion of solid fuelconversions would increase the amount of oil re-placed by about 80,000 B/D in 1990. Althoughthe total increase in the use of solid fuels couldbe larger, most of the additional use above 80,000B/D would probably be a substitute for or an ad-dition to conversions to natural gas and electri-city in regions 3 through 10.
The above analyses indicate that, within 4 yearsafter the onset of an oil supply shortfall, fuelswitching couId virtually eliminate the use of oilfor space heating and hot water in most regionsof the country. Replacing all of the oil used bythe residential and commercial sectors in regions1 and 2, however, would take considerably long-er, owing to the heavy dependence on oil ofthese sectors and electric utilities in the regions.
75EIA, “Estimates of Wood Energy Consumption 1949 to 1981 ,“op. cit.
7“’State Energy Data Report, ” U.S. Department of Energy,DOE/EIA-0214( 81), june 1983.
Industrial Boilers
In 1980, the industrial sector consumed about0.7 MMB/D of residual fuel oil, mostly as a boilerfuel, and another 0.2 MMB/D of distillate fuel oilfor a variety of heat purposes, including processheat and some boiler fuel.77 78 By 1982, residualuse dropped to 0.5 MMB/D and distillate use alsodropped slightly,79 For the purposes of this study,however, OTA assumed that, with some econom-ic recovery, Industrial use of these fuels will re-turn to their 1980 values by 1985.
The major replacements for oil used as a boilerfuel are solid fuels (direct combustion and gasi-fication of coal and wood and CWMS) and natu-ral gas.80 Conversions to solid fuels are consid-ered first, followed by estimates of the rate thatthe available natural gas could replace the re-maining oil use in industrial boilers.
Conversion to Solid Fuels
In 1979, there were about 146,000 oil-fired in-dustrial boilers in the United States, of whichnearly 142,000 had a capacity of less than 50MMBtu/hr.el Nevertheless, almost half of the oilused as boiler fuel was consumed in the 4,000boilers over 50 MMBtu/hr, and by 1985 theseboilers will consume an estimated 0.4 MMB/D.
Assuming that half of the oil consumed in thelarger (greater than 50 MMBtu/hr) boilers couldbe replaced with solid fuels82 83 and that the aver-age boiler being replaced or converted had a
—.—7Total industrial consumption of disti I late fuel oi I was about 0.7
MMB/D in 1980. However, OTA assumed that 90 percent of thedistillate used in the non manufacturing sectors was used for mobileengines such as in off-road construction, mining, and agriculturalequipment and machinery. The fuel used by these mobile enginesare included in the next section, together with oil consumption fortransportation.
78EIA, “ 1981 Annual Report to Congress, op. cit.79”1 982 Annual Energy Review, ” U.S. Department of Energy,
DOE/ElA-0384 (82), April 1983.~Oln addition, since some of the steam t’rom boilers is used for
mechanical drive, a portion of the boiler fuel could be replacedwith electric motors; but OTA has not analyzed this option.
‘1 “Population and Characteristics of Industrial Boilers in the U.S., ”U.S. Environmental Protection Agency, EPA/600/7-79-l 78-A, August1979,
*~Gibbs & Hill, Inc., “Oil Replacement Analysis, Phase 11, ” op. cit.~~See also P. C. Kurtzrock, “Planning Objectives, ” proceedings
of the Coal-Water Fuel Technology Workshop, BNL-51 427, Mar.18-21, 1981.

Ch. IV–Fuel Switching ● 8 7
capacity of 135 MMBtu/hr and operated at a 35percent capacity factor, then about 1,000 largeboilers would have to be replaced or converted .84Historically, the highest annual sales of 100 to 250MMBtu/hr boilers was 248 units in 1973.85 In thissize range, however, most solid fuel boilers arefield-erected, for which the historical high was57 units sold in 1969; but the major boiler man-ufacturers estimate that, at full capacity and withconsiderable duplication of engineering designs,up to 550 boilers could be field-erected within3 to 4 years.86 In addition, many of the boilerscould be converted to burn solid fuels or CWMSdirectly or could be equipped with gasifiers; andthe manufacturing constraints are considerablyless severe for these types of conversions. In thesecases, additional “slide along” boilers would beneeded to make up for the lost capacity resultingfrom boiler derating. However, these would besmaller, prefabricated boilers, for which produc-tion capacity is about 1,100 units per year.87
gATheSe assur-r-rptlc)rls reflect the fact that, of the boilers for whichconversion is technically feasible, the boilers consuming the largestamounts of oil are most likely to be converted.
“Gibbs & Hill, Inc., “Oil Replacement Analysis, Phase 11, ” op. cit.MI bid.‘The recent historical high for the sales of 10 to 100 MM Btu/hr
solid fuel boilers was 100 units in 1973. However, manufacturersof gas and oi I boi Iers could easily convert their facilities to produce
Regardless of whether the boilers are replacedor converted, each system would require a par-ticulate control system (PCS) to limit particulateemissions. Historically, the largest number ofPCSs sold was 200 units in 1980; but the indus-trial Gas Cleaning Institute estimates that 1,000units could be produced in about 3 years.
Based on these production capacities, it ap-pears that 1,000 large industrial boilers could beconverted to solid fuels in about 3 to 4 years.Assuming 4 years and the engineering and con-struction schedules shown in figures 32 and 33,replacement of oil by solid fuels in large indus-trial boilers could proceed something like thatshown in table 14.
As indicated above, solid fuel boilers to replacethe smaller industrial oil-fired boilers could bemanufactured at a rate of about 1,100 units peryear, and perhaps 5,000 boilers could switch in5 years.88 Assuming that one-quarter of the small(less than 50 MMBtu/hr) boilers consume half of
solid fuel boilers; and when these are included, the historical 1 yearhigh is 800 boilers. Assuming that this is 70 percent of peak capac-ity, then the latter is 1,100 units per year.
sBThis assumes that 500 of these boilers would be needed in con-
junction with the large boiler conversions, in order to compensatefor derating.
Figure 32.—Schedule for Engineering and Construction: Coal” or Wood-Firing Steam Generating System,Fuel-Handling Facilities, and Particulate Control System
Month
Engineering
Permitting
Procurement1 Boiler Particulate control system
Fuel handling facility
Construct ion - - - - i
1
Startup
.
SOURCE Off Ice of Technology Assessment

88 Ž U.S. Vulnerability to an Oil Impot Curtailment: The Oil Replacement Capability
Figure 33.-Schedule for Engineering and Construction: Industrial Boiler Conversion to Solid Fuels
SOURCE: Office of Technology Assessment.
Table 14.—Potential Reduction in Oil Used inIndustrial Boilers Through Conversion to Solid
Fuels and Natural Gas (thousand B/D oil)
Year
Fuel 1985 1986 1987 1988 1989 1990
Solid fuels . . . . . . . . . . . — O 40 90 150 200Natural gas . . . . . . . . . . — 190 330 420 445 455— — — — —
Total — 190 370 510 605 655
Remaining oilconsumption inindustrial boilers. . . . 960 770 590 450 355 305
SOURCE: Office of Technology Assessment and Gibbs& Hill, Inc., “Oil Replace-ment Analysis, Phase n-Evaluation of Selected Technologies,” con-tractor report to OTA, August 1983.
the oil used in small boilers, an additional 0.04MMB/D of oil could be replaced by solid fuels.89
The inconvenience of using solid fuels, however,could limit the number of small boiler conver-sions to considerably less than this number.
Conversion to Natural Gas
The other major option is to convert industrialboilers to natural gas. Based on OTA’s allocationof the assumed quantities of natural gas, the in-dustrial sector could increase its gas use by theequivalent of about 0.45 MMB/D of oil. If the new
sgone.qua~er of the boilers would be 35,500 boilers. Assumingthese boilers use 0.25 MMB/D of oil, then 5,000 boilers would useapproximately 0.035 MMB/D.
gas customers consume, on average, the sameamount of gas per customer as current industrialgas users (i.e., 42 billion Btu/yr90), this incrementof natural gas use would require approximately22,000 new customers.91
In 1981, there were 187,900 industrial gas cus-tomers, down from 209,100 in 1973.92 Many ofthese customers switched back to oil while re-taining the ability to reconvert quickly to gas. Inaddition, the number of industrial gas custom-ers grew by 5,000 to 7,000 customers per yearin the late 1960s. This indicates that, even if somenew distribution lines must be built, the 20,000industrial customers could probably be convertedto gas in 2 to 3 years. Assuming 2.5 years for theconversions, the rate of oil replacement by nat-
—.—“’Gas Facts,” American Gas Association, Department of Statis-
tics, Arlington, VA, 1981.91An alternative way to derive the number of new customers is
as follows. Assume that all of the 3,000 large boilers not convertedto solid fuels convert to gas. These boilers would consume about44 percent of the gas increment, or the equivalent of 0.2 MMB/Dof oil. If one-quarter of the small gas boilers consume half of theremaining 0.5 MM B/D of oil targeted for replacement, then the re-maining 0.25 MM B/D equivalent of gas allocate to industry wouldinvolve 142,000 + 4 = 35,500 boilers. Many industrial concernswith small, package boilers have several boilers in parallel and/orreserve boilers to improve system reliability. Assuming two boilersper customer, on average, the total number of new gas customerswould be 35,500 + 2 + 3,000 = 20,750.
92’’ Gas Facts,” American Gas Association, op. cit.

Ch. IV—Fuel Switching ● 8 9
ural gas could look something like that shownin table 14. Furthermore, it is clear that more oilcould be replaced if natural gas supplies are great-er than those assumed, but the rate of oil replace-ment would taper off as more conversions wouldbe needed for each additional increment of oilreplaced.
This analysis indicates that almost 0.7 MM B/Dof oil used in industrial boilers could be replacedwith solid fuels and natural gas within 5 years afteran oil supply disruption. About 65 percent of thetotal would be replaced by the increased natu-ral gas supplies that OTA assumes will be avail-able to industry. Clearly, the actual oil replace-ment will depend critically on the quantity ofsurplus gas that actually materializes.
Mobile Engines
In 1980, highway transportation consumedabout 6.3 MM B/D (oil equivalent) of gasoline and0.9 MM B/D of diesel fuel. The gasoline went pri-marily to automobiles (4.6 MMB/D) and trucks(1.7 MM B/D), while trucks consumed 92 percentof this diesel fuel.93 Non highway transportationconsumed an additional 2.0 MM B/D of oil, pri-marily as jet fuel (0.8 MMB/D), residual fuel oilin ships (0.7 MMB/D), and diesel fuel in trains (0.3MMB/D) .94 In addition, off-road vehicles andequipment in construction, mining, and agricul-ture (the industrial sector) consumed an estimated0.5 MMB/D.95
By 1985, increased fuel efficiency in automo-biles and light trucks is likely to reduce gasolineconsumption to around 6 MMB/D,96 while the——_——-
I13G, Kulp and M. c. HOlcOrnb, ‘‘Transportation Energy Data Book,
Sixth Edition, ” Oak Ridge National Laboratory, Oak Ridge, TN,ORNL-5883, 1982.
941 bid.gSASSUrning that 90 percent of the distillate and gasoline used in
mining and construction was for mobile engines.g6Th is assumes that the average fuel efficiency Of new CarS sold
in 1985 will be 27.5 mpg and that the percentage efficiency increasein Ilght trucks on the road will be half as large as for automobiles.Also, between 1979 and 1980, gasoline consumption dropped by0.5 MMB/D; and OTA estimates that 0.3 MMB/D of this drop wasdue to people driving less. The 1985 estimate for gasoline consump-tion, however, assumes that driving levels would have returned toextrapolations of the pre-1 978 levels. See also /ncreased Au(ornobi/eFuel Efficiency and Synthetic Fuels: Alternatives for Reducing Oil/reports (Washington, D. C.: U.S. Congress, Office of TechnologyAssessment, OTA-E-1 85, September 1982. ) (Note, however, thatin the latter report, 1 barrel of oil equivalent is equal to 5.9 MMBtu,while in the current report it is taken equal to 5.5 MM Btu. )
other categories are likely to be similar to their1980 values.
The principal technologies studied for replac-ing the oil used in mobile engines are ethanolproduction and conversions to compressed nat-ural gas (CNG), liquefied petroleum gas (LPG),and mobile gasifiers. These substitutes are bestsuited to spark ignition (gasoline) engines, al-though they can be adapted to diesel engines.Ethanol can also be used as a fuel for jet engines,but its lower energy density (energy per unitweight) as compared to jet fuel and the need forextensive testing to ensure safety are likely to limitits use severely in jets in the near future. It is notnecessary, however, to specify the exact enduses, since the potential for these alternatives isquite limited relative to the amount of fuel con-sumed by mobile engines.
Ethanol Production
A 50 million gal/yr ethanol distillery can be con-structed in about 2 years, as shown in figure 34.Each distillery would require a 250 to 300MMBtu/hr boiler and particulate control systemidentical to those discussed in the previous sec-tion. To the extent that this equipment is suppliedto ethanol distilleries, the supply for industrialboiler conversions would be reduced; and bothtypes of activities could be delayed somewhat.Each distillery, however, would also require 3 to5 centrifuge decanters with capacities of 250 to400 gallons per minute.97 Production capacity forcentrifuges is proprietary, but one leading sup-plier indicated that, in an emergency, perhaps500 steel castings could be obtained over a 5-yearperiod.98 With an average of four centrifuges perdistillery and a l-year delay after the equipmentprocurement before the final distillery becomesoperational, perhaps 100 ethanol distilleries couldbe completed in 5 years. At this rate of construc-tion, the boilers, particulate control systems, andother equipment needed for the distilleries couldprobably be obtained without significant delays.
One hundred ethanol distilleries of this sizewould produce 5 billion gallons of ethanol an-nually, with an energy content of about 0.2MMB/D. Because of the energy used in agricul-
g7Gibbs & Hil[, Inc., “oil Replacement Analysis, Phase I I,” Op. Cit.981 bid .
37-833 0 - 84 - 7

90 ● U.S. Vulnerability to an Oil Import Curtailment: The Oil Replacement Capability
Figure 34.-Schedule for Engineering and Construction of a 50 Million Gal/yr Ethanol Plant
I I
SOURCE: Office of Technology Assessment.
ture to supply the grain feedstock for the distil-leries, however, this ethanol would probably re-place less than 0.1 MMB/D of oil, net (see app.B). Based on these estimates, oil replacement byethanol could proceed as shown in table 15.
Conversion to Compressed Natural Gas
The analysis of vehicle conversions to CNG in-dicates that the factor limiting the rate of conver-sions is most likely to be the availability of natu-ral gas compressors. A typical compressor witha capacity of 20 standard cubic feet per minute
(scfm) could service about 20 vehicles, with slowfill (1 O hour) for 15 of the vehicles and fast fill (3to 5 minutes) for the remaining 5. Larger fleetsof vehicles would typically be serviced with mul-tiples of this arrangement,99 although they coulduse somewhat larger compressors. If the com-pressor operates at full capacity an average of 10hours per day, 5 days a week, each compressorcould deliver about 3 billion Btu of CNG per year.
W[bid,
Table 15.—Potential Reduction in Fuel Use in Surface Transportationand Mobile Industrial Engines (thousand B/D oil)
Year
Fuel 1985 1986 1987 1988 1989 1990
Ethanol . . . . . . . . . . . . . . . . . — o 25 50 75 100CNG a . . . . . . . . . . . . . . . . . . — 8 16 24 32 40LPG b , . . . . . . . . . . . . . . . . . — 40 40 40 40 40Mobile gasifiers. . . . . . . . . — o 0 50 100 100
Total c. . . . . . . . . . . . . . . . — 164 247 280(48) (121) (244) (367) (440)
Remaining gasolineand diesel fuelconsumption . . . . . . . . . 7,530 7,480 7,410 7,290 7,160 7.090
%ompressed natural gas.bLiquef ied petrOleum 9as.cNumber in parentheglg indicates ~tential increase in LPG consumption In vehicles. However. at most ~.~ ~D would be
from new production; the remainder would be a shift In LPG from’ stationary uses.SOURCE: Office of Technology Assessment.
Ch. IV—Fue/ Switching • 91
In 1980, 5,512 gas compressors were shipped,which is close to the historical high of 5,770 unitsin 1974.100 Assuming that manufacturing facili-ties were operating at 70 percent of capacity, thenan additional 2,400 compressors per year couldbe manufactured.101 If 2,000 of these could bemanufactured to the specifications needed forCNG vehicle refills and the production increasedby 50 percent per year,102 then about 26,000CNG compressors could be delivered in 5 years.These compressors could provide enough CNGto replace about 0.04 MM B/D of oil with the de-ployment shown in table 15. If larger fleets uselarger compressors, the total replacement couldbe increased somewhat; but in light of the op-timistic assumptions about compressor availabil-ity, it seems clear that the total potential fromCNG is small.
Conversion to Liquefied Petroleum Gas
As outlined in the section on “Fuel and GrainSupplies,” an incremental production of 2 TCF/yrof natural gas would result in about 0.04 MMB/Doil equivalent of LPG suitable for internal com-bustion engines; and this would be sufficient tofuel about 1 million vehicles. The analysis of vehi-cle conversions indicates that about five times thismany vehicles could be switched to LPG over a5-year period.103 Nevertheless, the full conver-sion capacity could be needed if the 0.16 MMB/Dof LPG replaced from the residential and com-mercial sectors is to be used as a vehicle fuel.Only the new LPG production, however, wouldreplace oil; the remainder would simply be atransfer of petroleum used in one sector to
lm’’Pumps and Compressors,” Current Industrial Reports, MA35P,U.S. Department of Commerce, Bureau of the Census, December1981.
101 I n contra5t to this, Over 1.5 million air compressors wereshipped in 1980 (Ibid.). However, natural gas compressors are farmore complex than air compressors because of stricter sealing re-quirements, higher pressures, and the need for intercoolers, con-densate traps, and precautions against sparking. The air compressormanufacturing capacity, therefore, cannot be used to judge pro-duction capacity for CNG compressors.
IOzThiS corresponds to an 1 l-percent annual increase in produc-tion capacity for all gas compressors with all of the increase goingto natural gas compressors. This may be overly optimistic in viewof the historical 3.1 -percent annual increase in industry sales overthe past 20 yea~ (I bid.) and the long Ieadtime for some items neededto manufacture gas compressors (Gibbs & Hill, Inc., “Oil Replace-ment Analysis, Phase 11, ” op. cit.).
‘03Gibbs & Hill, Inc., “Oil Replacement Analysis, Phase 11,” op. cit.
another. Consequently, the oil replacement po-tential would be limited by the rate that new LPGcould be produced. Based on the previous anal-yses of new natural gas use, the oil replacementby LPG vehicles could develop as shown in table1 S. To the extent that the natural gas is importedor made available through fuel switching andconservation, however, the LPG would have tobe obtained from sources outside of the UnitedStates, which would be roughly equivalent to im-porting more oil.
Conversion to Mobile Gasifiers
The final technology considered is the mobilegasifier. The analysis of this technology indicatesthat the components needed for mobile gasifiersare so common that several million units couldbe produced annually, following an initial 2-yeardelay to establish standard designs and completefleet tests.104 Consequently, after the initial periodit is likely that gasifier deployment would belimited by the potential market for these devices.
In Sweden during World War II, the marketpenetration of mobile gasifiers reached 30 per-cent of the automobiles (but later dropped to 10percent), 55 percent of tile trucks, and 70 per-cent of the buses; 105 but this is probably muchlarger than could be achieved in the United Statestoday. Assuming that gasifiers, on average, re-place half of a vehicle’s fuel needs and that mar-ket penetration reaches one-fifth of that in Swe-den during World War II, then mobile gasifierscould replace about 0.1 MMB/D of oil. The oilreplacement by mobile gasifiers could then pro-ceed as shown in table 15. These estimates, how-ever, are highly speculative.
This analysis of fuel switching in mobile enginesindicates that perhaps 0.2 to 0.3 MMB/D of oilcould be replaced, but the constraints are quitesevere. Ethanol, which can be used with the leastamount of end use difficulty, is derived from en-ergy-intensive agricultural feedstocks. As agricul-tural production expands, the energy (per unitethanol) consumed in supplying the feedstock in-creases; and the net oil savings drops. CNG useis constrained by the availability of gas compres-
IOdRaSOr Associates, Op. cit.
’051 bid.

92 • U.S. Vulnerability to an Oil Import Curtailment: The Oil Replacement Capability
Photo credit: National Academy Press
Mobile gasifiers can be used to fuel a variety of vehicles, but market demand for the devicesduring a large oil shortfall is highly uncertain

Ch. IV—Fuel Switching • 93
sors. Oil replacement by LPG is limited by thequantities of LPG that can be produced from newnatural gas production. And mobile gasifiersprobably will be limited by the inconvenience ofusing solid fuels.
Summary
The potential for reducing oil consumptionthrough the fuel switching options consideredhere is summarized in table 16. If these optionsare implemented, the major remaining uses ofoil would be for transportation and other mobileengines, petrochemical feedstocks, asphalt, lu-
bricants, and specialized industrial processes.There would also be some oil use remaining forhome heating in regions 1 and 2 and some in-dustrial boilers. Replacing large additional quan-tities of oil, therefore, will require production ofsynthetic transportation fuels and chemical feed-stocks from coal and biomass.
A critical assumption in this analysis, however,is that sufficient natural gas would be availableto replace 1 MMB/D of oil. If this is not available,then space heating and hot water needs in mostregions could rely more heavily on electricity, butoil consumption by industrial boilers wouldcrease substantially above these estimates.
Table 16.—Summary of Potential Reduction in Oil Use Through Fuel Switching(thousand B/D oil equivalent)
Year
Use 1986 1987 1988 1989 1990
Electric utilities . . . . . . . . . . . . . . . . 320 430 500 570 590 Residential/commercial
space heat and hot water . . . . . 165 435 765 950 975Industrial boilers . . . . . . . . . . . . . . 190 370 510 605 655Surface transportation . . . . . . . . . . 50 80 165 245 280
Total . . . . . . . . . . . . . . . . . . . . . . . 725 1,315 1,940 2,370 2,500Increased natural
gas usea . . . . . . . . . . . . . . . . . . . . 440 740 960 1,000 1,020Increased solid
fuel useb. . . . . . . . . . . . . . . . . . . . 120 390 780 1,120 1,240
in-
alncludes Increased use of gas for incremental fertilizer production for the agriculture used to SupPly ethanol feed stocksblncludes fuel used in ethanol pr~duCti~n and for InCreased electric generation, assuming that 80 perCent Of the increased
electric generation is in coal-fired powerplants.
SOURCE: Office of Technology Assessment.
ENVIRONMENTAL IMPACTS
The major changes in fuel use due to fuelswitching are a reduction in residual and distillateoil use and an increase in natural gas and coalconsumption. Although there would be a smalldecrease in emissions as a result of the reductionin distillate fuel oil use and a corresponding in-crease in natural gas consumption, the major im-pacts are likely to be associated with the changesin residual fuel oil and solid fuel consumption.
The increased use of coal (up to 115 milliontons/yr) will require that production be increasedby up to 13 percent over 1982 production, with
attendant problems such as acid mine drainage,subsidence, and other mining-related impacts.About 65 million tons/yr of coal would be usedin utility and industrial boilers converted from oil.To avoid increases in sulfur and particulate emis-sions, these boilers would have to use low-sulfurcoal and particulate control systems, for whichsupplies are adequate for the postulated scenar-ios. However, there probably would be an in-crease in NOX emissions in some of theseboilers; and to the extent that fuels with highersulfur contents are used in converted boilers(without new scrubbers), SO2 emissions wouldalso increase.

94 . U.S. Vulnerability to an Oil Import Curtailment: The Oil Replacement Capability
An additional 35 million tons/yr of coal wouldbe used in new and existing coal-fired utility boil-ers to replace (mostly distillate) fuel oil used inthe residential and commercial sectors, whichwould also lead to an increase or at least a delayin the reduction (through retiring older boilers)of S02 and NOX emissions.
The remaining 15 million tons/yr would be usedin new ethanol distilleries. Distilleries with a ca-pacity of greater than about 50 million gal/yr ofethanol supplied with a single boiler (greater than250 MMBtu/hr) would be subject to Federal NewSource Performance Standards; but there are cur-rently no Federal regulations for smaller boilers.Furthermore, the Environmental Protection Agen-cy regulations promised for 1986 for boilers ratedat 50 MM Btu/hr and larger will not include reg-ulations on SO2 emissions; and it is unclear howstringent the other regulations will be. Conse-quently, it is likely that emissions from most ofthe ethanol distilleries will be determined primar-ily by State and local requirements for emissionscontrols, and many distilleries will locate wherethese requirements are least stringent. Further-more, since the ethanol will be used to replacegasoline (rather than residual fuel oil, as in thecase of boiler conversions above), even if Iow-
sulfur coal is used, a net increase in SO2 andNOX emissions will occur.
Production of 5 billion gal/yr of ethanol (whichis capable of reducing U.S. oil consumption byabout 0.1 MMB/D) would require a 15-percentincrease in grain production. This would proba-bly lead to more than a 15-percent increase insoil erosion and the accompanying pesticide andfertilizer runoff, because much of the new crop-Iand used for grain production is more erosivethan average cropland.
The increased supplies of wood for fuel couldbe supplied as part of careful forest managementprograms without significant adverse environ-mental impacts. However, if the wood is har-vested in a haphazard manner, damage to theforest and, eventually, forestland productivitycould be substantial. Furthermore, burning woodwithout emissions controls (e.g., for home heat-ing) would likely lead to significant local increasesin particulate emissions, including higher levelsof polynuclear aromatics (which are generally nota problem with either central electric power gen-eration or natural gas or oil combustion); butsulfur emissions from wood are insignificant.
APPENDIX A–REASONS FOR EXCLUDING VARIOUSOIL REPLACEMENT TECHNOLOGIES FROM
DETAILED CONSIDERATION
The initial list of fuel switching technologies (table6) was screened to identify those options with thegreatest potential for replacing at least 0.2 MM B/D ofoil within a 5-year period following a large oil short-fall in 1985. Some of the technologies that were elim-inated from further consideration by this screeningprocess and the specific reasons for eliminating themare given below.
Fossil Synthetic Fuels
The primary concern of this study is to examine thetechnologies that can be deployed within 5 years afterthe onset of an oil shortfall. Construction of new, large-scale oil shale and coal liquids plants is likely to take
longer than 5 years.106 Although additional modulescould be added to synfuel plants already in operationby 1985-90, in OTA’s judgment the total additionaloutput, beyond that already planned, is not likely toexceed 0.1 MMB/D before 1990. Consequently, large-scale oil shale and coal liquids plants are judged tobe longer term options that are beyond the scope ofthis study.
True in situ oil shale retorts,107 on the other hand,can be constructed in a matter of weeks. The retorts,which are underground cavities prepared with explo-
——1~/ncreased Automobile Fuel Efficiency and Synthetic Fuels, op.
cit.“Wbid.

Ch. IV—Fuel Switching • 95
sive charges, cover about an acre each and producearound 20,000 barrels of shale oil over a 6-to 8-monthperiod. Achieving 20,000 B/D of production wouldrequire the completion of at least one retort per day,year round. This would entail a sharp increase in thenumber of trained personnel, construction of pipelinesand new roads to remote areas, and considerable newequipment. (To date about 25 test retorts have beencompleted over a 7-year period.) The logistics of ac-complishing this expansion, together with the remain-ing technical uncertainties in the process (notably thedepth of overburden that can be accommodated andthe control of fugitive emissions) would probably limitproduction to well below 0.1 MMB/D within a 5-yeartime period.
Another possibility is to use methanol producedfrom natural gas or to convert the methanol to gaso-line. Currently, the United States has the capacity toproduce methanol with an energy equivalent to about50,000 B/D of oil (i.e., about 1.5 billion gal/yr of meth-anol). A fraction of this could be diverted to use invehicles; and some new capacity could probably bebuilt in 3 to 4 years, if the appropriate permits couldbe obtained quickly. However, the large capital in-vestments needed, the dependence of these plants onuncertain future supplies of natural gas, the need toprove the methanol-to-gasoline step in commercialpractice in this country, and (in the case of methanol)the uncertain demand for the product are all likelyto limit rapid investment in these options. At best, onewould expect potential investors in these technolo-gies to wait until natural gas supplies and prices hadstabilized somewhat, so that they could make reason-able estimates of the profitability of their in-vestments. 108 This delay would probably mean thatonly very limited quantities of liquid fuels from natu-ral gas would be produced within the 5-year time-frame, even if natural gas supplies eventually provedto be adequate. Furthermore, to the extent that sur-pluses of natural gas are available, more transporta-
10alt should & noted that potential investors in liquid SynfUelS
from natural gas differ in three significant ways from those who mayinvest to convert facilities from oil to natural gas. First, the synfuelinvestor has the option not to invest without suffering a loss, whilebusinesses may require fuel to stay in business. Second, the invest-ment needed to convert from oil to natural gas is usually only asmall part of a business’ total investment, and the direct cost tothe business (per unit oil replaced) of converting is usually con-siderably less than that of a syr-tfuel project. Consequently, the riskis lower for the business converting than for a synfuel investor. Evenif the investment proves to be unprofitable, it is not necessarily amistake that would lead to bankruptcy for a company convertingto natural gas, whereas it would be for a synfuel project. Third,a business could convert to natural gas while retaining the abilityto convert quickly back to oil if natural gas supplies became tooscarce. This option is not feasible for the synfuel producer.
tion fuel could be produced in the shortest time byusing the natural gas to replace distillate fuels directlyand converting them to diesel and gasoline.109 Conse-quently, elimination of a detailed consideration of liq-uid fuels from natural gas is not likely to affect mate-rially the results of this assessment or underestimatethe oil replacement potential from fuel switching sig-nificantly.
Active Solar Systems
Currently there are about 500,000 active solar sys-tems installed for heat and hot water, displacing theenergy equivalent of 3,000 to 5,000 B/D of oil.110 In1982, about 150,000 systems were installed; 111 andat this rate of installation, active solar systems of thistype could replace the energy equivalent of 5,000 to8,000 B/D of oil by 1985. Even if this replacementcould be increased by a factor of 10 between 1985and 1990 (a highly optimistic estimate), it would stillbe less than the equivalent of 0.1 MMB/D of oil; andonly part of the energy directly replaced would be oil.(Although the electricity and natural gas replaced bysolar systems could be used to replace oil, the uncer-tainty in the future supplies of electricity and naturalgas are far greater than any potential contribution fromthese sources.) Consequently, it is judged that the oilreplacement potential of active solar systems between1985 and 1990 is too small for a detailed considera-tion of this option.
Photovoltaics
Current photovoltaics production capacity is about10 MW peak 112/yr and could grow to 30 MW peak/yrby 1984. However, even if the production capacity
IOgThe quantity of transportation fuel that can be produced froma given amount of natural gas by displacing residual fuel oil, how-ever, is closer to the amount that can be produced by convertingthe natural gas to liquid fuels, since the efficiency of convertinggas to liquids is closer to that of upgrading residual fuel to dieseland gasoline, about 70 percent. Nevertheless, it would still takeconsiderably longer to convert large quantities of natural gas to liq-uids than to replace and upgrade residual oil, since new naturalgas liquefaction facilities would have to be built, whereas therewould probably be excess residual upgrading capacity during ashortfall (“Emergency Preparedness for Interruption of PetroleumImports into the United States, ” National Petroleum Council, April1981 ).
‘l”’’The 1983 Renewable Energy Forum: Directions ‘90,”Renewable Energy Institute, Conference Proceedings, Wye Plan-tation, MD, June 16-18, 1983; and Gibbs& Hill, Inc., “Oil Replace-ment Analysis, Phase l,” op. cit.
“’’’Renewable Energy Forum, ” op. cit.I I 2peak power corresponds to the maximum power output when
the photovoltaic cell is illuminated with the intensity and spectrumof light produced by the Sun at noon on a clear day.

96 • U.S. U.S. Vulnerability to an Oil Import Curtailment: The Oil Replacement Capability
were to grow to 500 MW peak/yr by 1990 and all ofthe photovoltaic devices sold were used to replaceoil, the total replacement would be less than 10,000B/D, Consequently, the oil replacement potential ofthis option is too small for detailed consideration.
Electricity From Wind
Wind-powered electric generators are being testedby electric utilities in several parts of the United States.The devices will have to be tested for several years,however, so that the utilities can determine exactlyhow the wind generators affect the utilities’ total elec-tric system (in terms of stability, reliability, fuelsreplaced, etc.). Until this testing is complete, it isunlikely that there would be any extensive investmentin wind-powered generators. Therefore, their oiI re-placement potential is relatively small and is likely toremain so until at least 1990.
Solar Thermal Electric Generation
The use of solar thermal energy for electric genera-tion is subject to constraints that are similar to thosementioned above for electricity from wind. Aside fromHawaii, the most favorable region for solar thermalelectric generation is in the Southwest, a region wherethere is considerable generating capacity currentlyunder construction. Unless demand for electricity inthat region grows much more rapidly than OTA ex-pects, electricity needs through 1990 could be metand the utility oil use replaced by completing the pow-erplants currently under construction, convertingsome utility boilers to coal, and using natural gas inthe remaining oil boilers (almost all of which areequipped to burn oil or gas). Even without the coalconversions, all of the oil could be replaced by newpowerplants and a modest increase (about 0.04 TCF)
in gas use, Hawaiian utilities, however, would con-tinue to use about 20,000 to 30,000 B/D of oil, butthis amount of oil is too small for a detailed consider-ation of solar thermal electric generation.
Electric Vehicles
Except in special applications, the poor performanceand low driving range of electric vehicles limit theirmarket and make them most nearly a substitute forvery high efficiency conventional cars. 113 In addition,electric vehicles are relatively expensive (comparedto other options for displacing oil),114 and it would takeseveral years to convert automobile production facil-ities to produce large numbers of these vehicles. Con-sequently, the oil replacement potential of electricvehicles is relatively small within the timeframe con-sidered for this assessment.
Ethanol From Food Processing Wastes
OTA’s earlier assessment of “Energy From Biologi-cal Processes” included a survey of various agricul-tural and food processing wastes.115 This survey in-dicated that even if all the largest sources of foodprocessing wastes suitable for conversion to ethanol(cheese whey, tomato pumice, potato peel and pulp,and citrus rag and peel) were converted, the totalamount of ethanol produced would be considerablyless than the energy equivalent of 10,000 B/D of oil.Although these may be important energy resourcesin specific localities, their total oiI replacement poten-tial is too low for a more detailed consideration in thisassessment.
I I j/ncreas& Automobile Fuel Efficiency and Synthetic Fuels, OP.
cit.
1‘qIbid.115Energy From Biological Processes, Op. cit.
APPENDIX B–ADDITION CONSIDERATIONS REGARDINGETHANOL’S NET ENERGY BALANCE
For average corn production, the oil (for cultivation, is consumed as oil and natural gas inputs to grain pre-harvest, and grain drying) and natural gas (for fertilizers duction. 116
and pesticides) used to produce the corn have an With large increases in corn production, shifts suchenergy content that is about 35 percent of the energy as the following could also occur. Corn productioncontent of the resultant ethanol. For marginal crop- could increase in Nebraska, at the expense of grainland, which is less productive than average cropland,closer to 50 percent of the ethanol’s energy content ‘ ‘b Ibid.
Ch. IV—Fuel Switching . 97
sorghum production. Production of grain sorghumcould then increase in Texas. Assuming that marginalacreage is 70 percent as productive as the average ineach State, the net result of this would be to increaseagricultural consumption of oil and natural gas by 160percent of the energy content of the resultant ethanol.117
Another aspect of ethanol’s energy balance involvespotential reductions in refinery energy use throughblending ethanol as as octane-boosting additive to gas-oline. These savings occur in some refineries by allow-ing the refiners to reduce the amount of reformingneeded to upgrade the octane of their gasoline pool. 118
While OTA’s analysis indicates that gasoline produc-tion, as a percent of total refinery products, would beonly slightly larger in 1990 than in 1985, diesel pro-duction would increase from 62 to 81 percent of mid-dle distillate products (see ch. Vi). The increased dieselproduction would require additional hydrogen to up-grade the middle distillate fraction. Since this hydro-gen normally is produced from reforming a part of themiddle distillates to high octane gasoline, the in-creased demand for diesel would encourage morereforming, thereby reducing the incentive to lower theoctane of gasoline being produced. In addition, if theoctane of the refinery’s gasoline pool were reduced,the hydrogen not produced through reforming wouldhave to be replaced with hydrogen from othersources, such as by reacting residual oil with steam,Although OTA has not conducted a detailed analysisof the effects of ethanol on refinery energy consump-tion following an oil supply shortfall, it seems likelythat, under these circumstances, refinery energy sav-
117BaSed on data from ‘‘Energy and U.S. Agricu Itu re: 1974 DataBase, ” vol. 11, U.S. Department of Agriculture, Federal EnergyAdministration.
118Note that the least sophisticated refineries, which simply distill
crude oil into products, cannot achieve these savings because theydo not do any reforming. But the use of ethanol by these refinersdoes increase the fraction of their product which can become gas-oline of acceptable octane.
ings from the use of ethanol would be greatly reduced.Clearly there would be exceptions to this general state-ment for individual refiners, but the average refinerysavings associated with 5 billion gallons of ethanol pro-duction per year (corresponding to 10 percent ethanolin over half of the gasoline) are likely to be small.
Finally, if ethanol production were expanded muchbeyond about 2 billion gal/yr, the energy credit fornot having to produce soybeans (about 10 percent ofthe energy content of the ethanol’ 119) would begin todrop, since the soybean substitution market would be-gin to be saturated with the available distillers’ drygrain.
The result of these changes in agricultural energyuse and potential energy credits for ethanol produc-tion are as follows. If there were a surplus of naturalgas, increased use of this fuel in agriculture would notcompete with fuel switching from oil to natural gasin other sectors; and the natural gas usage should notbe counted as a deficit in terms of oil replacement.In this case, each gallon of ethanol could provide anet oil replacement equal to 40 to 75 percent of theenergy content of the ethanol. In other words, 5 bil-lion gal/yr of ethanol could replace 0.08 to 0.15MMB/D of oil.
On the other hand, if natural gas were in short sup-ply, additional use of it in agriculture would competewith fuel switching to natural gas in other sectors; andthe added agricultural use of this fuel would reducethe oil replacement in the other sectors. In this case,ethanol production could result in anything from a netreplacement of oil equal to 50 percent of the energycontent of the ethanol to a net increase in oil con-sumption equal to 60 percent of the ethanol’s energycontent. In other words, the effect of 5 billion gal/yrof ethanol production could vary from reducing oilconsumption by 0.1 MM B/D to increasing it by 0.12MMB/D.
11 g~nergy Ffom f3;O10g;Ca/ Processes, Op. cit.