usa technologies september 2015 investor presentation...
TRANSCRIPT

USA Technologies
Investor Presentation
September 2015
NASDAQ: USAT
Safe Harbor Statement
2
All statements, other than statements of historical fact included in this presentation, are forward-looking statements. When used in this release, words such as "anticipate", "believe", "estimate", "expect", "intend", and similar expressions, as they relate to USA Technologies or its management, identify forward-looking statements. Such forward-looking statements are based on the beliefs of USA Technologies’ management, as well as assumptions made by and information currently available to USA Technologies’ management. Actual results could differ materially from those contemplated by the forward-looking statements as a result of certain factors, including but not limited to, business, financial market and economic conditions; the incurrence of any unanticipated or unusual non-operating expenses which would require diversion of cash resources; the ability of USA Technologies to predict or estimate its future quarterly or annual revenues and expenses given the developing and unpredictable market for its products; the ability of USA Technologies to retain key customers from whom a significant portion of its revenues are derived; the ability of a key customer to reduce or delay purchasing products from USA Technologies; whether suppliers would increase their prices, reduce output or change their terms of sale; whether, and the promptness with which, customers install new connections; whether, and the extent to which, new connections will generate new revenues for USA Technologies in future quarters; whether USA Technologies’ customers continue to utilize USA Technologies’ transaction processing and related services, as customer agreements are generally cancelable by the customer on thirty to sixty days' notice; the ability of USA Technologies to accurately estimate potential connections controlled by its existing customer base and predict future market conditions and customer behavior; whether customers will increase their purchases of USA Technologies’ products and services in the future; the extent to which USAT's 2015 Cashless Knowledge Base is predictive of average annual cash and cashless sales and top line cashless sales lift on a single vending machine; the ability of the Company’s 2015 Cashless Knowledge Base to predict future market conditions, customer and consumer behavior, and average ticket prices and cashless sales across all of USAT's customer locations; the accuracy and reliability of third party data relating to industry net operating profits and cost of goods sold; and the possibility that all of the expected benefits from adoption of cashless payment will not be realized by all vending operators, or will not be realized within the expected time period. Readers are cautioned not to place undue reliance on these forward-looking statements. Any forward-looking statement made in this presentation speaks only as of the date of this presentation. Unless required by law, USA Technologies does not undertake to release publicly any revisions to these forward-looking statements to reflect future events or circumstances or to reflect the occurrence of unanticipated events.
Non-GAAP Information: This presentation includes a discussion of non-GAAP net income (loss) and Adjusted EBITDA which are non-GAAP financial
measures that USA Technologies believes are useful for an understanding of the Company’s ongoing operations. These non-GAAP financial measures
are supplemental to, and not a substitute for, GAAP financial measures such as operating margin or net income or loss. Details of these items and
a reconciliation of these non-GAAP financial measures to GAAP financial measures can be found in the Appendix to this presentation, and at
www.USAT.com under the “Investor Relations” tab.
Investment Highlights
3
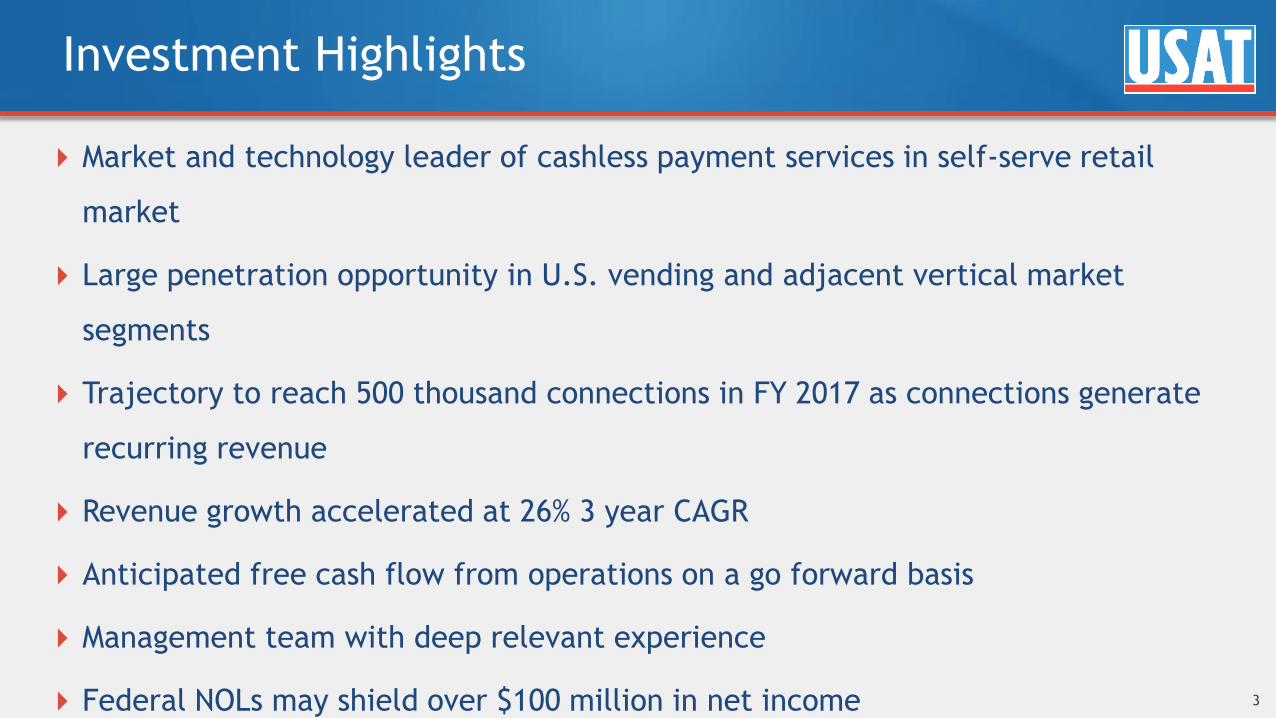
Market and technology leader of cashless payment services in self-serve retail
market
Large penetration opportunity in U.S. vending and adjacent vertical market
segments
Trajectory to reach 500 thousand connections in FY 2017 as connections generate
recurring revenue
Revenue growth accelerated at 26% 3 year CAGR
Anticipated free cash flow from operations on a go forward basis
Management team with deep relevant experience
Federal NOLs may shield over $100 million in net income
USA Technologies Overview
4
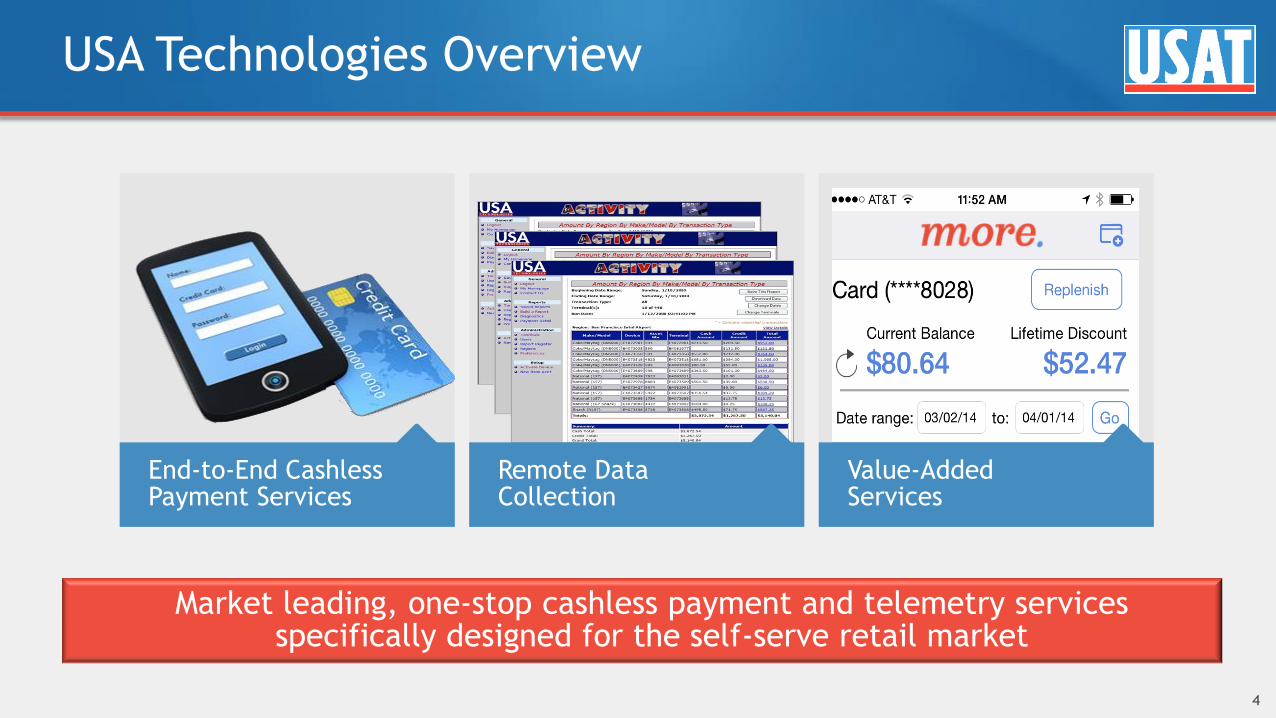
End-to-End Cashless Payment Services
Remote Data Collection
Value-Added Services
Market leading, one-stop cashless payment and telemetry services specifically designed for the self-serve retail market
Current Installed Base
5
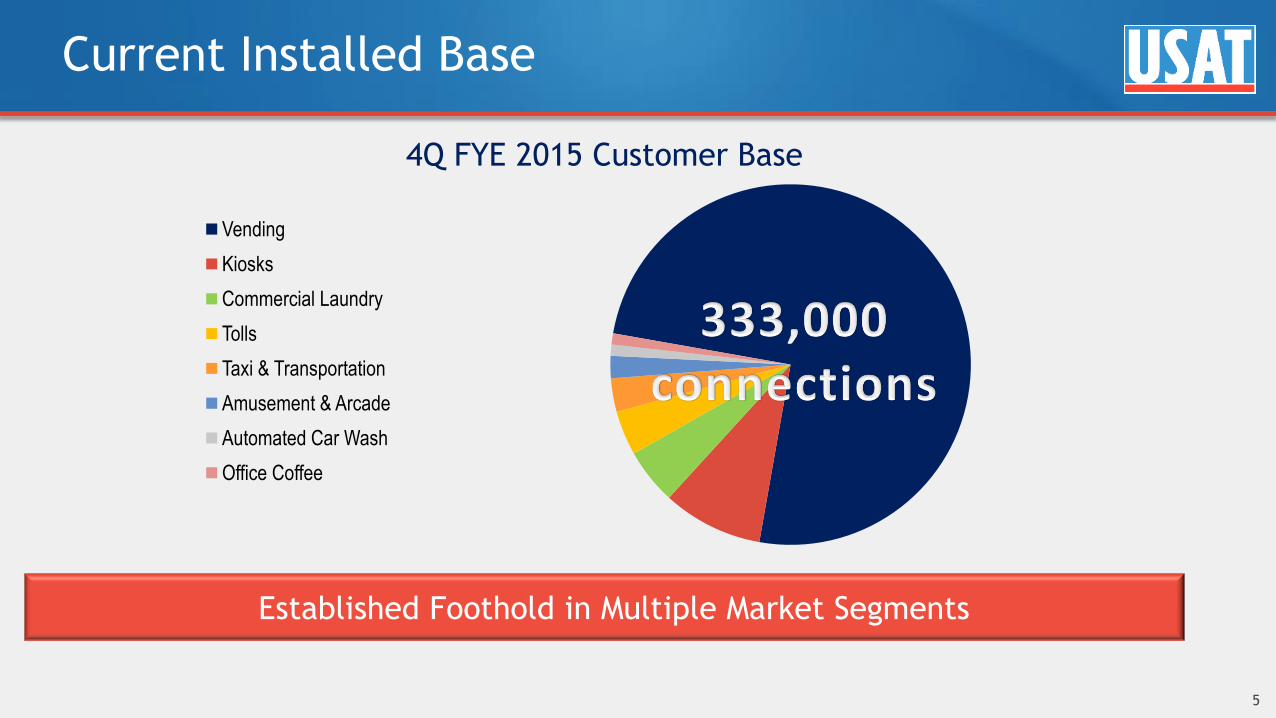
Vending
Kiosks
Commercial Laundry
Tolls
Taxi & Transportation
Amusement & Arcade
Automated Car Wash
Office Coffee
4Q FYE 2015 Customer Base
Established Foothold in Multiple Market Segments
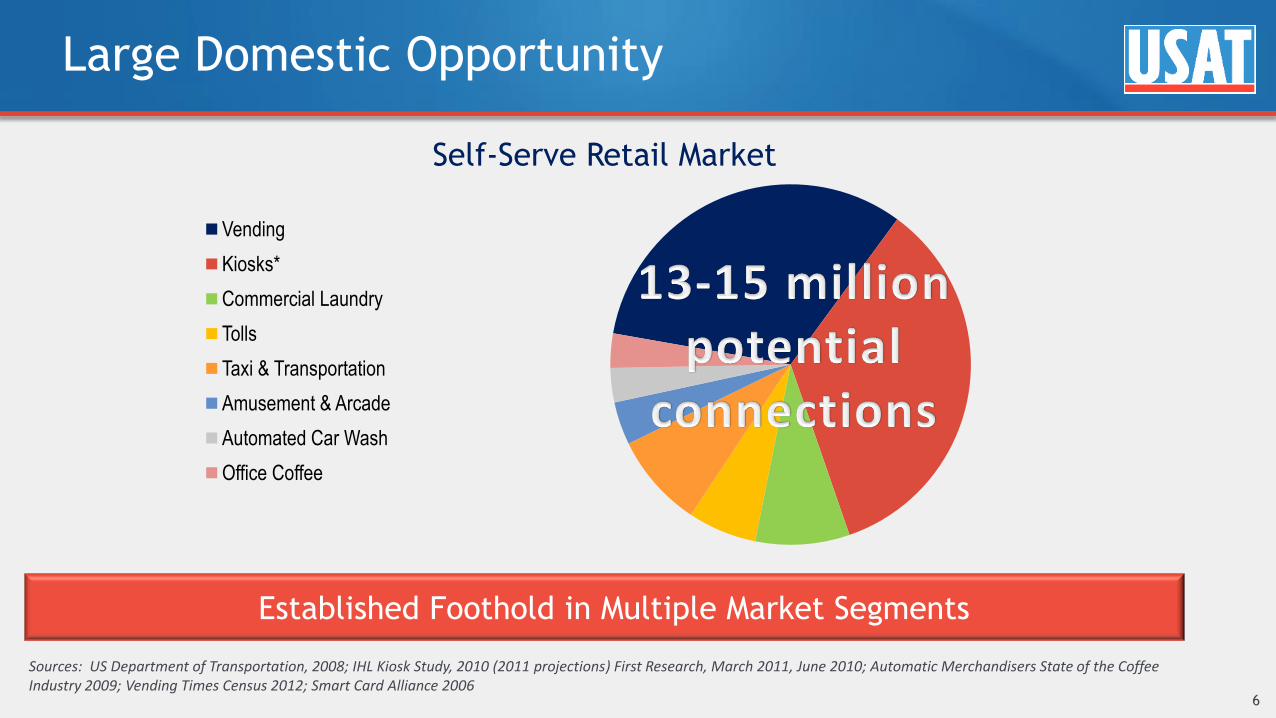
Large Domestic Opportunity
6
Vending
Kiosks*
Commercial Laundry
Tolls
Taxi & Transportation
Amusement & Arcade
Automated Car Wash
Office Coffee
Self-Serve Retail Market
Sources: US Department of Transportation, 2008; IHL Kiosk Study, 2010 (2011 projections) First Research, March 2011, June 2010; Automatic Merchandisers State of the Coffee Industry 2009; Vending Times Census 2012; Smart Card Alliance 2006
Established Foothold in Multiple Market Segments
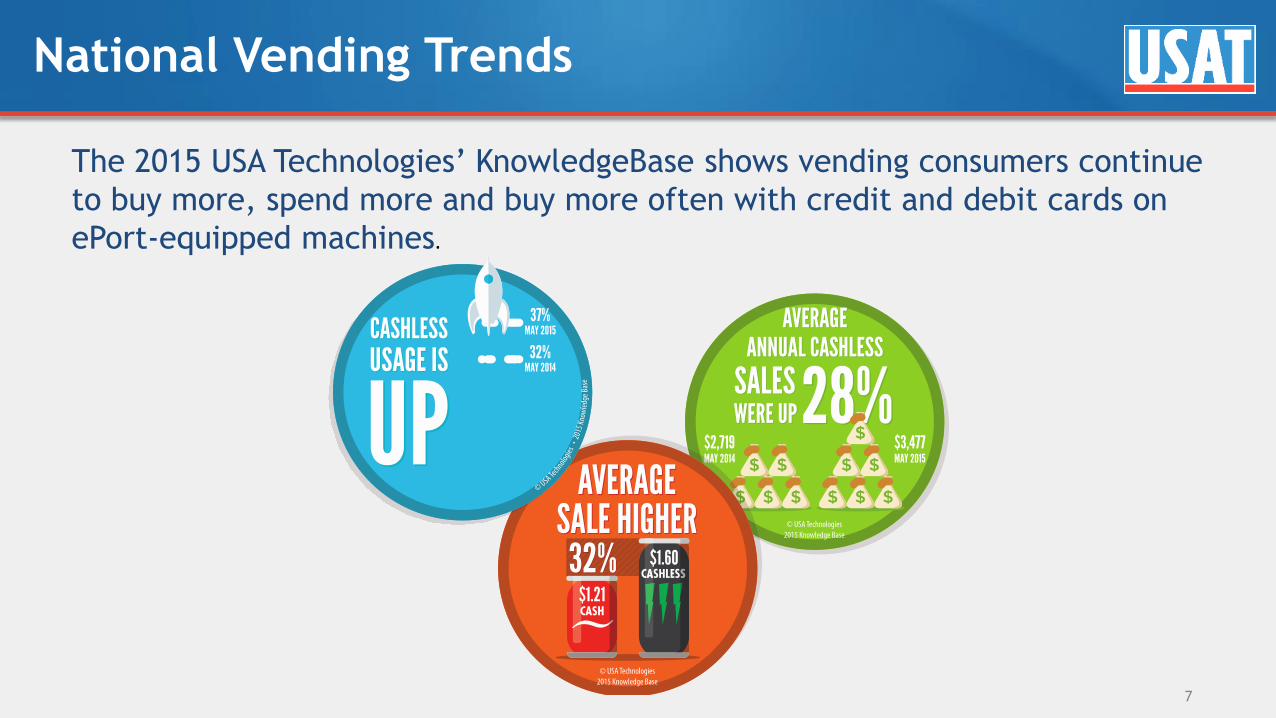
National Vending Trends
7
The 2015 USA Technologies’ KnowledgeBase shows vending consumers continue
to buy more, spend more and buy more often with credit and debit cards on
ePort-equipped machines.
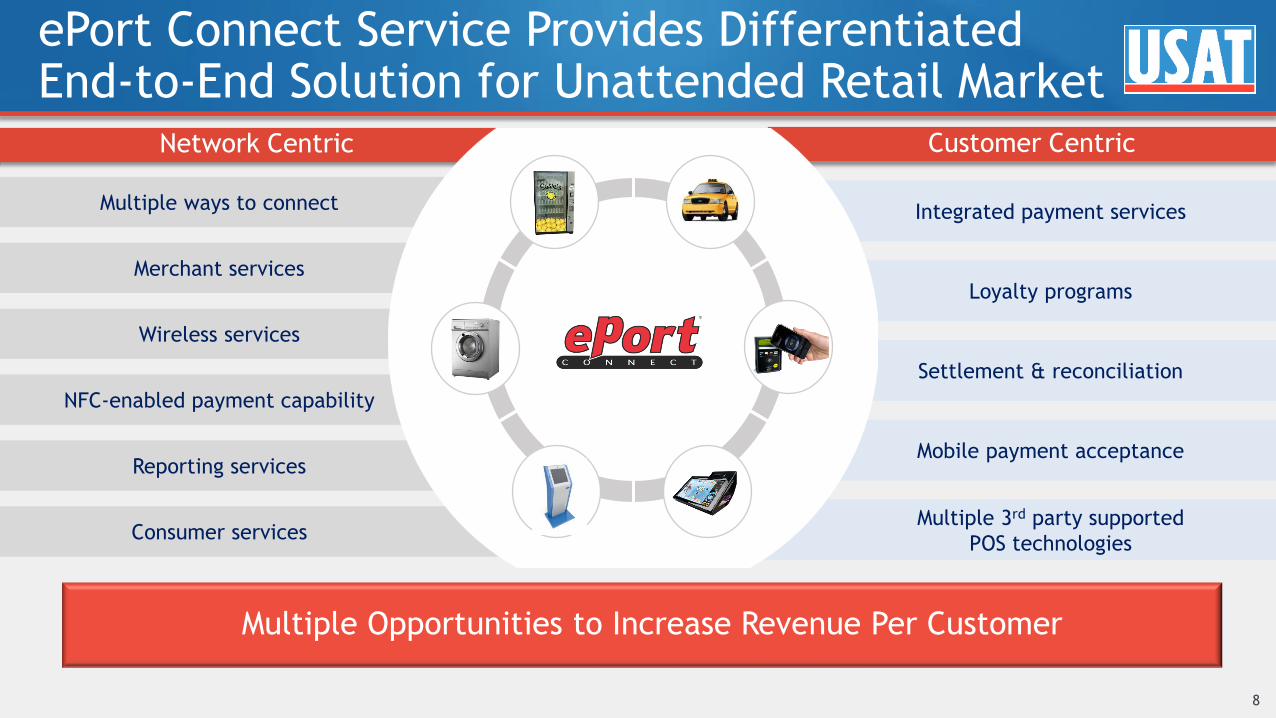
Network Centric
Multiple 3rd party supported
POS technologies
Mobile payment acceptance
Settlement & reconciliation
Loyalty programs
Integrated payment services
Consumer services
Reporting services
NFC-enabled payment capability
Wireless services
Merchant services
Multiple ways to connect
ePort Connect Service Provides Differentiated End-to-End Solution for Unattended Retail Market
8
Multiple Opportunities to Increase Revenue Per Customer
Customer Centric
Investment in Self Service
9
Significant companies partnering or working with USAT
Largest NFC-enabled Mobile Footprint
10
~300,000 NFC-enabled merchant locations,
90% of installed base
− All newly shipped ePort terminals are
NFC-enabled
Apple Pay introduction marks tectonic
shift, expected to drive demand and
adoption
− Accepted throughout USAT network
Google’s launch of Android Pay solidifies
broader market acceptance of the mobile
payments technology
Equipment
11
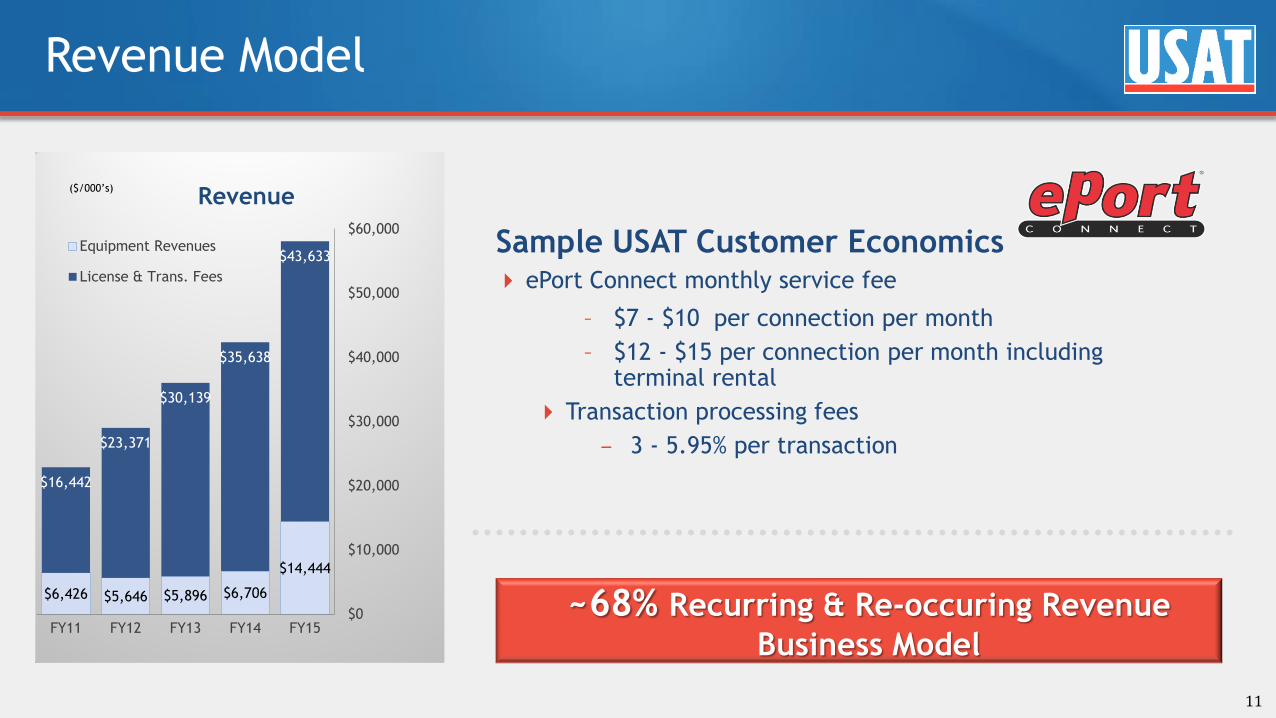
Sample USAT Customer Economics ePort Connect monthly service fee
– $7 - $10 per connection per month
– $12 - $15 per connection per month including terminal rental
Transaction processing fees
– 3 - 5.95% per transaction
Target gross profit margin
Target gross profit margin
Revenue Model
$6,426 $5,646 $5,896 $6,706
$14,444
$16,442
$23,371
$30,139
$35,638
$43,633
FY11 FY12 FY13 FY14 FY15 $0
$10,000
$20,000
$30,000
$40,000
$50,000
$60,000 Equipment Revenues
License & Trans. Fees
Revenue
~68% Recurring & Re-occuring Revenue
Business Model
($/000’s)
The Data: One Machine at a Time
12
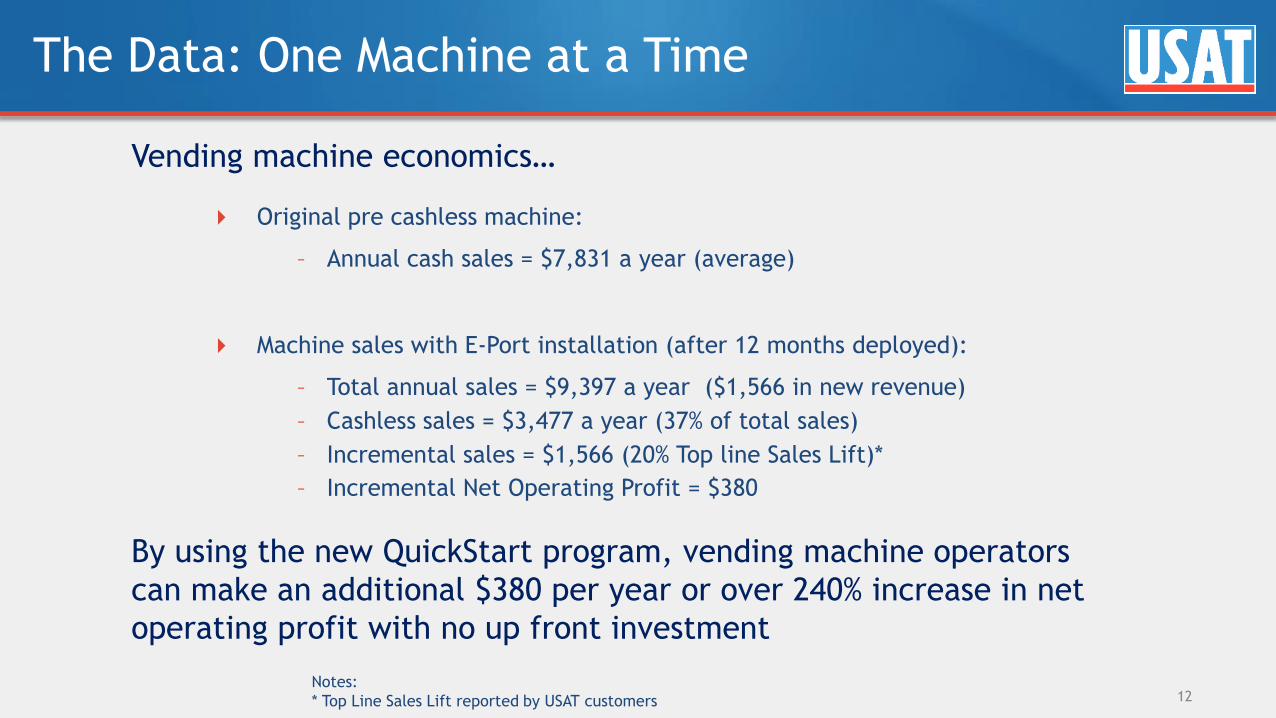
Original pre cashless machine:
– Annual cash sales = $7,831 a year (average)
Machine sales with E-Port installation (after 12 months deployed):
– Total annual sales = $9,397 a year ($1,566 in new revenue)
– Cashless sales = $3,477 a year (37% of total sales)
– Incremental sales = $1,566 (20% Top line Sales Lift)*
– Incremental Net Operating Profit = $380
Notes:
* Top Line Sales Lift reported by USAT customers
Vending machine economics…
By using the new QuickStart program, vending machine operators
can make an additional $380 per year or over 240% increase in net
operating profit with no up front investment
Connections & Customer Base Increasing at Increasing Rate
13
Wikianswers.com
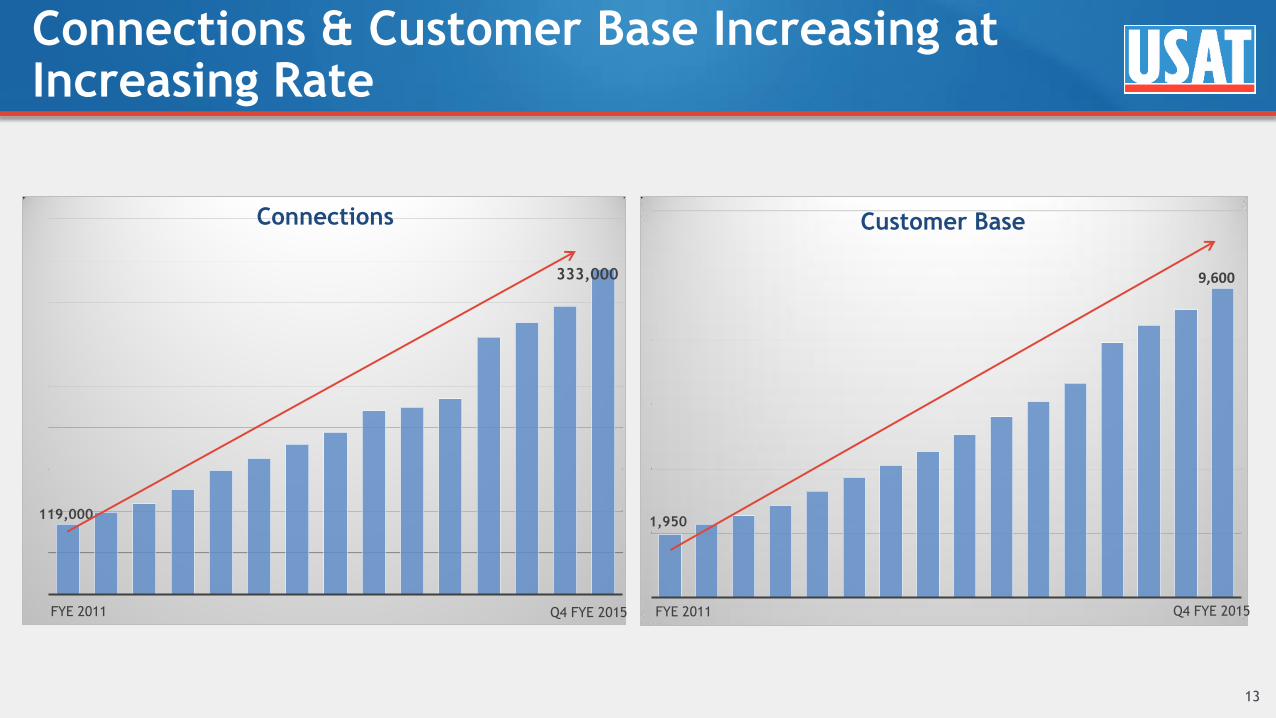
1,950
9,600
FYE 2011
Customer Base
119,000
333,000
Connections
FYE 2011 Q4 FYE 2015 Q4 FYE 2015
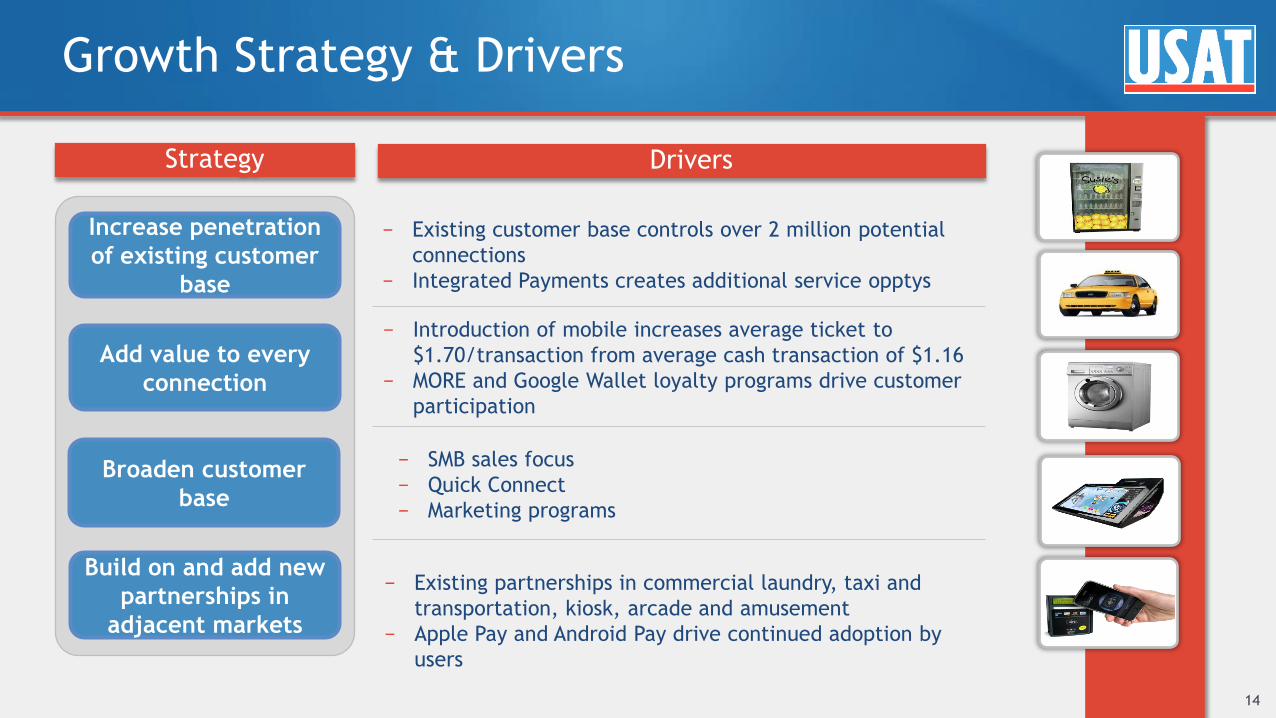
Growth Strategy & Drivers
14
− Existing customer base controls over 2 million potential
connections
− Integrated Payments creates additional service opptys
− SMB sales focus
− Quick Connect
− Marketing programs
− Existing partnerships in commercial laundry, taxi and
transportation, kiosk, arcade and amusement
− Apple Pay and Android Pay drive continued adoption by
users
− Introduction of mobile increases average ticket to
$1.70/transaction from average cash transaction of $1.16
− MORE and Google Wallet loyalty programs drive customer
participation
Increase penetration
of existing customer
base
Broaden customer
base
Build on and add new
partnerships in
adjacent markets
Add value to every
connection
Strategy Drivers
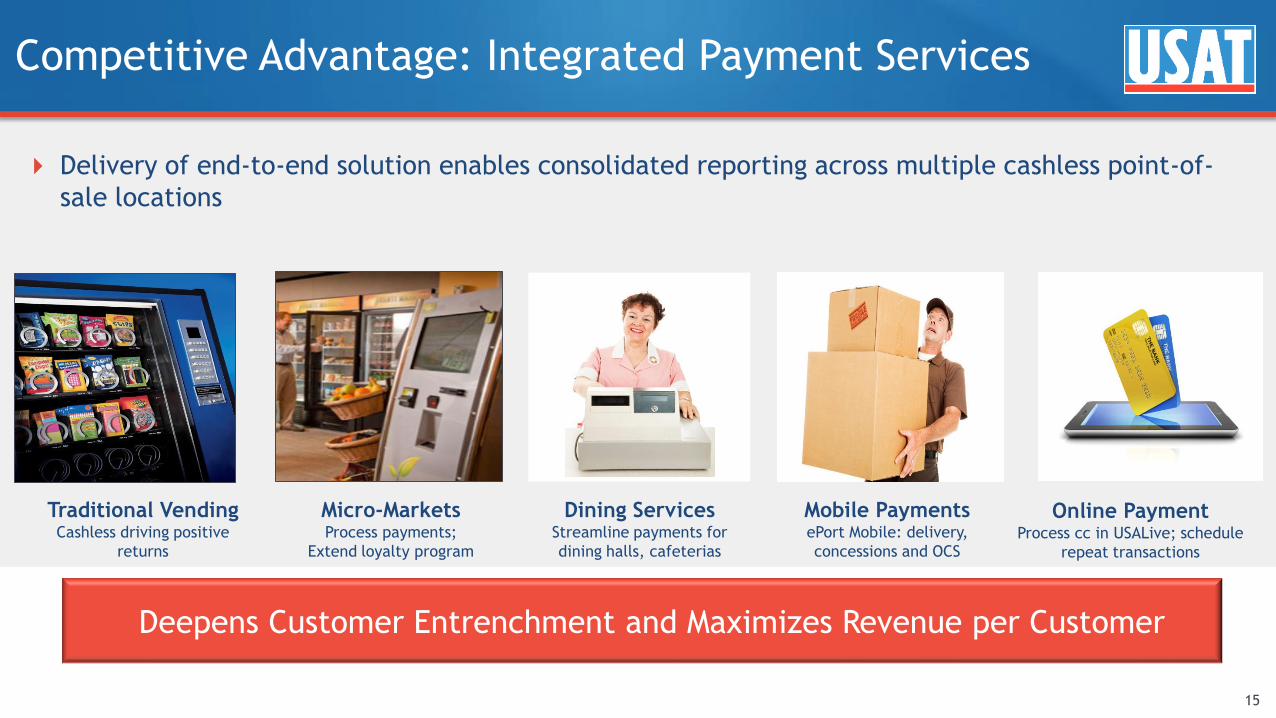
Competitive Advantage: Integrated Payment Services
15
Traditional Vending Cashless driving positive
returns
Mobile Payments ePort Mobile: delivery,
concessions and OCS
Dining Services Streamline payments for
dining halls, cafeterias
Online Payment Process cc in USALive; schedule
repeat transactions
Micro-Markets Process payments;
Extend loyalty program
Deepens Customer Entrenchment and Maximizes Revenue per Customer
Delivery of end-to-end solution enables consolidated reporting across multiple cashless point-of-
sale locations
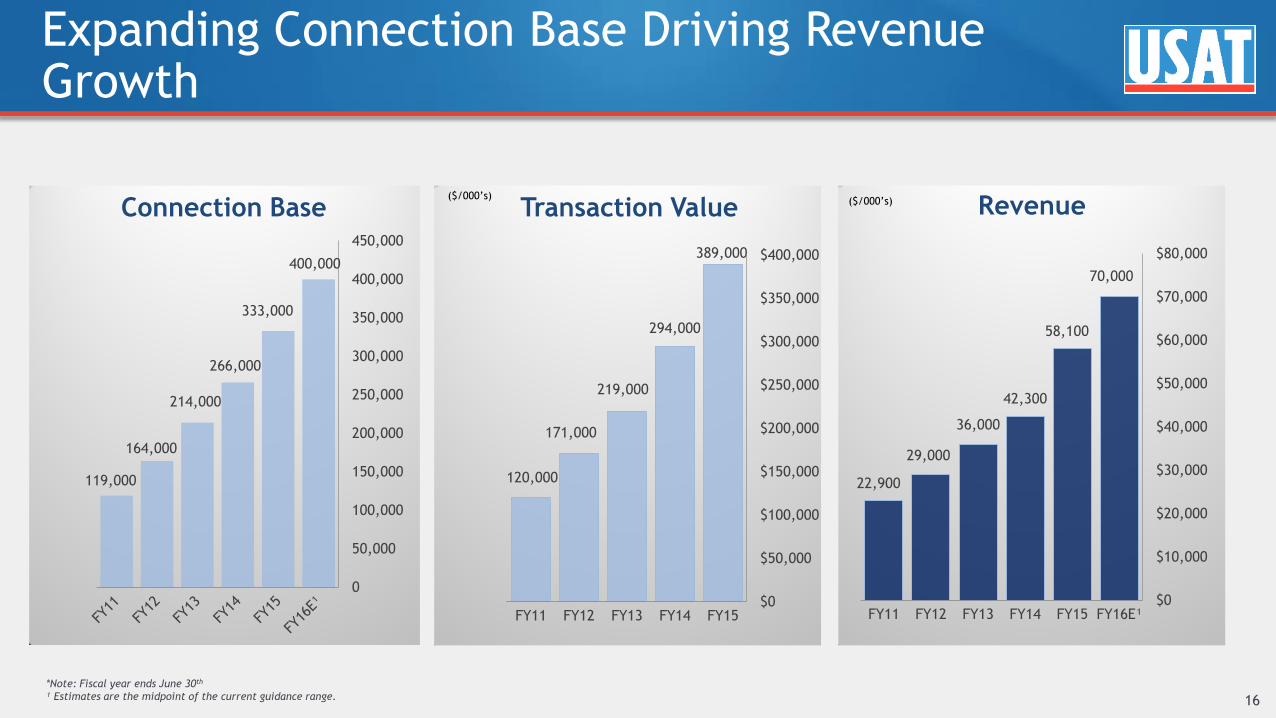
Expanding Connection Base Driving Revenue Growth
120,000
171,000
219,000
294,000
389,000
FY11 FY12 FY13 FY14 FY15 $0
$50,000
$100,000
$150,000
$200,000
$250,000
$300,000
$350,000
$400,000
22,900
29,000
36,000
42,300
58,100
70,000
FY11 FY12 FY13 FY14 FY15 FY16E¹ $0
$10,000
$20,000
$30,000
$40,000
$50,000
$60,000
$70,000
$80,000
16
Revenue
119,000
164,000
214,000
266,000
333,000
400,000
0
50,000
100,000
150,000
200,000
250,000
300,000
350,000
400,000
450,000
Connection Base Transaction Value ($/000’s)
($/000’s)
*Note: Fiscal year ends June 30th
¹ Estimates are the midpoint of the current guidance range.
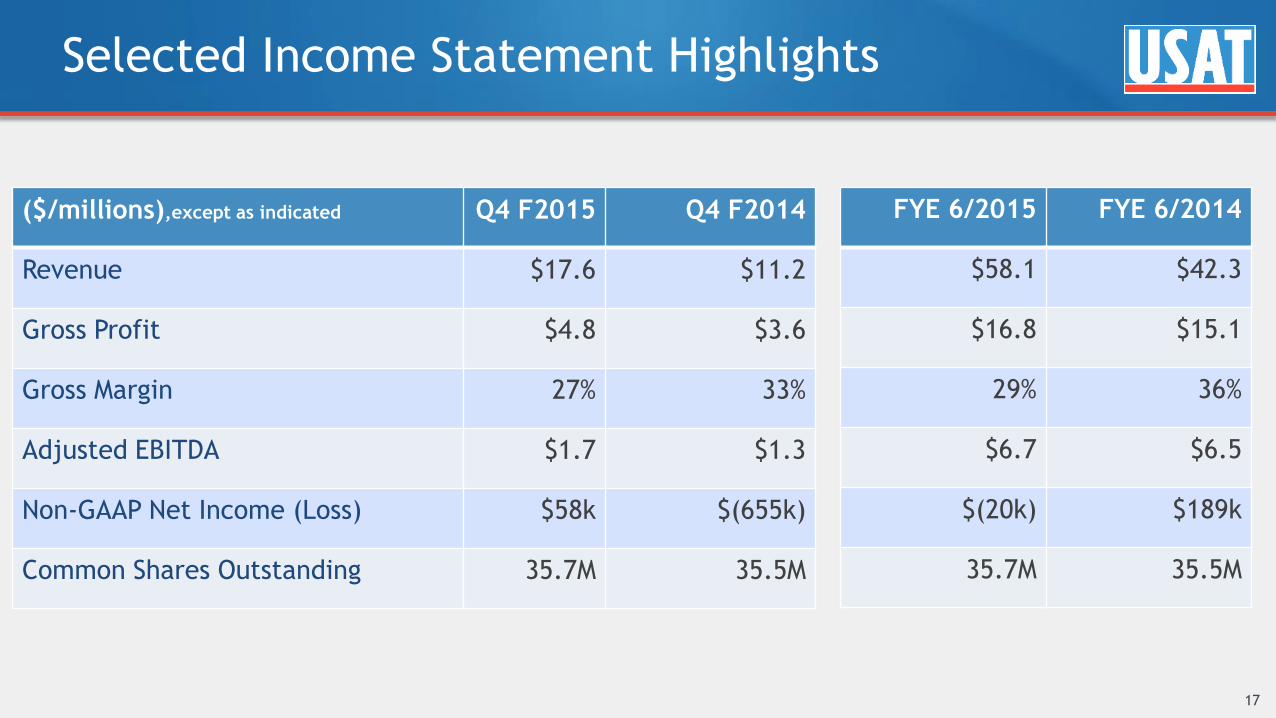
Selected Income Statement Highlights
17
($/millions),except as indicated Q4 F2015 Q4 F2014
Revenue $17.6 $11.2
Gross Profit $4.8 $3.6
Gross Margin 27% 33%
Adjusted EBITDA $1.7 $1.3
Non-GAAP Net Income (Loss) $58k $(655k)
Common Shares Outstanding 35.7M 35.5M
FYE 6/2015 FYE 6/2014
$58.1 $42.3
$16.8 $15.1
29% 36%
$6.7 $6.5
$(20k) $189k
35.7M 35.5M
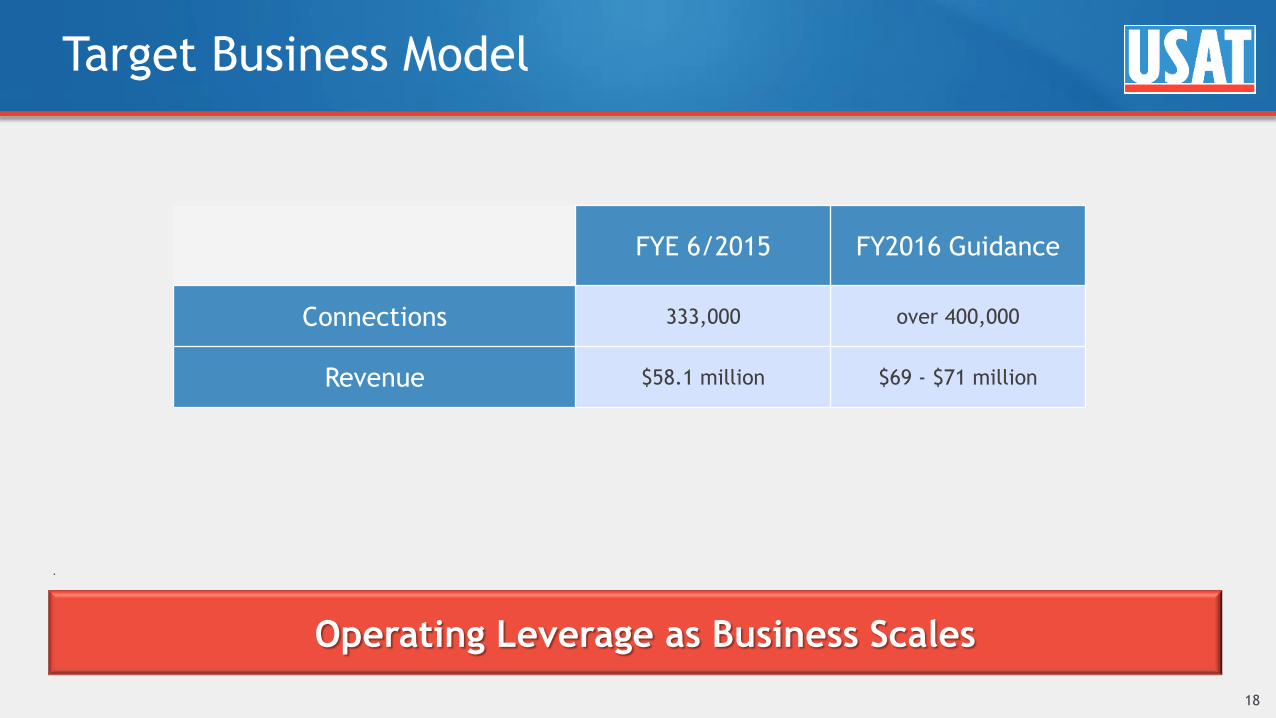
Target Business Model
18
FYE 6/2015 FY2016 Guidance
Connections 333,000 over 400,000
Revenue $58.1 million $69 - $71 million
.
Operating Leverage as Business Scales
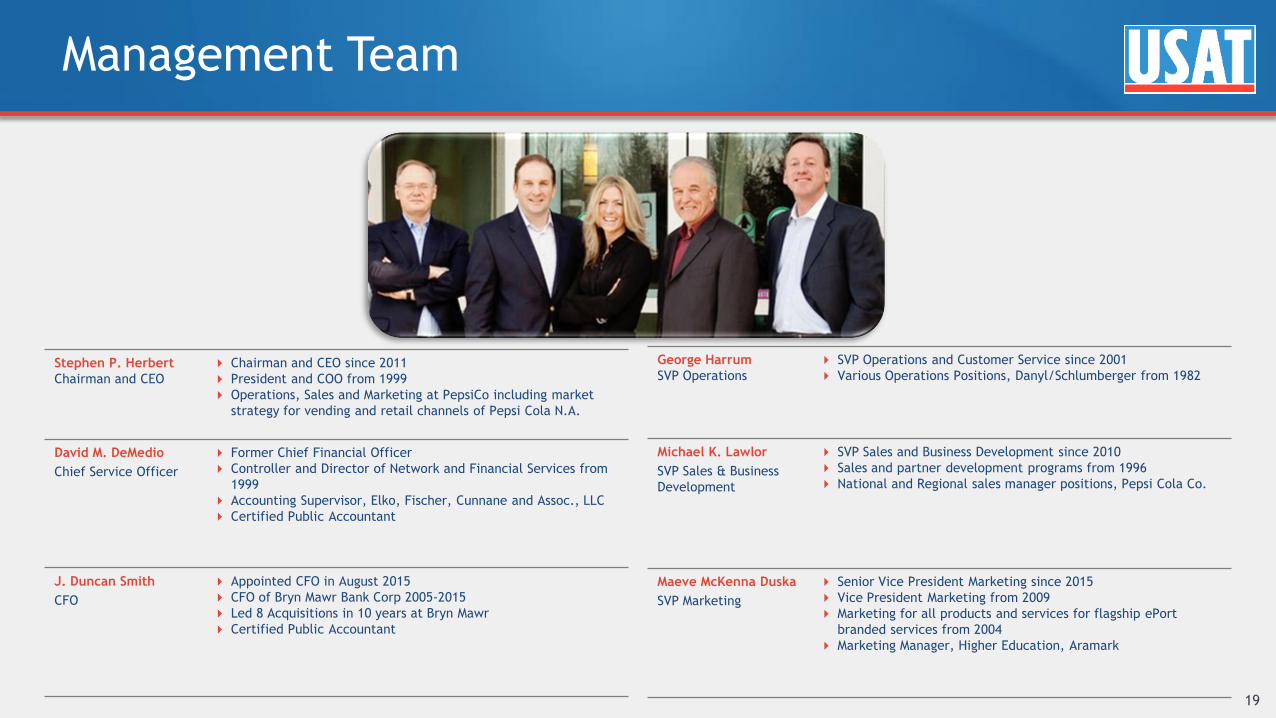
Management Team
19
Stephen P. Herbert
Chairman and CEO
Chairman and CEO since 2011
President and COO from 1999
Operations, Sales and Marketing at PepsiCo including market
strategy for vending and retail channels of Pepsi Cola N.A.
David M. DeMedio
Chief Service Officer
Former Chief Financial Officer
Controller and Director of Network and Financial Services from
1999
Accounting Supervisor, Elko, Fischer, Cunnane and Assoc., LLC
Certified Public Accountant
J. Duncan Smith
CFO
Appointed CFO in August 2015
CFO of Bryn Mawr Bank Corp 2005-2015
Led 8 Acquisitions in 10 years at Bryn Mawr
Certified Public Accountant
George Harrum
SVP Operations
SVP Operations and Customer Service since 2001
Various Operations Positions, Danyl/Schlumberger from 1982
Michael K. Lawlor
SVP Sales & Business
Development
SVP Sales and Business Development since 2010
Sales and partner development programs from 1996
National and Regional sales manager positions, Pepsi Cola Co.
Maeve McKenna Duska
SVP Marketing
Senior Vice President Marketing since 2015
Vice President Marketing from 2009
Marketing for all products and services for flagship ePort
branded services from 2004
Marketing Manager, Higher Education, Aramark
Key Takeaways
Market and technology leader of cashless payment services in self-serve retail market
Large penetration opportunity in U.S. vending and adjacent vertical market segments
Trajectory to reach 500 thousand connections in FY 2017 as connections generate recurring revenue
Revenue growth expected to accelerate from 26% 3 year CAGR
Anticipated free cash flow from operations on a go forward basis
Management team with deep relevant experience
Federal NOLs may shield over $100 million in net income
20

Appendix A: Condensed Financial and Other Data
21
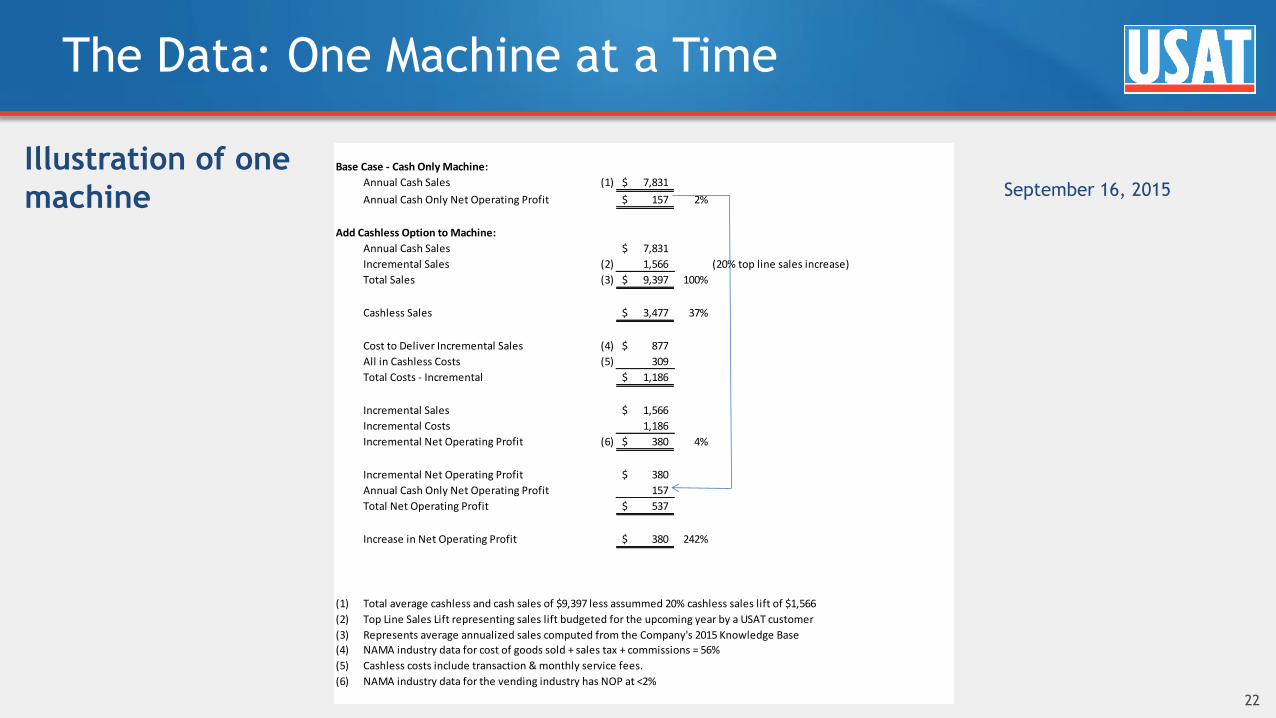
The Data: One Machine at a Time
22
Illustration of one
machine
September 16, 2015
Base Case - Cash Only Machine:
Annual Cash Sales (1) 7,831$
Annual Cash Only Net Operating Profit 157$ 2%
Add Cashless Option to Machine:
Annual Cash Sales 7,831$
Incremental Sales (2) 1,566 (20% top line sales increase)
Total Sales (3) 9,397$ 100%
Cashless Sales 3,477$ 37%
Cost to Deliver Incremental Sales (4) 877$
All in Cashless Costs (5) 309
Total Costs - Incremental 1,186$
Incremental Sales 1,566$
Incremental Costs 1,186
Incremental Net Operating Profit (6) 380$ 4%
Incremental Net Operating Profit 380$
Annual Cash Only Net Operating Profit 157
Total Net Operating Profit 537$
Increase in Net Operating Profit 380$ 242%
(1) Total average cashless and cash sales of $9,397 less assummed 20% cashless sales lift of $1,566
(2) Top Line Sales Lift representing sales lift budgeted for the upcoming year by a USAT customer
(3) Represents average annualized sales computed from the Company's 2015 Knowledge Base
(4) NAMA industry data for cost of goods sold + sales tax + commissions = 56%
(5)
(6) NAMA industry data for the vending industry has NOP at <2%
Cashless costs include transaction & monthly service fees.
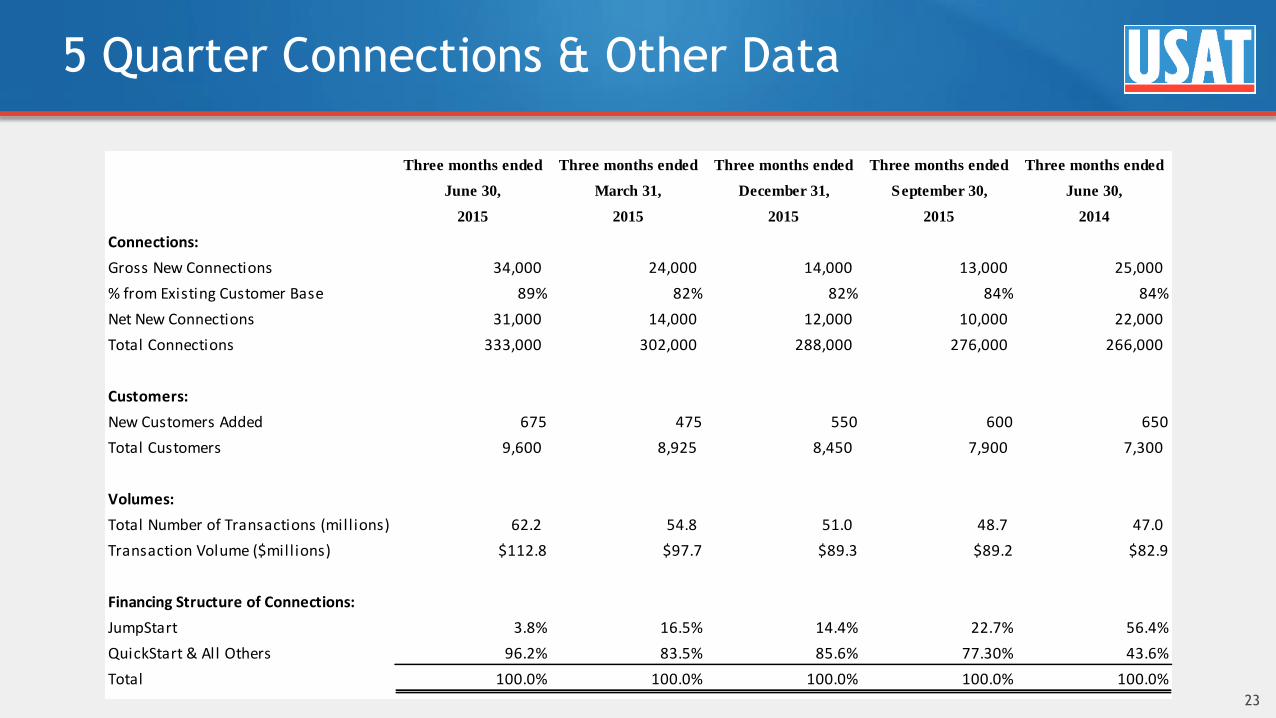
5 Quarter Connections & Other Data
23
Three months ended Three months ended Three months ended Three months ended Three months ended
June 30, March 31, December 31, September 30, June 30,
2015 2015 2015 2015 2014
Connections:
Gross New Connections 34,000 24,000 14,000 13,000 25,000
% from Existing Customer Base 89% 82% 82% 84% 84%
Net New Connections 31,000 14,000 12,000 10,000 22,000
Total Connections 333,000 302,000 288,000 276,000 266,000
Customers:
New Customers Added 675 475 550 600 650
Total Customers 9,600 8,925 8,450 7,900 7,300
Volumes:
Total Number of Transactions (mill ions) 62.2 54.8 51.0 48.7 47.0
Transaction Volume ($millions) $112.8 $97.7 $89.3 $89.2 $82.9
Financing Structure of Connections:
JumpStart 3.8% 16.5% 14.4% 22.7% 56.4%
QuickStart & All Others 96.2% 83.5% 85.6% 77.30% 43.6%
Total 100.0% 100.0% 100.0% 100.0% 100.0%
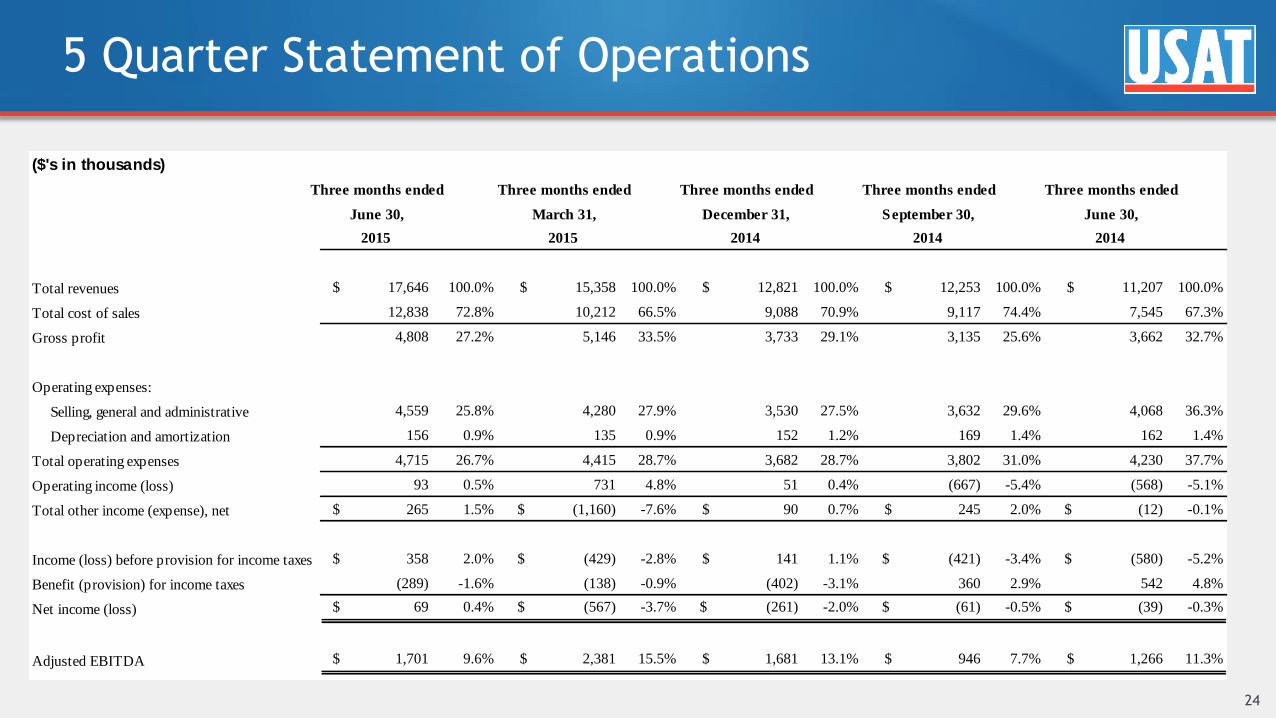
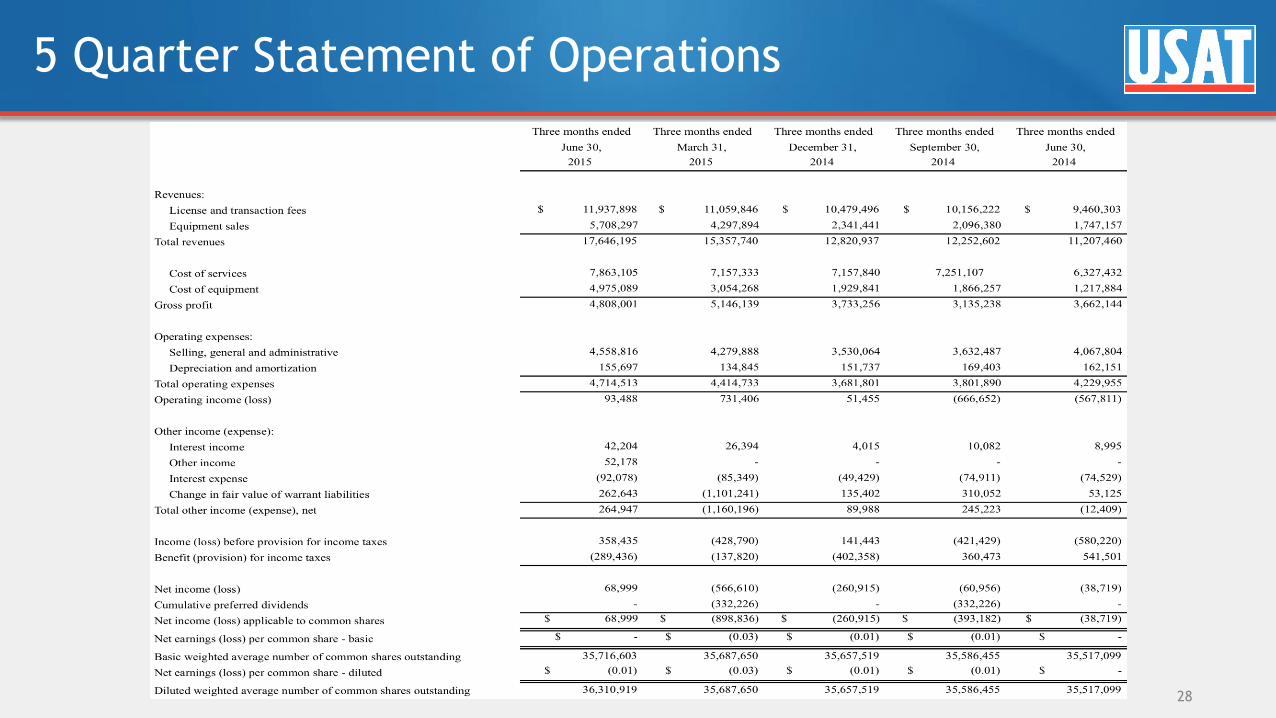
5 Quarter Statement of Operations
24
($'s in thousands)
Three months ended Three months ended Three months ended Three months ended Three months ended
June 30, March 31, December 31, September 30, June 30,
2015 2015 2014 2014 2014
Total revenues $ 17,646 100.0% $ 15,358 100.0% $ 12,821 100.0% $ 12,253 100.0% $ 11,207 100.0%
Total cost of sales 12,838 72.8% 10,212 66.5% 9,088 70.9% 9,117 74.4% 7,545 67.3%
Gross profit 4,808 27.2% 5,146 33.5% 3,733 29.1% 3,135 25.6% 3,662 32.7%
Operating expenses:
Selling, general and administrative 4,559 25.8% 4,280 27.9% 3,530 27.5% 3,632 29.6% 4,068 36.3%
Depreciation and amortization 156 0.9% 135 0.9% 152 1.2% 169 1.4% 162 1.4%
Total operating expenses 4,715 26.7% 4,415 28.7% 3,682 28.7% 3,802 31.0% 4,230 37.7%
Operating income (loss) 93 0.5% 731 4.8% 51 0.4% (667) -5.4% (568) -5.1%
Total other income (expense), net $ 265 1.5% $ (1,160) -7.6% $ 90 0.7% $ 245 2.0% $ (12) -0.1%
Income (loss) before provision for income taxes $ 358 2.0% $ (429) -2.8% $ 141 1.1% $ (421) -3.4% $ (580) -5.2%
Benefit (provision) for income taxes (289) -1.6% (138) -0.9% (402) -3.1% 360 2.9% 542 4.8%
Net income (loss) $ 69 0.4% $ (567) -3.7% $ (261) -2.0% $ (61) -0.5% $ (39) -0.3%
Adjusted EBITDA $ 1,701 9.6% $ 2,381 15.5% $ 1,681 13.1% $ 946 7.7% $ 1,266 11.3%
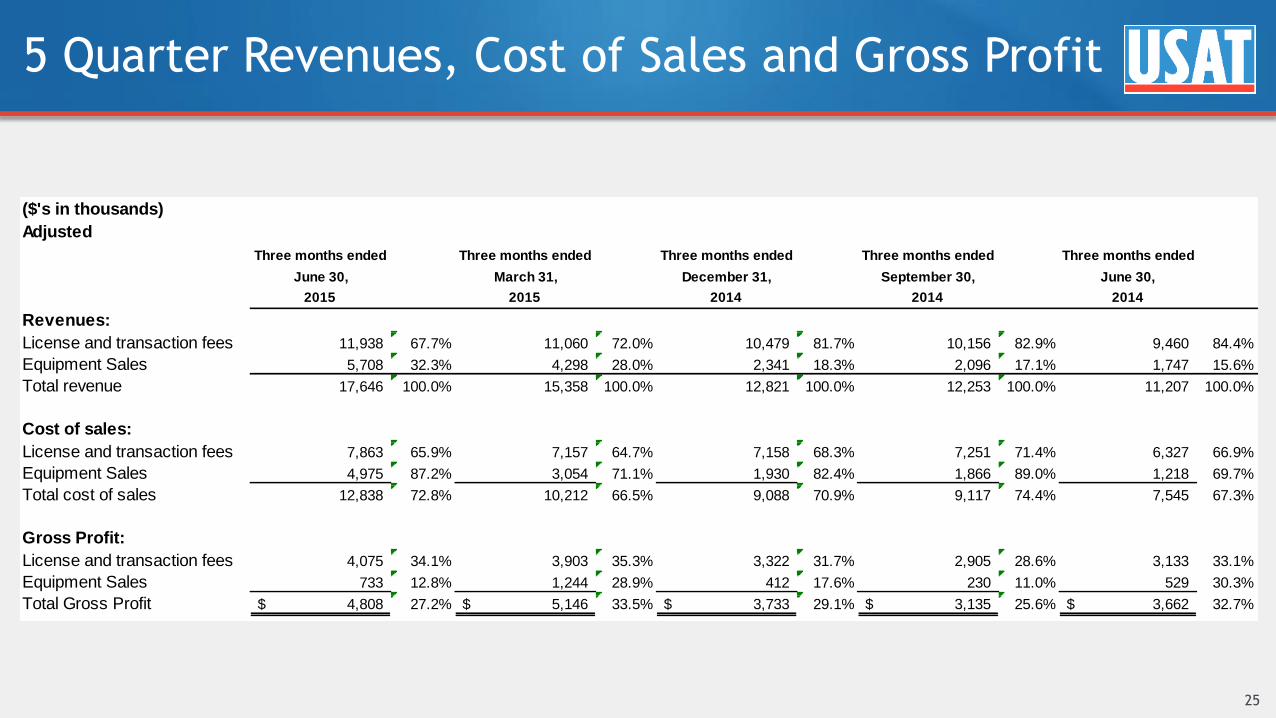
5 Quarter Revenues, Cost of Sales and Gross Profit
25
($'s in thousands)
Adjusted
Three months ended Three months ended Three months ended Three months ended Three months ended
June 30, March 31, December 31, September 30, June 30,
2015 2015 2014 2014 2014
Revenues:
License and transaction fees 11,938 67.7% 11,060 72.0% 10,479 81.7% 10,156 82.9% 9,460 84.4%
Equipment Sales 5,708 32.3% 4,298 28.0% 2,341 18.3% 2,096 17.1% 1,747 15.6%
Total revenue 17,646 100.0% 15,358 100.0% 12,821 100.0% 12,253 100.0% 11,207 100.0%
Cost of sales:
License and transaction fees 7,863 65.9% 7,157 64.7% 7,158 68.3% 7,251 71.4% 6,327 66.9%
Equipment Sales 4,975 87.2% 3,054 71.1% 1,930 82.4% 1,866 89.0% 1,218 69.7%
Total cost of sales 12,838 72.8% 10,212 66.5% 9,088 70.9% 9,117 74.4% 7,545 67.3%
Gross Profit:
License and transaction fees 4,075 34.1% 3,903 35.3% 3,322 31.7% 2,905 28.6% 3,133 33.1%
Equipment Sales 733 12.8% 1,244 28.9% 412 17.6% 230 11.0% 529 30.3%
Total Gross Profit 4,808$ 27.2% 5,146$ 33.5% 3,733$ 29.1% 3,135$ 25.6% 3,662$ 32.7%
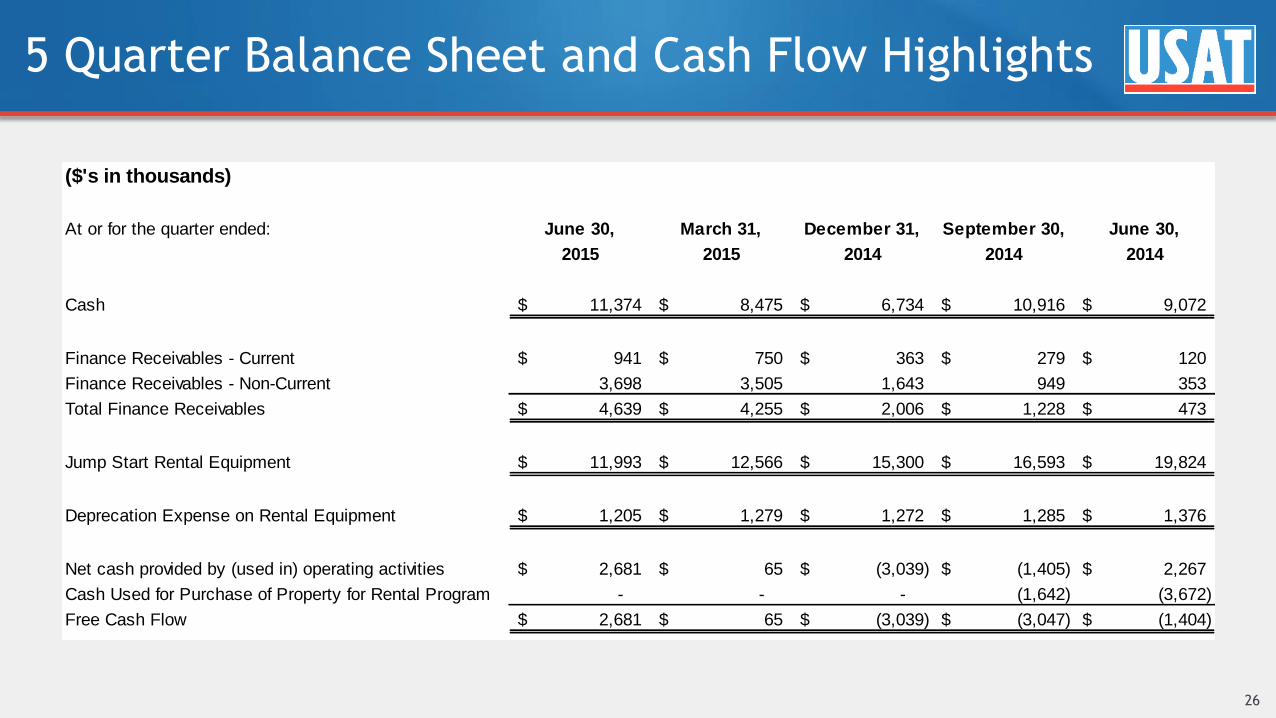
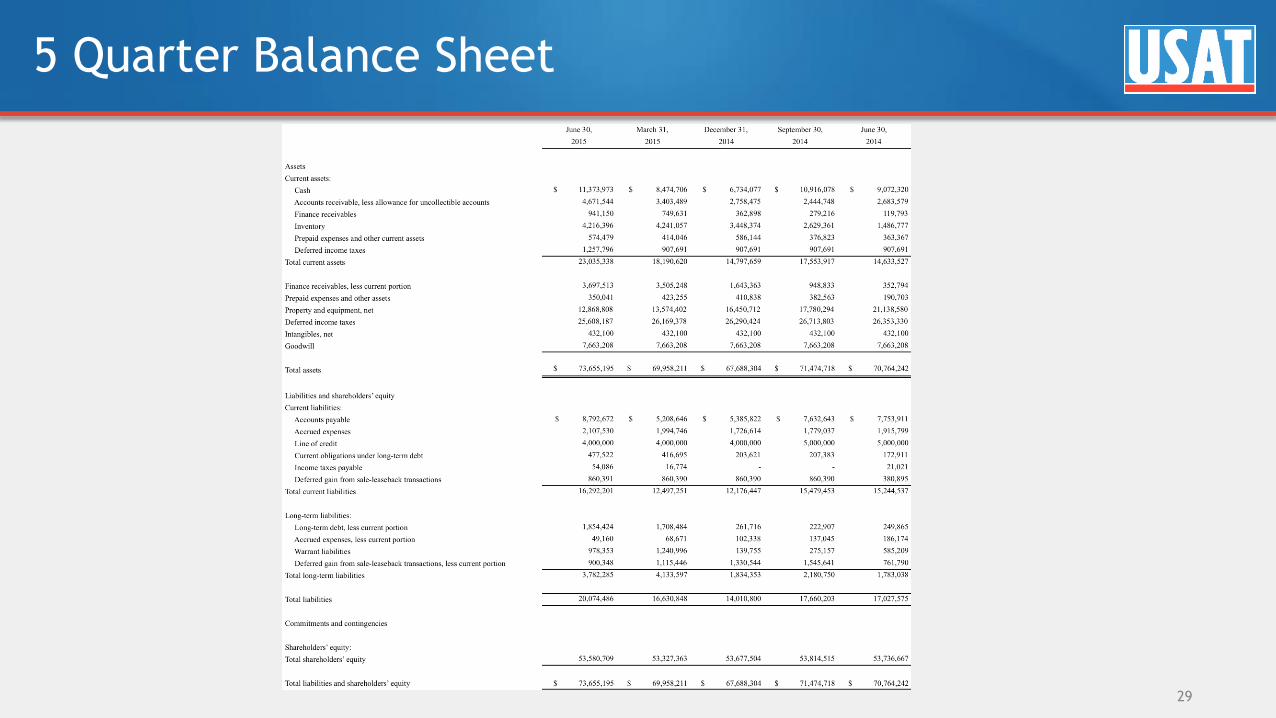
5 Quarter Balance Sheet and Cash Flow Highlights
26
($'s in thousands)
At or for the quarter ended: June 30, March 31, December 31, September 30, June 30,
2015 2015 2014 2014 2014
Cash 11,374$ 8,475$ 6,734$ 10,916$ 9,072$
Finance Receivables - Current 941$ 750$ 363$ 279$ 120$
Finance Receivables - Non-Current 3,698 3,505 1,643 949 353
Total Finance Receivables 4,639$ 4,255$ 2,006$ 1,228$ 473$
Jump Start Rental Equipment 11,993$ 12,566$ 15,300$ 16,593$ 19,824$
Deprecation Expense on Rental Equipment 1,205$ 1,279$ 1,272$ 1,285$ 1,376$
Net cash provided by (used in) operating activities 2,681$ 65$ (3,039)$ (1,405)$ 2,267$
Cash Used for Purchase of Property for Rental Program - - - (1,642) (3,672)
Free Cash Flow 2,681$ 65$ (3,039)$ (3,047)$ (1,404)$

Appendix B: Supplemental Financials and Non-GAAP
Tables
27
5 Quarter Statement of Operations
28
5 Quarter Balance Sheet
29
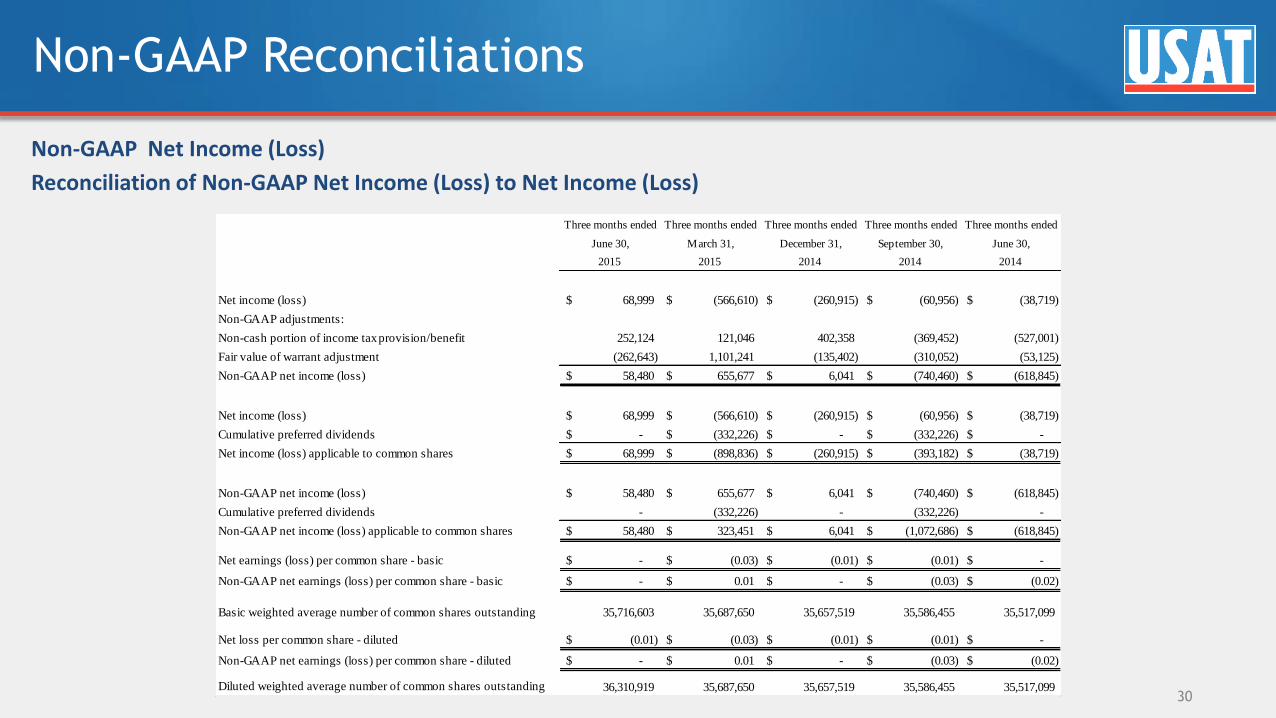
Non-GAAP Reconciliations
Non-GAAP Net Income (Loss)
Reconciliation of Non-GAAP Net Income (Loss) to Net Income (Loss)
30
Three months ended Three months ended Three months ended Three months ended Three months ended
June 30, March 31, December 31, September 30, June 30,
2015 2015 2014 2014 2014
Net income (loss) 68,999$ (566,610)$ (260,915)$ (60,956)$ (38,719)$
Non-GAAP adjustments:
Non-cash portion of income tax provision/benefit 252,124 121,046 402,358 (369,452) (527,001)
Fair value of warrant adjustment (262,643) 1,101,241 (135,402) (310,052) (53,125)
Non-GAAP net income (loss) 58,480$ 655,677$ 6,041$ (740,460)$ (618,845)$
Net income (loss) 68,999$ (566,610)$ (260,915)$ (60,956)$ (38,719)$
Cumulative preferred dividends -$ (332,226)$ -$ (332,226)$ -$
Net income (loss) applicable to common shares 68,999$ (898,836)$ (260,915)$ (393,182)$ (38,719)$
Non-GAAP net income (loss) 58,480$ 655,677$ 6,041$ (740,460)$ (618,845)$
Cumulative preferred dividends - (332,226) - (332,226) -
Non-GAAP net income (loss) applicable to common shares 58,480$ 323,451$ 6,041$ (1,072,686)$ (618,845)$
Net earnings (loss) per common share - basic -$ (0.03)$ (0.01)$ (0.01)$ -$
Non-GAAP net earnings (loss) per common share - basic -$ 0.01$ -$ (0.03)$ (0.02)$
Basic weighted average number of common shares outstanding 35,716,603 35,687,650 35,657,519 35,586,455 35,517,099
Net loss per common share - diluted (0.01)$ (0.03)$ (0.01)$ (0.01)$ -$
Non-GAAP net earnings (loss) per common share - diluted -$ 0.01$ -$ (0.03)$ (0.02)$
Diluted weighted average number of common shares outstanding 36,310,919 35,687,650 35,657,519 35,586,455 35,517,099
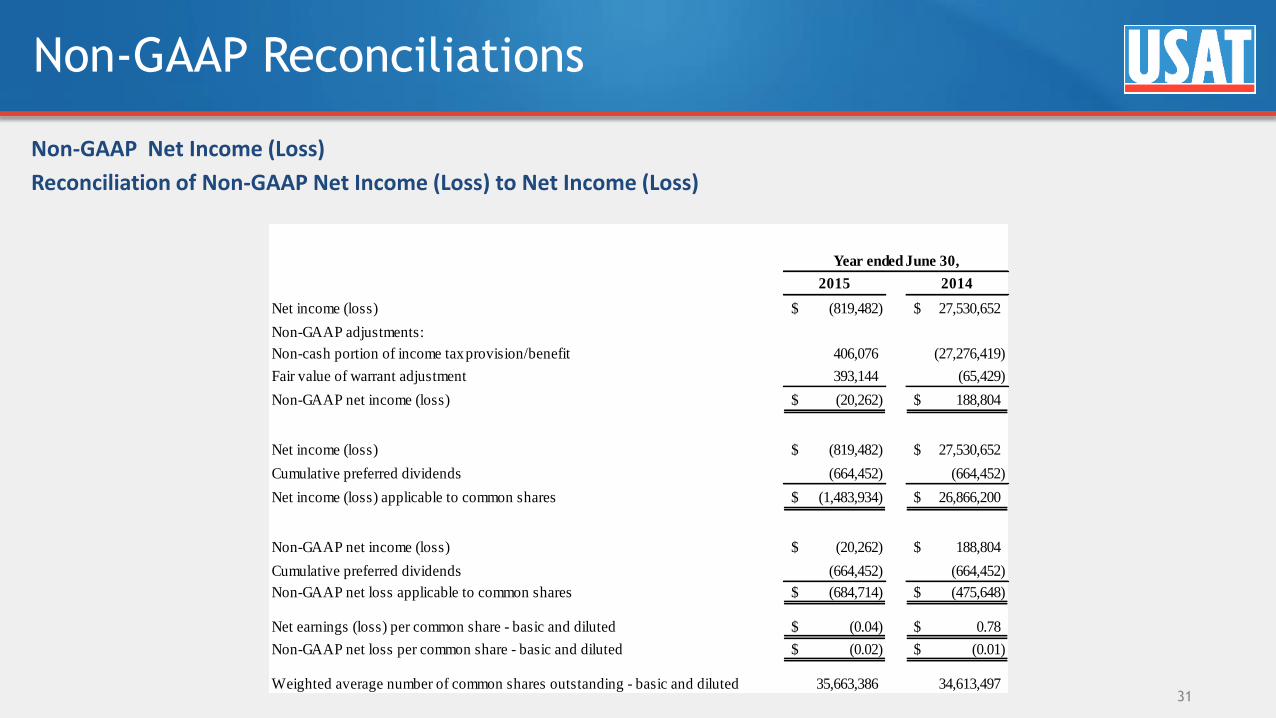
Non-GAAP Reconciliations
Non-GAAP Net Income (Loss)
Reconciliation of Non-GAAP Net Income (Loss) to Net Income (Loss)
31
2015 2014
Net income (loss) (819,482)$ 27,530,652$
Non-GAAP adjustments:
Non-cash portion of income tax provision/benefit 406,076 (27,276,419)
Fair value of warrant adjustment 393,144 (65,429)
Non-GAAP net income (loss) (20,262)$ 188,804$
Net income (loss) (819,482)$ 27,530,652$
Cumulative preferred dividends (664,452) (664,452)
Net income (loss) applicable to common shares (1,483,934)$ 26,866,200$
Non-GAAP net income (loss) (20,262)$ 188,804$
Cumulative preferred dividends (664,452) (664,452)
Non-GAAP net loss applicable to common shares (684,714)$ (475,648)$
Net earnings (loss) per common share - basic and diluted (0.04)$ 0.78$
Non-GAAP net loss per common share - basic and diluted (0.02)$ (0.01)$
Weighted average number of common shares outstanding - basic and diluted 35,663,386 34,613,497
Year ended June 30,
Non-GAAP Reconciliations
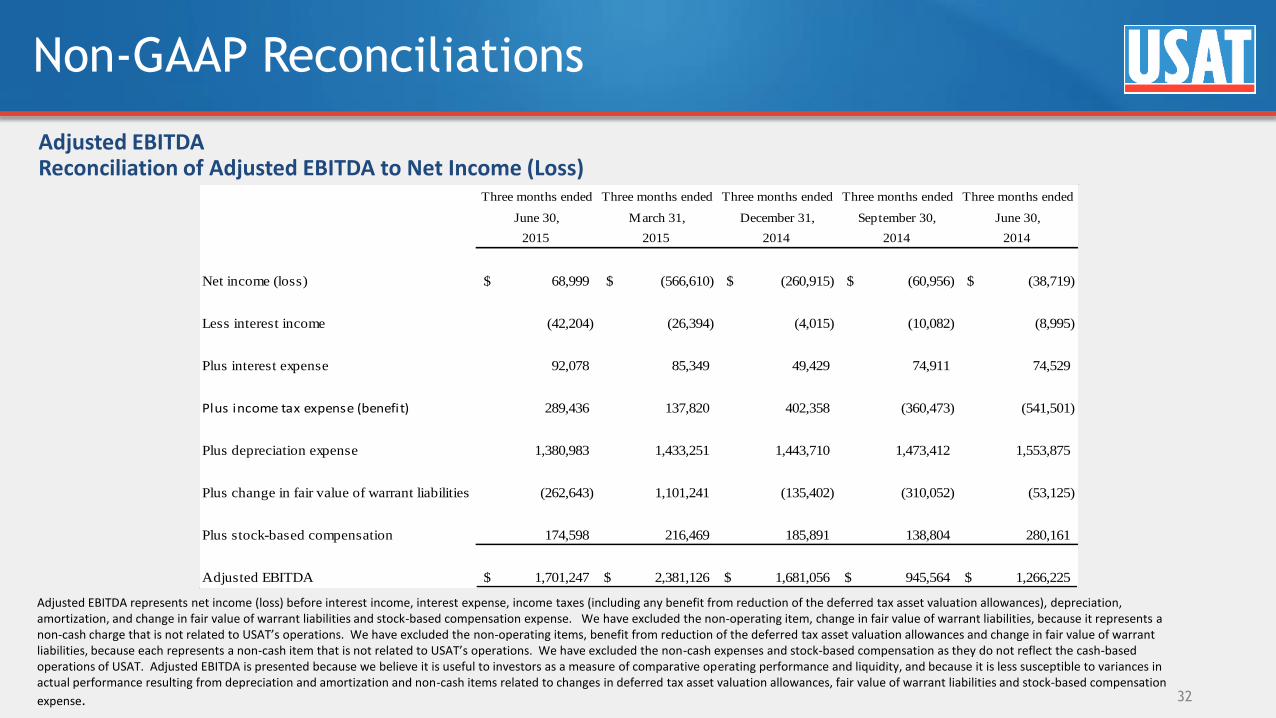
Adjusted EBITDA Reconciliation of Adjusted EBITDA to Net Income (Loss)
Adjusted EBITDA represents net income (loss) before interest income, interest expense, income taxes (including any benefit from reduction of the deferred tax asset valuation allowances), depreciation, amortization, and change in fair value of warrant liabilities and stock-based compensation expense. We have excluded the non-operating item, change in fair value of warrant liabilities, because it represents a non-cash charge that is not related to USAT’s operations. We have excluded the non-operating items, benefit from reduction of the deferred tax asset valuation allowances and change in fair value of warrant liabilities, because each represents a non-cash item that is not related to USAT’s operations. We have excluded the non-cash expenses and stock-based compensation as they do not reflect the cash-based operations of USAT. Adjusted EBITDA is presented because we believe it is useful to investors as a measure of comparative operating performance and liquidity, and because it is less susceptible to variances in actual performance resulting from depreciation and amortization and non-cash items related to changes in deferred tax asset valuation allowances, fair value of warrant liabilities and stock-based compensation
expense. 32
Three months ended Three months ended Three months ended Three months ended Three months ended
June 30, March 31, December 31, September 30, June 30,
2015 2015 2014 2014 2014
Net income (loss) 68,999$ (566,610)$ (260,915)$ (60,956)$ (38,719)$
Less interest income (42,204) (26,394) (4,015) (10,082) (8,995)
Plus interest expense 92,078 85,349 49,429 74,911 74,529
Plus income tax expense (benefit) 289,436 137,820 402,358 (360,473) (541,501)
Plus depreciation expense 1,380,983 1,433,251 1,443,710 1,473,412 1,553,875
Plus change in fair value of warrant liabilities (262,643) 1,101,241 (135,402) (310,052) (53,125)
Plus stock-based compensation 174,598 216,469 185,891 138,804 280,161
Adjusted EBITDA 1,701,247$ 2,381,126$ 1,681,056$ 945,564$ 1,266,225$
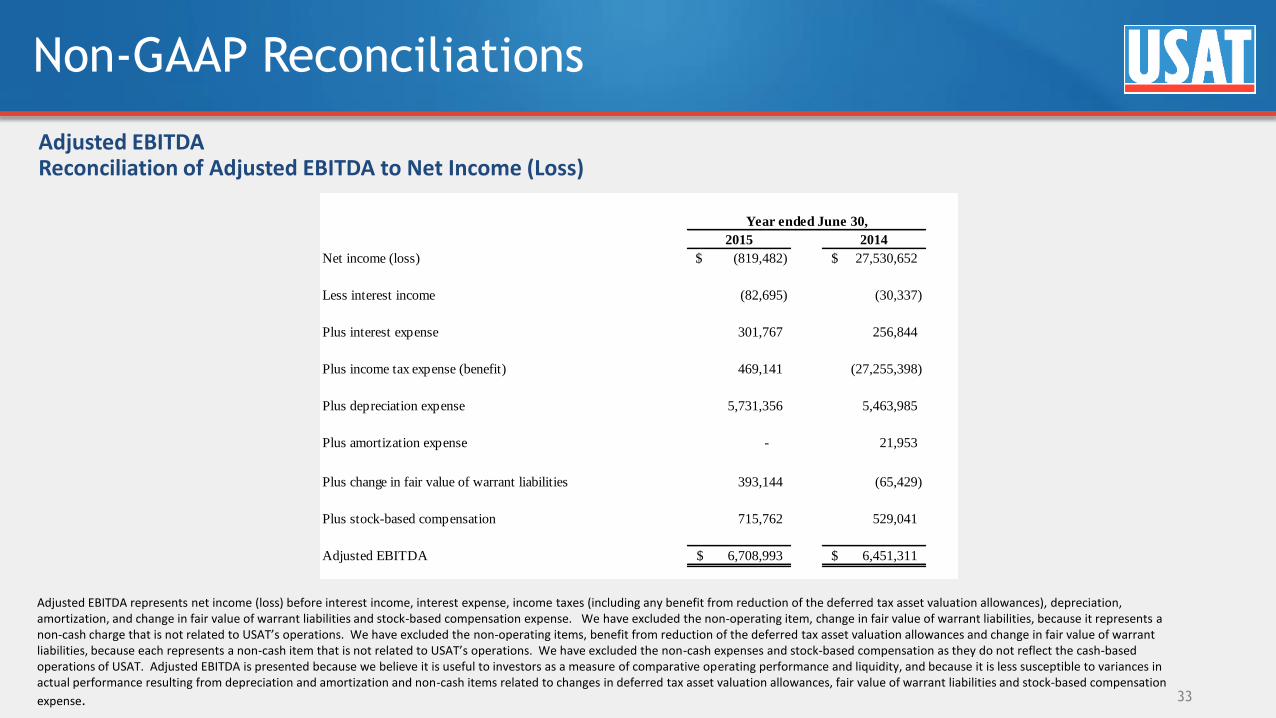
Non-GAAP Reconciliations
Adjusted EBITDA Reconciliation of Adjusted EBITDA to Net Income (Loss)
Adjusted EBITDA represents net income (loss) before interest income, interest expense, income taxes (including any benefit from reduction of the deferred tax asset valuation allowances), depreciation, amortization, and change in fair value of warrant liabilities and stock-based compensation expense. We have excluded the non-operating item, change in fair value of warrant liabilities, because it represents a non-cash charge that is not related to USAT’s operations. We have excluded the non-operating items, benefit from reduction of the deferred tax asset valuation allowances and change in fair value of warrant liabilities, because each represents a non-cash item that is not related to USAT’s operations. We have excluded the non-cash expenses and stock-based compensation as they do not reflect the cash-based operations of USAT. Adjusted EBITDA is presented because we believe it is useful to investors as a measure of comparative operating performance and liquidity, and because it is less susceptible to variances in actual performance resulting from depreciation and amortization and non-cash items related to changes in deferred tax asset valuation allowances, fair value of warrant liabilities and stock-based compensation
expense. 33
2015 2014
Net income (loss) (819,482)$ 27,530,652$
Less interest income (82,695) (30,337)
Plus interest expense 301,767 256,844
Plus income tax expense (benefit) 469,141 (27,255,398)
Plus depreciation expense 5,731,356 5,463,985
Plus amortization expense - 21,953
Plus change in fair value of warrant liabilities 393,144 (65,429)
Plus stock-based compensation 715,762 529,041
Adjusted EBITDA 6,708,993$ 6,451,311$
Year ended June 30,
Steve Herbert Chairman and CEO
Duncan Smith CFO
www.usatech.com
NASDAQ: USAT
800.633.0340
34