usace plug-in water quality modules developed for a...
TRANSCRIPT

Zhonglong Zhang, PhD, PH, PE
LimnoTech, USACE Environmental Lab.
Billy Johnson, PhD, PE, D.WRE
USACE Environmental Lab.
707 4th Street, Suite 100
Davis, California 95616
USACE Plug-In Water Quality
Modules Developed for a Variety of
Hydrologic and Hydraulic (H&H)
Models
Delta Modeling User Group Meeting
Sacramento, CA
February 21, 2018

Outline
▪ Background
▪ Water quality modules – dynamic linked
libraries
▪ Water quality capabilities in a variety of
H&H models
▪ Riparian vegetation simulation module

System Wide Water Resources
Program
▪ GSSHA▪ HEC-HMS▪ HEC-RAS▪ HEC-ResSim/CE-QUAL-W2▪ AdH
Riverine
Models
Watershed
Models
Estuarine
and Coastal
Models
Reservoir
Models

Ecosystem Management and
Restoration Research Program
▪ EMRRP products focus on cost-effective, science-based
impact assessment, restoration, and management
technologies for the Corps' water resource managers.
▪ EMRRP is targeted toward ecosystems of particular
concern to the Corps, namely: streams, riparian and
other floodplain, wetlands, and aquatic systems.

Corps Water Management System (CWMS)
Courtesy of Todd Staissberg
• CWMS provides real-time
decision support for water
management
• Features:
• Real-time data acquisition
• Database storage
• Flow forecasting of watershed
runoff
• Reservoir operation decision
support
• River profile modeling
• Inundated area determination
• Consequence/damage
analysis
• Information dissemination
• Implementation: 201 CWMS
systems by 2022
Database
Modeling
Information
Dissemination
Data
Visualization
RAS(Hydraulics)
FIA(Damages)
ResSim(Storage)
HMS(Hydrology)
Modeling
Data
Acquisition

Real-Time Fully Integrated H&H
Models in CWMS
HEC-HMSRunoff WQ
HEC-ResSimReservoir WQ
HEC-RASRiver WQ
WQMs(DLLs)
Courtesy of Todd Staissberg

H&H Models
• Completely mixed (0-order)
• One dimensional (1-D)– Longitudinal/Vertical
• Two dimensional (2-D)– Longitudinal and vertical
– Depth averaged
• Three dimensional (3-D)
More
data
Completely mixed
reactor
Deep, vertically
segmented
River-run impoundment,
longitudinally & vertically
segmented
Elongated, shallow,
longitudinally
segmented

A Water Quality Model
3-D Transport Equation
Water Quality
Model
Transport_________
Physical process
Kinetics_________
Biogeochemistry
z y
x

Plug-In Water Quality Modules
Water Quality
Modules (DLLs)• Water temperature
• General constituents
• Nutrients (C,N,P)
• Contaminants
• Mercury
HEC-RAS
(1D/2D)
AdH(2D/3D) SRH-2D
HEC-
ResSim
• Kinetic rate
• Pathways
• Derived constituents CE-QUAL-
W2
HEC-HMS

Plug-in Water Quality Modules▪ Modules
► Water Temperature Simulation Module (TEMP)
► General Constituent Simulation Module (GC)
► Solid Simulation Module (SED)
► Nutrient Simulation Module I (NSMI + SedFlux)
► Nutrient Simulation Module II (NSMII + SedFlux)
► Contaminant Simulation Module (CSM)
► Mercury Simulation Module (HgSM)
▪ ReferencesAquatic Nutrient Simulation Modules (NSMs) developed for hydrologic and
hydraulic models http://acwc.sdp.sirsi.net/client/en_US/search/asset/1048348Application and Evaluation of the HEC-RAS-Nutrient Simulation Module (NSMI)
http://acwc.sdp.sirsi.net/client/en_US/search/asset/1035283Aquatic Contaminant and Mercury Simulation Modules developed for hydrologic
and hydraulic models
http://acwc.sdp.sirsi.net/client/en_US/default/index.assetbox.assetactionicon.
view/1050727Verification and Evaluation of Aquatic Contaminant Simulation Module (CSM)
http://acwc.sdp.sirsi.net/client/en_US/search/asset/1050988

Water Quality Modules (DLLs) –
Kinetics (Biogeochemical Reactions)
Water column
Mu
lti s
edim
ent
laye
rs
Active sediment layer
Water columnBed sediment

Nutrient Simulation Modules
EUTROPHICATION
Excessive plant growth
PHYTOPLANKTON
Floating microscopic
algae
PERIPHYTON &
FILAMENTOUS ALGAE
Attached algae
MACROPHYTES
Higher vascular
rooted plants
Predominently in
shallow systems
(streams or nearshore
regions of lakes & estuaries)
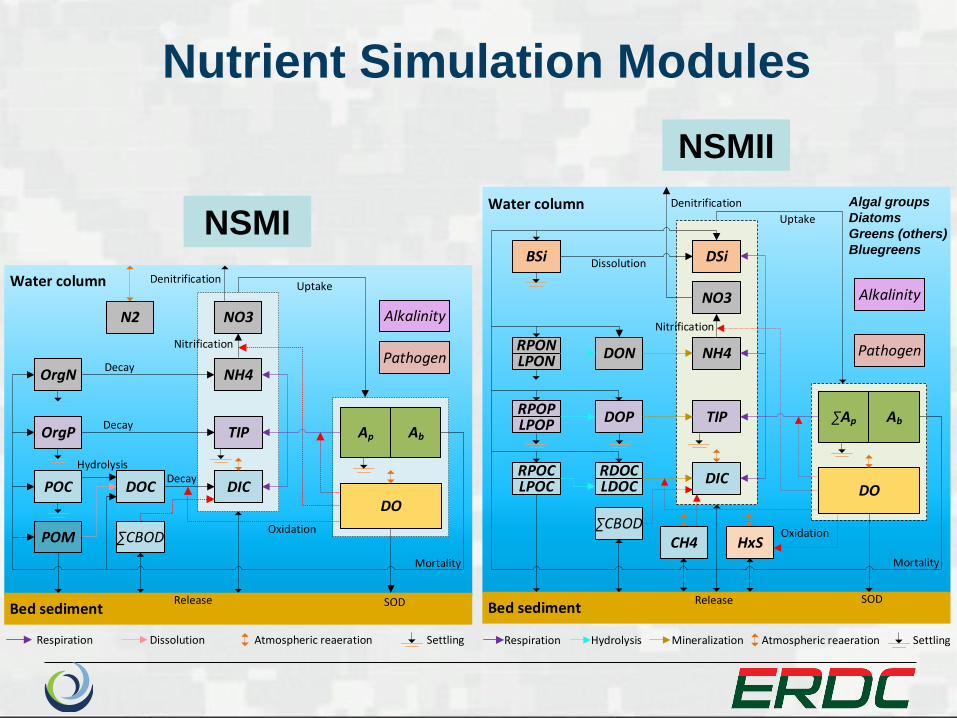
Nutrient Simulation Modules
Bed sediment
OrgN NH4
NO3
OrgP TIP
POC DOC DIC
CBODPOM
DO
Ap Ab
Alkalinity
Pathogen
N2
Water column Uptake
Oxidation
Decay
Decay
Mortality
Nitrification
Hydrolysis
Release
Respiration Dissolution
Decay
SOD
Denitrification
SettlingAtmospheric reaeration
RDOCLDOC
RPOCLPOC
Bed sediment
DON NH4
NO3
DOP TIP
DIC
CBOD
DO
Ap Ab
Alkalinity
Pathogen
RPOPLPOP
RPONLPON
CH4 HxS
DSiBSi
Water column
Nitrification
Uptake
Mortality
SOD
Dissolution
Denitrification
Oxidation
Atmospheric reaeration SettlingRespiration Hydrolysis Mineralization
Release
NSMI
NSMII
Algal groups
Diatoms
Greens (others)
Bluegreens

Sediment Diagenesis ModuleW
ater
Sed
imen
t
laye
r 1
Sed
imen
t la
yer
2
Diagenesis
POCG1,2
CH4, H2S,
NH3, CO2
POCG3,2
POCG2,2
PONG1,2
PONG3,2
PONG2,2
POPG1,2
POPG3,2
POPG2,2
PON
POP
POCDiagenesis
Diagenesis
CH4
NH4 (d)
PO4 (d)
H2S (d)
NO3
Partitioning
Burial
CH4
H2S (d)
NH4 (d)NO3
PO4 (d) Partitioning
Particle mixingDiffusion
Burial
CH4 H2S NH4NO3 DIP
BSi Si (d)
Si (d)
DSi
Dissolution
NH4 (p)
PO4 (p)
H2S (p)
Si (p)
Partitioning
Partitioning
Partitioning
H2S (p)
NH4 (p)
PO4 (p)
Si (p)
Ap, POC, PON, POP, BSi
Dep
osi
tio
n
Transfer
Nutrients
N, P
Fluxes
Nutrients
Nutrients

Contaminant Simulation Module
DOC Sorbed Phase
Dissolved Phase
Dif
fusi
on
Dif
fusi
on
Dep
osi
tio
n
Res
usp
en
sio
n
Burial
Volatilization
EquilibriumEquilibrium
Non-equilibrium
Equilibrium Equilibrium
Non-equilibrium
Water column
Bed sediment
Sorbed Phases
Algae POM Solids
DegradationTransformations
DegradationHydrolysisPhotolysis
Transformations
Sorbed Phases
POM SolidsDOC
Sorbed PhaseDissolved
Phase
Dep
osi
tio
n
• Soluble
• Complexes with
organic ligands
• Algae
• Detritus
• Inorganic Solids
(silt, clay, sand)

Hg Simulation Module
Hg0
Photodegradation
Oxi
dat
ion Reduction
Volatilization
Methylation
Demethylation
Dif
fusi
on
De
po
siti
on
Re
susp
en
sio
nD
epo
siti
on
Dif
fusi
on
De
po
siti
on
Res
usp
ensi
onD
epo
siti
on
Burial BurialMethylation
Demethylation
Water column
Bed sediment
HgII
Algae POM SolidsDissolved DOC
MeHg
AlgaePOMSolids DissolvedDOC
HgII
POM SolidsDissolved DOC
MeHg
POMSolids DissolvedDOC
Elementary Hg (Hg0)
Inorganic Hg (HgII)
Organic Hg (MeHg)
Algae
Detritus
Inorganic Solids (silt,
clay, sand)

HEC-ResSim (Reservoir System
Simulation) Water Quality
Courtesy of Todd Staissberg
HEC-ResSim
Evaluate Flow and WQ at every
time step
WQ Rules
Decision Engine
WQ Engine
WQ Libraries
Water quality should influence flows
Releases

Qout
zx
g
1D River 1D Reservoir
THERMOCLINE
rdensity
T
temperature
z
HEC-ResSim Water Quality

HEC-RAS (River Analysis System)
Water QualityWater Quality
Data
Water Quality
Analysis

Lower Minnesota River TMDL
Twelve (12) tributaries
Eight (8) point sources
(Courtesy of MCES)

Lower Minnesota River HEC-RAS
Water Quality Model

Comparison of Modeled Results and
Observed Data at RM 3.5
2001 2002 2003 2004 2005 20060
2
4
6
8
10
12
14
16
18
C:\MNriver\RAS\101413\LMNRRAS.wq03
Time
Dis
solv
ed O
xyge
n (m
g/l)
Legend
Obs: Minnesota Lower 5601.1
Dissolved Oxygen (mg/l)
Simulation
2001 2002 2003 2004 2005 20060.00
0.05
0.10
0.15
0.20
0.25
0.30
0.35
0.40
C:\MNriver\RAS\101413\LMNRRAS.wq03
Time
Ort
ho
pho
sph
ate
(m
g/l)
Legend
Obs: Minnesota Lower 5601.1
Orthophosphate (mg/l)
Simulation
2001 2002 2003 2004 2005 20060.0
0.5
1.0
1.5
2.0
C:\MNriver\RAS\101413\LMNRRAS.wq03
Time
Org
an
ic P
ho
sph
oru
s (m
g/l)
Legend
Obs: Minnesota Lower 5601.1
Organic Phosphorus (mg/l)
Simulation
Dissolved inorganic phosphorousOrganic phosphorous
Dissolved oxygen
2001 2002 2003 2004 2005 20060
5
10
15
20
C:\Development\WQdll\Testing\LMNR-RASWQ\LMNRRAS.wq03
Time
Alg
ae
(m
g/l)
Legend
Obs: Minnesota Lower 5601.1
Algae (mg/l)
Simulation
Algal concentration

Comparison of Modeled Results and
Observed Data at RM 3.5
2001 2002 2003 2004 2005 20060.0
0.2
0.4
0.6
0.8
1.0
1.2
C:\MNriver\RAS\101413\LMNRRAS.wq03
Time
Am
mon
ium
Nitro
ge
n (
mg
/l)
Legend
Obs: Minnesota Lower 5601.1
Ammonium Nitrogen (mg/l)
Simulation
2001 2002 2003 2004 2005 20060.0
0.5
1.0
1.5
2.0
2.5
3.0
3.5
4.0
C:\MNriver\RAS\101413\LMNRRAS.wq03
Time
Org
an
ic N
itro
ge
n (m
g/l)
Legend
Obs: Minnesota Lower 5601.1
Organic Nitrogen (mg/l)
Simulation
Organic nitrogen
Ammonium nitrogen
2001 2002 2003 2004 2005 20060
2
4
6
8
10
12
14
16
C:\MNriver\RAS\101413\LMNRRAS.wq03
Time
Nitr
ate
Nitr
og
en
(NO
3) (m
g/l)
Legend
Obs: Minnesota Lower 5601.1
Nitrate Nitrogen(NO3) (mg/l)
Simulation
Nitrate-Nitrite nitrogen
2001 2002 2003 2004 2005 20060
5
10
15
20
C:\Development\WQdll\Testing\LMNR-RASWQ\LMNRRAS.wq03
Time
Alg
ae
(m
g/l),D
issolv
ed
Oxyge
n (m
g/l)
Legend
Algae (mg/l)
Dissolved Oxygen (mg/l)
Simulation
Algae vs. Dissolved oxygen
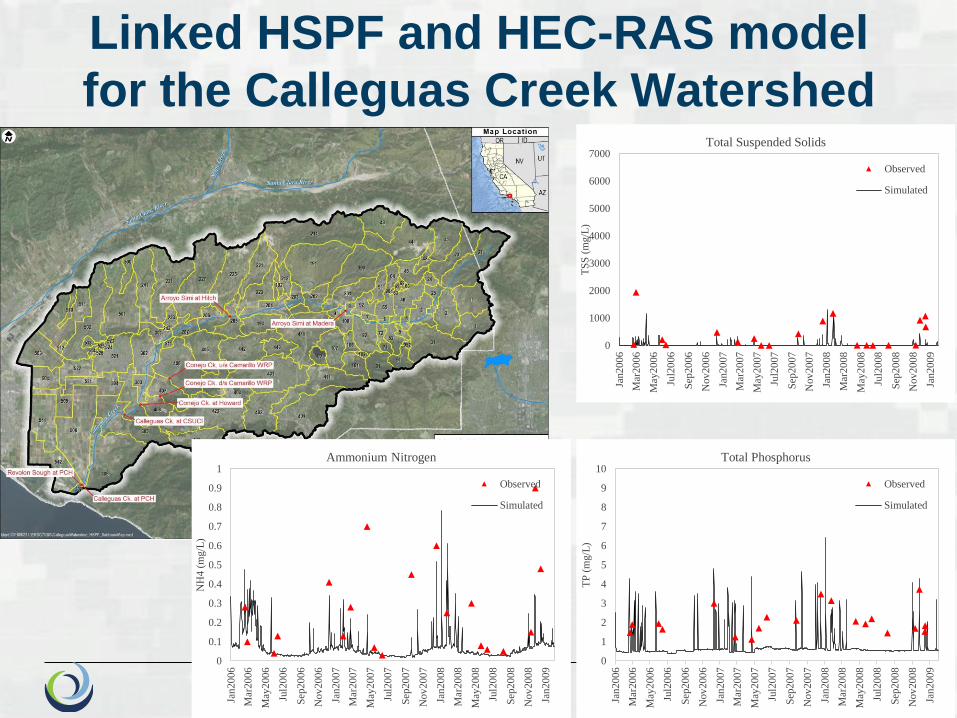
Linked HSPF and HEC-RAS model
for the Calleguas Creek Watershed
0
0.1
0.2
0.3
0.4
0.5
0.6
0.7
0.8
0.9
1
Jan20
06
Mar
20
06
May
2006
Jul2
006
Sep
20
06
Nov
200
6
Jan20
07
Mar
20
07
May
2007
Jul2
007
Sep
20
07
Nov
200
7
Jan20
08
Mar
20
08
May
2008
Jul2
008
Sep
20
08
Nov
200
8
Jan20
09
NH
4 (
mg/L
)
Ammonium Nitrogen
Observed
Simulated
0
1
2
3
4
5
6
7
8
9
10
Jan20
06
Mar
20
06
May
2006
Jul2
006
Sep
20
06
Nov
200
6
Jan20
07
Mar
20
07
May
2007
Jul2
007
Sep
20
07
Nov
200
7
Jan20
08
Mar
20
08
May
2008
Jul2
008
Sep
20
08
Nov
200
8
Jan20
09
TP
(m
g/L
)
Total Phosphorus
Observed
Simulated
0
1000
2000
3000
4000
5000
6000
7000
Jan20
06
Mar
20
06
May
2006
Jul2
006
Sep
20
06
Nov
200
6
Jan20
07
Mar
20
07
May
2007
Jul2
007
Sep
20
07
Nov
200
7
Jan20
08
Mar
20
08
May
2008
Jul2
008
Sep
20
08
Nov
200
8
Jan20
09
TS
S (
mg/L
)
Total Suspended Solids
Observed
Simulated

Linked HSPF and HEC-RAS model
for the Patuxent Watershed
0.0
0.5
1.0
1.5
2.0
2.5
3.0
3.5
Jan-95 Jan-96 Jan-97 Jan-98 Jan-99 Jan-00
Alg
(m
g/l)
Algal Concentration
Patuxent River near Bowie, MD
Observed Simulated
4
6
8
10
12
14
DO
(m
g/l)
Dissolved Oxygen Concentration
Patuxent River near Bowie, MD
Observed Simulated

Missouri River Recovery Management Plan

Missouri River Recovery Management Plan
and Environmental Impact Statement

Missouri River Recovery Management Plan
and Environmental Impact Statement
1995 1997 1999 2001 2003 2005 2007 2009 2011 20130
5
10
15
20
25
30
35
C:\Projects\MoR\083016\GavtoRulo\Alt1\gavunstdy.wq03
Time
Wate
r T
em
pera
ture
(C
)
Legend
Obs: Missouri River Weeping to Nishn 562.74
Water Temperature (C)
Simulation
1995 1997 1999 2001 2003 2005 2007 2009 2011 20130
5
10
15
20
25
30
35
C:\Projects\MoR\083016\GavtoRulo\Alt1\gavunstdy.wq03
Time
Wate
r T
em
pera
ture
(C
)
Legend
Obs: Missouri River Tarkio to BigNem 498.04
Water Temperature (C)
Simulation
USGS 06813500
USGS 06807000
1995 1997 1999 2001 2003 2005 2007 2009 2011 20130
5
10
15
20
25
30
35
C:\Projects\MoR\083016\RulotoMouth\Alt1Osage\RulotoMouth.wq01
Time
Wate
r T
em
pera
ture
(C
)
Legend
Obs: MISSOURI RM 463-391 448.17
Water Temperature (C)
Simulation
USGS 06818000
1995 1997 1999 2001 2003 2005 2007 2009 2011 20130
5
10
15
20
25
30
35
40
C:\Projects\MoR\083016\RulotoMouth\Alt1Osage\RulotoMouth.wq01
Time
Wate
r T
em
pera
ture
(C
)Legend
Obs: MISSOURI RM 104-0 97.93
Water Temperature (C)
Simulation
USGS 06934500

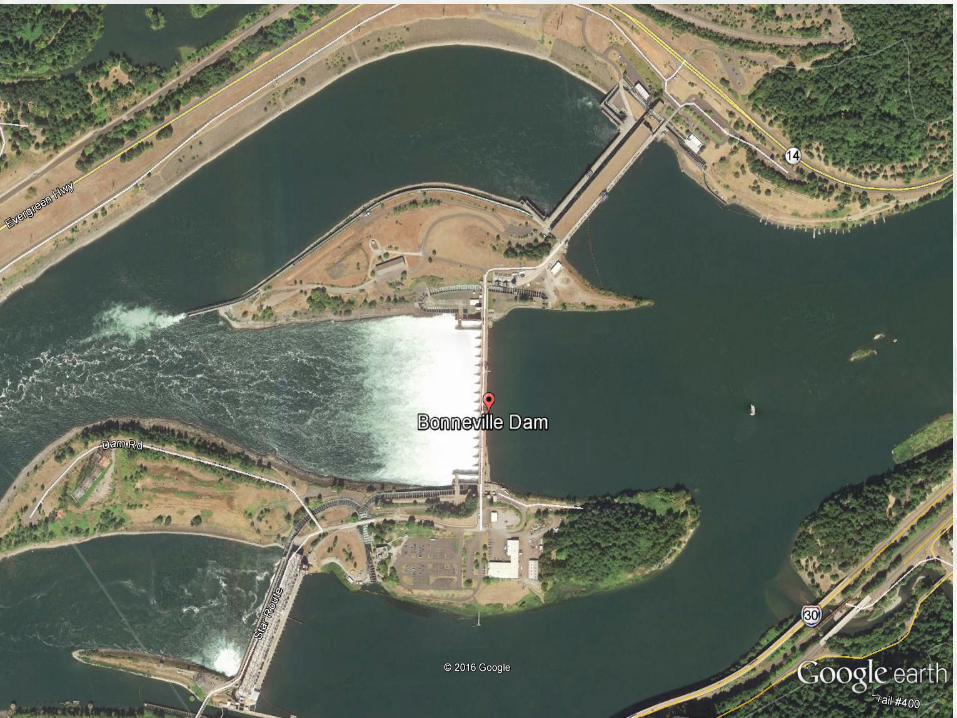
Columbia River System Operations
(CRSO)
Courtesy of Dan Turner
▪ CRSO
► 12 Corps dams
► 2 BOR dams
► BPA markets the power
generated from the dams
▪ Evaluate impact of
operation and
configuration of federal
dams on:
► Water temperature
► Total dissolved gases
(TDG)

Enhancement of CE-QUAL-W2
Qout
z
x
w
u
g
a
Slope=S=tanaRiver Section Reservoir Section
• SYSTDG
• SedFlux, Carbon Cycle, HgSM

CRSO Water Quality Models
CE-QUAL W2, 2-D modeling
HEC-RAS, 1-D modeling
model connections
Canadian System
Albeni Falls
Libby
Grand Coulee
Dworshak
Hungry
Horse
Lower
GraniteLittle
GooseLower
Mon.Ice
HarborMcNaryJohn DayThe DallesBonneville
Snake River
Anatone
Rock Island
Clearwater River
Orofino
Columbia River
International Bndy
Chief Joseph
Wanapum
Priest Rapids
Rocky Reach
Hanford Reach
Columbia River
Washougal
Federal dam
Non-Federal dam
Boundary condition gage
Courtesy of Dan Turner
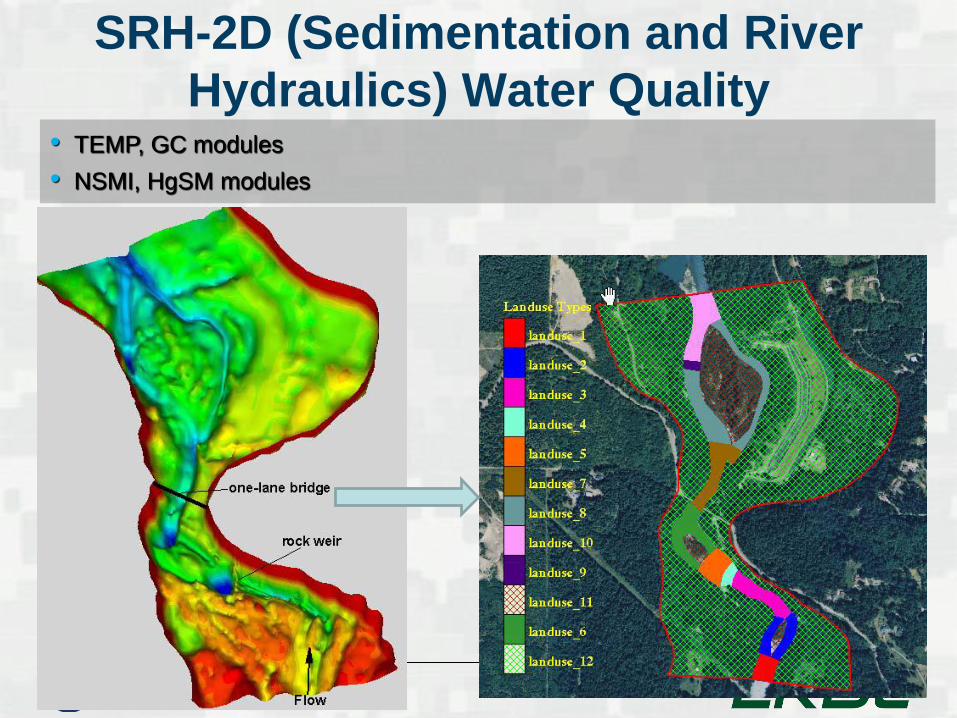
SRH-2D (Sedimentation and River
Hydraulics) Water Quality• TEMP, GC modules
• NSMI, HgSM modules

AdH (Adaptive Hydraulics) Water Quality
Three testing modes:
► No flow “bathtub”
► Simple flume
► Field case
• TEMP, GC modules
• NSMI, CSM modules

RVSM (Riparian Vegetation Simulation Module)
Developed for 1D and 2D Hydraulic Models

RVSM
▪ Seedling establishment
• Germination period
• Seed dispersal
▪ Plant growth
• Growth rate (stalk, root)
• Max height/depth for stalk/root
• Effects on roughness through growth
▪ Mortality
• Competition
• Scour (high flows on young plant)
• Drowning (inundated for duration)
• Desiccation (root growth < GW drop)
• Ice, burying
Can
opy
heig
ht
Canopy width
Plan
t heig
ht
Ro
ot d
epth
Stem diameter
▪ Processes of vegetation life cycle
Cross
section N-1
Cross
section N
Cross
section N+1
Left bank line
Right bank line
Vegetation
polygons
Left and right
bank points on
cross section
Left river
boundary
Right river
boundary
▪ Plant height, root depth, canopy
width, stem diameter etc. are computed

RVSM --> 1D/2D Hydraulic Models
One-dimensional (1D) models Two-dimensional (2D) models
• HEC-RAS – 1D/2D
• SRH - 1D/2D

Application of HEC-RAS-1D-RVSM to
Sacramento River
• Study area➢ from Red Bluff to Colusa with
107 miles
➢ Ecological management zone
➢ Abundant vegetation data
➢ Restoration projects were
implemented
• Purposes➢ Model interactions between
flow and vegetation
➢ Predict vegetation area change
➢ Examine what caused
vegetation establishment
change

Application of HEC-RAS-1D-RVSM to
Sacramento River
Year Cottonwood Mixed
forest
Riparian
shrub
Invasive
species
Grass
Area from
mapping
(acre)
1999 5319 8842 3310 77 3169
2007 6621 6621 4127 122 4280
Change
ratio
1.35 0.75 1.25 1.59 1.35
Area from
model (acre)
1999 5308 8827 3275 72 3233
2007 6028 8246 3891 153 4609
Change
ratio
1.14 0.93 1.19 2.12 1.42

Acknowledgements▪ USACE - ERDC
► Mark Dortch, Carl Cerco, Tate McAlpin, David Smith, Gaurav
Savant
▪ USACE - HEC
► Todd Staissberg, Mark Jensen, Steve Piper, Alex Sanchez
▪ RMA
► John DeGeorge, Stephen Andrews
▪ USBR - TSC
► Yong Lai, Blair Greimann, Victor Huang
▪ USACE - NWD
► Jeff Tripe, Kara Reeves
► Kathryn Tackley, Dan Turner
▪ Universities
► James Martin (MSU), Kevin Farley (Manhattan), Junna Wang
(UCD)