usage of antibiotics and occurrence of antibiotic
TRANSCRIPT

Swiss Antibiotic Resistance Report 2018 anresis.chARCH-Vet
Usage of Antibiotics and Occurrence of Antibiotic Resistance in Bacteria from Humans and Animals in Switzerland

Publishing details© Federal Office of Public Health FOPHPublished by the Federal Office of Public Health FOPHPublication date: November 2018Editors: Karin Wäfler, Division of Communicable Diseases, Federal Office of Public Health (FOPH), and Dagmar Heim, Veterinary Medicinal Products and Antibiotics, Federal Food Safety and Veterinary Office (FSVO)Project coordination: Adrian Heuss, advocacy ag Design and layout: diff. Kommunikation AG, BernFOPH publication number: 2018-OEG-87Source: SFBL, Distribution of Publications, CH-3003 Bernwww.bundespublikationen.admin.chOrder number: 316.402.16eng
www.star.admin.ch
Please cite this publication as:Federal Office of Public Health and Federal Food Safety and Veterinary Office. Swiss Antibiotic Resistance Report 2018. Usage of Antibiotics and Occurrence of Antibiotic Resistance in Bacteria from Humans and Animals in Switzerland. November 2018. FOPH publication number: 2018-OEG-87.

Table of contents 1
Table of contents
1 Foreword 6 Vorwort 7 Avant-propos 8 Prefazione 9
2 Summary 12 Zusammenfassung 15 Synthèse 18 Sintesi 22
3 Introduction 263.1 Antibiotic resistance 26 3.2 About anresis.ch 26 3.3 About ARCH-Vet 27 3.4 Guidance for readers 283.5 Authors and contributions 29
4 Abbreviations 32
5 Antibacterial consumption in human medicine 365.1 Hospital care 365.2 Outpatient care 405.3 Discussion 44
Textbox: Antibiotic Prescriptions in Outpatient Medical Care 46
6 Sales of antimicrobials in veterinary medicine 486.1 Sales of antimicrobials for use in animals 486.2 Sales of antimicrobials for use in livestock animals 496.3 Sales of antimicrobials licensed for companion animals 516.4 Discussion 52
Textbox: Antibiotic Substances in the Water Cycle 53

2 Table of contents
7 Resistance in bacteria from human clinical isolates 56 7.1 Escherichia coli 56
Textbox: Temporal and Regional Prevalence of Carbapenemase-Producing Enterobacteriaceae59 from 2013 to 2017 in Switzerland
Textbox: The National Reference Center for Emerging Antibiotic Resistance (NARA) 60 7.2 Klebsiella pneumoniae 60 7.3 Pseudomonas aeruginosa 63 7.4 Acinetobacter spp. 63
Textbox: Carbapenem-Resistant Acinetobacter baumannii from 2005 to 2016 in Switzerland. 66 7.5 Streptococcus pneumoniae 68
7.6 Enterococci 71 7.7 Staphylococcus aureus 71
Textbox: Treatment of the Tree Disease Fire Blight with Antibiotics 75Textbox: Antibacterial Resistance in the Aquatic Environment 76
8 Resistance in zoonotic bacteria in animals from primary production samples 80
8.1 Campylobacter spp. 80 8.2 Salmonella spp. 84
Textbox: Persistence of Quinolone and Tetracycline Resistance in Thermophilic Campylobacter from Poultry 85Textbox: Modern Microbiological Surveillance for Antibiotic Drug Resistance 93
9 Resistance in indicator bacteria from livestock animals 98
9.1 Enterococci 98 9.2 Escherichia coli 103
9.3 ESBL / pAmpC-producing Escherichia coli 1059.4 Methicillin-resistant Sta phy lococcus aureus (MRSA) 110 Textbox: Mcr-1-Based Colistin Resistance: Filling Knowledge Gaps in View of the Spread
of Plasmid-Mediated Colistin Resistance in Switzerland 115
10 Resistance in bacteria isolated from meat 118 10.1 ESBL/pAmpC- and carbapenemase-producing Escherichia coli 118
10.2 MRSA in meat 12010.3 Discussion 121
11 Resistance in bacteria from animal clinical isolates 126 11.1 Staphylococcus spp. 126 11.2 Streptococcus equi subspecies zooepidemicus 127 11.3 Escherichia coli in dogs 128
11.4 Discussion 129

Table of contents 3
12 Analysis 134 12.1 Association Between Antibiotic Consumption and Resistance in Animals and in Humans,
a One-Health Approach 134 12.2 Molecular features of Swiss methicillin-resistant Staphylococcus aureus (MRSA) 138
13 Materials and methods 146 13.1 Data on antibacterial consumption in human medicine 146 13.2 Data on antimicrobial sales in veterinary medicine 147
13.3 Bacterial isolates from humans (clinical probes) 147 13.4 Bacterial isolates from animals and meat thereof 149
13.5 Susceptibility testing, breakpoints, processing antibiotic resistance data from human isolates 149 13.6 Susceptibility testing, cut-offs, breakpoints, processing antimicrobial resistance data from animal isolates 151
Annex 155 Annex I: Antibiotics with defined daily dose (DDD) and AWaRe classification according to
the WHO Essential Medicines List 156 Annex II: Distribution of minimal inhibitory concentrations (MICs) and resistance patterns in bacterial isolates
from animals and meat 159
Index 191 Figures, tables and textboxes


1Foreword

One Health is now recognized globally as a pivotal approach to overcoming a large number of healthcare-related prob-lems, especially antibiotic resistance. Just like veterinary medicine, agriculture and environmental protection agen-cies, the field of human medicine faces challenges in its ef-forts to maintain the health of everyone. The World Health Organization’s Global Action Plan, and – for example – the efforts being made by the G20 nations or the European Union, all put the One-Health approach center stage as a way of dealing with and combating the issue of antibiotic resistance.
This approach obviously has great significance in the con-text of the “Monitoring” field of activity in StAR, which can only deliver truly meaningful information if all areas contrib-ute and cross-area analysis takes place.
Monitoring involves the collection of data on antibiotic re-sistance on the one hand and data on antibiotic consumption in human and veterinary medicine on the other. These data provide a good overview of the situation in the various areas.Although inappropriate use of antibiotics is known to have an effect on the development of resistance, there is often a time lag in recognizing the connection among other things, and it is not apparent in every type of resistance. Obtaining a better understanding of how resistance comes about (what causes resistance in which bacteria and in which ar-eas) and the paths by which it is transmitted requires analy-sis in greater depth by an interdisciplinary team that brings together expertise from the various areas and disciplines.
The Swiss Antibiotic Resistance Report 2018 integrates for the first time a One-Health analysis (see Chapter 12). This firstly involved an evaluation of antibiotic consumption data in human and veterinary medicine compared with antibiotic resistances in humans and animals. Secondly, typing data for methicillin-resistant Staphylococcus aureus (MRSA) from humans and animals were compared to investigate the question of whether the same “types” occur in humans as in animals.
Future editions of the Swiss Antibiotic Resistance Report will each take an in-depth look at a different resistant bacte-rium.
We would like to thank everyone who contributed to this report for their work and hope you will find it instructive reading.
1 Foreword
Dr. med. Daniel Koch Dr. med. vet. Joseph SchmidtFederal Office of Public Health Federal Food Safety and Veterinary Office
6 Foreword

One Health ist mittlerweile als massgebender Ansatz für die Bewältigung vieler Probleme im Gesundheitsbereich, im Speziellen der Antibiotikaresistenzen, weltweit anerkannt. Gefordert ist der Humanbereich genauso wie der Tier-, der Landwirtschafts- und der Umweltbereich, um die Gesund-heit aller zu erhalten. Der Global Action Plan der Weltge-sundheitsorganisation WHO und beispielsweise die An-strengungen der G20-Staaten oder der Europäischen Union stellen alle den One-Health-Ansatz ins Zentrum, um das Problem der Antibiotikaresistenzen und deren Bekämpfung anzugehen.
Dieser Ansatz hat selbstverständlich auch im StAR-Hand-lungsfeld «Überwachung» eine grosse Bedeutung. Die Überwachungsdaten sind erst dann wirklich aussagekräftig, wenn alle Bereiche beitragen und eine übergreifende Analy-se erfolgt.
Bei der Überwachung werden zum einen Daten zu Antibio-tikaresistenzen, zum anderen Daten zum Antibiotikaver-brauch in der Human- und Veterinärmedizin gesammelt. Diese Daten ermöglichen einen guten Überblick über die Situation in den verschiedenen Bereichen.
Es ist bekannt, dass der unsachgemässe Antibiotikaeinsatz einen Einfluss auf die Resistenzbildung hat. Jedoch ist die-ser Zusammenhang unter anderem oft nur zeitverzögert zu erkennen und nicht bei jeder Art von Resistenz eindeutig. Für ein besseres Verständnis der Resistenzentstehung (wodurch entstehen in welchen Gebieten Resistenzen bei welchen Bakterien) und der verantwortlichen Übertragungs-wege braucht es weitergehende Analysen durch ein inter-disziplinäres Team, welches die Expertise aus den verschie-denen Bereichen und Disziplinen zusammenbringt.
Im vorliegenden Swiss Antibiotic Resistance Report 2018 wird zum ersten Mal eine One-Health-Analyse integriert (siehe Kapitel 12). Dabei wurde einerseits eine vergleichen-de Auswertung der Antibiotikaverbrauchsdaten in der Hu-man- und Veterinärmedizin mit den Antibiotikaresistenzda-ten bei Mensch und Tier durchgeführt. Andererseits wurden Typisierungsdaten von Methicillin-resistenten Staphylococ-cus aureus (MRSA) von Menschen und Tieren verglichen, um die Frage zu klären, ob die gleichen «Typen» sowohl beim Menschen als auch beim Tier vorkommen.
In den nächsten Ausgaben des Swiss Antibiotic Resistance Report soll jeweils ein anderer resistenter Keim vertieft be-trachtet werden.
Wir danken allen Beteiligten des Reports für ihre Arbeit und wünschen Ihnen eine erkenntnisreiche Lektüre!
1 Vorwort
Dr. med. Daniel Koch Dr. med. vet. Joseph SchmidtBundesamt für Gesundheit Bundesamt für Lebensmittelsicherheit und Veterinärwesen
Vorwort 7

L’approche One Health est devenue la référence mondiale pour affronter de nombreux problèmes de santé publique, en particulier celui de la résistance aux antibiotiques. Il s’agit de mobiliser la médecine humaine, la médecine vétérinaire, l’agriculture et la protection de l’environnement dans le but de préserver la santé de tous. Cette approche est au cœur du Plan d’action mondial de l’Organisation mondiale de la santé OMS et, par exemple, des efforts déployés par les États du G20 et l’Union européenne pour s’atteler à la pro-blématique de la lutte contre la résistance aux antibiotiques.
L’approche One Health occupe tout naturellement une place importante dans le champ d’action « Surveillance » de la stratégie Antibiorésistance. En effet, pour que les données récoltées dans ce cadre soient vraiment pertinentes, il faut que tous les domaines participent et qu’une analyse globale soit réalisée.
La surveillance consiste à collecter des données relatives, d’une part, à la résistance aux antibiotiques et, d’autre part, à l’usage de ces produits en médecine humaine et vétéri-naire. Ces données offrent un bon aperçu de la situation dans les différents domaines.
Nous savons que l’usage excessif d’antibiotiques a une in-fluence sur le développement d’une résistance. Néanmoins, cette relation de causalité ne peut souvent être connue qu’à posteriori et n’est pas évidente avec tous les types de résis-tance. Afin de mieux comprendre l’apparition des résis-tances (ce qui les provoque, où elles apparaissent et chez quelles bactéries) ainsi que les modes de transmission res-ponsables, de plus amples analyses sont nécessaires. Ces dernières doivent être menées par une équipe interdiscipli-naire, afin que les expertises issues des différents domaines et disciplines soient mises en commun.
Le Swiss Antibiotic Resistance Report 2018 est le premier rapport à intégrer une analyse One Health (voir chapitre 12). Il présente, d’une part, une évaluation comparant les don-nées sur l’usage des antibiotiques en médecine humaine et vétérinaire avec les données relatives à la résistance aux antibiotiques chez l’homme et l’animal. D’autre part, les don-nées de typage pour le Staphylococcus aureus résistant à la méticilline (SARM) ont été confrontées dans le but de déter-miner si les mêmes « types » sont présents chez l’homme et chez l’animal.
Les prochaines éditions du Swiss Antibiotic Resistance Re-port se pencheront chacune sur un germe résistant diffé-rent.
Nous remercions tous les participants au rapport pour leur travail et vous souhaitons une lecture instructive.
1 Avant-propos
Dr. Daniel Koch, médecin Dr. Joseph Schmidt, vétérinaireOffice fédéral de la santé publique Office fédéral de la sécurité alimentaire et des affaires vétérinaires
8 Avant-propos

L’approccio One Health è diventato la referenza mondiale per affrontare numerosi problemi in ambito sanitario, in par-ticolare quello delle resistenze agli antibiotici. Allo scopo di preservare la salute di tutti vengono promossi gli ambiti con-cernenti l’essere umano, gli animali, l’agricoltura e l’ambien-te. Il Piano d’azione globale dell’Organizzazione mondiale della sanità OMS e, per esempio, gli sforzi profusi dagli Sta-ti del G20 o dell’Unione europea puntano tutti sull’approccio One Health per gestire e contrastare il problema delle resi-stenze agli antibiotici.
Questo approccio riveste naturalmente grande importanza anche nell’area d’intervento «Sorveglianza» della Strategia contro le resistenze agli antibiotici (StAR). Tuttavia, affinché i dati raccolti in questo quadro siano davvero significativi è necessario che tutti i settori partecipino e che sia effettuata un’analisi globale.
Nell’ambito della sorveglianza vengono raccolti dati relativi, da un lato, alle resistenze agli antibiotici e, dall’altro, al con-sumo di questi medicamenti nella medicina umana e veteri-naria. Questi dati offrono un buon quadro della situazione in diversi settori.
È noto che l’uso scorretto degli antibiotici influisce sullo svi-luppo di resistenze. Tuttavia, questo rapporto di causalità viene spesso riconosciuto soltanto a posteriori e non è evi-dente per tutti i tipi di resistenza. Per comprendere meglio lo sviluppo di resistenze (per quali cause, in quali ambiti e in quali batteri) e le vie di trasmissione responsabili sono ne-cessarie analisi più approfondite da parte di un team interdi-sciplinare, che possa sfruttare congiuntamente competenze specialistiche di diversi ambiti e discipline.
Lo Swiss Antibiotic Resistance Report 2018 integra per la prima volta un’analisi One Health (cfr. capitolo 12). Presenta, da un lato, un’analisi comparativa tra i dati sul consumo di antibiotici in medicina umana e veterinaria e quelli sulle resi-stenze a questi medicamenti nell’essere umano e negli ani-mali e, dall’altro, effettua un confronto dei dati sulla tipizza-zione dello Staphylococcus aureus resistente alla meticillina (MRSA) in campo umano e veterinario per determinare se gli stessi «tipi» del batterio siano presenti sia nell’essere uma-no che negli animali.
Le prossime edizioni dello Swiss Antibiotic Resistance Re-port si concentreranno ciascuna su un agente patogeno re-sistente differente.
Ringraziamo tutti coloro che hanno collaborato al report e auguriamo una lettura istruttiva!
1 Prefazione
Dr. med. Daniel Koch Dr. med. vet. Joseph SchmidtUfficio federale della sanità pubblica Ufficio federale della sicurezza alimentare e di veterinaria
Prefazione 9


2Summary
12 Summary
Resistance in bacteria of human clinical isolates
Since 2008, different trends have been observed in Gram -positive and Gram-negative bacteria. Methicillin-resistant Staphylococcus aureus (MRSA) rates have continued to de-crease significantly in invasive isolates, mainly in the west-ern part of Switzerland. This trend was also observed in several other European countries, including the neighboring countries Germany, France and Austria. In contrast, MRSA rates are increasing in wound and abscess samples from outpatients. Penicillin resistance in Streptococcus pneumo-niae has also decreased over time. This effect is mainly due to a reduction in the prevalence of more resistant sero-types, due to the introduction of pneumococcal vaccines. Vancomycin resistance in enterococci is still very low, but increasing rates observed during the last months are worri-some.
In contrast, we have observed a steady increase in quinolone resistance and 3rd/4th generation cephalosporin resistance in Escherichia coli and Klebsiella pneumoniae. This increase is observed in most European countries and is consistent with the wide distribution of extended-spectrum-beta-lacta-mase-(ESBL-)producing isolates. During the last two years, this trend seems to have stabilized in Switzerland, as well as in some other European countries. Fortunately, carbapenem resistance still is rare in E. coli and K. pneumoniae. While carbapenem resistance in E. coli is rare in most European countries as well, increasing carbapenem resistance is ob-served in Europe in K. pneumoniae; in 2016 resistance rates above 25 % have even been described in Italy, Greece and Romania. To allow a closer monitoring of the distribution of carbapenemase-producing Enterobacteriaceae, an obliga-tion to report these microorganisms was introduced in Swit-zerland on 1.1.2016.
In Pseudomonas aeruginosa, the increasing resistance rates for piperacillin-tazobactam and ceftazidime peaked in 2015 and have slightly decreased since then, while resistance rates for aminoglycosides are steadily increasing. No signif-icant trends were observed in Acinetobacter spp. and in con-trast to Europe, carbapenemase rates were stable.
Antibiotic consumption in human medicine
In Swiss acute care hospitals, consumption of antibacterial agents for systemic use (ATC group J01) increased by 16 % to 62.2 DDDs (defined daily doses) per 100 bed-days be-tween 2007 and 2017, whereas it was relatively stable when expressed in DDDs per 100 admissions. This discrepancy
can be explained by an increasing number of admissions and a decreasing number of bed-days in hospitals due to shorter length of hospital stay. The most commonly used class of antibiotics was the penicillins (ATC group J01C), followed by the other beta-lactam antibacterials, including cephalospor-ins (ATC group J01D) and quinolones (ATC group J01M).
In outpatient care, the total consumption of antibacterial agents for systemic use (ATC group J01) was 10.7 DDDs per 1,000 inhabitants per day in 2017. The most commonly used class of antibiotics was the penicillins (ATC group J01C), fol-lowed by the macrolides, lincosamides and streptogramins (ATC group J01F), tetracyclines (ATC group J01A) and fluo-roquinolones (ATC group J01MA). The relative consumption of fluoroquinolones and penicillins associated with be-ta-lactamase inhibitors was relatively high in comparison with countries participating in the European Surveillance of Antimicrobial Consumption Network (ESAC-Net).
Resistance in zoonotic bacteria
In poultry, the resistance rate to ciprofloxacin and tetracy-cline in Campylobacter jejuni (C. jejuni) has increased signif-icantly in the last years. From 15 % in 2006, the resistance rate to ciprofloxacin rose to 51.4 % in 2016, and to 40 % for tetracycline. In contrast, resistance to erythromycin (2.9 %) was rarely found. According to the WHO, fluoroquinolones and macrolides are highest-priority critically important anti-microbials in human medicine, because these substance groups represent the treatment of choice for serious forms of campylobacteriosis or salmonellosis in humans.
In fattening pigs, the resistance rate to streptomycin in Cam-pylobacter coli (C. coli) decreased from 2006 to 2012. Sub-sequently, the resistance rate has increased significantly in the last years, up to 81.4 % in 2017. The resistance rates for tetracycline (62.1 %) and ciprofloxacin (50.3 %) did not change significantly between 2015 and 2017.
Salmonella spp. occur only rarely in livestock in Switzerland. Therefore, the risk of Salmonella transmission to humans from food produced with Swiss animals is considered low. Moreover, their resistance rates are constantly low, espe-cially in S. Enteritidis and S. Typhimurium.
Resistance in indicator bacteria in animals
Antimicrobial resistance is generally widespread in entero-cocci and E. coli isolated from livestock in Switzerland.
2 Summary

Summary 13
The enterococcal species E. faecalis and E. faecium isolated from broilers showed opposite trends in resistance rates. Whereas for E. faecalis resistance to ampicillin and tetracy-cline has increased since 2012, the resistance rates of E. faecium isolates decreased within the same period. A com-parable effect was seen with enterococci isolates from veal calves. Vancomycin-resistant enterococci (VRE) have only occasionally been detected in the last years. No VRE have been detected in broilers in 2016, nor in fattening pigs and veal calves in 2017.
High resistance rates to ampicillin (14.2 %–38.7 %), sul-famethoxazole (46.9 %–26.8 %) and tetracycline (13.2 %– 41.2 %) are found in commensal E. coli isolates from broilers, fattening pigs and veal calves. Additionally, high resistance to ciprofloxacin was found in isolates from broilers (37.9 %). Re-sistance to these substances increased in isolates from broil-ers between 2006 and 2012, then clearly decreased until 2014, whereas no decrease could be detected in 2016, ex-cept for tetracycline. In isolates from calves, a decreasing trend for resistance was also observed from 2006 to 2013. However, resistances to tetracycline, sulfamethoxazole and ampicillin increased again until 2014, with a steady state in 2015 and 2017. In fattening pigs, the resistance rates in E. coli isolates showed a steady state or a slightly decreasing trend from 2013 to 2017 for the abovementioned antimicrobials.
ESBL/pAmpC-producing E. coli were detected in 52.4 % of broiler flocks, in 17.6 % of fattening pigs and in 33.2 % of veal calves. The increase of the ESBL/pAmpC prevalence in broilers is ongoing, although on a lower level than in previous years (2014: 41.8 %). In contrast, the ESBL prevalence of fattening pigs (2015: 25.7 %) has decreased and remained on a high level for calves (2015: 37.6 %).No carbapenemase-producing E. coli were found in species of livestock.
In Switzerland, the occurrence of methicillin-resistant S. au-reus (MRSA) in fattening pigs at slaughter has increased constantly since detection of MRSA became part of the monitoring. Starting at 2 % in 2009 and increasing to 20.8 % in 2013, the MRSA prevalence reached 44.0 % in 2017. Moreover, the same trend but on a lower level is seen for MRSA carriage of veal calves. The actual prevalence in 2017 was 8.1 %. The results reported for MRSA confirm that spa type t034 and spa type t011 are becoming widespread in Switzerland’s population of slaughtered pigs. These geno-types belong to the clonal complex CC 398, which is typical-ly livestock-associated (LA-MRSA). LA-MRSA can be trans-mitted between animals and humans. An analysis on MRSA carriage in Swiss inpatients detected two cases of LA-MR-SA carriage (n=163) in Swiss patients.
Resistance in indicator bacteria from meat
In 49.3 % of chicken meat samples, ESBL/pAmpC-producing E. coli have been detected. The prevalence differs markedly between Swiss meat (41.9 %) and meat produced abroad (64.9 %). For both, the overall prevalence has decreased in
the reporting time (2014: Swiss meat 65.5 %; meat from abroad: 85.6 %). Although a decreasing trend has been de-tected, the prevalence of these multidrug-resistant E. coli are still very high, which corresponds to the finding of a high prevalence of ESBL/pAmpC-producing E. coli in broilers.
In contrast, only one ESBL/pAmpC-producing E. coli was de-tected in pork (n=302) and two ESBL/pAmpC-producing E. coli have been found in beef samples (n=299). This differ-ence might be related to the lower prevalence of ESBL/pAm-pC-producing E. coli in Swiss pigs and calves and the distinct slaughtering processes of these animals. No carbapene-mase-producing E. coli were found in fresh meat samples.
MRSA was only detected in considerable amounts in chick-en meat produced abroad (2016: 9.3 %). In 2016, no MRSA was detected in Swiss chicken meat samples (n=205). Moreover, no MRSA was found in Swiss beef (n=299) and only two MRSA cases were detected in Swiss pork (n=301). The latter is of special interest, as the strong increase of MRSA in fattening pigs (prevalence 44.0 %) seemed not to increase the prevalence of MRSA in fresh meat thereof. The data confirmed that food is not regarded as a relevant source of MRSA transmission to humans.
Resistance in bacteria from animal clinical isolates
Monitoring of antimicrobial resistance for relevant patho-gens from diseased livestock and companion animals is im-portant for veterinarians, as it allows them to make appropri-ate therapeutic antibiotic choices, which oftentimes cannot be based on an antibiogram prior to the first treatment. Moreover, these data fill another important gap regarding monitoring of antimicrobial resistance from the One-Health perspective.
Therefore, in 2015, the Federal Food Safety and Veterinary Office (FSVO) launched a pilot project for the monitoring of veterinary pathogens in Switzerland, together with the Swiss national reference laboratory for antibacterial resis-tance, the Center for Zoonoses, Animal Bacterial Diseases and Antimicrobial Resistance (ZOBA).
All strains were isolated from clinical submissions of dis-eased animals analyzed by the ZOBA. Samples from animals with antimicrobial treatment prior to sampling were exclud-ed from this study. In contrast to the monitoring of isolates from healthy slaughter animals, minimal inhibitory concen-tration (MIC) data were interpreted according to clinical breakpoints. Exemplarily, for small-animal medicine, resist-ance data of S. pseudintermedius, isolated from wound in-fections of dogs, and E. coli, isolated from canine urogenital tract infections, are reported. Staphylococcus aureus from bovine mastitis samples and Streptococcus equi subspecies zooepidemicus, derived from purulent infections from horses, completed the data set.
The presence of high levels of resistance to important anti-microbials underlines the need for systematic monitoring of

antimicrobial resistance. Infections in animals caused by multidrug-resistant pathogens must be expected for veteri-nary pathogens. However, the use of critically important antimicrobials cannot be supported by the data presented, as first-line antibiotics with sufficient efficacy are available for the different clinical settings. In the future, this monitor-ing will be even more representative, as isolates from other Swiss laboratories will be included from 2019 onwards.
Sales of antimicrobials in veterinary medicine
The sales volume of antimicrobials continued to decline in 2016 and 2017. Overall, 38 377 kg of antimicrobials were sold for veterinary medicine in 2016 and 32 328 kg in 2017. This amounts to a decline of 53 % (37 tons) since 2008. The decrease is mainly due to a fall in sales of medicated premix-es. The sales rankings of the various classes of antimicrobi-als remained unchanged: sulfonamides are in first place, followed by penicillins and tetracyclines. These three class-es are often sold as medicated premixes. The quantity of antibiotics approved only for pets comprises 2,5 % of the total volume. The sales of the highest-priority critically im-portant antibiotic classes for human medicine decreased in 2016 and 2017; the sales of macrolides have decreased by 25 % in 2016 and another 20 % in 2017. The sales of fluoro-quinolones declined by 21 % in 2016 and by 25 % in 2017. The sales of cephalosporins (3rd/4th generation) decreased by about 23 % in 2016 as well as in 2017. The sales volume of colistin has declined approximately 79 % since 2008. Ex-pressed in correlation to the biomass under exposure, the level is 0.4 mg colistin/PCU for Switzerland. This is below the European average and in line with the requested reduc-tion of colistin to a level of 1 mg/PCU or below for European countries in order to maintain its efficacy in the treatment of severe infections in humans.
Analysis
For the first time in Switzerland, an analysis to compare hu-man and veterinary data on antibiotic use, and an attempt to evaluate associations between use and resistance, was con-ducted in this report. The objective was to analyze the Swiss antibiotic consumption and resistance data in a similar fash-ion as the JIACRA report. However, due to a lack of data and time, only a preliminary analysis was conducted. With im-proved data, more significant analyses will be possible in the upcoming years, focussing on potential associations be-tween use of antibiotics and resistance.
In order to understand the epidemiology of methicillin-re-sistant S. aureus (MRSA) and the risk for the transmission from animals to humans, a study into the molecular charac-teristics of this pathogen was undertaken. Molecular fea-tures of Swiss MRSA strains, isolated from livestock and meat thereof with MRSA isolates from healthy veterinarians and farmers as well as human isolates from Swiss hospitals were compared. With this analysis, useful information on the distribution of hospital-acquired (HA) MRSA, communi-
14 Summary
ty-acquired (CA) MRSA and livestock-associated (LA) MRSA in human and veterinary settings can be provided, helping to obtain insights into transmission risks in Switzerland. Swiss fattening pigs have shown a strong increase in the preva-lence of MRSA carriage over the last ten years. The preva-lence of MRSA in Swiss pork, beef and chicken meat is very low. The detected MRSA belonged to the LA-MRSA type. A study with Swiss veterinarians and farmers revealed that the majority of MRSA from veterinarians and farmers belonged to the LA-MRSA type. This is in line with findings on MRSA isolated from livestock, which also belong to the LA-MRSA type. The vast majority of MRSA isolated from inpatients are HA- and CA-MRSA; however, in two patients a LA-MRSA was detected. Continuous monitoring is needed, including molecular typing of both human and animal MRSA isolates.

Resistenz bei Bakterien aus klinischen Isolaten vom Menschen
Seit 2008 wurden bei grampositiven und gramnegativen Bakterien unterschiedliche Trends beobachtet. Die Zahlen Methicillin-resistenter Staphylococcus aureus (MRSA) ver-zeichneten in invasiven Isolaten weiterhin einen deutlichen Rückgang, vor allem in der Westschweiz. Dieser Trend liess sich auch in einigen anderen europäischen Ländern feststel-len, einschliesslich der Nachbarländer Deutschland, Frank-reich und Österreich. In Wund- und Abszessproben von am-bulanten Patientinnen und Patienten nahmen die MRSA- Raten hingegen zu.
Die Penicillin-Resistenz bei Streptococcus pneumoniae ging im Laufe der Zeit zurück. Der Grund dafür ist wahrscheinlich die Einführung von Pneumokokken-Impfstoffen, die zu einer Abnahme der resistenteren Serotypen führte. Die Vancomy-cin-Resistenz bei Enterokokken ist nach wie vor sehr tief, aber der in den vergangenen Monaten beobachtete Anstieg der Resistenzraten ist besorgniserregend.
Im Gegensatz dazu wurde bei Escherichia coli und Klebsiella pneumoniae eine stete Zunahme der Resistenzraten gegen-über Chinolonen und Cephalosporinen der dritten und vierten Generation festgestellt. Dies ist in den meisten europäischen Ländern zu beobachten und passt zur weiten Verbreitung von Extended-Spectrum-Beta-Laktamase-(ESBL-)produzieren-den Isolaten. In den vergangenen zwei Jahren scheint sich dieser Trend in der Schweiz sowie in gewissen anderen euro-päischen Ländern stabilisiert zu haben. Erfreulicherweise bleibt die Resistenz gegenüber Carbapenemen bei E. coli und K. pneumoniae selten. Während dies bei E. coli auch in den meisten europäischen Ländern so ist, wird in Europa eine zu-nehmende Carbapenem-Resistenz bei K. pneumoniae ver-zeichnet: 2016 wurden in Italien, Griechenland und Rumänien Resistenzraten von über 25 % festgestellt. Um eine enge Überwachung der Verteilung von Carbapenemase-produzie-renden Enterobacteriaceae sicherzustellen, gilt in der Schweiz seit dem 1. Januar 2016 eine Meldepflicht für diese Mikroor-ganismen.
Bei Pseudomonas aeruginosa erreichte die Resistenz ge-genüber Piperacillin-Tazobactam und Ceftazidim 2015 einen Höhepunkt und ist seither leicht rückläufig, während die Re-sistenz gegenüber Aminoglykosiden eine stetige Zunahme verzeichnete. Keine bedeutenden Veränderungen wurden bei Acinetobacter spp. beobachtet und im Gegensatz zu Europa blieben die Carbapenemase-Raten bei diesem Er-reger stabil.
Antibiotikaverbrauch in der Humanmedizin
In den Schweizer Akutspitälern stieg der Verbrauch von Antibiotika zur systemischen Anwendung (ATC-J01) zwi-schen 2007 und 2017 um 16 % auf 62,2 definierte Tages-dosen (Defined Daily Doses, DDD) pro 100 Bettentage an, während der Verbrauch berechnet in DDD pro 100 Einwei-sungen relativ konstant blieb. Diese Diskrepanz lässt sich mit der steigenden Anzahl Einweisungen und der aufgrund der kürzeren Spitalaufenthalte sinkenden Anzahl Bettentage erklären. Die am häufigsten verwendete Antibiotikagruppe waren die Penicilline (ATC-J01C), gefolgt von den anderen Beta-Laktam-Antibiotika, einschliesslich der Cephalospori-ne (ATC-J01D) und der Chinolone (ATC-Gruppe J01M).
In der ambulanten Versorgung belief sich 2017 der Gesamt-verbrauch an Antibiotika zur systemischen Anwendung (ATC-J01) auf 10,7 DDD pro 1000 Einwohnerinnen und Ein-wohner und pro Tag. Die am häufigsten verwendete Antibio-tikagruppe waren die Penicilline (ATC-J01C), gefolgt von den Makroliden, Lincosamiden und Streptograminen (ATC-J01F), den Tetracyclinen (ATC-J01A) und den Fluorochinolonen (ATC-J01MA). Der relative Verbrauch von Fluorochinolonen und Penicillinen in Kombination mit Beta-Laktamase-Inhibito-ren war relativ hoch im Vergleich mit Ländern, die sich am European Surveillance of Antimicrobial Consumption Net-work (ESAC-Net) beteiligen.
Resistenzen bei Zoonose-Erregern
Bei Campylobacter jejuni (C. jejuni) in Geflügel hat die Resis-tenz gegenüber Ciprofloxacin und Tetracyclin in den letzten Jahren signifikant zugenommen. Von 15 % im Jahr 2006 stieg sie bei Ciprofloxacin auf 51,4 % und bei Tetracyclin auf 40 % im Jahr 2016 an. Eine Resistenz gegenüber Erythro-mycin wurde hingegen selten festgestellt (2,9 %). Gemäss der WHO gelten Fluorochinolone und Makrolide als kritische Antibiotika mit höchster Priorität in der Humanmedizin, weil diese Wirkstoffgruppen bei schweren Verlaufsformen der Campylobacteriose oder der Salmonellose beim Menschen bevorzugt zum Einsatz kommen.
Bei Mastschweinen ist die Resistenz bei Campylobacter coli (C. coli) gegenüber Streptomycin zwischen 2006 und 2012 gesunken. Danach stieg die Resistenzrate signifikant an und erreichte im Jahr 2017 81,4 %. Die Resistenz gegenüber Te-tracyclin (62,1 %) und Ciprofloxacin (50,3 %) zeigte zwischen 2015 und 2017 keine grosse Veränderung.
2 Zusammenfassung
Zusammenfassung 15

Salmonella spp. sind bei Schweizer Nutztieren nur selten zu verzeichnen. Aus diesem Grund kann das Risiko einer Über-tragung auf den Menschen von Salmonella über Fleisch von Schweizer Nutztieren als gering betrachtet werden. Zudem werden bei Salmonella, insbesondere bei S. Enteritidis und S. Typhimurium, konstant tiefe Resistenzraten verzeichnet.
Resistenzen bei Indikatorkeimen in Tieren
Bei Enterokokken und E. coli -Isolaten von Nutztieren in der Schweiz sind antimikrobielle Resistenzen im Allgemeinen weit verbreitet.
Die Enterokokkenspezies E. faecalis und E. faecium in Iso-laten von Mastpoulets zeigten bei den Resistenzraten ge-genläufige Trends. Während bei E. faecalis die Resistenz gegenüber Ampicillin und Tetracyclin seit 2012 zugenom-men hat, waren die Resistenzraten bei den E. faecium -Iso-laten im gleichen Zeitraum rückläufig. Eine vergleichbare Entwicklung war bei den Enterokokkenisolaten von Mast-kälbern zu beobachten. Vancomycin-resistente Enterokok-ken (VRE) wurden in den vergangenen Jahren nur vereinzelt nachgewiesen. 2016 wurden bei Mastpoulets und 2017 bei Mastschweinen und Mastkälbern keine VRE entdeckt.
In kommensalen Escherichia coli- Isolaten von Mastpoulets, Mastschweinen und Mastkälbern wurden häufig hohe Re-sistenzen gegenüber Ampicillin (14,2 %–38,7 %), Sulfame-thoxazol (46,9 %–26,8 %) und Tetracyclin (13,2 %–41,2 %) festgestellt. Zudem wurde in E. coli- Isolaten von Mastpou-lets eine hohe Resistenz gegenüber Ciprofloxacin (37,9 %) nachgewiesen. Die Resistenz gegenüber diesen Wirkstof-fen stieg bei Isolaten von Mastpoulets zwischen 2006 und 2012 an, war dann bis 2014 klar rückläufig, während sich im Jahr 2016 lediglich bei Tetracyclin eine Abnahme feststellen liess. In Isolaten von Mastkälbern wurde zwischen 2006 und 2013 ein sinkender Trend beobachtet. Die Resistenz gegenüber Tetracyclin, Sulfamethoxazol und Ampicillin nahm hingegen bis 2014 erneut zu und verblieb 2015 und 2017 auf diesem Niveau. Bei E. coli -Isolaten von Mast-schweinen wies die Resistenzsituation bei den erwähnten mikrobiellen Wirkstoffen zwischen 2013 und 2017 keine Veränderung oder einen leicht sinkenden Trend auf.
In 52,4 % der Mastpouletbestände, in 17,6 % der Mast-schweinbestände und in 33,2 % der Mastkälberbestände wurden ESBL/pAmpC-produzierende E. coli gefunden. Bei den Mastpoulets ist immer noch eine steigende ESBL/pAmpC-Prävalenz festzustellen, wenn auch in schwächerer Form als in den vergangenen Jahren (2014: 41,8 %). Bei den Mastschweinen hingegen war die ESBL/pAmpC-Prävalenz rückläufig (2015: 25,7 %), während sie bei den Mastkälbern auf hohem Niveau blieb (2015: 37,6 %).
Bei Nutztieren wurden keine Carbapenemase-produzieren-den E. coli gefunden.
In der Schweiz stieg das Vorkommen von Methicillin-resis-tenten S. aureus (MRSA) bei Mastschweinen bei der
Schlachtung signifikant an, seit der Nachweis von MRSA Teil der Überwachung wurde. Von anfänglichen 2 % im Jahr 2009 stieg die MRSA-Prävalenz auf 20,8 % im Jahr 2013 und erreichte 2017 schliesslich 44,0 %. Der gleiche Trend, wenn auch auf tieferem Niveau, wurde bei den Mastkälbern beobachtet. Im Jahr 2017 betrug die Prävalenz 8,1 %. Die Resultate bezüglich MRSA bestätigen, dass sich in der Schweizer Schlachtschweinepopulation vor allem der spa Typ t034 und der spa Typ t011 stark ausbreiten. Diese Geno-typen gehören zur klonalen Linie CC398, die zu den soge-nannten nutztierassoziierten MRSA (LA-MRSA) gehört. LA-MRSA können vom Tier auf den Menschen übertragen werden. In einer Analyse auf MRSA-Besiedelung bei statio-nären Schweizer Patientinnen und Patienten wurden zwei Fälle von LA-MRSA-Besiedelung (n=163) nachgewiesen.
Resistenzen bei Indikatorkeimen aus Fleisch
In 49,3 % der Hühnerfleischproben wurden ESBL/pAmpC- produzierende E. coli entdeckt. Die Prävalenz unterscheidet sich stark, je nachdem ob es sich um Schweizer Fleisch (41,9 %) oder um ausländisches Fleisch (64,9 %) handelt. Bei beiden ist die Gesamtprävalenz im Berichtszeitraum zurück-gegangen (2014: Schweizer Fleisch 65,5 %; ausländisches Fleisch: 85,6 %). Trotz des rückläufigen Trends ist die Präva-lenz dieser multiresistenten E. coli nach wie vor sehr hoch, was mit der festgestellten hohen Prävalenz von ESBL/pAmpC-produzierenden E. coli in Mastpoulets überein-stimmt.
Demgegenüber wurden nur in einer Schweinefleischprobe (n=302) und in zwei Rindfleischproben (n=299) ESBL/pAmpC-produzierende E. coli nachgewiesen. Dieser Unter-schied ist möglicherweise auf die tiefere Prävalenz von ESBL/pAmpC-produzierenden E. coli bei Schweizer Schwei-nen und Kälbern sowie auf die unterschiedlichen Schlacht-methoden zurückzuführen. In Frischfleischproben wurden keine Carbapenemase-produzierenden E. coli gefunden.
MRSA wurden in grösseren Mengen nur in ausländischem Hühnerfleisch gefunden (2016: 9,3 %). Im Jahr 2016 wurden in Proben von Schweizer Hühnerfleisch (n=205) keine MRSA nachgewiesen. In Schweizer Rindfleisch (n=299) wurden ebenfalls keine und in Schweizer Schweinefleisch (n=301) nur in zwei Proben MRSA entdeckt. Das zweite Ergebnis ist von besonderem Interesse, da der starke Anstieg von MRSA in Mastschweinen (Prävalenz 44,0 %) anscheinend nicht zu einer Zunahme der MRSA-Prävalenz in Schweinefrisch-fleisch geführt hat. Diese Daten bestätigten, dass Lebens-mittel keine relevante Quelle für eine MRSA-Übertragung auf den Menschen sind.
Resistenz bei Bakterien aus klinischen Isolaten von Tieren
Die Überwachung der Antibiotikaresistenz von relevanten Krankheitserregern bei erkrankten Nutz- und Heimtieren ist für Tierärztinnen und Tierärzte wichtig. Dies ermöglicht ih-
16 Zusammenfassung

nen, eine angemessene therapeutische Wahl der Antibioti-ka zu treffen, bei der oftmals nicht auf ein vor der ersten Behandlung erstelltes Antibiogramm abgestützt werden kann. Zudem wird mit diesen Daten eine weitere grosse Lü-cke in der Überwachung der Antibiotikaresistenz nach dem One-Health-Ansatz geschlossen.
Zu diesem Zweck lancierte das Bundesamt für Lebensmit-telsicherheit und Veterinärwesen (BLV) zusammen mit dem nationalen Referenzlaboratorium für Antibiotikaresistenz, dem Zentrum für Zoonosen, bakterielle Tierkrankheiten und Antibiotikaresistenz (ZOBA), im Jahr 2015 ein Pilotprojekt für die Überwachung von Antibiotikaresistenzen bei tierpa-thogenen Erregern in der Schweiz.
Alle Stämme wurden aus klinischem Material von erkrank-ten Tieren isoliert und vom ZOBA analysiert. Proben von Tieren, die vor der Probenahme eine Antibiotikabehandlung erhalten hatten, wurden aus der Studie ausgeschlossen. Im Gegensatz zur Überwachung von Isolaten von gesunden Schlachttieren, wurden die Daten zur minimalen Hemm-stoffkonzentration (MHK) anhand der klinischen Grenzwerte ausgewertet. In der Kleintiermedizin beispielsweise wurden Resistenzdaten für S. pseudintermedius aus Wundinfektio-nen bei Hunden und für E. coli aus Infektionen des Urogeni-taltraktes bei Katzen erhoben. Staphylococcus aureus aus bovinen Mastitisproben und Streptococcus equi subspecies zooepidemicus aus eitrigen Infektionen bei Pferden vervoll-ständigten den Datensatz.
Die hohe Resistenz gegenüber wichtigen Antibiotika unter-streicht die Notwendigkeit einer systematischen Überwa-chung der Antibiotikaresistenz. Bei Tieren ist mit Infektionen durch multiresistente Erreger zu rechnen. Die Verwendung von kritischen Antibiotika kann jedoch mit den vorliegenden Daten nicht gestützt werden, da für die verschiedenen klini-schen Settings genügend wirksame First-line-Antibiotika verfügbar sind. In Zukunft wird diese Überwachung noch repräsentativer sein, da ab 2019 Isolate von anderen Schwei-zer Laboratorien eingeschlossen werden.
Vertrieb von Antibiotika in der Veterinärmedizin
Die Gesamtmenge der verkauften Antibiotika ging in den Jahren 2016 und 2017 weiter zurück. 2016 wurden insge-samt 38 377 kg und im Jahr 2017 32 328 kg Antibiotika zur Behandlung von Tieren verkauft. Dies entspricht einem Rückgang seit 2008 um 53 % (37 t). Der Rückgang ist haupt-sächlich auf eine Reduktion der Verkäufe von Arzneimittel-vormischungen zurückzuführen. Unverändert blieb die Rei-henfolge der meistverkauften Wirkstoffklassen: An erster Stelle stehen die Sulfonamide, gefolgt von Penicillinen und Tetracyclinen. Diese drei Wirkstoffklassen sind häufig in Arz-neimittelvormischungen enthalten. Der Anteil der Wirkstof-fe, die nur für Heimtiere zugelassen sind, macht 2,5 % der Gesamtmenge aus.
Die Vertriebsmengen der kritischen Antibiotikaklassen mit höchster Priorität für die Humanmedizin waren 2016 und
Zusammenfassung 17
2017 rückläufig. Die Verkäufe der Makrolide gingen 2016 um 25 % und 2017 um weitere 20 % zurück. Bei den Fluorchino-lonen nahmen die Vertriebsmengen 2016 um 21 % und 2017 um 25 % ab. Die Verkäufe der Cephalosporine der dritten und vierten Generation gingen 2016 und 2017 um rund 23 % zurück. Bei Colistin ging das Verkaufsvolumen seit 2008 um rund 79 % zurück. Ausgedrückt in Bezug zur Populationsbio-masse wurde in der Schweiz 0,4 mg Colistin/PCU (Popula-tion Correction Unit) verkauft. Dies liegt unter dem europäi-schen Durchschnitt und entspricht der Forderung nach einer Reduktion von Colistin auf 1 mg/PCU oder weniger in den europäischen Ländern, um die Wirksamkeit bei der Behand-lung von schweren Infektionen beim Menschen zu erhalten.
Analyse
Zum ersten Mal in der Schweiz wurde in diesem Bericht eine Analyse durchgeführt, um human- und veterinärmedi-zinische Daten zum Antibiotikaeinsatz zu vergleichen. Zu-dem wurde versucht, die Zusammenhänge zwischen Ein-satz und Resistenz zu evaluieren. Das Ziel bestand darin, die Schweizer Daten zu Antibiotikaverbrauch und -resistenz in ähnlicher Weise wie im JIACRA-Bericht zu analysieren. Mangels Daten und Zeit erfolgte jedoch nur eine Voranalyse. Mit verbesserten Daten werden in den kommenden Jahren signifikantere Analysen mit Fokus auf den möglichen Zu-sammenhängen zwischen Antibiotikaeinsatz und -resistenz möglich sein.
Um die Epidemiologie Methicillin-resistenter S. aureus (MRSA) und das Risiko der Übertragung vom Tier auf den Menschen zu erfassen, wurde eine Studie über die moleku-laren Merkmale dieses Erregers durchgeführt. Aus Nutztie-ren und deren Fleisch isolierte Schweizer MRSA-Stämme wurden bezüglich molekularer Eigenschaften mit MRSA-Iso-laten gesunder Tierärzte und Landwirte sowie mit mensch-lichen Isolaten aus Schweizer Spitälern verglichen. Diese Analyse kann nützliche Informationen zur Verbreitung von im Spital erworbenen MRSA (HA-MRSA), ambulant erwor-benen MRSA (CA-MRSA) und nutztierassoziierten MRSA (LA-MRSA) in human- und veterinärmedizinischen Settings liefern und dazu beitragen, Erkenntnisse zu den Übertra-gungsrisiken in der Schweiz zu gewinnen. Schweizer Mast-schweine zeigten eine starke Zunahme bei der Prävalenz der MRSA-Besiedelung über die letzten zehn Jahre. Die MRSA-Prävalenz bei Schweizer Schweine-, Rind- und Hüh-nerfleisch ist sehr tief. Die nachgewiesenen MRSA gehören zum Typ LA-MRSA. Eine Studie mit Schweizer Tierärzten und Landwirten ergab, dass die Mehrheit der MRSA bei Tierärzten und Landwirten ebenfalls vom Typ LA-MRSA ist. Das stimmt mit den Ergebnissen bei den aus Nutztieren iso-lierten MRSA überein, die auch zum Typ LA-MRSA gehören. Die grosse Mehrheit der aus stationären Patientinnen und Patienten isolierten MRSA sind HA- und CA-MRSA. Bei zwei Patienten wurden jedoch LA-MRSA nachgewiesen. Es ist ein kontinuierliches Monitoring erforderlich, das die mo-lekulare Typisierung menschlicher wie auch tierischer MRSA-Isolate beinhaltet.

18 Synthèse
Résistance des bactéries dans les isolats cliniques chez l’être humain
Depuis 2008, des tendances différentes se dessinent chez les bactéries à Gram positif et chez les bactéries à Gram négatif : les taux de résistance à la méticilline de Staphy-lococcus aureus (SARM) dans les isolats invasifs ont nette-ment reculé, en particulier en Suisse romande. Cette ten-dance a également pu être observée dans différents pays européens, comme les pays limitrophes que sont l’Alle-magne, la France et l’Autriche. En revanche, les taux de SARM sont en augmentation dans les échantillons prélevés sur des plaies et des abcès de patients recevant des soins ambulatoires. La résistance à la pénicilline de Streptococcus pneumoniae a également diminué au fil du temps, probable-ment grâce à l’introduction de vaccins contre les infections invasives à pneumocoques, qui ont pu provoquer un recul des sérotypes les plus résistants. Chez les entérocoques, les taux de résistance à la vancomycine restent très faibles, toutefois leur progression au cours de ces derniers mois est préoccupante.
En revanche, la résistance aux quinolones et aux céphalos-porines de troisième et quatrième génération croît de façon régulière chez Escherichia coli (E. coli) et Klebsiella pneumo-niae (K. pneumoniae). Cette évolution a pu être observée dans la plupart des pays européens et coïncide avec la large distribution des isolats producteurs de bêta-lactamases à spectre élargi (BLSE) ; cette tendance semble s’être stabili-sée au cours des deux dernières années en Suisse comme dans d’autres pays européens. Heureusement, la résistance aux carbapénèmes est encore rare chez E. coli et K. pneu-moniae. Dans la majorité des pays européens, on observe toutefois une résistance aux carbapénèmes croissante chez K. pneumoniae, alors que la résistance chez E. coli reste rare ; en 2016, des taux de résistance dépassant les 25 % ont été décrits en Italie, en Grèce et en Roumanie. Afin d’assu-rer une surveillance accrue de la distribution d’entérobacté-ries productrices de carbapénèmases (EPC), une obligation de déclaration de ces micro-organismes est entrée en vi-gueur au 1er janvier 2016 en Suisse.
Chez Pseudomonas aeruginosa, les fortes progressions dans les taux de résistance pour la pipéracilline-tazobactam et la ceftazidime ont connu un pic en 2015 et ont légèrement reculé depuis, alors que les taux de résistance pour les ami-noglycosides sont en constante progression. Aucune ten-dance particulière n’a été observée chez Acinetobacter spp. et les taux de résistance pour les carbapénèmases sont stables contrairement à ceux des autres pays européens.
Consommation d’antibiotiques en médecine humaine
Dans les hôpitaux suisses de soins aigus, la consommation de médicaments antibactériens à usage systémique (classe ATC J01) pour 100 journées d’hospitalisation a crû de 16 % à 62,2 DDD (Defined Daily Doses) entre 2007 et 2017. Elle est en revanche restée relativement stable lorsqu’exprimée en DDD pour 100 admissions : cette différence résulte d’une augmentation du nombre d’admissions accompagnée d’une diminution du nombre de journées d’hospitalisation due à une réduction de la durée des séjours à l’hôpital. La classe des antibiotiques les plus fréquemment utilisés était celle des pénicillines (classe ATC J01C), suivie des autres bétalac-tamines qui comprennent notamment les céphalosporines (classe ATC J01D), et des quinolones (classe ATC J01M).
En milieu ambulatoire, la consommation totale d’antibacté-riens à usage systémique (classe ATC J01) était de 10.7 DDD pour 1 000 habitants et par jour en 2017. La classe des antibio-tiques les plus fréquemment utilisés était celle des pénicil-lines (classe ATC J01C), suivie des macrolides, lincosamides et streptogramines (classe ATC J01F), tétracyclines (classe ATC J01A) et fluoroquinolones (classe ATC J01MA). La consommation relative de fluoquinolones et de pénicillines incluant des inhibiteurs de bêta-lactamases était relativement élevée par rapport à celle des pays membres du Réseau eu-ropéen de surveillance de la consommation d’antimicrobiens (ESAC-Net).
Résistance des bactéries zoonotiques
Concernant la volaille, la résistance de Campylobacter jeju-ni (C. jejuni) à la ciprofloxacine et à la tétracycline a augmen-té de manière significative ces dernières années. De 15 % en 2006, le taux de résistance à la ciprofloxacine est passé à 51,4 % en 2016, la résistance à la tétracycline atteignant 40 %. En revanche, la résistance à l’érythromycine (2,9 %) n’a été que rarement constatée. Selon l’OMS, les fluoro-quinolones et les macrolides appartiennent à la catégorie des antimicrobiens critiques de première priorité dans la médecine humaine, ces groupes de principes actifs consti-tuant le traitement de choix en cas de forme sévère de campylobactériose ou de salmonellose chez l’homme.
Chez les porcs d’engraissement, le taux de résistance à la streptomycine des souches de Campylobacter coli (C. coli) a baissé entre 2006 et 2012. Ce taux a connu une forte crois-sance ces dernières années, atteignant 81,4 % en 2017. Les
2 Synthèse

Synthèse 19
résistances à la tétracycline (62,1 %) et à la ciprofloxacine (50,3 %) sont restées quant à elles relativement stables entre 2015 et 2017.
En Suisse, les Salmonella spp. sont rares chez les animaux de rente. Aussi le risque de transmission de salmonelles à l’homme à partir d’aliments produits avec de la viande suisse est-il considéré comme faible. De plus, leurs taux de résis-tance restent bas, en particulier chez S. Enteritidis et S. Ty-phimurium.
Résistance des germes indicateurs chez les animaux
En Suisse, la résistance antimicrobienne est généralement répandue chez les entérocoques et E. coli isolés à partir d’animaux de rente.
Les entérocoques E. faecalis et E. faecium isolés à partir de poulets de chair ont montré une tendance inverse : tandis que la résistance d’E. faecalis à l’ampicilline et à la tétracy-cline augmente depuis 2012, les taux de résistance dans les isolats d’E. faecalis ont diminué dans la même période. Un phénomène analogue a été observé avec des isolats d’enté-rocoques prélevés chez les veaux d’engraissement. Ces dernières années, des entérocoques résistants à la van-comycine (ERV) n’ont été détectés qu’occasionnellement. Aucun ERV n’a été décelé chez les poulets de chair en 2016, ni chez les porcs et les veaux d’engraissement en 2017.
On observe des taux élevés de résistance à l’ampicilline (14,2 % à 38,7 %), au sulfaméthoxazole (46,9 % à 26,8 %) et à la tétracycline (13,2 % à 41,2 %) en flore commensale dans des isolats d’E. coli chez les poulets de chair, les porcs et les veaux d’engraissement. De plus, une résistance élevée à la ciprofloxacine a été découverte dans des isolats prélevés chez des poulets de chair (37,9 %). Les résistances à ces substances ont augmenté dans les isolats provenant de pou-lets de chair entre 2006 et 2012, avant de diminuer sensible-ment jusqu’en 2014 ; ce recul n’a pas été observé en 2016 si ce n’est pour la tétracycline. Dans les isolats prélevés chez les veaux d’engraissement, une tendance à une diminution des résistances a été observée entre 2006 et 2013. Toute-fois, les résistances à la tétracycline, au sulfaméthoxazole et à l’ampicilline ont à nouveau augmenté jusqu’en 2014 pour se stabiliser en 2015 et 2017. De 2013 à 2017, les taux de résistance aux antibiotiques mentionnés ci-dessus dans les isolats d’E. coli provenant de porcs d’engraissement étaient plutôt stables ou en léger recul.
Des E. coli producteurs de BLSE/AmpC ont été identifiés dans 52,4 % des cheptels de poulets de chair examinés, 17,6 % de ceux de porcs d’engraissement et 33,2 % de ceux de veaux d’engraissement. La prévalence de BLSE/AmpC chez les poulets de chair ne cesse de croître, même si cette croissance est moins forte qu’au cours des années précé-dentes (41,8 % en 2014). En revanche, la prévalence de BLSE chez les porcs d’engraissement (25,7 % en 2015) a diminué ; elle est restée élevée chez les veaux (37,6 % en 2015).
Aucun E. coli producteur de carbapénémases n’a été identi-fié chez les animaux de rente.
En Suisse, la prévalence des Staphylococcus aureus résis-tants à la méticilline (SARM) chez les porcs d’engraisse-ment au moment de l’abattage progresse constamment depuis que sa détection fait partie intégrante des mesures de surveillance. La prévalence des SARM est passée de 2 % en 2009 à 20,8 % en 2013 pour atteindre 44 % en 2017. La même tendance a été observée dans une moindre me-sure chez les veaux d’engraissement. En 2017, la préva-lence effective était de 8,1 %. Les résultats pour les SARM confirment en particulier que les types spa t034 et spa t011 sont en passe de s’étendre largement dans les cheptels de porcs d’abattage. Ces génotypes font partie d’un certain complexe clonal CC 398, typiquement associés aux ani-maux de rente. Les SARM associés aux animaux de rente (live stock-associated, LA-MRSA) peuvent se transmettre de l’animal à l’homme. Une étude relative aux porteurs de SARM parmi les patients hospitalisés en Suisse a révélé deux cas (n=163).
Résistance des germes indicateurs dans la viande
Des E. coli producteurs de BLSE/AmpC ont été découverts dans 49,3 % des échantillons de viande de poulet. La préva-lence est sensiblement différente selon qu’il s’agit de viande suisse (41,9 %) ou de viande d’importation (64,9 %). On ob-serve toutefois une diminution globale de la prévalence dans ces deux types de viande dans la période sous revue (65,5 % pour la viande suisse et 85,6 % pour la viande importée en 2014). Bien qu’une tendance à la baisse ait été observée, la prévalence de ces E. coli multirésistants reste très élevée et liée à une forte prévalence d’E. coli producteurs de BLSE/AmpC chez les poulets de chair.
En revanche, l’E. coli producteur de BLSE/AmpC a été iden-tifié dans un seul échantillon de porc (n=302) et deux de bœuf (n=299). Cet écart peut s’expliquer par la prévalence plus basse de cette bactérie chez les porcs et les veaux suisses et la différence dans les méthodes d’abattage. Au-cun E. coli producteur de carbapénémases n’a été identifié dans les échantillons de viande fraîche.
Des SARM ont été trouvés en grande quantité uniquement dans la viande de poulets d’origine étrangère (9,3 % en 2016). En 2016, aucun SARM n’a été identifié dans les échantillons de viande de poulets élevés en Suisse (n=205), ni dans la viande de bœufs suisses (n=299) et seulement deux cas ont été observés dans la viande de porcs suisses (n=301). Ce dernier résultat est particulièrement intéressant car il montre que malgré la forte augmentation de SARM identifiés chez les porcs d’engraissement (prévalence de 44,0 %), leur prévalence dans la viande fraîche semble ne pas avoir progressé. Ces données confirment que l’alimen-tation n’est pas considérée comme une source pertinente de transmission des SARM à l’homme.

Résistance des bactéries dans les isolats cliniques chez l’animal
La surveillance de l’antibiorésistance des agents patho-gènes d’importance clinique sur le cheptel malade et les animaux de compagnie est particulièrement utile aux vété-rinaires dans leur choix de l’antibiothérapie la plus appro-priée, ceux-ci ne pouvant généralement pas s’appuyer sur un antibiogramme préalable au premier traitement. Ces données comblent en outre une autre lacune importante dans la surveillance de l’antibiorésistance selon l’approche One Health.
Aussi, en 2015, l’Office fédéral de la sécurité alimentaire et des affaires vétérinaires (OSAV) a-t-il lancé un projet pilote de surveillance des agents pathogènes animaux en Suisse, conjointement avec le Centre des zoonoses, des maladies animales d’origine bactérienne et de l’antibiorésistance (ZOBA), laboratoire de référence en matière de résistance aux antimicrobiens en Suisse.
Toutes les souches proviennent d’isolats cliniques prélevés chez des animaux malades examinés par le ZOBA. Les échantillons provenant d’animaux auxquels un traitement antimicrobien avait été administré avant le prélèvement ont été exclus de l’étude. À la différence de la surveillance d’iso-lats d’animaux abattus en bonne santé, les données rela-tives à la concentration minimale inhibitrice (CMI) ont été interprétées en fonction de valeurs cliniques limites. Par exemple, en médecine des petits animaux, des données sont recueillies sur la résistance des S. pseudintermedius isolés à partir de plaies infectées chez des chiens, et des E. coli isolés à partir d’infections des voies urogénitales ca-nines. L’ensemble des données a été complété par celles concernant des Staphylococcus aureus trouvés sur des échantillons de mammite bovine et des zooepidemicus, sous-espèces des Streptococcus equi, provenant d’infec-tions purulentes chez des chevaux.
Le haut niveau de résistance à des antimicrobiens impor-tants souligne la nécessité d’assurer une surveillance systé-matique. Il faut s’attendre de plus en plus à ce que des agents pathogènes multirésistants provoquent des infec-tions chez des animaux. Toutefois, les données présentées ne justifient pas l’usage d’agents antimicrobiens d’impor-tance critique, des antibiotiques de première intention suffi-samment efficaces pour traiter les différents cas cliniques étant disponibles. Cette surveillance sera encore plus repré-sentative à l’avenir puisqu’à partir de 2019, elle portera éga-lement sur les isolats d’autres laboratoires suisses.
Vente d’antibiotiques utilisés en médecine vétéri-naire
Les ventes d’antibiotiques à usage vétérinaire ont continué à diminuer en 2016 et 2017. Globalement, 38 377 kg de mé-dicaments de ce type ont été vendus en 2016 et 32 328 kg en 2017, soit une baisse atteignant 53 % (37 tonnes) depuis
20 Synthèse
2008. Ce recul est principalement dû à une baisse des ventes des prémélanges pour aliments médicamenteux.
Le classement des ventes d’antimicrobiens reste inchangé : les sulfonamides sont en tête, suivis des pénicillines et des tétracyclines. Ces trois classes sont souvent vendues sous forme de prémélanges pour aliments médicamenteux. La part des antibiotiques autorisés uniquement pour les ani-maux s’élève à 2,5 % de la quantité totale.
Les ventes d’antimicrobiens critiques de première priorité en médecine humaine ont diminué en 2016 et 2017 ; les ventes de macrolides ont baissé de 25 % en 2016 et de 20 % supplémentaires en 2017. Les ventes de fluoroquino-lones ont chuté de 21 % en 2016 et de 25 % en 2017. Celles de céphalosporines de troisième et quatrième génération ont diminué d’environ 23 % en 2016 et dans la même pro-portion en 2017. Les ventes de colistine ont baissé d’environ 79 % depuis 2008. Exprimées en corrélation avec la bio-masse analysée, les ventes de colistine atteignent 0,4 mg/PCU (population correction unit) en Suisse. Ces quantités sont inférieures à la moyenne européenne et répondent à l’exigence de l’Union européenne (UE) de réduire la colistine à 1 mg/PCU maximum pour maintenir l’efficacité du traite-ment d’infections graves chez l’être humain.
Analyses
L’étude présentée dans ce rapport est la première du genre en Suisse. Elle vise à comparer les données humaines et animales de l’utilisation des antibiotiques, et tente d’évaluer les liens entre l’administration de ces médicaments et l’an-tiobiorésistance. L’objectif est d’examiner les informations relatives à la consommation et aux résistances en Suisse comme le fait le rapport JIACRA dans l’Union européenne. Toutefois, par manque de temps et de données, seule une analyse préliminaire a été menée. Dans les années à venir, lorsque des informations plus solides seront disponibles, il sera possible d’effectuer des recherches plus significatives, et de se concentrer sur les potentielles relations entre l’utili-sation des antibiotiques et les résistances observées.
Une étude des caractéristiques moléculaires du Staphy-lococcus aureus résistant à la méticilline (SARM) a été entre-prise dans le but de comprendre l’épidémiologie de cette bactérie et le risque qu’elle se transmette des animaux aux êtres humains. Cette analyse a permis de comparer les ca-ractéristiques moléculaires de souches prélevées sur du bétail et de la viande avec celles de souches provenant d’iso-lats humains, constitués à partir de vétérinaires et de fer-miers en bonne santé ainsi que de patients d’hôpitaux suisses. L’étude fournit des informations utiles à propos de la dissémination des SARM nosocomiales (HA-SARM), d’origine communautaire (CA-SARM) et associées au bétail (LA SARM) dans les contextes humain et vétérinaire. Elle nous aide ainsi à mieux évaluer les risques de transmission en Suisse. Dans notre pays, la prévalence du portage de SARM a connu une forte augmentation chez les porcs à l’en-

Sintesi 21
grais au cours des dix dernières années. La prévalence dans la viande suisse de porc, de bœuf et de poulet est très basse. Les souches détectées appartiennent au type LA-SARM. Une étude réalisée avec des vétérinaires et des fer-miers avait révélé que la majorité des SARM provenant de ces personnes était de type LA ; ce constat corrobore les résultats obtenus à propos de souches prélevées sur du bé-tail, qui sont du même type. La grande majorité des SARM provenant de patients hospitalisés sont de type HA ou CA ; cependant, une souche de type LA a été détectée chez deux d’entre eux. Il est donc nécessaire d’assurer une surveil-lance continue et d’effectuer un typage moléculaire d’isolats de SARM à la fois chez les humains et chez les animaux.

22 Sintesi
Resistenza nei batteri presenti in isolati clinici umani
Diverse sono le tendenze osservate a livello di batteri gram-positivi e gram-negativi a partire dal 2008. I tassi di Staphylococcus aureus resistente alla meticillina (MRSA) hanno continuato a diminuire notevolmente negli isolati inva-sivi, perlopiù nella parte occidentale della Svizzera. La stessa tendenza è stata osservata in numerosi altri Paesi europei, incluse la Germania, la Francia e l’Austria. Per contro, i tassi di MRSA sono in aumento nei campioni prelevati da ferite e ascessi di pazienti ambulatoriali. È diminuita nel corso del tempo anche la resistenza alla penicillina in Streptococcus pneumoniae, perlopiù a seguito di una riduzione nella preva-lenza di sierotipi più resistenti, dovuta all’introduzione di vac-cini antipneumococchi. La resistenza degli enterococchi alla vancomicina è ancora molto bassa, ma sono stati osservati tassi di incremento preoccupanti negli ultimi mesi.
È stato invece riscontrato un costante aumento della resi-stenza al chinolone e alle cefalosporine di terza e quarta ge-nerazione in Escherichia coli e Klebsiella pneumoniae. Lo stesso incremento è stato osservato nella maggior parte dei Paesi europei ed è in linea con l’ampia distribuzione di isola-ti produttori di beta-lattamasi a spettro esteso (ESBL). Negli ultimi due anni questa tendenza sembra essersi stabilizzata in Svizzera e in altri Paesi europei. In E. coli e K. pneumoniae è fortunatamente ancora rara la resistenza ai carbapenemi. Mentre però la resistenza in E. coli è rara anche nella mag-gior parte dei Paesi europei, una crescente resistenza ai car-bapenemi si osserva in Europa per K. pneumoniae; nel 2016 tassi di resistenza superiori al 25 per cento sono stati ripor-tati in Italia, Grecia e Romania. Per consentire un monitorag-gio più preciso della distribuzione delle enterobatteriacee produttrici di carbapenemasi, il 1° gennaio 2016 è stato intro-dotto in Svizzera l’obbligo di notifica di questi microrganismi.
In Pseudomonas aeruginosa l’aumento dei tassi di resisten-za alla piperacillina-tazobactam e alla ceftazidima ha raggiun-to un picco nel 2015 e da allora è leggermente diminuito, mentre i tassi di resistenza agli amminoglucosidi sono in costante aumento. Nessun cambiamento rilevante si segna-la invece in Acinetobacter spp. A differenza che in Europa, i tassi di carbapenemasi sono rimasti stabili.
Consumo di antibiotici nella medicina umana
Tra il 2007 e il 2017, il consumo di antibiotici ad uso sistemico (gruppo ATC J01) negli ospedali svizzeri per cure acute è aumentato del 16 per cento a 62,2 dosi definite giornaliere
(DDD, Defined Daily Doses) per 100 giorni di degenza, men-tre è rimasto relativamente stabile se espresso in DDD per 100 ricoveri. Tale discrepanza può essere spiegata da un tendenziale aumento del numero di ricoveri e una riduzione del numero di giorni di degenza, dovuta a una minore durata del soggiorno in ospedale. La classe di antibiotici più comu-nemente usata è stata quella delle penicilline (gruppo ATC J01C), seguita dagli altri antibatterici beta-lattamici, compre-si le cefalosporine (gruppo ATC J01D) e i chinoloni (gruppo ATC J01M).
Nell’ambito delle cure ambulatoriali, nel 2017 il consumo to-tale di antibiotici ad uso sistemico (gruppo ATC J01) è stato di 10,7 DDD al giorno ogni 1000 abitanti. La classe di antibio-tici più comunemente usata è stata quella delle penicilline (gruppo ATC J01C), seguita da macrolidi, lincosamidi e strep-togramine (gruppo ATC J01F), tetracicline (gruppo ATC J01A) e fluorochinoloni (gruppo ATC J01MA). Il consumo relativo di fluorochinoloni e penicilline associati ad inibitori della beta-lattamasi è risultato comparativamente alto ri-spetto a quello dei Paesi che partecipano alla Rete europea di sorveglianza del consumo di antimicrobici (ESAC-Net).
Resistenza nei batteri zoonotici
Nel pollame, il tasso di resistenza alla ciprofloxacina e alla tetraciclina di Campylobacter jejuni (C. jejuni ) è aumentato significativamente negli ultimi anni, passando dal 15 per cen-to nel 2006 al 51,4 per cento nel 2016 per la ciprofloxacina e al 40 per cento per la tetraciclina. È invece stata rilevata rara-mente una resistenza all’eritromicina (2,9 %). L’Organizzazio-ne mondiale della sanità (OMS) considera i fluorochinoloni e i macrolidi degli antibiotici critici di massima priorità nella medicina umana, poiché questi gruppi di principi attivi costi-tuiscono la terapia elettiva di gravi forme di campilobatterio-si o salmonellosi nell’uomo.
Nei suini da ingrasso, il tasso di resistenza alla streptomicina di Campylobacter coli (C. coli) è diminuito tra il 2006 e il 2012, per poi aumentare significativamente negli ultimi anni fino a toccare l’81,4 per cento nel 2017. I tassi di resistenza alla tetraciclina (62,1 %) e alla ciprofloxacina (50,3 %) non sono cambiati significativamente tra il 2015 e il 2017.
La Salmonella spp. è presente solo raramente negli animali da reddito in Svizzera. Il rischio di una sua trasmissione all’uomo tramite alimenti prodotti a partire da animali svizze-ri è dunque considerato basso. Inoltre presenta tassi di resi-stenza costantemente bassi, specie nel caso di S. enteritidis e S. typhimurium.
2 Sintesi

Resistenza nei batteri indicatori negli animali
In generale l’antibiotico-resistenza è ampiamente diffusa negli enterococchi e nell’E. coli isolati da animali da reddito allevati in Svizzera.
I tassi di resistenza delle specie di enterococchi E. faecalis ed E. faecium isolate dai polli da carne presentano tendenze opposte. Mentre per E. faecalis la resistenza alla tetraciclina e all’ampicillina è aumentata dal 2012, nello stesso periodo i tassi di resistenza degli isolati di E. faecium sono diminuiti. Un effetto comparabile è stato osservato negli enterococchi isolati dai vitelli da carne, nei quali gli enterococchi resistenti alla vancomicina (VRE) sono stati rilevati soltanto sporadica-mente negli ultimi anni. Nel 2016 non sono stati rilevati VRE nei polli da carne, né nei suini da ingrasso e nei vitelli da carne nel 2017.
Sono stati riscontrati tassi elevati di resistenza all’ampicillina (14,2 %-38,7 %), al sulfametoxazolo (46,9 %-26,8 %) e alla tetraciclina (13,2 %-41,2 %) negli isolati di E. coli commensa-le provenienti da polli da carne, suini da ingrasso e vitelli da carne. Inoltre, è stata riscontrata un’elevata resistenza alla ciprofloxacina negli isolati provenienti da polli da carne (37,9 %). In questi ultimi, la resistenza a questi principi attivi è aumentata dal 2006 al 2012, poi è nettamente diminuita fino al 2014, mentre per il 2016 non è stato riscontrato alcun decremento, fatta eccezione per le tetracicline. Dal 2006 al 2013 è stata osservata una tendenza alla diminuzione della resistenza negli isolati provenienti da vitelli, ma le resistenze alla tetraciclina, al sulfametoxazolo e all’ampicillina sono nuo-vamente aumentate fino al 2014, stabilizzandosi dal 2015 al 2017. Nei suini da ingrasso, i tassi di resistenza ai succitati antibiotici negli isolati di E. coli sono stabili o in leggera dimi-nuzione dal 2013 al 2017.
Dei ceppi di E. coli produttori di ESBL/pAmpC sono stati ri-levati nel 52,4 per cento dei gruppi di polli da carne, nel 17,6 per cento dei suini da ingrasso e nel 33,2 per cento dei vitel-li da carne. Nei polli da carne, l’aumento della prevalenza di ESBL/pAmpC prosegue, anche se a un livello inferiore a quello degli anni precedenti (2014: 41,8 %). La prevalenza di ESBL è invece diminuita nei suini da ingrasso (2015: 25,7 %) ed è rimasta elevata per i vitelli (2015: 37,6 %).
In nessuna specie di animali da reddito sono stati trovati E. coli produttori di carbapenemasi.
In Svizzera, la presenza di S. aureus resistente alla meticillina (MRSA) nei suini da ingrasso alla macellazione è significati-vamente aumentata da quando l’MRSA è entrato a far parte del monitoraggio. Dal 2 per cento del 2009, la prevalenza è passata al 20,8 per cento nel 2013 e ha toccato il 44,0 per cento nel 2017. La stessa tendenza, seppur a un livello infe-riore, si riscontra per la presenza di MRSA nei vitelli da carne. L’effettiva prevalenza nel 2017 è stata dell’8,1 per cento. I risultati riportati per l’MRSA confermano che lo spa tipo t034 e lo spa tipo t011 si stanno diffondendo nella popolazio-ne svizzera di suini macellati. Entrambi questi genotipi appar-
tengono al complesso clonale CC 398, tipicamente associa-to agli animali da reddito (LA-MRSA). Il batterio LA-MRSA può essere trasmesso dagli animali all’uomo. Un’analisi del-la presenza dell’MRSA nei pazienti ricoverati in Svizzera ha rivelato due casi di pazienti svizzeri portatori di LA-MRSA (n=163).
Resistenza nei batteri indicatori presenti nella carne
Nel 49,3 per cento dei campioni di carne di pollo sono stati riscontrati E. coli produttori di ESBL/pAmpC. La prevalenza varia notevolmente tra la carne svizzera (41,9 %) e quella pro-dotta all’estero (64,9 %). Per entrambe, la prevalenza com-plessiva è diminuita nel periodo oggetto del rapporto (2014: carne svizzera 65,5 %; carne dall’estero: 85,6 %). Nonostan-te sia stata rilevata una tendenza alla diminuzione, la preva-lenza di E. coli multiresistenti è tuttora molto alta e corri-sponde all’elevata prevalenza di E. coli produttori di ESBL/pAmpC nei polli da carne.
Per contro, si è registrata una sola occorrenza di E. coli pro-duttori di ESBL/pAmpC nella carne di maiale (n=302); altre due sono state riscontrate in campioni di carne bovina (n=299). La differenza potrebbe essere correlata alla minore prevalenza di questi batteri nei maiali e nei vitelli svizzeri e ai processi di macellazione distinti di questi animali. Non sono stati trovati E. coli produttori di carbapenemasi nei campioni di carne fresca.
L’MRSA è stato rilevato in quantità notevoli soltanto nella carne di pollo prodotta all’estero (2016: 9,3 %). Nel 2016 non è stata riscontrata alcuna contaminazione da MRSA nei cam-pioni di carne di pollo svizzera (n=205), né nella carne di manzo svizzera (n=299) e sono stati segnalati soltanto due casi di MRSA nella carne di maiale di produzione nazionale (n=301). Quest’ultimo dato è particolarmente interessante poiché il forte incremento dell’MRSA nei suini da ingrasso (prevalenza 44,0 %) non sembra averne aumentato la preva-lenza nella carne suina fresca. I dati confermano che il cibo non è da considerarsi una fonte rilevante di trasmissione dell’MRSA all’uomo.
Resistenza nei batteri da isolati clinici di animali
Il monitoraggio della resistenza agli antimicrobici nei germi patogeni rilevanti provenienti da animali da reddito o da compagnia ammalati è importante per i veterinari perché consente loro di scegliere gli antibiotici più appropriati per la terapia, dato che spesso non è possibile effettuare un anti-biogramma prima di iniziarla. Inoltre, questi dati colmano un’altra importante lacuna nel monitoraggio della resistenza agli antimicrobici dal punto di vista One Health.
Pertanto, nel 2015 l’Ufficio federale della sicurezza alimen-tare e di veterinaria (USAV) ha lanciato un progetto pilota per il monitoraggio degli agenti patogeni veterinari in Svizzera, in collaborazione con il laboratorio di riferimento nazionale per
Sintesi 23

24 Sintesi
il riconoscimento precoce di nuove forme di resistenza agli antibiotici e con il Centro per le zoonosi, le malattie animali di origine batterica e la resistenza agli antibiotici (ZOBA).
Tutti i ceppi sono stati isolati da campioni clinici di animali malati analizzati dallo ZOBA. Sono stati esclusi dallo studio i campioni provenienti da animali già in terapia antibiotica pri-ma del prelievo del campione. A differenza di quanto avviene nel monitoraggio degli isolati di animali da macello sani, i dati della concentrazione minima inibitoria (MIC) sono stati inter-pretati in base a breakpoint clinici. Sono riportati, a titolo di esempio per la medicina dei piccoli animali, i dati sulla resi-stenza di S. pseudintermedius isolato dalle infezioni di ferite del cane e di E. coli isolato dalle infezioni del tratto urogeni-tale del cane. Completano la raccolta di dati lo Staphylococ-cus aureus da campioni di mastite bovina e lo Streptococcus equi sub species zooepidemicus derivato dalle infezioni purulente del cavallo.
La presenza di livelli di resistenza elevati ad antibiotici impor-tanti sottolinea la necessità di un monitoraggio sistematico. Negli animali ci si deve attendere delle infezioni causate da agenti patogeni veterinari multiresistenti. Questi dati non devono tuttavia incoraggiare il ricorso agli antimicrobici di importanza critica, dato che esistono antibiotici di prima scelta sufficientemente efficaci per i diversi quadri clinici. L’inclusione di isolati da altri laboratori svizzeri a parti-re dal 2019 renderà questo monitoraggio ancora più rappre-sentativo.
Vendite di antibiotici nella medicina veterinaria
Nel 2016 e nel 2017, il volume di vendita degli antimicrobici ha continuato a diminuire. Complessivamente, nel settore della medicina veterinaria sono stati venduti 38 377 kg di an-timicrobici nel 2016 e 32 328 kg nel 2017, con un calo del 53 per cento (37 tonnellate) dal 2008, dovuto prevalentemente a una diminuzione delle vendite di premiscele medicate. La classifica di vendita delle diverse classi di antibiotici è rima-sta invariata: i sulfamidici sono al primo posto, seguiti da penicilline e tetracicline. Queste tre classi sono spesso ven-dute come premiscele medicate. La quantità di antibiotici omologati unicamente per gli animali da compagnia costi-tuisce il 2,5 per cento del volume totale. Nel 2016 e nel 2017, le vendite di classi di antibiotici critici di massima priorità per la medicina umana sono diminuite; quelle dei macrolidi han-no subìto una contrazione del 25 per cento nel 2016 e di un altro 20 per cento nel 2017. Le vendite di fluorichinoloni sono scese del 21 per cento nel 2016 e del 25 per cento nel 2017, quelle di cefalosporine di terza e quarta generazione del 23 per cento circa nel 2016 e nel 2017. Il volume di vendita della colistina è diminuito approssimativamente del 79 per cento dal 2008. Espresso in correlazione alla biomassa esposta, il livello per la Svizzera è di 0,4 mg/PCU di colistina, inferiore alla media europea e in linea con la richiesta di riduzione della colistina a un livello pari o inferiore a 1 mg/PCU per i Paesi europei, in modo da preservarne l’efficacia nel tratta-mento di gravi infezioni nell’uomo.
Analisi
Questo rapporto è il primo in Svizzera a effettuare un’analisi che confronta i dati sull’uso di antibiotici nei settori umano e veterinario e a cercare di valutare le correlazioni tra uso e resistenza. Lo scopo era quello di analizzare i dati sul consu-mo di antibiotici e sulle antibiotico-resistenze in Svizzera, sulla falsariga del rapporto JIACRA. Tuttavia, data la man-canza di dati e di tempo, è stata condotta solo un’analisi pre-liminare. Migliorando i dati sarà possibile negli anni a venire condurre analisi più significative, focalizzandosi sulle poten-ziali correlazioni tra uso di antibiotici e antibiotico-resistenze.
Al fine di comprendere l’epidemiologia dello S. aureus resi-stente alla meticillina (MRSA) e il rischio di trasmissione da-gli animali all’essere umano, è stato condotto uno studio delle caratteristiche molecolari di questo agente patogeno. Nella fattispecie, sono stati confrontati i ceppi di MRSA iso-lati da animali da reddito e carne svizzeri con isolati di MRSA provenienti da veterinari e allevatori sani e isolati umani pre-levati da ospedali svizzeri. L’analisi ha permesso di ottenere informazioni utili sulla distribuzione dei tipi «MRSA acquisito in ospedale (HA-MRSA)», «MRSA acquisito in comunità (CA-MRSA)» e «MRSA associato ad animali da reddito (LA-MRSA») in contesti umani e veterinari, e dunque di ca-pire meglio i rischi di trasmissione in Svizzera. Nei suini sviz-zeri da ingrasso si è registrato un forte aumento della preva-lenza di MRSA negli ultimi dieci anni. La prevalenza di MRSA nella carne di maiale, manzo e pollo svizzeri era molto bassa e il ceppo di MRSA rilevato era del tipo LA-MRSA. Uno stu-dio realizzato insieme a veterinari e allevatori ha rilevato che il ceppo di MRSA più diffuso tra questi attori era del tipo LA-MRSA. Questo dato è in linea con i risultati delle analisi di MRSA isolato da animali da reddito, anch’esso del tipo LA-MRSA. Nei pazienti ricoverati, invece, si riscontrano per la maggior parte i tipi HA-MRSA e CA-MRSA; in due pazien-ti, tuttavia, è stata rilevata la presenza del tipo LA-MRSA. È necessario un monitoraggio continuo, che comprenda la ti-pizzazione molecolare di isolati di MRSA sia umani che ani-mali.

3Introduction

26 Introduction
3.1 Antibiotic resistanceAntibiotic resistance is responsible for increased morbidity and mortality and adds significant health care costs. Alterna-tive treatments may have more serious side effects, and require longer treatments and hospital stays, with increased risk of suffering and death. Physicians in hospitals must in-creasingly rely on the so-called last-line antibiotics (e.g. car-bapenems). Increasing antibiotic resistance, also to these last-line antibiotics, raises a serious concern. Surveillance of antibiotic use and resistance is considered to be the back-bone of action plans developed by the different countries in order to determine the extent of the problem and the effec-tiveness of the measures taken.
3.2 About anresis.chThe Swiss Centre for Antibiotic Resistance anresis.ch was established in the framework of the National Research Pro-gram 49 Antibiotic Resistance. After termination of the NRP49, financing was further guaranteed by the Swiss Fed-eral Office of Public Health, the Swiss Conference of the Cantonal Ministers of Public Health and the University of Bern. Since 2016, the project is financed by the Swiss Fed-eral Office of Public Health and the Institute for Infectious Diseases in Bern; it is supported by the Swiss Society of Infectious Diseases (SSI), the Swiss Society for Microbiolo-gy (SSM), the Swiss Association of Public Health Adminis-tration and Hospital Pharmacists (GSASA) and Pharma- Suisse, the Swiss society of pharmacists.
The first microbiology laboratories participated in anresis.ch in 2004. The surveillance system expanded continuously during the following years, with 25 microbiology laboratories participating in 2018 (www.anresis.ch). Moreover, addition-al databases were included, such as the bacteremia data-base (2006), the antibiotic consumption database (2006 for inpatients, 2015 for outpatients) and the Clostridium difficile database (2017). Data on antibiotic resistance in clinical vet-erinary isolates are also collected in the anresis.ch database since 2014. The open data structure allows further develop-ments.
The steering committee of anresis.ch is composed of spe-cialists from microbiology, infectious diseases, hospital epi-demiology, veterinary medicine, and public health.
3.2.1 Monitoring of antibiotic consumption in human medicine
For the inpatient setting, the consumption of antibiotics has been monitored since 2006 by means of a sentinel network of hospital pharmacies. Yearly, data of approximately 70 hos-pitals are collected on a voluntary basis. These acute care hospitals are distributed all over the geographic territory and represent 41 % of the total number of acute somatic care hospitals (excluding psychiatric centers, rehabilitation centers, other specialized clinics) and 64 % of all beds in this category in Switzerland (see Chapter 13, Materials and methods). The participating hospitals receive a benchmark-ing report, allowing them to compare their results with those of other hospitals of similar size.
For the outpatient setting, the consumption of antibiotics has been monitored through two sources of data: (i) IQVIA™, a private drug market investigation company provides an ex-hausted dataset of antibiotic consumption and (ii) the data from PharmaSuisse are based on prescriptions at the indi-vidual level and are obtained from privately run pharmacies. The coverage is approximately 65 % of all pharmacies in Switzerland.
3.2.2 Monitoring of resistance in human medicine
anresis.ch collects and analyzes anonymous antibiotic re-sistance data provided by the participating clinical microbiol-ogy laboratories (www.anresis.ch). These laboratories are homogeneously distributed all over the geographic territory. They include university laboratories, representing isolates mainly from tertiary-care hospitals, as well as cantonal and private laboratories, representing data from smaller hospi-tals and ambulatories. They send antimicrobial susceptibility test results (AST) of all routinely performed analyses includ-ing isolates from non-sterile sites. Collected data represent at least 70 % of annual hospitalization days and approximate-ly 30 % of all practitioners in Switzerland. The epidemiologi-cal data provided allow for stratification of resistance results according to the hospital-versus-outpatient situation, age groups, and anatomical location of the infection.
Antibiotic resistance data are continuously available on www.anresis.ch and www.infect.info. The proportion of the follow-ing multiresistant bacteria in invasive isolates is reported and updated monthly in the weekly Bulletin of the Federal Office of Public Health (www.bag.admin.ch/dokumentation/publika-tionen): fluoroquinolone-resistant Escherichia coli, extend-ed-spectrum cephalosporin-resistant (ESCR) E. coli, ESCR
3 Introduction

Introduction 27
Klebsiella pneumoniae, methicillin-resistant Staphylococcus aureus (MRSA), penicillin-resistant Streptococcus pneumoni-ae and vancomycin-resistant enterococci. More detailed data from anresis.ch are published every two years along with vet-erinary data in this national report.
3.3 About ARCH-VetThe use of antimicrobials in livestock is a subject of public concern, as resistant bacteria can be selected and can enter the food chain and eventually infect people. Hence, a sys-tem to enable the continuous monitoring of resistance in livestock animals, meat and dairy products in Switzerland was introduced in 2006 on the basis of article 291d of the Epizootic Diseases Ordinance (EzDO; SR 916.401). Addition-ally, this system compiles data on sales of antimicrobial agents for veterinary medicine in accordance with article 36 of the Federal Ordinance on Veterinary Medicines (FOVM; SR 812.212.27). From 2009 to 2016, data on sales of veteri-nary antimicrobials and results of the resistance monitoring were published yearly in the ARCH-Vet report. Since 2017, data on sales of veterinary antimicrobials are published year-ly in the ARCH-Vet report and bi-annual together with the results of the resistance monitoring in the Swiss Antibiotic Resistance Report. For the third time, the ARCH-Vet data are published together with the anresis.ch data in the pres-ent report.
3.3.1 Sales of antimicrobials in veterinary medicine
Sales data is used to estimate the consumption of antimicro-bial agents in veterinary medicine. Marketing authorization holders (MAH) report the sales of antimicrobial veterinary medicinal products annually to Swissmedic (Swiss Agency for Therapeutic Products). This data are transmitted to the Food Safety and Veterinary Office (FSVO), where it is pro-cessed and analyzed. The data covers 100 % of the autho-rized antimicrobial veterinary medicinal products. The sales data are also transmitted to the European Medicines Agency (EMA) and published within the framework of the European Surveillance of Veterinary Antimicrobial Consumption Proj-ect (sales of veterinary antimicrobial agents in 29 EU/EEA countries in 2014; EMA/61769/2016).
3.3.2 Monitoring of resistance in zoonotic and indi-cator bacteria from healthy animals at slaugh-terhouse and meat thereof
The main goals of the standardized monitoring of antimicro-bial resistance in zoonotic and indicator (commensal) bacte-ria isolated from healthy livestock and meat thereof are to estimate resistance prevalence, to detect trends over years and to produce data for risk assessment. This information provides the basis for policy recommendations to combat the spread of antimicrobial resistance and allows the evalu-ation of the impact of measures taken.
Species examinedCattle, pigs and broilers are monitored because of their im-portance in meat production. Samples of cattle and pigs are taken alternately every other year with broilers. Caecum and nasal swab samples are taken by official veterinarians at the slaughterhouse and meat samples of the respective animal species by official inspectors at retail level. Resistance tests are performed for the zoonotic pathogens Campylobacter (C.) jejuni and C. coli and for the indicator bacteria Escheri-chia coli, Enterococcus (E.) faecalis and E. faecium. Since 2009, nasal swab samples from fattening pigs and calves have been also tested for methicillin-resistant Staphylococ-cus aureus (MRSA) using a selective enrichment procedure published by Overesch et al. (2011). From 2011 to 2014, tests have been carried out to detect ESBL-(extended-spec-trum-beta-lactamase)producing E. coli in broilers, pigs and cattle, using a selective enrichment procedure published by Vogt et al. (2014). Since 2015 analyses for the detection of ESBL/pAmpC- and carbapenemase-producing E. coli fol-lows the European-wide harmonized methods according to the protocols published by the European reference laborato-ry for antimicrobial resistance (EU RL AMR, Lyngby, Den-mark). Salmonella isolates available from clinical submis-sions from various animal species and from the national control program for Salmonella in poultry are also included for resistance testing. Meat samples are tested for MRSA, ESBL/pAmpC- and carbapenemase-producing E. coli only.
SamplingStratified random samples of slaughtered animals are taken in slaughterhouses. At least 60 % of the slaughtered animals of the concerned species must potentially form part of the sample. Every slaughterhouse taking part in the program collects a number of samples proportional to the number of animals of the species slaughtered per year. In addition, sampling is spread evenly throughout the year. The number of samples tested should allow:– to estimate the proportion of resistant isolates within
+/–8 % of an actual resistance prevalence of 50 %– to detect a change of 15 % in the proportion of resistant
isolates if resistance is widespread (50 % resistant isolates)– to detect a rise of 5 % in the proportion of resistant isolates
if resistance was previously low (0.1 % resistant isolates)
Resistance testing needs to be carried out on ad minimum 170 isolates in order to reach this accuracy. The sample size must be adjusted to reflect prevalence in previous years for the concerned animal species in order to obtain this number of isolates. As the prevalence of particular pathogens in some animal species is very low in Switzerland (e.g. Salmo-nella spp.), it is not always possible to obtain 170 isolates. 170 isolates is the target for C. jejuni, E. coli and E. faecium in broilers, C. coli and E. coli for fattening pigs and for E. coli in cattle.
Meat samples are collected in all Swiss cantons. The num-ber of samples per canton is proportionate to the number of its inhabitants. The samples are taken at different retailers proportionate to their market share throughout the country. For beef and pork meat, only domestic meat is collected, as

28 Introduction
the main part of consumed beef and pork meat is produced in Switzerland. For broiler meat, two thirds of the samples were domestic meat and one third imported meat.
3.3.3 Monitoring of resistance in animal bacteria from clinical samples
In 2015 the FSVO together with the national reference labo-ratory for antimicrobial resistance (ZOBA) launched a pilot project on antimicrobial resistance monitoring in veterinary pathogens from livestock and companion animals. Targeted bacteria and animal species combination comprises relevant pathogens and clinical cases. Isolates should ideally derive from all veterinary diagnostic laboratories in Switzerland. For the comparability of results over time it is mandatory that only isolates from animals which didn’t get antimicrobial treatment prior to sampling are included. Susceptibility test-ing was performed at the ZOBA with the broth microdilution method. In contrast to the monitoring in healthy livestock, antimicrobials tested are those approved for veterinary use. Moreover, isolates were classified as susceptible or resis-tant according to clinical breakpoints published by the Clini-cal and Laboratory Standards Institute, or, if not available by clinical breakpoints according to the European Committee on Antimicrobial Susceptibility Testing (EUCAST) guide-lines. An excerpt of data derived from this pilot project is presented in Chapter 11 (“Resistance in bacteria from ani-mal clinical isolates”). With this monitoring a relevant gap in surveillance of antimicrobial resistance could be bridged. Starting in 2019, this monitoring will be conducted on an annual basis. Results will be presented in reports.
Since 2014 the ZOBA provides antibiotic resistance data of veterinary pathogens from dogs, cats and horses via inter-face to the anresis database. In the future, data from this monitoring should be included as well.
3.4 Guidance for readersThe present report is the result of a cooperation between the Federal Office of Public Health (FOPH), the Food Safety and Veterinary Office (FSVO), anresis.ch and the Center for Zoonoses, Animal Bacterial Diseases and Antimicrobial Re-sistance (ZOBA). We are glad to present the Swiss data on the consumption of antimicrobials and antimicrobial resis-tance, both in humans and in animals.
Though these data are presented in one report, it is impor-tant to be aware that differences between the monitoring systems in collection, interpretation and reporting hamper direct comparisons of the results.
Antibiotic consumption dataAntimicrobial consumption data from humans are reported as defined daily doses (DDD) per 1,000 inhabitants and per day, or as DDD per 100 occupied bed-days or as DDD per 100 admissions.
In veterinary medicine, sales data on antimicrobials are used to estimate the consumption of these products. They are reported by weight (kg) of active substance per year or by weight of active substance per population correction unit (PCU) and per year. A comparable unit of measurement like the DDD in human medicine is not yet available.
Antibiotic resistance dataThe main issues when comparing antimicrobial resistance data originating from humans and food-producing animals are the different sampling strategies, the use of different laboratory methods and different interpretative criteria of resistance.
Sampling strategiesResistance in bacteria from humans is determined in iso-lates from clinical submissions, whereas for animals and meat, bacteria originate from samples taken of healthy food-producing animals and meat thereof in the framework of an active monitoring.
Laboratory methodsSusceptibility testing in human isolates is done in different laboratories using different methods (diffusion and micro- dilution methods). Animal and meat isolates are tested at the Swiss national reference laboratory for antimicrobial resis-tance (the Center for Zoonoses, Animal Bacterial Diseases and Antimicrobial Resistance, ZOBA, Institute of Veterinary Bacteriology, Vetsuisse Faculty, University of Bern) using a standardized broth microdilution method.
Criteria of resistanceHuman clinical isolates are classified as “susceptible,” “in-termediate” or “resistant” applying clinical breakpoints and quantitative resistance data are not available for most iso-lates. This interpretation indicates the likelihood of a thera-peutic success with a certain antibiotic and thus helps the attending physician to select the best possible treatment. Clinical breakpoints are defined against a background of clin-ically relevant data such as dosing, method and route of ad-ministration, pharmacokinetic and pharmacodynamics. The use of different clinical breakpoints (e.g. EUCAST vs. CLSI) or changing breakpoints over time may therefore influence the results.
The resistance monitoring in animals and meat thereof uses epidemiological cutoff values (ECOFFs) to separate the nat-ural, susceptible wild-type bacterial populations from iso-lates that have developed reduced susceptibility to a given antimicrobial agent. So-called non-wild-type organisms are assumed to exhibit acquired or mutational resistance mech-anisms and are referred as “microbiologically resistant.” ECOFF values allow no statement on the potential therapeu-tic success of an antimicrobial, but as they are able to indi-cate resistance mechanisms at an early stage, they are used for epidemiological monitoring programs that measure re-sistance development over time.
Clinical breakpoints and ECOFFs may be the same, although it is often the case that the ECOFF is lower than the clinical

breakpoint. That means although the bacteria can be “micro-biologically resistant,” therapeutically the antimicrobial can still be effective.
Cooperation and coordination between the different monitor-ing networks have to be further strengthened and systems have to be refined, to improve comparability, as it is foreseen in the national Strategy against Antibiotic Resistance (StAR).
3.5 Authors and contributionsMain authors– Dagmar Heim, Veterinary Medicinal Products and Antibi-
otics, Federal Food Safety and Veterinary Office– Andreas Kronenberg, Swiss Centre for Antibiotic Resis-
tance, Institute for Infectious Diseases, University of Bern– Gudrun Overesch, Center for Zoonoses, Animal Bacterial
Diseases and Antimicrobial Resistance, Institute of Veter-inary Bacteriology, Vetsuisse Faculty, University of Bern
– Catherine Plüss-Suard, Hospital Preventive Medicine, University Hospital of Lausanne
– Gertraud Schüpbach, Veterinary Public Health Institute, Vetsuisse Faculty University of Bern
Contributing authors– Philipp Bless, Animal Welfare, Federal Food Safety and Vet-
erinary Office– Helmut Bürgmann, Swiss Federal Institute of Aquatic Sci-
ence and Technology, Kastanienbaum– Olivier Dubuis, Viollier AG, Basel– Adrian Egli, Division of Clinical Microbiology, University
Hospital Basel– Reno Frei, Institute of Microbiology, Cantonal Hospital
Lucerne– Valeria Gaia, Department of Microbiology, EOLAB,
Bellinzona– Michael Gasser, Swiss Centre for Antibiotic Resistance,
Institute for Infectious Diseases, University of Bern– Christian Götz, Office of Waste, Water, Energy and Air,
Zurich
Introduction 29
Color code
This is the color code that is used in various figures in this report.
Ionophore Nitrofuran Oxazolidone Fluoroquinolone Glycopeptide Aminoglycoside Epoxide-AB Polypeptide Sulfonamide Steroidal antibiotics Amphenicole
Ansamycin Tetracycline Lincosamide Streptogramin Macrolide Penicillin Carbapenem Cephalosporin
– Markus Hardegger, Federal Office for Agriculture, Bern– Markus Hilty, Swiss National Centre for Pneumococci,
Institute for Infectious Diseases, University of Bern– Sonja Kittl, Institute for Veterinary Bacteriology, Vetsuisse
Faculty, University of Bern– Christa S. McArdell, Swiss Federal Institute of Aquatic Sci-
ence and Technology, Dübendorf– Patrice Nordmann, National Center for Emerging Antibiotic
Resistance, University of Fribourg– Luís Pedro Carmo, Veterinary Public Health Institute, Vet-
suisse Faculty, University of Bern– Miriam Reinhardt, Federal Office for the Environment, Bern– Judith Riedo, Federal Office for the Environment, Bern– Mirko Saam, Communication in Science, Geneva– Jaques Schrenzel, Bacteriology Laboratory, Geneva Univer-
sity Hospitals, Geneva– Michael Sinreich, Federal Office for the Environment, Bern– Roger Stephan, Institute for Food Safety and Hygiene, Vet-
suisse Faculty, University of Zurich– Andreas Widmer, Division of Infectious Diseases and Hos-
pital Epidemiology, University of Basel– Giorgio Zanetti, Hospital Preventive Medicine, University
Hospital of Lausanne– Saskia Zimmermann-Steffens, Federal Office for the Envi-
ronment, Bern
EditorsKarin Wäfler, Division of Communicable Diseases, Federal Office of Public Health (FOPH), and Dagmar Heim, Veteri-nary Medicinal Products and Antibiotics, Federal Food Safe-ty and Veterinary Office (FSVO).
AcknowledgementsThe authors are grateful to all persons for providing data for this study. Many thanks to all participants not mentioned by name.
Anresis.ch would like to thank all participating microbiology laboratories, sentinel network of hospital pharmacies and PharmaSuisse for their important contribution in providing resistance and antibiotic consumption data.


4Abbreviations

32 Abbreviations
ACB Acinetobacter calcoaceticus-Acineto- bacter baumannii AFSSA French Food Safety AgencyAGISAR Advisory Group on Integrated Surveillance of Antimicrobial ResistanceAMR Antimicrobial resistanceANRESIS Swiss Centre for Antibiotic ResistanceARB Antibiotic resistant bacteriaARG Antibiotic resistance geneAST Antimicrobial susceptibility testingATC Anatomical Therapeutic ChemicalAWARE Access, Watch and Reserve antibiotic categories as defined by the WHO Expert Committee on Selection and Use of Essential Medicines
CAESAR Central Asian and Eastern European Surveillance on Antimicrobial ResistanceCC Clonal complexCI Confidence intervalCLSI Clinical Laboratory Standards InstituteCPE Carbapenemase-producing EnterobacteriaceaeCSF Cerebrospinal fluidCTX Cefotaxime
DCDvet Defined course doses for animalsDD Disc diffusionDDD Defined daily doseDDDvet Defined daily dose for animalsDID Defined daily dose per 1,000 inhabitants and per day
EARSS European Antimicrobial Resistance Surveillance SystemECCMID European Congress of Clinical Microbiology and Infectious DiseasesECDC European Centre for Disease Prevention and ControlECOFF Epidemiological cutoff valueEEA European Economic AreaEFSA European Food Safety AuthorityEMA European Medicines AgencyEphMRA European Pharmaceutical Market Research AssociationESAC-Net European Surveillance of Antimicrobial Consumption NetworkESBL Extended-spectrum beta-lactamaseESCR Extended-spectrum cephalosporin resistance
4 Abbreviations
ESVAC European Surveillance of Veterinary Antimicrobial ConsumptionEU European UnionEUCAST European Committee on Antimicrobial Resistance TestingEzDO Epizootic Diseases Ordinance
FAO Food and Agriculture OrganizationFOAG Federal Office for AgricultureFOEN Federal Office for the EnvironmentFOPH Federal Office of Public HealthFSVO
Federal Food Safety and Veterinary
Office
GP
General practitioner
GSASA Swiss Association of Public Health Administration and Hospital Pharmacists
HLR High-level resistance
ICU Intensive care unitsISO International Organization for Standardization
LA-MRSA Livestock-associated MRSALMA Potassium-aluminum sulfateLOD Limit of detectionLPS Lipopolysaccharide
MALDI TOF MS Matrix-assisted laser desorption/ioniza- tion time-of-flight mass spectroscopy mCCDA Modified charcoal cefoperazone deoxy- cholate agarmcr plasmid-mediated colistin resistanceMDR Multidrug resistantMIC Minimal inhibitory concentrationMIC90 Minimal inhibitory concentration required to inhibit the growth of 90% of the isolates testedMLST Multilocus sequence typingMRSA Methicillin-resistant Staphylococcus aureusMRSP Methicillin-resistant Staphylococcus pseudintermediusMSM Men who have sex with menMSSA Methicillin-susceptible Staphylococcus aureus
NAQUA National Groundwater Monitoring

Abbreviations 33
NARA National Reference Centre for the Early Detection and Monitoring of Antibiotic ResistanceNRP National research project
OFAC Professional cooperative of the Swiss pharmacistsOIE World Organization for Animal Health
PAC Powdered activated carbonpAmpC Plasmid-mediated AmpC-beta-lactamasePBP Penicillin-binding proteinPCU Population correction unitPCR Polymerase chain reactionPNSP Penicillin-non-susceptible Streptococcus pneumoniaePSSP Penicillin-susceptible Streptococcus pneumoniaePVL Panton-Valentine Leukocidin
SFSO Swiss Federal Statistical OfficeSIB Swiss Institute of Bioinformatics SIR Susceptible – Intermediate – ResistantSNF Swiss National Science FoundationSNP Single-nucleotide polymorphismspp. SpeciesSSI Swiss Society of Infectious DiseasesSSM Swiss Society for MicrobiologySSP Swiss Society of Pharmacists, PharmaSuisseStAR Nationale Strategie Antibiotika- resistenzen (National strategy of antibiotic resistance)SVGW Swiss association of the gas and water industry
t spa type
VetCAST EUCAST Veterinary Subcommittee on Antimicrobial Susceptibility TestingVMD Veterinary Medicines DirectorateVRE Vancomycin-resistant enterococci
WGS Whole genome sequencingWHO World Health OrganizationWWTP Wastewater treatment plant
ZOBA Center for Zoonoses, Animal Bacterial Diseases and Antimicrobial Resistance


5Antibacterial consumption
in human medicine

36 Antibacterial consumption in human medicine
5.1 Hospital care5.1.1 Total antibiotic consumption in hospitals
contributing to anresis.ch
Taking into account the hospital sites that have participated each year since 2007 in the surveillance system anresis.ch (n=32), the number of DDDs of systemic antibiotics (ATC group J01) has increased by 14 % since then. However, this needs to be adjusted to indicators of hospital activity.
The number of admissions increased (+17 %), while the number of bed-days was relatively stable (–6 %). This means that more patients are admitted to hospitals, but that their length of stay is shorter in 2017 than in 2007. The total con-sumption of systemic antibiotics in DDDs per 100 bed-days increased by 16 %, from 53.6 (weighted mean, range: 20.5–77.8) in 2007 to 62.2 (range: 40.7–85.2) in 2017 (Figure 5. a). The antibiotic consumption in DDDs per 100 admis-sions remained stable from 2007 to 2017 (–9 %). In 2017, total antibiotic consumption was lower in small-size hospi-tals (56.0 DDDs per 100 bed-days) than in medium-size (63.4) and large-size (69.4) hospitals. This increasing trend was observed in the three hospital size categories.
5 Antibacterial consumption in human medicine
In 2017, total antibiotic consumption was relatively similar in the three linguistic regions: 59.2 DDDs per 100 bed-days in the French-speaking (18 hospitals), 56.7 in the Italian-speak-ing (5 hospitals) and 63.8 in the German-speaking region (44 hospitals). The consumption in the German-speaking region increased by 22 % between 2007 and 2017, while it re-mained stable in the French-speaking (+6 %) and the Ital-ian-speaking regions (+3 %).
The total consumption of antibacterial agents for systemic use was 1.3 DDDs per 1,000 inhabitants per day in 2016. In comparison, the median consumption was 2.1 per 1,000 in-habitants per day (range 1.0–2.9) in 2016 in the countries participating in the European Surveillance of Antimicrobial Consumption Network (ESAC-Net) [1].
We have observed that according to the AWaRe classifica-tion (see Chapter 13, Materials and methods), the Core-Ac-cess group represented 56 % of antibiotics (36.3 DDDs per 100 bed-days), the Watch group 31 % (20.2), the Reserve group 5 % (3.0) and the “Others” group 8 % (5.0) in 2017 (Table 5. a). The antibiotic consumption from the Reserve group has been increasing since 2015.
0
DD
D /
100
bed
-day
s
DD
D / 100 ad
missio
ns
Whole hospitals,in DDD per 100 bed-days
Intensive care units,in DDD per 100 bed-days
Whole hospitals,in DDD per 100 admissions
37 37 40 39 41 414138424233
0
50
100
150
200
250
300
350
400
450
62 59 64 60 68 676155596359
20
40
60
80
100
120
2007 2008 2009 2010 2011 2012 2013 2014 2015 2016 2017
Figure 5. a: Total antibiotic consumption (ATC group J01) expressed in DDDs per 100 bed-days (bars) and in DDDs per 100 admissions (dark line) in the hospitals and intensive care units contributing to anresis.ch over the period 2007–2017. The number of hospital networks (or sites) contributing to anresis.ch is indicated in the corre-sponding bars.

Antibacterial consumption in human medicine 37
5.1.2 Antibiotic consumption in hospitals contributing to anresis.ch by antibiotic class and by specific antibiotic
In 2017, consumption of penicillins (ATC group J01C) ranked first among antibiotic classes, representing 46 % of the total consumption. It was followed by the consumption of other beta-lactam antibacterials, including cephalosporins (ATC group J01D), and then by quinolones (ATC group J01M) (26 % and 8 %, respectively) (Figure 5. b).
Table 5. b shows the consumption of antibiotic classes ex-pressed in DDDs per 100 bed-days in sentinel hospitals over the period 2007–2017. The use of eight of the 22 antibiotic classes decreased between 2007 and 2017 (first-generation cephalosporins, fluoroquinolones, glycopeptides, mac-
rolides, nitroimidazole derivates, polymixins, rifamycins and tetracyclines). The most important progression (more than 100 %) in consumption between 2007 and 2017 was ob-served for the fourth-generation cephalosporins, the nitro-furan derivates, the antipseudomonal penicillins associated with a beta-lactamase inhibitor, and the other antibacterials (including daptomycin, fosfomycin).
Consumption of penicillins increased 23 % between 2007 and 2017 (Table 5. b). Within this class, the association of amoxicillin and clavulanic acid was the most frequently prescribed antibiotic and ranged from 16.8 in 2007 to 18.4 DDDs per 100 bed-days in 2017 (+10 %) (Figure 5. c). The association of piperacillin and tazobactam increased by 120 % from 1.3 in 2007 to 2.8 DDDs per 100 bed-days in 2017.
Table 5. a: Antibiotic consumption according to the AWaRe categorization of the WHO in the inpatient setting, Switzerland (2015–2017).
AWaRe groups**Consumption* Relative consumption
2015 2016 2017 2015 2016 2017
Core-Access group 33.0 32.8 36.3 53 % 55 % 56 %
Watch group 21.6 19.2 20.2 35 % 32 % 31 %
Reserve group 2.4 2.2 3.0 4 % 4 % 5 %
Others 5.4 4.9 5.0 9 % 8 % 8 %
* Consumption expressed in DDD per 100 bed-days** See Annexe I for the list of antibiotics and their corresponding AWaRe group
Figure 5. b: Distribution of the total antibiotic consumption (ATC group J01) per antibiotic class in the inpatient setting in 2017 in Switzerland.
Beta-lactamase-resistant penicillins (J01CF)
Beta-lactamase-sensitive penicillins (J01CE)
Sulfonamides and trimethoprim (J01E)
Beta-lactam antibacterials other than penicillins (J01D)
Fluoroquinolones (J01MA)
Tetracyclines (J01A)
Macrolides, lincosamides and streptogramins (J01F)
Penicillins with extended spectrum (J01CA)
Comb. of penicillins, incl. beta-lactamase inhib. (J01CR)
Other antibacterials (J01X)
Aminoglycoside antibacterials (J01G)
26%34%
7%
6%6% 1%
8%
5%
2%4%
1%

38 Antibacterial consumption in human medicine
Table 5. b: Consumption of antibiotic classes expressed in DDDs per 100 bed-days in hospitals contributing to anresis.ch in Switzerland (2007–2017).
ATC group Antibiotic class 2007 2008 2009 2010 2011 2012 2013 2014 2015 2016 2017
J01G Aminoglycosides 0.8 0.7 0.7 0.8 0.7 0.7 0.7 0.6 0.6 0.5 0.8
J01CF Beta-lactamase-resistant penicillins 1.7 1.6 1.7 1.8 1.9 2.1 2.0 2.4 2.4 2.4 2.5
J01CE Beta-lactamase-sensitive penicillins 0.9 0.9 1.1 1.1 1.3 1.5 1.3 1.2 1.3 1.3 1.2
J01DH Carbapenems 2.2 2.2 2.4 2.4 2.6 2.8 3.1 3.0 2.8 2.4 2.7
J01DB Cephalosporins – first generation 1.2 1.3 1.2 1.1 1.1 1.0 1.0 1.1 1.5 1.1 1.2
J01DC Cephalosporins – second generation 3.9 3.8 3.6 3.6 3.6 3.8 4.3 4.6 4.8 4.5 4.4
J01DD Cephalosporins – third generation 3.7 3.7 3.7 3.8 4.0 4.2 4.9 4.9 5.7 5.4 5.7
J01DE Cephalosporins – fourth generation 0.7 1.1 0.9 1.1 1.3 1.5 1.6 1.5 1.7 1.7 2.1
J01MA Fluoroquinolones 7.9 7.3 6.7 6.5 6.1 6.0 6.2 6.1 5.9 5.0 5.0
J01XA Glycopeptides 0.8 0.9 0.8 1.0 1.1 1.1 1.2 1.3 1.3 1.0 0.5
J01FF Lincosamides 0.9 0.9 0.9 0.8 0.8 0.9 1.0 1.0 1.0 0.9 1.1
J01FA Macrolides 3.1 2.9 2.7 2.6 2.5 2.7 3.0 2.9 3.1 2.8 2.8
J01XE Nitrofuran derivates (nitrofurantoin) 0.1 0.1 0.1 0.1 0.2 0.3 0.3 0.4 0.4 0.4 0.4
P01ABNitroimidazole derivates (metronida-zole oral)
0.9 0.9 0.8 0.8 0.8 0.9 0.8 0.8 0.8 0.7 0.7
J01XX Other antibacterials 0.1 0.1 0.2 0.3 0.4 0.6 0.7 0.8 0.9 0.9 1.2
J01CR02Penicillins and beta-lactamase inhibi-tor (amoxicillin and clavulanic acid)
16.8 16.0 16.7 16.3 16.5 18.1 18.5 17.9 17.4 18.4 18.4
J01CR03-05Penicillins and beta-lact. inhibitor (anti-pseudomonal)
1.3 1.5 1.6 1.8 1.9 2.3 2.7 2.7 2.8 2.6 2.8
J01CAPenicillins with extended spectrum (amoxicillin)
2.5 2.7 2.5 2.5 2.7 2.8 3.4 3.4 3.7 3.2 3.6
J01XB Polymyxins (colistin) 0.1 0.2 0.0 0.1 0.1 0.1 0.2 0.2 0.2 0.1 0.0
J04AB Rifamycins 1.0 1.0 0.9 1.0 0.9 0.8 0.8 0.9 0.7 0.7 0.8
J01E Sulfonamides and trimethoprim 2.1 2.1 1.9 1.9 2.0 2.4 2.4 2.5 2.4 2.2 2.7
J01A Tetracyclines 0.7 0.7 0.5 0.6 0.5 0.5 0.6 0.6 0.6 0.8 0.7
J01Antibacterial agents for systemic use (total)
53.6 52.7 51.6 52.0 53.3 57.4 61.0 60.7 62.4 59.2 62.2
The use of second- and third-generation cephalosporins in-creased markedly between 2007 and 2017. In 2017, cefuro-xime (second generation) and ceftriaxone (third generation) were the most widely used cephalosporins (Figure 5. c).
Cephalosporins recently approved by Swissmedic (ceftobi-prole, ceftolozane-tazobactam and ceftaroline) have rarely been used in hospitals contributing to anresis.ch.
Following a constant increase until 2013, the consumption of carbapenems has remained stable since then. This is due to a 55 % decrease in the consumption of imipenem and ci-lastatin between 2007 and 2017, whereas consumption of meropenem and ertapenem increased (+43 % and +64 %, respectively) over the same period (Figure 5. c).
Fluoroquinolone consumption decreased during the years 2007–2017. Ciprofloxacin was the most widely used fluoro-quinolone (3.7 DDDs per 100 bed-days, 75 % of fluoro-quinolone consumption) in 2017 (Figure 5. c). Ciprofloxacin, norfloxacin and ofloxacin use decreased between 2007 and 2017 (–32 %, –84 % and –98 %, resp.). The consumption of levofloxacin was relatively stable during the years 2007 to 2017, accounting for 0.9 DDDs per 100 bed-days in 2017.
Macrolide consumption (ATC group J01FA) has remained relatively stable, going from 3.1 DDDs per 100 bed-days in 2007 to 2.8 in 2017 (–8 %). Clarithromycin was the most widely used macrolide (2.1 DDDs per 100 bed-days, 76 % of macrolide consumption) (Figure 5. c). It was followed by azithromycin (0.4 DDDs per 100 bed-days, 16 %) and eryth-romycin (0.2 DDDs per 100 bed-days, 8 %). The consump-tion of clindamycin (ATC group J01FF01) has increased by 18 % over the period 2007–2017 (1.1 DDDs per 100 bed-days in 2017).
Among antibiotics active against resistant Gram-positive bacteria, we have observed an increase by 52 % in con-sumption of vancomycin between 2007 and 2017 (Figure 5. c). Consumption of daptomycin has constantly increased (0.6 DDDs per 100 bed-days in 2017). Linezolid and tedizolid have rarely been used in hospitals contributing to anresis.ch. The proportion of the broadest-spectrum antibiotics has constantly increased, going from 8 % of total antibiotic con-sumption in 2007 to 12 % in 2017. This category includes aztreonam, cefepime, ceftazidime, imipenem, meropenem, piperacillin, piperacillin-tazobactam, ticarcillin and ticarcil-lin-tazobactam in the present report. In 2017, piperacillin-ta-zobactam was the most frequently used of these antibiotics

Antibacterial consumption in human medicine 39
Figure 5. c: Consumption of antibiotics expressed in DDDs per 100 bed-days in hospitals contributing to anresis.ch in Switzerland (2007–2017).
Amoxicillin-clavulanic acid
Amoxicillin
Piperacillin-tazobactam
Flucloxacillin
2008 2007 2009 2010 2011 2012 2013 2014 2015 2016 2017
0
5
10
15
20
DD
D /
100
bed
-day
s
Ceftriaxone
Cefuroxime
Cefepime
Cefazolin
Ceftazidime
DD
D /
100
bed
-day
s
2008 2007 2009 2010 2011 2012 2013 2014 2015 2016 2017
0
1
2
3
4
6
5
Meropenem
Imipenem-cilastatin
Ertapenem
DD
D /
100
bed
-day
s
2008 2007 2009 2010 2011 2012 2013 2014 2015 2016 2017
0
1
2
3
4
6
5
Ciprofloxacin
Levofloxacin
Moxifloxacin
Norfloxacin
DD
D /
100
bed
-day
s
2008 2007 2009 2010 2011 2012 2013 2014 2015 2016 2017
0
1
2
3
4
6
5

40 Antibacterial consumption in human medicine
Clarithromycin
Azithromycin
Erythromycin
Clindamycin
DD
D /
100
bed
-day
s
2008 2007 2009 2010 2011 2012 2013 2014 2015 2016 2017
0
1
2
3
4
6
5
Vancomycin
Teicoplanin
Daptomycin
DD
D /
100
bed
-day
s
2008 2007 2009 2010 2011 2012 2013 2014 2015 2016 2017
0
1
2
3
4
6
5
in the sentinel hospitals (37 % of the broadest-spectrum antibiotic use), followed by cefepime (29 %), meropenem (23 %), imipenem-cilastatin (9 %) and ceftazidime (2 %).
5.1.3 Total antibiotic consumption in intensive care units of hospitals contributing to anresis.ch
Global use of systemic antibiotics (ATC group J01) remained relatively stable, ranging from 99.3 DDDs per 100 bed-days in 2007 to 108.0 in 2017 (+8 %) (Figure 5. a). In 2017, total antibiotic consumption was lower in the intensive care units of small-size hospitals (88.2 DDDs per 100 bed-days) than in intensive care units of medium-size (96.5) and large-size (120.3) hospitals.
5.2 Outpatient care5.2.1 Total antibiotic consumption in the outpatient
setting using IQVIA™ dataset
In 2017, the total consumption of antibacterial agents for systemic use (ATC group J01) was 10.7 DDDs per 1,000 in-habitants per day (DID). It has slightly declined in compari-son with 2016 (11.1 DIDs) and 2015 (11.3 DIDs) (Table 5. c). In comparison, the median consumption was 21.9 DDDs per 1,000 inhabitants per day (range between 10.4 in the Neth-
erlands and 36.3 in Greece) in 2016 in the countries partici-pating in the European Surveillance of Antimicrobial Con-sumption Network (ESAC-Net) [1].
The number of packages per 1,000 inhabitants per day was 1.3 in 2017. It has remained stable in comparison with 2016 and 2015 (1.3 for both years). In comparison, the median consumption was 3.1 packages per 1,000 inhabitants per day (range between 1.0 in Sweden and 4.7 in France) in 2016 in the countries participating in the European Surveillance of Antimicrobial Consumption Network (ESAC-Net) [1].
We have observed that according to the AWaRe classifica-tion (see Chapter 13, Materials and methods) the Core-Ac-cess group represented 65 % of antibiotics (6.8 DIDs), the Watch group 25 % (2.6 DIDs), the Reserve group 0.2 % (< 0.05 DIDs) and the “Others” group 10 % (1.1 DIDs) in 2017 (Table 5. d). These proportions have remained stable since 2015.
5.2.2 Antibiotic consumption in the outpatient set-ting by antibiotic class and by specific antibiot-ic using IQVIA™ dataset
Consumption of penicillins (including amoxicillin-clavulanic acid, ATC group J01C) ranked first among antibiotic classes, amounting to 48 % of the total antibiotic consumption in

Antibacterial consumption in human medicine 41
Table 5. c: Consumption of antibiotic classes expressed in DDDs per 1,000 inhabitants per day in the outpatient setting in Switzerland (2015–2017).
ATC Group Antibiotic class 2015 2016 2017
J01G Aminoglycosides 0.02 0.02 0.02
J01CF Beta-lactamase-resistant penicillins 0.01 0.01 0.01
J01CE Beta-lactamase-sensitive penicillins 0.11 0.12 0.10
J01DH Carbapenems 0.00 0.00 0.00
J01DB Cephalosporins – first generation 0.00 0.00 0.00
J01DC Cephalosporins – second generation 0.62 0.61 0.57
J01DD Cephalosporins – third generation 0.16 0.14 0.11
J01DE Cephalosporins – fourth generation 0.00 0.00 0.00
J01MA Fluoroquinolones 1.53 1.40 1.28
J01XA Glycopeptides 0.00 0.00 0.00
J01FF Lincosamides 0.17 0.17 0.17
J01FA Macrolides 1.35 1.27 1.20
J01XE Nitrofuran derivates (nitrofurantoin) 0.37 0.36 0.36
P01AB Nitroimidazole derivates (metronidazole oral) 0.76 0.76 0.77
J01XX Other antibacterials (fosfomycin) 0.10 0.10 0.11
J01CR Penicillins and beta-lactamase inhibitors (amoxicillin and clavulanic acid) 3.80 3.74 3.59
J01CA Penicillins with extended spectrum (amoxicillin) 1.29 1.38 1.40
J01XB Polymyxins (colistin) 0.01 0.01 0.01
J04AB Rifamycins 0.13 0.13 0.13
J01E Sulfonamides and trimethoprim 0.43 0.43 0.45
J01A Tetracyclines 1.30 1.37 1.29
J01 Antibacterial agents for systemic use (total) 11.30 11.15 10.70
Table 5. d: Antibiotic consumption according to the AWaRe categorization of the WHO in the outpatient setting in Switzerland (2015–2017).
AWaRe groups**Consumption* Relative consumption
2015 2016 2017 2015 2016 2017
Core-Access group 6.8 6.9 6.8 61 % 63 % 65 %
Watch group 3.1 2.8 2.6 28 % 26 % 25 %
Reserve group < 0.05 < 0.05 < 0.05 0.2 % 0.2 % 0.2 %
Others 1.2 1.2 1.1 11 % 11 % 10 %
* Consumption expressed in DDD per 1,000 inhabitants and per day ** See Annex I for the list of antibiotics and their corresponding AWaRe group
2017 (Figure 5. d). It was followed by the consumption of macrolides, lincosamides and streptogramins (13 %, ATC group J01F), tetracyclines (12 %, ATC group J01A), fluoro-quinolones (12 %, ATC group J01MA), beta-lactam antibac-terials other than penicillins (including cephalosporins, 6 %, ATC group J10D), sulfonamides and trimethoprim (4 %, ATC group J01E) and other antibacterials (5 %, ATC group J01X).
The overall consumption of penicillins remained stable in 2017 (5.1 DIDs, 48 % of total antibiotic consumption) com-pared to 2015 (5.2 DIDs). Combinations of penicillins and beta-lactamase inhibitors were the most frequently used group of systemic antibiotics in 2017 (3.6 DIDs, 34 % of total
antibiotic consumption) and of penicillins (70 % of penicillins consumption) (Table 5. c). Among penicillins, those with an extended spectrum, namely amoxicillin, were the second most frequently used group (1.4 DIDs, 27 % of penicillin con-sumption). The relative consumption of beta-lactamase-sen-sitive penicillins was low in Switzerland (1 % of total antibiotic consumption in 2017), as this indicator ranged from < 0.1 % to 26.7 % in 2016 in countries participating in the ESAC-Net (Fig-ure 5. e) [1]. However, the relative consumption of penicillins associated with beta-lactamase inhibitors was relatively high (34 %) in comparison with countries participating in the ES-AC-Net (range: 0.1 %–44.2 %) in 2016 [1]. At the substance level, amoxicillin-clavulanic acid and amoxicillin were the

42 Antibacterial consumption in human medicine
Figure 5. d: Distribution of the total antibiotic consumption (ATC group J01) per antibiotic class in the outpatient setting in 2017 in Switzerland.
Beta-lactamase-sensitive penicillins (J01CE)
Sulfonamides and trimethoprim (J01E)
Beta-lactam antibacterials other than penicillins (J01D)
Fluoroquinolones (J01MA)
Tetracyclines (J01A)
Macrolides, lincosamides and streptogramins (J01F)
Penicillins with extended spectrum (J01CA)
Comb. of penicillins, incl. beta-lactamase inhib. (J01CR)
Other antibacterials (J01X)
1%
4%6%
12%
12%
13%13%
34%
5%
most frequently used antibiotics in 2017 (3.6 and 1.4 DIDs, resp.), of which both consumptions remained stable between 2016 and 2017.
The cephalosporins (ATC group J01DB-DE) remained stable in 2017 (0.69 DIDs) compared to 2015 (0.78 DIDs). Cefurox-ime, cefpodoxime and cefaclor represented 79 %, 14 % and 4 % resp. of cephalosporin consumption in 2017. The relative consumption of third- and fourth-generation cephalosporins (ATC Code J01DD-DE) was 1 % in 2017, compared with a range of < 0.1 % to 7.2 % in countries participating in the ESAC-Net in 2016 (Figure 5. e) [1].
Fluoroquinolone consumption was 1.3 DDDs per 1,000 inhab-itants per day in 2017 in Switzerland, accounting for 12 % of the total antibiotic consumption in the outpatient setting. Al-though we have observed a slight downward trend (–8 % be-tween 2016 and 2017), their consumption has remained high in comparison with countries participating in the ESAC-Net, where the relative consumption of fluoroquinolones ranged from 2.3 % to 21.4 % in 2016 (Figure 5. e) [1]. At the substance level, ciprofloxacin was the most frequently used fluoro-quinolone (66 %), followed by levofloxacin (13 %), norfloxacin (12 %), moxifloxacin (8 %) and ofloxacin (1 %) in 2017.
In the macrolide, lincosamide and streptogramin group, (ATC Code J01F), only macrolides and lincosamides have been used in Switzerland (1.2 and 0.17 DDDs per 1,000 in-habitants per day in 2017) (Table 5. c). Macrolide consump-tion decreased slightly (–5 %) between 2016 and 2017, while lincosamide consumption remained stable. Clarithromycin,
azithromycin and erythromycin accounted for 59 %, 41 % and 1 % resp. of the macrolides in 2017. Among the lin-cosamides, clindamycin consumption was 0.17 DDDs per 1,000 inhabitants per day in 2017 and has remained stable since 2015.
Tetracycline consumption decreased slightly, from 1.4 DDDs per 1,000 inhabitants per day in 2016 to 1.3 in 2017 (–6 %), accounting for 12 % of the total antibiotic consumption. Dox-ycycline was the most frequently used tetracycline (76 %), followed by minocycline (13 %), and limecycline (12 %).
Nitrofurantoin and fosfomycin accounted for resp. 3 % and 1 % of the total antibiotic consumption.
The ratio of the consumption of broad-spectrum penicillins, cephalosporins and macrolides to the consumption of nar-row-spectrum penicillins, cephalosporins and macrolides was relatively high (52.0) in comparison with countries par-ticipating in the ESAC-Net, where this ratio ranged from 0.2 to 234.2 in 2016 (Figure 5. e) [1].
5.2.3 Antibiotic consumption in the outpatient set-ting by linguistic region using IQVIA™ dataset
In 2017, the German-speaking part of Switzerland had lower antibiotic consumption (9.2 DIDs) than the Italian-speaking (13.4) and French-speaking parts (14.5) (Figure 5. f). The three regions have shown a decreasing trend since 2015, especially marked in the Italian-speaking part of Switzerland

Antibacterial consumption in human medicine 43
Figure 5. e: ESAC quality indicators for consumption of antibacterials for systemic use (ATC group J01) in the outpatient setting in Switzerland (2015–2017).
YearConsumptiona Relative consumptionb Broad/Narrowc
J01 JO1C J01D J01F J01M J01CE_ %d J01CR_ % J01DD+DE_ % J01MA_ % J01_B/N
2015 11.3 5.2 0.8 1.5 1.5 0.9 33.6 1.4 13.6 51.5
2016 11.1 5.3 0.8 1.4 1.4 1.0 33.6 1.2 12.6 47.0
2017 10.7 5.1 0.7 1.4 1.3 0.9 33.6 1.1 12.0 52.0
p0* 10.4 4.3 < 0.1 0.5 0.4 < 0.1 0.1 < 0.1 2.3 0.2
p25* 15.2 6.5 0.6 1.8 0.9 0.6 14.5 0.1 5 6.1
p50* 19.8 9.6 1.7 2.8 1.4 2.3 23.8 0.5 7.8 13.4
p75* 24.2 13.0 2.8 3.6 2.4 5.2 32.4 2.2 9.6 45.9
p100* 36.3 19.8 7.5 6.1 7.1 26.7 44.2 7.2 21.4 234.2
a Consumption for penicillins (J01C), cephalosporins (J01D), macrolides, lincosamides and streptogramins (J01F) and quinolones (J01M) expressed in DDD per 1,000 inhabitants per day.
b Relative consumption of beta-lactamase-sensitive penicillins (J01CE), combinations of penicillins, including beta-lactamase inhibitor (J01CR), third- and fourth-generation cephalosporins (J01(DD+DE)) and fluoroquinolones (J01MA) expressed as percentage of the total antibiotic consumption (J01).
c Ratio of the consumption of broad-spectrum penicillins, cephalosporins and macrolides (J01(CR+DC+DD+(F-FA01))) to the consumption of narrow-spectrum penicillins, cephalosporins and macrolides (J01(CE+DB+FA01))
d As higher quartile suggest better quality indicator, the color code was applied inversely. * Values in the community, EU/EEA countries, 2016 [1].
Values within the first quartile [p0; p25]
Values within the first quartile [p25; p50]
Values within the first quartile [p50; p75]
Values within the first quartile [p75; p100]
Figure 5. f: Total antibiotic consumption (ATC group J01) expressed in DDDs per 1,000 inhabitants per day by linguistic region in the outpatient setting in Switzerland (2015–2017).
DDD per 1000 inhabitants per day
2017
2016
2015
2017
2016
2015German-speaking part
French-speaking part
Italian-speaking part
2017
2016
2015
0 2 4 6 8 10 12 14 16 18

44 Antibacterial consumption in human medicine
Figure 5. g: Antibiotic classes per age group and overall as a proportion of the total consumption in the outpatient set-ting in Switzerland (2015–2017).
0%
20%
60%
50%
30%
10%
40%
80%
70%
100%
90%
2015 2016
< 2 years
2017 2015 2016
2–11 years 12–17 years 18–64 years > 65 years Overall
2017 2015 2016 2017 2015 2016 2017 2015 2016 2017 2015 2016 2017
OthersGlycopeptides (J01XA)Fluoroquinolones (J01MA)Aminoglycosides (J01GB)Macrolides (J01FA)Sulfonamides (J01E)
Carbapenems (J01DH)Cephalosporins (J01DB-DE)Combinations of penicillins, incl. beta-lactamase inhibitors (J01CR)Penicillins with extended spectrum (J01CA)Tetracyclines (J01AA)
(–12 %). We observed a higher proportion of fluoroquinolo-nes in the Italian-speaking part of Switzerland (15 %) than in the German- (13 %) and French-speaking parts (10 %) in 2017.
5.2.4 Antibiotic consumption in the outpatient setting by antibiotic class using PharmaSuisse dataset
Penicillins with an extended spectrum (namely amoxicillin) were especially used in children aged less than two years (69 % of penicillin consumption in 2017), whereas penicillins associated with beta-lactamase inhibitors were the most frequently used penicillins in the other age groups (2–11 years: 45 %; 12–17: 64 %; 18–64: 77 %; > 65: 82 %) (Fig-ure 5. g). Penicillins with an extended spectrum (amoxicillin) and penicillins associated with beta-lactamase inhibitors (amoxicillin-clavulanic acid) represented 85 % of the total antibiotic consumption in patients less than 2 years old (2–11 years: 77 %; 12–17: 46 %; 18–64: 42 %; > 65: 39 %). Tetracy-clines (limecycline and minocycline) were especially used in patients between 12 and 17 years of age (26 % of their total antibiotic consumption). Seniors aged 65 and over were rel-atively high consumers of fluoroquinolones (18 % of their total antibiotic consumption). Nitrofurantoin and fosfomycin represented resp. 8 % and 1 % of the total antibiotic con-sumption in patients aged 65 and over in 2017.
5.3 DiscussionIn Swiss acute care hospitals, total antibiotic consumption increased from 53.6 to 62.2 DDDs per 100 bed-days be-tween 2007 and 2017, whereas it was relatively stable when expressed in DDDs per 100 admissions. This discrepancy can be explained by an increasing number of admissions and a decreasing number of bed-days in hospitals due to shorter length of hospital stays. Expressed in DDDs per 1,000 in-habitants per day, the total antibiotic consumption (1.3) was lower than the median (2.1) obtained in the European Sur-veillance of Antimicrobial Consumption Network (ESAC-Net) [3]. The most commonly used class of antibiotics was the penicillins (ATC Code J01C), followed by the other be-ta-lactam antibacterials, including cephalosporins (ATC Code J01D) and quinolones (ATC Code J01M).
In the outpatient setting, the total consumption of antibiotics for systemic use was 10.7 DDDs per 1,000 inhabitants per day in 2017, which was lower than observed in countries participating in the European Surveillance of Antimicrobial Consumption Network (ESAC-Net) [3]. It is to note that the dataset used to measure the total antibiotic consumption differs between the Swiss Antibiotic Resistance Report 2016 (data from pharmacies only) and this report (data from pharmacies and self-dispensing physicians), which explains the difference in use between those reports. The most com-

Antibacterial consumption in human medicine 45
monly used class of antibiotics was the penicillins (ATC Code J01C), followed by the macrolides, lincosamides and streptogramins (ATC Code J01F), the tetracyclines (ATC Code J01A) and the quinolones (ATC Code J01M). The rela-tive consumption of fluoroquinolones and penicillins, includ-ing beta-lactamase inhibitors, remained relatively high in comparison with countries participating in the ESAC-Net. The German-speaking part of Switzerland had lower antibi-otic consumption than the Italian-speaking and French- speaking parts.
Our methodology has several limitations [4, 5]. The DDD methodology allows comparisons between hospitals or countries, but it may inaccurately reflect the dosages cho-sen in some of them, thus limiting the qualitative appraisal of different prescribers’ profiles [6]. Concerning the inpa-tient setting, a sentinel network like anresis.ch, which is based on voluntary participation of hospitals in Switzerland, is a surveillance system comprising a non-exhaustive group of hospitals. Nevertheless, the high proportion of all Swiss acute care hospitals included in our surveillance suggests that the data are representative. In this report, we express the antibiotic consumption mostly in DDDs per 100 bed-days rather than per admission for the inpatient setting. The definition of bed-days has been set by the Federal Statistical Office, while the number of admissions is not an official in-dicator and can be subject to different interpretations among hospitals.
References
[1] European Centre for Disease Prevention and Control. Antimicrobial consumption. In: ECDC. Annual Epidemi-ological Report for 2016. Downloadable tables. Stock-holm: ECDC; 2018. Available from: https://ecdc.europa.eu/en/publications-data/down-loadable-tables-antimicrobial-consumption-annual-epi-demiological-report-2016
[2] Coenen S, Ferech M, Haaijer-Ruskamp FM, Butler CC, Vander Stichele RH, Verheij TJ, et al. European Surveil-lance of Antimicrobial Consumption (ESAC): quality indicators for outpatient antibiotic use in Europe.Qual Saf Health Care. 2007; 16(6):440–445.
[3] European Centre for Disease Prevention and Control. Summary of the latest data on antibiotic consumption in EU. Stockholm: ECDC; 2018. Available from: https://ecdc.europa.eu/en/publications-data/summa-ry-latest-data-antibiotic-consumption-eu-2017
[4] Filippini M, Masiero G, Moschetti K. Socioeconomic determinants of regional differences in outpatient antibiotic consumption: Evidence from Switzerland. Health Policy. 2006; 78(1):77–92.
[5] Plüss-Suard C et al. Hospital antibiotic consumption in Switzerland: comparison of a multicultural country with Europe. J Hosp Inf 2011; 79(2):166 –171.
[6] de With K et al. Comparison of Defined versus Recom-mended versus Prescribed Daily Doses for Measuring Hospital Antibiotic Consumption. Infection 2009; 37(4):349 –352.

46 Antibacterial consumption in human medicine
TextboxAntibiotic Prescriptions in Outpatient Medical Care
Damir Perisa1
1Federal Office of Public Health FOPH, Division Communicable Diseases, Bern
There are only limited data available on practical antibiotic prescriptions in Switzerland, especially regarding the attitude of the treating practitioner. Between 2006 and 2013, a study took place in the Sentinella Network (www.sentinella.ch), a co-project of dedicated general practitioners, the Federal Office of Public Health and the university institutes for fam-ily medicine, antibiotic prescriptions were surveyed. This study was resumed in 2017 to compare the present practice to the trend observed at that time.
The principal observation during the first study was that the amount of prescribed antibiotics per consultation and popu-lation remains stable whereas the relative proportion of pre-scriptions for the group of penicillin antibiotic as well as the “other” antibiotic increased over time.
Encouragingly, the number of prescriptions per 1,000 con-sultations (29) as well as per 100,000 inhabitants (10,400) were significantly lower in 2017 compared to the period of the old study (34–40 per 1,000 consultations respectively 14,000–16,000 per 100,000 inhabitants). As expected, the antibiotic groups of penicillines, macrolides, trimethop-rim-sulfamethoxazone, the old Fluoroquinolones and fosfo-mycin were dominating. If the decreasing trend will continue or not will be revealed in the following years.
0
1,000
3,000
2,500
1,500
500
2,000
3,500
4,000
stre
p-an
gina
otitis
med
iasin
usitis
uppe
r airw
ays
acut
e br
onch
itis
chro
nic o
bstru
ctive
pulm
onar
y dise
ase
pneu
mon
iaup
per u
rinar
y tra
ct
lower
urin
ary t
ract
gast
roint
estin
al, g
allbla
dder
skin,
soft
tissu
ebo
nes,
joint
s
sexu
ally t
rans
mitt
ed in
fect
ions
gyn
infec
tions
invas
ive in
fect
ions
othe
r
PenicillinCephaloposrines Gen 3+4Fluoroquinolones, newerAntifungalsß-Lactam/ß-LactamaseInhibitorMacrolides Reserve/Wide spectrum
FosfomyeinOtherAminopenicillinsTrimethoprim + SulfamethoxazoleNitrofurans
Cephalosporines Gen 1+2Fluoroquinolones, olderTetracycline
Figure 1: Antibiotic prescriptions 2017 by indication and antibiotic group, expressed in number of prescriptions per 100,000 inhabitants.

6Sales of antimicrobials in veterinary medicine

48 Sales of antimicrobials in veterinary medicine
Sales (kg) 2008 2009 2010 2011 2012 2013 2014 2015 2016 2017
Oral 55,132 51,993 50,143 46,476 42,005 38,756 34,697 30,015 26,113 21,033
Premix 48,794 45,714 44,125 40,606 36,181 33,021 29,079 24,336 20,621 16,845
Others* 6,338 6,279 6,017 5,871 5,824 5,735 5,618 5,679 5,492 4,188
Intramammary 4,505 4,015 3,595 3,734 3,655 3,482 3,375 3,193 2,672 2,753
Dry cow products 1,439 1,291 1,209 1,323 1,315 1,336 1,343 1,064 918 824
Lactating cow products 3,066 2,724 2,386 2,411 2,340 2,146 2,033 2,129 1,754 1,930
Parenteral 8,986 8,537 8,356 8,431 8,200 7,876 7,724 7,934 8,580 7,631
Intrauterine 870 870 905 857 815 767 864 719 726 612
Topical/external 337 291 306 350 318 296 290 286 287 298
Sprays 241 253 280 321 299 278 272 270 271 284
Others** 96 38 27 30 18 18 19 16 16 15
Total 69,830 65,705 63,305 59,849 54,992 51,176 46,950 42,147 38,377 32,327
* Tablets, capsules, powders, suspensions, granules ** Ointments, drops, gels
6.1 Sales of antimicrobials for use in animals
The sales of antimicrobials are in a constant decline (Ta-ble 6. a.). In 2016, a total of 38,377 kg of antimicrobials (–9 %) were sold, as compared to 32,327 kg in 2017 (–15.8 %). This amounts to a decline of 53 % (37,503 kg) since 2008. The
6 Sales of antimicrobials in veterinary medicine
Sales (kg)
2008 2009 2010 2011 2012 2013 2014 2015 2016 2017
Sulfonamides 29,129 27,261 25,696 23,123 21,556 18,942 17,009 14,959 13,130 10,181
Penicillins 11,275 10,698 11,272 11,516 11,055 10,930 10,389 10,057 9,694 9,111
Tetracyclines 16,719 15,559 14,749 13,737 12,043 11,631 10,402 8,683 8,177 6,856
Aminoglycosides 3,721 3,573 3,222 3,324 3,207 3,124 3,125 3,104 2,997 2,471
Macrolides 4,287 4,026 3,828 3,551 3,369 3,166 2,858 2,680 1,988 1,594
Trimethoprim 1,858 1,752 1,704 1,549 1,368 1,148 1,102 904 829 591
Polymyxins 1,577 1,544 1,489 1,454 1,058 855 773 503 372 328
Cephalosporins 501 520 568 565 542 530 522 495 431 381
Fluoroquinolones 433 427 415 394 359 413 404 407 304 228
Amphenicoles 253 271 258 284 232 202 188 217 273 378
Others* 139 135 165 477 318 343 274 227 182 210
Total 69,830 65,705 63,305 59,849 54,992 51,176 46,950 42,147 38,379 32,327
* Imidazoles, nitrofurans, pleuromutilins, lincosamides, polypeptides excluding polymyxins (until 2013), steroidal antibiotics, quinolones (until 2014)
Table 6. a: Sales of antibiotic classes between 2008 and 2017.
decrease is mainly due to a fall in sales of medicated premix-es.The sales rankings of the various classes of antibiotics re-mained unchanged: sulfonamides come in first place, fol-lowed by penicillins and tetracyclines. These three classes are often sold as medicated premixes.
The quantity of antibiotics approved only for companion an-
Table 6. b: Sales of antimicrobials according to the administration route in 2008–2017.

imals comprises 2.5 % of the total volume.An error was identified for the conversion factor of all prod-ucts containing benzathine penicillin and procaine penicillin. This led to an overestimation of sold penicillins of around 20 % (about 2,000 kg) in the previous reports. The data has been corrected and is published correctly since 2015.
Regarding the highest-priority critically important antibiotic classes for human medicine [1], the sales of macrolides have decreased by 25 % in 2016 and another 20 % in 2017. Also, fluoroquinolones were sold less frequently. The sales de-clined by 21 % in 2016 and by 25 % in 2017. The sales of cephalosporins (3th /4th generation) decreased by about 23 % in 2016 as well as in 2017.
Active ingredient groups are listed individually only if at least three different products from three different marketing au-thorization holders are licensed. All others are summarized in the category ”Others.“
The distribution of antimicrobials according to the adminis-tration route remained unchanged compared to previous years (Table 6. b). The biggest sales volumes are for prod-ucts licensed for oral application (2016: 68 %, 2017: 65 %), followed by parenteral (2016: 22 %, 2017: 23 %), intramam-mary (2016: 7 %, 2017: 9 %), intrauterine (2 %) and topical formulations (1 %). Products authorized for oral application were mainly sold in the form of premixes.
6.2 Sales of antimicrobials for use in livestock animals
6.2.1 General
The sales amount of antimicrobials for livestock animals in-cludes products approved for livestock animals and products approved for livestock and companion animals (mixed regis-
trations). This is in accordance with the procedure used by the ESVAC project [2]. The amount has decreased continu-ously since 2008 (–54 %). Sulfonamides account for the bulk of agents, followed by penicillins and tetracyclines. Also, in livestock, the highest-priority critically important antibiotics were sold less often than before 2016. The sales of mac-rolides have decreased by more than 20 % in both years (2016 and 2017) (Table 6. c). Even the sales of long-acting, single-dose injection products show a downward trend. The turnover of amphenicols, reported since 2013, has increased in the last two years (2016: +22 %; 2017: +39 %). The sales of fluoroquinolones and third- and fourth- generation cepha-losporins started decreasing in 2016, approximately 20 % each year. A possible explanation for this positive develop-ment is the revision of the Ordinance on Veterinary Medici-nal Products, which came into effect in April 2016. Since then, administration of critical antimicrobials such as mac-rolides, fluoroquinolones and 3rd /4th generation cephalo-sporins to livestock is prohibited to be given for stock.
The sales of colistin have declined by approximately 79 % since 2008. Expressed in correlation to the biomass under exposure (population correction unit, PCU; see Chapter 6.2.2), the level is 0.4 mg colistin / PCU for Switzerland. This is below the European average and in line with the request-ed reduction of colistin to a level of 1 mg/PCU or below for European countries in order to maintain its efficacy in the treatment of severe infections in humans.
6.2.2 Antimicrobial sales in relation to the livestock population weight (Population Correction Unit Method)
The amount of sales of antimicrobials depends on the size of the animal population. To compare sales in individual coun-tries and across countries, the ESVAC project (European Sur-veillance of Veterinary Antimicrobial Consumption, EMA) developed a method to express antimicrobial sales corre-
Sales of antimicrobials in veterinary medicine 49
Table 6. c: Sales of different antibiotic classes licensed for livestock animals between 2008 and 2017.
Sales (kg)
2008 2009 2010 2011 2012 2013 2014 2015 2016 2017
Sulfonamides 29,088 27,231 25,672 23,118 21,556 18,942 17,009 14,959 13,130 10,181
Penicillins 10,827 10,226 10,793 11,023 10,582 10,437 9,893 9,573 9,249 8,644
Tetracyclines 16,704 15,546 14,746 13,731 12,038 11,626 10,398 8,679 8,172 6,851
Aminoglycosides 3,688 3,549 3,215 3,317 3,199 3,115 3,114 3,095 2,988 2,462
Macrolides 4,265 4,003 3,806 3,459 3,289 3,089 2,784 2,610 1,967 1,574
Trimethoprim 1,854 1,749 1,702 1,548 1,368 1,148 1,102 904 829 591
Colistin 1,577 1,543 1,489 1,454 1,057 854 773 502 372 327
Fluoroquinolones 408 403 388 371 335 384 379 384 282 207
Cephalosporins 169 203 237 249 237 228 241 234 190 163
Amphenicoles – – – – – 183 169 199 244 341
Others* 263 271 303 616 449 310 241 197 152 181
Total 68,843 64,723 62,350 58,886 54,111 50,316 46,103 41,337 37,575 31,521
* Pleuromutilins, lincosamide, quinolones, amphenicoles (until 2012)

primarily due to a smaller livestock population. It can be as-sumed that the reduction in sales is most probably due to a reduction in the number of treatments performed. The ef-forts made in the framework of the national strategy on an-tibiotic resistance (StAR) [4] in Switzerland seem to have a positive effect on the awareness of veterinarians and farm-ers using antimicrobials in Switzerland.
6.2.3 Medicated premixes
Medicated premixes accounted for 53 % of the total sales in 2016 and 52 % in 2017. A steady decrease in sales of medi-cated premixes has been observed since 2008 (–66 %). Sul-fonamides, tetracyclines and penicillins are the three main classes of active ingredients contained in premixes (Ta-ble 6 d). This reduction is the main reason for the decrease in the sales of antimicrobials.
lated to the weight of an animal livestock population [2]. The amount of active ingredients is divided by the estimated most likely weight at treatment (population correction unit, PCU). Companion animals are not taken into account, as the number is unknown in many countries. PCU is a technical unit of measurement and consists of the number of live (dairy cows, sheep, sows, horses) and slaughtered animals (cattle, pigs, lambs, horses, poultry, turkeys) in the corresponding year multiplied by the estimated weight at the time of treat-ment (expressed in kg). Imports and exports of live animals are also taken into account. Figure 6. a shows the normaliza-tion of antimicrobial sales for livestock animals in Switzerland using the PCU method for the years 2008 to 2017.
The figure shows decreasing sales of antimicrobials in the last ten years, despite a relatively steady population bio-mass. The reduction of milligram active ingredients per PCU indicates that the decrease of sales of antimicrobials is not
50 Sales of antimicrobials in veterinary medicine
Table 6. d: Sales of antimicrobials licensed as premixes from 2008 to 2017, according to antibiotic class.
Sales (kg)
2008 2009 2010 2011 2012 2013 2014 2015 2016 2017
Sulfonamides 23,075 21,412 20,236 17,788 16,319 13,931 12,141 10,028 8,285 6,450
Tetracyclines 15,008 13,880 12,983 12,006 10,359 9,968 8,673 7,038 6,382 5,174
Penicillins 3,874 3,836 4,610 4,722 4,309 4,461 4,198 3,840 3,363 3,001
Macrolides 3,782 3,624 3,420 3,078 2,907 2,751 2,413 2,263 1,696 1,417
Colistin 1,544 1,525 1,472 1,438 1,045 844 763 500 370 326
Trimethoprim 1,399 1,320 1,249 1,124 937 740 626 453 373 322
Others* 111 118 156 450 305 326 265 215 151 156
Total 48,794 45,714 44,125 40,606 36,181 33,021 29,079 24,336 20,621 16,845
* Pleuromutilins, fluoroquinolones, lincosamide, aminoglycosides, quinolones (until 2014)
0
10
20
30
40
50
60
70
80
90
700
720
740
760
780
800
820
840
796
80
64
2006
799
85
68
2007
806
86
69
2008
809
80
65
2009
818
76
62
2010
817
72
59
2011
815
66
54
2012
809
62
50
2013
817
56
46
2014
787
41
32
2017
805
47
38
2016
Active ingredients [mg] / PCU [kg]
Population biomass (total PCU) [1,000 t]
Antimicrobial sales for livestock animals [t]
2015
807
51
41
Figure 6. a: Antimicrobial sales for livestock animals in the years 2008–2017 compared to the population biomass (total PCU) and the sales of active ingredients per PCU.

products for use during lactation increased slightly (Figure 6. b). The distribution by antibiotic classes shows that penicil-lins are predominant, accounting for 80 % of all active ingre-dients administered into the udder (Table 6. e). Sales of prod-ucts containing cephalosporins for the treatment of mastitis during lactation have been increasing slightly since 2014.
6.3 Sales of antimicrobials licensed for companion animals
The quantity of antibiotics approved exclusively for use in companion animals amounts to approximately 2,5 % of the total volume. Since 2012, products licensed for both live-stock and companion animals are added to the category
Medicated premixes are available in several combinations of active ingredients: products containing a single active ingre-dient, two active ingredients (usually a sulfonamide com-bined with trimethoprim) or three active ingredients (a tetra-cycline combined with a sulfonamide and a macrolide).
6.2.4 Antimicrobials authorized for intramammary use
The sales of products for intramammary use showed a de-crease in 2016 (–18 %), whereas in 2017 the sales increased slightly (3 %). Nevertheless, since 2008, sales have been re-duced by nearly 40 %. Two thirds of all antimicrobials licensed for intramammary use are products for the treatment of mas-titis during lactation, and one third are products for drying off. In the past two years, the sales of the latter products have in average decreased by 12 %, whereas in 2017 the sales of
Sales of antimicrobials in veterinary medicine 51
Table 6. e: Sales of antimicrobials licensed for intramammary use in 2008–2017 according to antibiotic class.
0
1,000
2,000
3,000
4,000
5,000
2008 2009 2010 2011 2012 2013 2014 2015 2016 2017
Dry cow productsTotal Products for use during lactation
Figure 6. b: Sales of antimicrobials (in kg) licensed for intramammary use in 2008–2015 separated into dry cow products and products for use during lactation.
Sales (kg)
2008 2009 2010 2011 2012 2013 2014 2015 2016 2017
Dry cow products
Total 1,439 1,291 1,209 1,323 1,315 1,336 1,343 1,064 918 824
Products for use during lactation
Penicillins 2,326 2,052 1,785 1,813 1,774 1,644 1,545 1,652 1,366 1,543
Aminoglycosides 558 492 445 436 406 376 370 361 275 292
Cephalosporine 35 51 56 60 55 52 56 59 60 59
Others** 147 129 101 102 104 74 62 57 53 36
Total 3,066 2,724 2,386 2,411 2,340 2,146 2,033 2,129 1,754 1,930
Total 4,505 4,015 3,595 3,734 3,655 3,482 3,376 3,193 2,672 2,754
** Lincosamides, macrolides, polymyxins

“livestock animals,” in accordance with the guidelines of the ESVAC project [2]. This is especially relevant for active ingre-dients for parenteral application, as most of these products are licensed for both livestock and companion animals. The consequence is a slight underestimation of the use in com-panion animals.
The amount sold for companion animals in 2017 was 806 kg, slightly more than in 2016 (+0.4 %). Nonetheless, the antimi-crobial sales for companion animals has decreased about 18 % (–182 kg) since 2008. Penicillins were the most impor-tant active ingredient group, followed by cephalosporins and fluoroquinolones (Table 6. f). The slightly decreasing trend of sales of cephalosporins has continued during the past two years (2016: –8 %; 2017: –10 %).
6.4 DiscussionThere is a constant increase of awareness in veterinarians as well as in farmers. The decrease in the volume of antimicro-bials sold for use in veterinary medicine is ongoing since 2008. This is mainly due to a fall in the sales of medicated premixes. However, the prohibition of selling critical antimi-crobials for stock since April 2016 has also supported the decrease within the last years. Especially the significant de-cline in sales of highest-priority critically important antibiotic classes is encouraging. The reduction of milligram active ingredients per PCU indicates that the reason for the de-crease is most likely a reduced number of treatments. How-ever, the data should be interpreted cautiously as they are based on sales figures only. Relevant information about tar-get species (livestock animals, companion animals, mixed), route of administration (parenteral, oral, topical/external, in-trauterine, intramammary) and galenics are solely based on the marketing authorization (summary of product character-istics). Therefore, the report does not contain any data re-garding effective use at the species level. Different dosages for different antibiotic classes and target species are not taken into account and can differ widely. Various potencies of antimicrobials can only be corrected using standardized daily doses (in keeping with the defined daily doses [DDD] used in human medicine). Therefore, ESVAC has recently published technical units of measurements to report antimi-
crobial consumption data in animals [5]. Defined daily doses for animals (DDDvet) and defined course doses for animals (DCDvet) take into account differences between species and substances as well as treatment duration.
Information about treatment intensities, i.e. the number of animals treated in relation to a given population, can only be provided by data at the veterinary or farm level. These data are currently not available in Switzerland. To establish a cor-relation with the development of resistance to antimicrobi-als, the reduction of total volumes of antimicrobials sold is less relevant than the number of treatments per animal or the number of animals treated per unit of time. A system to collect veterinary prescription data will be available in 2019. The recording of prescription data is crucial to better target measures for prevention and prudent use, and to follow up on their effects.
References
[1] WHO Advisory Group on Integrated Surveillance of Antimicrobial Resistance (AGISAR). Critically Important Antimicrobials for Human Medicine. 5th revision, 2017
[2] European Medicines Agency, European Surveillance of Veterinary Antimicrobial Consumption, 2015. Sales of veterinary antimicrobial agents in 29 EU/EEA countries in 2015 (EMA/61769/2016)
[3] European Medicines Agency 2016. Updated advice on the use of colistin products in animals within the European Union: development of resistance and possible impact on human and animal health (EMA/231573/2016)
[4] Swiss Confederation 2015. Strategy on Antibiotic Resistance Switzerland
[5] European Medicines Agency, European Surveillance of Veterinary Antimicrobial Consumption, 2016 Defined daily doses for animals (DDDvet) and defined course doses for animals (DCDvet) (EMA/224954/2016)
52 Sales of antimicrobials in veterinary medicine
Table 6. f: Sales of antibiotic classes licensed for companion animals in 2008–2017.
Sales (kg)
2008 2009 2010 2011 2012 2013 2014 2015 2016 2017
Penicillins 385 412 417 438 415 438 450 443 446 467
Cephalosporins 332 317 331 316 304 302 281 262 241 217
Fluoroquinolones 25 24 27 23 24 29 25 23 22 21
Aminoglycosides 33 24 7 7 8 9 10 9 10 9
Sulfonamides* 41 30 24 5 - - - - - -
Others** 171 174 148 173 129 82 81 74 85 92
Total 988 982 955 962 881 860 847 810 804 806
* No licensed products since 2012 ** Imidazoles, nitrofurans, polypeptides, steroidal antibiotics, tetracyclines, trimethoprimes, amphenicoles, macrolides, lincosamides

Sales of antimicrobials in veterinary medicine 53
TextboxAntibiotic Substances in the Water Cycle
Christian Götz1, Christa S. McArdell2, Miriam Reinhardt3, Saskia Zimmermann-Steffens3
1 WWEA: Office of Waste, Water, Energy and Air, Zurich 2 Eawag, Swiss Federal Institute of Aquatic Science and Technology, Dübendorf 3 FOEN, Federal Office for the Environment, Bern
Antibiotics are used in high quantities in veterinary and hu-man medicine. In 2016, approximately 38,000 kg of veteri-nary antibiotics, mainly sulfonamides, penicillins, and tetra-cyclines, were distributed in Switzerland with a decreasing trend as compared to the previous years (SARR 2018). Con-sumption data of human antibiotics are harder to obtain but are in the same order of magnitude, while penicillins, fluoro-quinolones and sulfonamides are used in highest quantities (Singer et al., 2016). After intake by animals and humans, antibiotics are partly excreted unchanged, thereafter finding their way into the aquatic environment. Municipal wastewa-ter treatment plants (WWTPs) were found to be the major discharge point for antibiotics, mainly resulting from domes-tic consumption and excretion by humans. In conventional wastewater treatment, antibiotics, like other polar micropol-lutants, are only partly removed and are discharged into the receiving waters. It was shown that concentrations of anti-biotics in Swiss rivers can be precisely predicted with a mass flow model which takes into account the consumption of antibiotics, their excretion rate, their elimination in waste-water treatment and the water flow in rivers (Kuroda et al., 2015). Through river bank filtration, antibiotics can also reach groundwater.
Figure 1 shows concentrations of three antibiotics analyzed in the canton of Zurich in samples of wastewater treatment plant effluents, in river water and in groundwater. Sulfameth-oxazole, ciprofloxacin and clarithromycin were detected in the highest concentrations (up to 600 ng/L in the WWTP effluents), while concentrations in river water were one or-der of magnitude lower due to dilution. In groundwater, only sulfamethoxazole was found above the limit of detection (LOD 10 ng/L).
A nationwide record of antibiotics in Swiss groundwater is provided by the NAQUA National Groundwater Monitoring (FOEN 2018). Since 2013, the antibiotic sulfamethoxazole is analyzed at all the approximately 550 NAQUA monitoring sites, which are operated by the Federal Office for the Envi-ronment FOEN in close collaboration with the cantonal au-thorities. The specific focus on this antibiotic is due to the results of two pilot studies, which were realized in 2004/2005, and 2007/2008 respectively, on more than 80 pharmaceuticals as well as 200 micropollutants (“screen-ing”). According to its persistence during bank filtration, sul-famethoxazole proved to be the antibiotic most frequently detected in groundwater. In 2014, sulfamethoxazole ap-peared at 7 % of all NAQUA monitoring sites. Concentra-tions were low and did not exceed 100 ng/L.
Further indicators of wastewater, such as the artificial sweetener acesulfame or the dishwashing additive benzotri-azole, were detected more frequently and at higher concen-trations in groundwater. Overall, wastewater indicators ap-peared at more than one third of all NAQUA monitoring sites, indicating that wastewater is an important source of synthetic chemicals in groundwater.
Most of the affected NAQUA monitoring sites are located close to streams and rivers containing a significant amount of treated wastewater. Wastewater in these rivers often ex-ceeds 5 % of water discharge. Although an important part of the wastewater-derived substances is degraded or sorbed to clay and silt particles during riverbank filtration, another part may be transferred with the infiltration water into the groundwater of adjacent gravel bed aquifers. Especially sub-stances with low degradation and low sorption potential, such as the antibiotic sulfamethoxazole, are relevant and affect groundwater quality at larger scales.
Whether high concentrations of antibiotics in the water cycle directly promote the development of antibiotic resistances (see also Textbox “Antibacterial Resistance in the Aquatic Environment”) in the environment is currently unknown. It has been shown that antibiotic-resistant bacteria preferen-tially develop where large amounts of antibiotics are used. Potential hotspots are hospitals and sites where veterinary pharmaceuticals are applied. The NFP72 project Swiss River

54 Sales of antimicrobials in veterinary medicine
Resistome therefore investigates how antibiotic resistance spreads in water and how stable it is in this medium. Based on the precautionary principle, inputs of antibiotics into the environment and the water cycle should be mini-mized as far as possible. In Switzerland, selected wastewa-ter treatment plants will be upgraded by 2040 in order to eliminate a broad spectrum of micropollutants, including antibiotics. With this upgrade, the discharge of micropollut-ants into surface waters will be reduced by two thirds. Groundwater, which is the most important drinking water source in Switzerland, will benefit from these improvements as well.
References[1] Federal Office of Public Health and
Federal Food Safety and Veterinary Office (2016) Swiss Antibiotic Resistance Report 2016. Usage of
Antibiotics and Occurrence of Antibiotic Resistance in Bacteria from Humans and Animals in Switzerland. FOPH publication number: 2016-OEG-30
[2] FOEN. Federal Office for the Environment (2018) NAQUA National Groundwater Monitoring. www.bafu.admin.ch/naqua.
[3] Kuroda K., Itten R., Kovalova L., Ort C., Weissbrodt D., McArdell C.S. (2016) Hospital-use pharmaceuticals in Swiss waters modeled at high spatial resolution. Env. Sci. Technol., 50, 4742−4751.
[4] Singer H.P., Wössner A.E., McArdell C.S., Fenner K. (2016) Rapid screening for exposure to “non-target” pharmaceuticals from wastewater effluents by com-bining HRMS-cased suspect screening and exposure modeling. Env. Sci. Technol. 50, 6698−6707.
Figure 1: Concentration of the antibiotics sulfamethoxazole, ciprofloxacin, and clarithromycin in the effluent of a wastewater treatment plant (WWTP), in river water and in groundwater in a catchment of the canton of Zurich (detection limit 10 ng/L).
100
1,000
Sulfamethoxazole Ciprofloxacin Clarithromycin
WWTP Effluent
River Water
Groundwater
10
Co
nce
ntr
atio
n (
ng
/L)
log
arit
hm
ic s
cale

7Resistance in bacteria
from human clinical isolates

7.1 Escherichia coli
Escherichia coli is the most frequent Gram-negative micro-organism causing bacteremia. It is a colonizer of the intesti-nal tract and as such the most frequent microorganism caus-ing urinary tract infections. As urinary tract infections are (after respiratory tract infections) the second most frequent infectious disease in ambulatory care, increasing resistance trends directly affect the hospital as well as the ambulatory setting.
In 2017, resistance to fosfomycin and nitrofurantoin was still very low (Table 7. a). These antibiotics can only be used for non-invasive urinary tract infections. Therefore, they repre-sent an important option in ambulatory care. In contrast to earlier years, and probably due to classification of these an-tibiotics as first choice options to treat uncomplicated lower urinary tract infections, these antibiotics now are tested in nearly all urinary samples on a routine basis. While fluoro-quinolone non-susceptibility has steadily increased from 10.3 % in 2004 to 20.5 % in 2015, non-susceptibility rates have stabilized during the last two years (20.3 % in 2017).
Whether this is already due to the promotion of ciprofloxa-cin-free antibiotic regimens for uncomplicated lower urinary tract infections has to be analyzed in additional studies. In EU/EAA states, a significant decrease in fluoroquinolone resistance from 22.8 to 21.0 % was observed from 2013 to 2016 [1]. Although non-susceptibility to trimethoprim-sul-famethoxazole is still higher, a decrease was observed from 29.9 % in 2015 to 28 % in 2017, and significant lower rates are observed in urinary samples (22 % in 2017, Figure 7. a). Therefore, trimethoprim-sulfamethoxazol still remains a first-line option in non-invasive ambulatory urinary tract in-fections [2]. Because E. coli is also one of the most impor-tant pathogens in the outpatient setting, we have compared non-susceptibility rates of outpatient urinary samples with invasive samples (Figure 7. a), demonstrating a lower non-susceptibility rate in the outpatient setting for most of the antibiotics tested. Probably these data still overestimate the true non-susceptibility rate in the uncomplicated lower urinary tract infections due to sampling bias [3].
7 Resistance in bacteria from human clinical isolates
56 Resistance in bacteria from human clinical isolates
Escherichia coli (invasive) 2017
West North–East South Total Trend
Antimicrobial n % n % n % n % 95 % CI 4y 10y
Aminopenicillins 1382 53.6 % 3414 48.0 % 357 47.3 % 5153 49.5 % 48.1–50.9 –
Amoxicillin- clavulanic acid
1380 35.8 % 3658 26.5 % 357 17.4 % 5395 28.3 % 27.1–29.5
Piperacillin- tazobactam
1376 8.1 % 3522 7.0 % 357 4.5 % 5255 7.1 % 6.4–7.8 –
Cephalosporin, 2nd gen.
845 18.1 % 3218 20.0 % 356 10.1 % 4419 18.8 % 17.7–20 –
Cephalosporin, 3rd/4th gen.
1382 12.7 % 3665 9.8 % 357 9.2 % 5404 10.5 % 9.7–11.4 –
Carbapenem1 1370 0.1 % 3656 0.1 % 357 0.0 % 5383 0.1 % 0–0.2 – –
Aminoglycosides 1379 12.0 % 3660 9.5 % 357 8.1 % 5396 10.1 % 9.3–10.9
Trimethoprim- sulfamethoxazole
1381 30.1 % 3406 27.5 % 357 25.2 % 5144 28.0 % 26.8–29.3 – –
Fluoroquinolones2 1377 22.0 % 3665 19.6 % 357 20.2 % 5399 20.3 % 19.2–21.4 –
Nitrofurantoin 487 1.4 % 1239 1.0 % 0 – 1726 1.1 % 0.7–1.7
Fosfomycin 739 1.1 % 1523 1.4 % 1 0.0 % 2263 1.3 % 0.9–1.8 – –
West (GE, NE, VD, JU, FR), South (TI), North–East (other cantons) according to linguistic regions.95 % confidence intervals (CI) were calculated by the Wilson score method, calculations of trends were performed by logistic regression.1 Carbapenems: imipenem, meropenem2 Fluoroquinolones: ciprofloxacin, norfloxacin, ofloxacin
Table 7. a: Non-susceptibility rates of invasive Escherichia coli isolates in humans for 2017.

0% 10% 20% 30% 40% 50% 60%
Ampicillin
Amoxicillin-clavulanic acid
Piperacillin-tazobactam
Cephalosporin, 2nd gen.
Cephalosporin, 3rd/4th gen.
Carbapenem
Aminoglycosides
Trimethoprim-sulfamethoxazole
Fluoroquinolones
Nitrofurantoin
Fosfomycin
Invasive
Urine
n=5396
n=5144
n=5399
n=1726
n=2263
n=50328
n=53697
n=54168
n=52812
n=52555
n=5153**
n=5395**
**
n=5255**
**
**
**
**
n=4419
n=5404
n=5383
n=51910
n=54157
n=48910
n=48573
n=52589
n=50504
0%
10%
20%
30%
40%
50%
60%
2008 2009 2010 2011 2012 2013 2014 2015 2016 2017
Ampicillin
Amoxicillin-clavulanic acid
Piperacillin-tazobactam
Cephalosporin, 2nd gen.
Cephalosporin, 3rd/4th gen.
Carbapenem
Aminoglycosides
Trimethoprim-sulfamethoxazole
Fluoroquinolones
Nitrofurantoin
Fosfomycin
Figure 7. a: Comparison of non-susceptibility rates in invasive versus outpatient urinary samples in Escherichia coli isolates in humans for 2017.
Figure 7. b: Non-susceptibility rates in invasive Escherichia coli isolates in humans between 2008 and 2017.
Resistance in bacteria from human clinical isolates 57
As for quinolones, the steadily increasing non-susceptibility rates to 3rd/4th generation cephalosporins from 0.9 % in 2004 to 11.0 % in 2015 has stabilized at 10.5 % in 2017. In EU/EAA states, a slight decrease from 13.1 % to 12.4 % was observed between 2013 and 2016. Whether these trends will persist has to be observed in future. For Switzerland, a more detailed analysis of the recent trends since 2013 is planned for different settings. Non-susceptibility rates for aminoglycosides and piperacillin-tazobactam have also sta-bilized since 2015, which, at least in part, could be attributa-ble to cross-resistance. Multiresistance is frequent. Howev-
er, only a slight increase for E. coli isolates resistant to two to five antibiotic groups was observed during the last ten years (Table 7. b, Figure 7. c).
Carbapenem-resistance in E. coli is still very rare (0.1 %) and comparable to the EU/EAA states (<0.1 % on average in 2016). Nevertheless, increasing rates of carbapenem-pro-ducing Enterobacteriaceae (CPE) around the world are alarming. In order to survey these trends more accurately, knowledge regarding the genetic mechanisms is indispen-sable, therefore, the Federal Office of Public Health has in-
n=number of isolates tested with error bars indicating 95 % confidence intervals. Fisher Exact Tests were performed to assess for independence: * =p-value <0.05; **= p-value <0.01.

58 Resistance in bacteria from human clinical isolates
Table 7. b: Non-susceptibility combinations in invasive E. coli isolates in humans 2017. Only isolates tested against all five antibiotic groups (aminopenicillins, third-generation cephalosporins, carbapenems, aminoglycosides, fluoro-quinolones) were considered (n=5119/5405 [94.7 %]).
Resistance patterns Number of isolates % of total
Fully susceptible 2373 46.4 %
Single resistance (to indicated antimicrobial group)
Total (all single resistance types) 1631 31.9 %
Aminopenicillins 1436 28.1 %
Fluoroquinolones 166 3.2 %
Aminoglycosides 29 0.6 %
Resistance to two antimicrobial groups
Total (all two-group combinations) 585 11.4 %
Aminopenicillins + fluoroquinolones 356 7.0 %
Aminopenicillins + third-generation cephalosporins 117 2.3 %
Aminopenicillins + aminoglycosides 98 1.9 %
Other antimicrobial group combinations 14 0.3 %
Resistance to three antimicrobial groups
Total (all three-group combinations) 335 6.5 %
Aminopenicillins + third-generation cephalosporins + fluoroquinolones 174 3.4 %
Aminopenicillins + fluoroquinolones + aminoglycosides 126 2.5 %
Aminopenicillins + third-generation cephalosporins + aminoclycosides 34 0.7 %
Aminopenicillins + third-generation cephalosporins + carbapenems 1 0.0 %
Resistance to four antimicrobial groups
Total (all four-group combinations) 194 3.8 %
Aminopenicillins + third-generation cephalosporins +aminoglycosides + fluoroquinolones 194 3.8 %
Resistance to five antimicrobial groups
Aminopenicillins + third-generation cephalosporins + fluoroquinolones + aminoglycosides + carbapenems
1 0.0 %
Figure 7. c: Multiresistance in invasive E. coli isolates in humans between 2008 and 2017 (for details refer to Table 7. b).
Fully susceptibleNon-susceptibility to two antibiotic groupsNon-susceptibility to four antibiotic groups
Non-susceptibility to one antibiotic groupNon-susceptibility to three antibiotic groupsNon-susceptibility to five antibiotic groups
2017
2016
2015
2014
2013
2012
2011
2010
2009
2008
0% 10% 20% 30% 40% 50% 60% 70% 80% 90% 100%

troduced an obligation to report CPE starting 1.1.2016. In combination with data from earlier years, collected by the Swiss Society for Microbiology since 2013, we were able to perform a first more detailed analysis for this report (see Textbox: “Temporal and Regional Prevalence of Carbapene-mase-Producing Enterobacteriaceae from 2013 to 2017 in Switzerland”). As the determination of the genotype is be-coming more and more complex, it was decided that in fu-ture all CPE isolates will be sent to the NARA for more de-tailed analyses (see Textbox: “The National Reference Center for Emerging Antibiotic Resistance (NARA).”
Colistin, a rather toxic reserve antibiotic belonging to the pol-ymyxin group, might in future become more important as a “last resort antibiotic” for carbapenemase-producing Gram-negatives. So far, colistin resistance is very rare in Switzerland (see Textbox: “Mcr-1 Based Colistin Resist-ance: Filling Knowledge Gaps in View of the Spread of Plas-mid-Mediated Colistin Resistance in Switzerland”, Chapter 9), but reports from China, describing a mobile plasmid en-coding a colistin resistance gene (mcr-1), are worrisome [4]. Currently, algorithms for testing and reporting colistin re-sistance in Switzerland are under development.
Resistance in bacteria from human clinical isolates 59
TextboxTemporal and Regional Prevalence of Carbapenemase-Producing Enterobacteriaceae from 2013 to 2017 in Switzerland
Alban Ramette1
1 Institute for Infectious Diseases, University of Bern, Bern
Increasing rates of carbapenemase-producing Enterobacte-riaceae (CPE) have been observed in Europe and all over the world. CPE represent a great concern because of their broad resistance to multiple antibiotics, which considerably re-duces therapeutic options.
From 2016 onwards, CPE have been defined as a notifiable disease by the Swiss Federal Office of Public Health. Before 2016, the Swiss Society for Microbiology defined a network of eight Swiss expert laboratories capable of identifying and characterizing CPE according to EUCAST guidelines. All Swiss microbiology laboratories were asked to send all sus-pected human CPE cases to one of the expert laboratories for characterization of the isolates. Data from 2013 to 2015 (before mandatory reporting) and from 2016 to 2017 were then collected by the Swiss Centre for Antibiotic Resistance anresis.ch and analyzed for temporal and regional trends.
Figure 1: Number of carbapenemase-producing isolates per A) Enterobacteriaceae genus and B) genotypes.

60 Resistance in bacteria from human clinical isolates
7.2 Klebsiella pneumoniae
Klebsiella spp. are frequent colonizers of the gastrointestinal tract. Although they may also occur in the outpatient setting, they are more frequently found in the hospital setting, af-fecting patients with an impaired immune system. Most common sites of infection are the urinary tract and the lung (pneumonia). In contrast to E. coli, they are intrinsically re-sistant to aminopenicillins.
In this report, we only present the data on K. pneumoniae, which is the most frequent species of the genus Klebsiella isolated in human clinical probes. Like in E. coli, increasing
resistance to 3rd/4th generation cephalosporins was the main issue between 2004 (1.3 %) and 2014 (9.9 %), but since then, we have observed a slight decrease to 7.7 % in 2017. This compares favorably with the EU/EEA average of 25.7 % in 2016. As in Switzerland, a significant decrease was ob-served in EU/EEA states from 2013 to 2016, although trends were very different in individual countries [1]. There are con-siderable differences between different Swiss regions (Ta-ble 7. c), with higher non-susceptibility rates in western Switzerland for most antibiotics, including 3rd/4th genera-tion cephalosporins. In contrast, carbapenem non-suscepti-
From 2013 to 2015, the total number of CPE isolates ranged from 65 to 116 per year, and in 2016 and 2017, total CPE numbers were 142 and 114, respectively, indicating a stabi-lization of the number of CPE cases in the last three years. The most frequently isolated species were consistently K. pneumoniae, followed by E. coli (Fig. 1A). The most fre-quently observed carbapenemase genotypes were OXA-48 and OXA-48-like, KPC, and NDM (Fig. 1B). At the regional level, highest CPE numbers were identified in the Geneva and north-eastern regions from 2013 to 2016, where poten-tial regional outbreaks could be identified. Further statistical analyses of risk factors confirmed a slight increase over time of the total number of CPE isolates, higher prevalence in the Geneva region, and more isolates originating from male pa-tients. All types of specimens (blood, respiratory tract, stool, urine, wounds) were associated with high CPE numbers. Sensitivity analyses that included the joint 18 laboratories from 2013 to 2015 and 2016 did not change the observed trends.
Molecular data indicate a high diversity of different carba-penemases, with OXA-48-like, KPC- and NDM-type carba-penemases being the most prevalent in Switzerland. Overall OXA-48-like and NDM producers are increasing only slightly over time, which is in contrast to the situation in neighboring European countries where the increase has been more sub-stantial. Temporal and regional trends were identified, and due to the current mandatory reporting scheme, a continu-ous surveillance of the situation in Switzerland has been achieved.
See related abstract:
Ramette A, Zbinden R, Schrenzel J, Nordmann P, Perisa D, Kronenberg A (2018) Prevalence of carbapenemase-producing Enterobacteriaceae in Switzerland from 2013 to 2017. 28th European Congress of Clinical Microbiology and Infectious Diseases (ECCMID), Madrid, Spain, 21–24 April 2018. www.escmid.org/escmid_publications/escmid_elibrary/material/?mid=62978
TextboxThe National Reference Center for Emerging Antibiotic Resistance (NARA)
Patrice Nordmann1
1 University of Fribourg
At the beginning of 2017, the National Reference Center for Emerging Antibiotic Resistance (NARA) was created by the FOPH at the University of Fribourg, Medical and Molecular Microbiology Department, headed by Prof P. Nordmann (MD, PhD, Spec Microbiology). The aims of this center are multiple: (i) early identification of emerging antibiotic resis-tance traits in Gram-negative and Gram-positive bacteria by using microbiology, biochemistry and genetics, (ii) compari-
son of emerging resistant strains as a source of potential outbreaks, (iii) evaluation of novel antibiotics and novel diag-nostic techniques, and (iv) development of novel rapid diag-nostic tests for emerging antibiotic resistances. NARA con-tributes to the diagnostics of emerging antibiotic resistances in all types of health facilities located in Switzerland (private and public settings). Most of the results are given within 72 hours. Among the recent achievements of the NARA, one may note the first international identification of the plas-mid-mediated MCR-1 polymyxin resistance associated with carbapenemase in Escherichia coli, the identification of the first outbreak of multidrug resistance associating carbapen-emase and pan-drug resistance to aminoglycosides in Kleb-siella pneumoniae, and the development of the first test for a rapid identification (2–3 hours) of polymyxin resistance in Enterobacteriaceae.

Resistance in bacteria from human clinical isolates 61
Figure 7. d: Non-susceptibility rates in invasive Klebsiella pneumoniae isolates in humans 2008–2017.
0%
5%
10%
15%
20%
25%
2008 2009 2010 2011 2012 2013 2014 2015 2016 2017
Amoxicillin-clavulanic acid
Piperacillin-tazobactam
Cephalosporin, 2nd gen.
Cephalosporin, 3rd/4th gen.
Carbapenem
Aminoglycosides
Trimethoprim-sulfamethoxazole
Fluoroquinolones
Table 7. c: Non-susceptibility rates of invasive Klebsiella pneumoniae isolates in humans in 2017.
Klebsiella pneumoniae 2017
AntimicrobialsWest North–East South Total Trend
n % n % n % n % 95 % CI 4y 10y
Amoxicillin-clavulanic acid1 224 21.9 % 686 13.8 % 52 13.5 % 962 15.7 % 13.5–18.1 –
Piperacillin-tazobactam 224 12.9 % 661 9.7 % 52 9.6 % 937 10.5 % 8.7–12.6 –
Cephalosporin, 2nd gen. 160 18.1 % 601 18.0 % 52 11.5 % 813 17.6 % 15.1–20.4
Cephalosporin, 3rd/4th gen. 224 12.1 % 687 6.3 % 52 7.7 % 963 7.7 % 6.2–9.5 –
Carbapenems 224 0.4 % 685 0.1 % 52 1.9 % 961 0.3 % 0.1–0.9 – –
Aminoglycosides 224 8.9 % 687 4.4 % 52 3.8 % 963 5.4 % 4.1–7 –
Trimethoprim-sulfameth-oxazole
224 16.5 % 636 13.8 % 52 15.4 % 912 14.6 % 12.4–17 –
Fluoroquinolones1 223 16.1 % 688 9.6 % 52 17.3 % 963 11.5 % 9.7–13.1 –
1 At least one out of ciprofloxacin, norfloxacin, ofloxacinTrends were modelled with logistic regressions. Arrows represent a significant effect (p<0.05) of the year on the correspondent outcome ( increase, decrease).
West (GE, NE, VD, JU, FR), South (TI), North–East (other cantons) according to linguistic regions.95 % confidence intervals (CI) were calculated by the Wilson score method, calculations of trends were performed by logistic regression.
bility is highest in southern Switzerland, mirroring the car-bapenem resistance in Europe, with rates of 0.4 % in France and very high carbapenem resistance rates in Italy (33.9 % in 2016). While the same trend with maximal non-suscepti-bility rates in 2014 was observed for 2nd generation cepha-losporins and aminoglycosides, this was not the case for amoxicillin-clavulanic acid, trimethoprim-sulfamethoxazol and quinolones, for which non-susceptibility rates are still increasing slightly. No significant trends were observed for
carbapenem resistance, which is still below 1 % in Switzer-land, and therefore much lower than the mean EU/EEA rate of 6.1 % in 2016. First data of a more detailed analysis on carbapenemase producers in Enterobacteriaceae is shown in the Textbox “Temporal and Regional Prevalence of Car-bapenemase-Producing Enterobacteriaceae from 2013 to 2017 in Switzerland”. Co-resistance is frequent, details are shown in Table 7. d and Figure 7. e.

Figure 7. e: Multiresistance in invasive K. pneumoniae isolates in humans from 2008–2017 (for details refer to Table 7. d).
Fully susceptibleNon-susceptibility to two antibiotic groupsNon-susceptibility to four antibiotic groups
Non-susceptibility to one antibiotic groupNon-susceptibility to three antibiotic groups
2017
2016
2015
2014
2013
2012
2011
2010
2009
2008
0% 10% 20% 30% 40% 50% 60% 70% 80% 90% 100%
62 Resistance in bacteria from human clinical isolates
Resistance patterns Number of isolates % of total
Fully susceptible 756 78.8 %
Single resistance (to indicated antimicrobial group)
Total (all single resistance types) 116 12.1 %
Third-generation cephalosporins 78 8.1 %
Fluoroquinolones 31 3.2 %
Aminoglycosides 7 0.7 %
Resistance to two antimicrobial groups
Total (all two-group combinations) 56 5.8 %
Third generation cephalosporin + fluoroquinolones 42 4.4 %
Third-generation cephalosporins + aminoglycosides 7 0.7 %
Aminoglycosides + fluoroquinolones 7 0.7 %
Resistance to three antimicrobial groups
Total (all three-group combinations) 28 2.9 %
Third-generation cephalosporins + aminoglycosides + fluoroquinolones 28 2.9 %
Resistance to four antimicrobial groups
Third-generation cephalosporins + aminoglycosides + fluoroquinolones + carbapenems 3 0.3 %
Table 7. d: Non-susceptibility combinations in invasive K. pneumoniae isolates in humans in 2017. Only isolates tested against all four antibiotic groups (third-generation cephalosporins, carbapenems, aminoglycosides, fluoro-quinolones) were considered (n=959/964 [99.5 %]).

7.3 Pseudomonas aeruginosa
Pseudomonas aeruginosa is a non-fermentative Gram-neg-ative rod and the most important human pathogen in this group of bacteria. P. aeruginosa is one of the leading causes of nosocomial respiratory tract infections and is also found in hospital-acquired urinary tract, wound and bloodstream infections. It is a feared pathogen, especially in burn units. Mucoid strains frequently infect cystic fibroses patients and are very difficult to eradicate. The main community-acquired infections caused by P. aeruginosa in immunocompetent hosts are external otitis (swimmer’s ear) and sinusitis.
P. aeruginosa is intrinsically resistant to amoxicillin, amoxicil-lin-clavulanic acid, first and second generation cephalospor-ins, cefixime, cefpodoxime, ceftriaxone, ertapenem, as well as tetracyclines, including tigecycline and trimethoprim-sul-famethoxazole. Quinolones are the only orally available anti-biotic with activity against P. aeruginosa. While we reported an increase in resistance for all antibiotics except ciprofloxa-cin from 2013 to 2015 in the last report, we now observe a significant decrease of cefepime resistance, taking into ac-count data from 2014 to 2017. Non-significant, slight de-creases in non-susceptibility rates have been observed since 2015 for all other antibiotics except aminoglycoside. Even if considering tobramycin resistance alone (which has the lowest epidemiological cut-off for P. aeruginosa of all aminoglycosides), we observe a comparable increase in
non-susceptibility rates. Decreasing resistance trends be-tween 2013 and 2016 were observed in the EU/EEA for flu-oroquinolones, aminoglycosides and carbapenems, while, in contrast to Switzerland, resistance to ceftazidime has in-creased. In 2017, non-susceptibility rates were around 11 % for carbapenems and aminoglycosides, around 9 % for pip-eracillin-tazobactam and ceftazidime and were lowest for ciprofloxacin (7.7 %) and cefepime (5 %). Regional data are given in Table 7. e, data on co-resistance in Table 7. f and Figure 7. g.
7.4 Acinetobacter spp.Acinetobacter spp. are Gram-negative, strictly aerobic coc-cobacilli. These opportunistic pathogens, which can be found in soil and water, are intrinsically resistant to many antibiotic agents. Acinetobacter spp. can roughly be divided into two groups: The Acinetobacter calcoaceticus – Acineto-bacter baumannii (ACB) complex and the non-ACB group, including a large number of environmental species with low pathogenicity. Because the correct identification to the spe-cies level is difficult, we herein analyze, in accordance with the European resistance networks EARS-Net and CAESAR, resistance trends on the genus level.
Resistance in bacteria from human clinical isolates 63
Table 7. e: Susceptibility rates of invasive Pseudomonas aeruginosa isolates in humans 2017.
Pseudomonas aeruginosa 2017
West North–East South Total Trend
Antimicrobial n % n % n % n % 95 % CI 4y 10y
Piperacillin- tazobactam
120 11.7 % 373 7.8 % 31 9.7 % 524 8.8 % 6.6–11.5 –
Ceftazidime 96 11.5 % 383 8.4 % 31 6.5 % 510 8.8 % 6.7–11.6 –
Cefepime 119 3.4 % 366 6.0 % 31 0.0 % 516 5.0 % 3.5–7.3 –
Carbapenem 120 15.0 % 382 10.5 % 31 6.5 % 533 11.3 % 8.8–14.2 – –
Aminoglycosides 120 7.5 % 384 13.0 % 31 0.0 % 535 11.0 % 8.6–14 -
Ciprofloxacin 119 5.9 % 384 8.6 % 31 3.2 % 534 7.7 % 5.7–10.3 – –
West (GE, NE, VD, JU, FR), South (TI), North–East (other cantons) according to linguistic regions.95 % confidence intervals (CI) were calculated by the Wilson score method, calculations of trends were performed by logistic regression.

Table 7. f: Non-susceptibility combinations in invasive P. aeruginosa isolates in humans in 2017. Only isolates tested against all five antibiotics or antibiotic groups (piperacillin-tazobactam, cefepime, carbapenems, aminoglyco-sides, ciprofloxacin) were considered (n=501/536 [93.5 %]).
64 Resistance in bacteria from human clinical isolates
0%
5%
10%
15%
20%
25%
2008 2009 2010 2011 2012 2013 2014 2015 2016 2017
Piperacillin-tazobactam
Ceftazidime
Cefepime
Carbapenems
Aminoglycosides
Ciprofloxacin
Figure 7. f: Non-susceptibility rates of invasive Pseudomonas aeruginosa isolates in humans from 2008 to 2017.
Resistance patterns Number of isolates % of total
Fully susceptible 368 73.5 %
Single resistance (to indicated antimicrobial group)
Total (all single resistance types) 85 17.0 %
Aminoglycosides 33 6.6 %
Carbapenem 25 5.0 %
Piperacillin-tazobactam 13 2.6 %
Ciprofloxacin 12 2.4 %
Cefepime 2 0.4 %
Resistance to two antimicrobial groups
Total (all two-group combinations) 27 5.4 %
Piperacillin-tazobactam + cefepime 6 1.2 %
Carbapenem + ciprofloxacin 5 1.0 %
Carbapenem + aminoglycosides 5 1.0 %
Aminoglycosides + ciprofloxacin 4 0.8 %
Other antimicrobial group combinations 7 1.4 %
Resistance to three antimicrobial groups
Total (all three-group combinations) 13 2.6 %
Piperacillin-tazobactam + cefepime + carbapenem 3 0.6 %
Piperacillin-tazobactam + carbapenem + aminoglycosides 3 0.6 %
Piperacillin-tazobactam + carbapenem + ciprofloxacin 2 0.4 %
Carbapenem + aminoglycosides + ciprofloxacin 2 0.4 %
Other antimicrobial group combinations 3 0.6 %
Resistance to four antimicrobial groups
Total (all four-group combinations) 4 0.8 %
Piperacillin-tazobactam + cefepime + carbapenem + aminoglycosides 1 0.2 %
Piperacillin-tazobactam + cefepime + carbapenem + ciprofloxacin 1 0.2 %
Piperacillin-tazobactam + carbapenem + aminoglycosides + ciprofloxacin 1 0.2 %
Cefepime + carbapenem + aminoglycosides + ciprofloxacin 1 0.2 %
Resistance to five antimicrobial groups
Piperacillin-tazobactam + cefepime + carbapenem + aminoglycosides + ciprofloxacin 4 0.8 %

Resistance in bacteria from human clinical isolates 65
Figure 7. g: Multiresistance in invasive Pseudomonas aeruginosa isolates in humans between 2008 and 2017 (for details refer to Table 7. f).
Fully susceptibleNon-susceptibility to two antibiotic groupsNon-susceptibility to four antibiotic groups
Non-susceptibility to one antibiotic groupNon-susceptibility to three antibiotic groupsNon-susceptibility to five antibiotic groups
2017
2016
2015
2014
2013
2012
2011
2010
2009
2008
0% 10% 20% 30% 40% 50% 60% 70% 80% 90% 100%
Acinetobacter spp. infections are a big concern for hospi-tal-acquired infections. They can cause respiratory, urinary, wound infections and septicemia. Meningitis has also been reported. Risk factors for multidrug-resistant Acinetobacter spp. are severe underlying diseases, prolonged hospital stays, especially in ICUs during antibiotic administration, mechanical ventilation and surgical procedures.
Around one quarter of Acinetobacter spp. isolates are not susceptible to at least one of the three most important anti-biotics, i.e. carbapenems (14 %), aminoglycosides (17 %) and ciprofloxacin (15 %, Table 7. g, 7. h). Except for ciprofloxacin, non-susceptibility rates are higher in western Switzerland than in north-eastern Switzerland. Although a north-south
gradient in antibiotic resistance can be observed in Europe for nearly all antibiotics, differences are most prominent in Acinetobacter spp. In 2016, resistance rates ranged from < 5 % in northern countries to > 80 % in southern/eastern countries for all of the antibiotics tested. The EU/EEA popu-lation means in 2016 were 35 % for carbapenems and aminoglycosides, and 39 % for fluoroquinolones [1]. In Swit-zerland, no significant trend can be observed since 2008 (Table 7. g and Figure 7. h). Notably we could not find an in-crease in carbapenem-resistance as described for Europe (see Textbox: “Carbapenem-Resistant Acinetobacter bau-mannii from 2005 to 2016 in Switzerland”). Details on mul-tiresistances are given in Table 7. h and Figure 7. i.
Table 7. g: Non-susceptibility rates of invasive Acinetobacter spp. isolates in humans for 2017. Due to small numbers, non-susceptibility rates for southern Switzerland are not shown.
Acinetobacter spp. 2017
West North–East South Total Trend
Antimicrobial n % n % n % n % 95 % CI 4y 10y
Carbapenem1 27 25.9 % 61 9.8 % 5 0.0 % 93 14.0 % 8.4–22.5 – –
Aminoglycosides 27 25.9 % 58 13.8 % 5 0.0 % 90 16.7 % 10.4–25.7 – –
Trimethoprim-sul-famethoxazole
25 24.0 % 53 13.2 % 5 0.0 % 83 15.7 % 9.4–25 – –
Ciprofloxacin 27 14.8 % 61 16.4 % 5 0.0 % 93 15.1 % 9.2–23.7 – –
West (GE, NE, VD, JU, FR), South (TI), North–East (other cantons) according to linguistic regions.95 % confidence intervals (CI) were calculated by the Wilson score method, calculations of trends were performed by logistic regression.1 Carbapenems: imipenem, meropenem

66 Resistance in bacteria from human clinical isolates
TextboxCarbapenem-Resistant Acinetobacter baumannii from 2005 to 2016 in Switzerland
Alban Ramette1
1 Institute for Infectious Diseases, University of Bern, Bern
Over the last years, the endemic establishment of A. bau-mannii resistant to carbapenems, a last-line group of -lactam antibiotics used to treat patients infected with multidrug-re-sistant Gram-negative bacteria, has worsened in Europe and worldwide. In the Acinetobacter genus, several species present a risk for opportunistic infections and belong to the so-called Acinetobacter calcoaceticus -Acinetobacter bau-mannii (ACB) complex. In contrast, “non-ACB” Acinetobac-ter species generally present lower pathogenicity and are often found in the environment. We have analyzed the tem-poral and regional fluctuations of the number of carbapen-em-susceptible and -resistant Acinetobacter spp. in Switzer-land. We have restricted our analyses to invasive isolates from blood cultures or cerebrospinal fluid to ensure that they are comparable with international reports. We have used the qualitative data (SIR) and accompanying epidemiological in-formation, such as sample location, provider of the sample, patient sex and age group, as provided by the participating laboratories.
From 2005 to 2016, a total of 800 invasive Acinetobacter isolates were identified in the anresis.ch database, consist-ing of 707 carbapenem-susceptible and 93 carbapenem-re-
sistant isolates, respectively. After removal of duplicates, 58 resistant or intermediate isolates were identified out of 632 cases (resistance rate 9.2 %) over the study period. Four out of 58 carbapenem-resistant isolates were isolated from ce-rebrospinal fluid, the rest from blood cultures. Co-resistance to other antibiotics, such as aminoglycosides (47/55, 86 %), trimethoprim-sulfamethoxazole (42/54, 78 %) and fluoro-quinolones (47/55, 86 %), was high, whereas no colistin re-sistance was reported for 23 isolates tested. There was a significant increase in the total number of Acinetobacter isolations over time, with about 30 isolates per year on aver-age, increasing at a yearly rate of about three new isolates. When only ACB complex species were considered, there were 18 isolates per year on average, increasing at an aver-age rate of one new isolate per year. The largest number of resistant isolates belonged to the ACB complex (55/299, 18.4 %), while resistance rates were much lower in non-ACB species (1/184, 0.5 %).
Yet, from 2005 to 2016, the overall yearly number of carba-penem-resistant ACB and non-ACB isolates did not in-crease, with an average of about five Acinetobacter isolates per year (mostly ACB isolates). The north-eastern region, with a total of 24 resistant Acinetobacter (22 of which were ACB) isolations from 2005 to 2016, was significantly above all other regions in terms of number of resistant strains. This was mainly attributable to an outbreak in a single hospital (data not shown). These geographic differences were con-firmed when examining yearly average resistance rates per region (Fig. 1A, 1B): there was no significant temporal trend
Figure 1: Acinetobacter resistance rates (number of resistant isolates compared to total number of isolates) per region from 2005 to 2016 in Switzerland. Standard deviation bars represent annual fluctuations per region. B) Map of the Swiss regions defined in this study.

Resistance in bacteria from human clinical isolates 67
in resistance rates for all Acinetobacter or ACB isolates. Only the north-eastern region presented higher rates on average than other regions.
In summary, this first nationwide surveillance study indi-cates that resistance rates of invasive carbapenem-resistant Acinetobacter in Switzerland are stable at a low level on a yearly basis, but that they display large temporal and region-al disparities. Our results also indicate the existence of a di-verse pool of A. baumannii and related species in Swiss hospital settings. We have confirmed the implication of car-bapenem-resistant ACB complex isolates in the vast majori-ty of clinical infections and nosocomial outbreaks that in-volved Acinetobacter isolates. Our analyses, which conjointly
cover both multiple years and multiple regions, highlight the usefulness of surveillance approaches that integrate different temporal and spatial resolution levels. Further surveillance efforts are needed to detect and control Acinetobacter out-breaks, and to limit the endemic establishment of resistant isolates in new health facilities and across regions.
See related publication:
Ramette A, Kronenberg A, and the Swiss Centre for Antibiotic Resistance (ANRESIS) 2018 Prevalence of carbapenem-resistant Acinetobacter baumannii from 2005 to 2016 in Switzerland. BMC Infect Dis. 2018 Apr 3;18(1):159. doi: 10.1186/s12879-018-3061-5. www.ncbi.nlm.nih.gov/pubmed/29614963
Figure 7. h: Non-susceptibility rates of invasive Acinetobacter spp. isolates in humans between 2008 and 2017.
Carbapenem
Aminoglycosides
Trimethoprim-sulfamethoxazole
Ciprofloxacin0%
10%
20%
30%
2008 2009 2010 2011 2012 2013 2014 2015 2016 2017
Table 7. h: Non-susceptibility combinations in invasive Acinetobacter spp. isolates in humans in 2017. Only isolates test-ed against all three antibiotic groups (aminoglycosides, ciprofloxacin and carbapenems) were considered (n=90/93 [96.8 %]).
Resistance patterns Number of isolates % of total
Fully susceptible 68 75.6 %
Single resistance (to indicated antimicrobial group)
Total (all single resistance types) 11 12.2 %
Ciprofloxacin 4 4.4 %
Aminoglycosides 4 4.4 %
Carbapenems 3 3.3 %
Resistance to two antimicrobial groups
Total (all two-group combinations) 2 2.2 %
Ciproxin + aminoglycosides 1 1.1 %
Aminoglycosides + carbapenems 1 1.1 %
Resistance to all three antimicrobial groups
Total (all three-group combinations) 9 10.0 %
Third-generation cephalosporins + aminoglycosides + fluoroquinolones

7.5 Streptococcus pneumoniae
Streptococcus pneumoniae is a common cause of upper respiratory tract infections such as sinusitis and otitis media, but is also a common pathogen found in invasive pneumo-nia, bloodstream infections and meningitis. Since 2002, all invasive isolates of S. pneumoniae are sent by the clinical microbiology laboratories to the National Reference Center for invasive S. pneumoniae, located at the Institute for Infec-tious Diseases of the University of Bern. For all isolates, se-rotyping (to survey the impact of vaccinations on serotype distribution) and antibacterial resistance testing is per-formed. Results of the latter are then sent to anresis.ch. For
this chapter, we have analyzed the anresis.ch data of S. pneumoniae from this reference center, as these data are complete and AMR testing is standardized. E-tests were performed for all penicillin non-susceptible isolates (PNSP). PNSP was defined as MIC ≥ 0.064 mg/L, resistance was defined as ≥ 2 mg/L. Ceftriaxone testing was performed only for PNSP. Penicillin-susceptible isolates (PSSP) are set to ceftriaxone-susceptible.
In 2017, the PNSP rate in Switzerland was 6.5 % (Table 7. i). In comparison, PNSP rates in EU/EEA countries in 2016 ranged from 0.4 % in Belgium to 41 % in Romania. However,
68 Resistance in bacteria from human clinical isolates
Figure 7. i: Multiresistance in invasive Acinetobacter spp. isolates in humans between 2008 and 2017 (for details refer to Table 7. h).
Fully susceptibleNon-susceptibility to two antibiotic groups
Non-susceptibility to one antibiotic groupNon-susceptibility to three antibiotic groups
2017
2016
2015
2014
2013
2012
2011
2010
2009
2008
0% 10% 20% 30% 40% 50% 60% 70% 80% 90% 100%
Streptococcus pneumoniae 2017
West North–East South Total Trend
Antimicrobial n % n % n % n % 95 % CI 4y 10y
Penicillin1 168 13.1 % 754 5.0 % 57 7.0 % 979 6.5 % 5.2–8.3 –
Ceftriaxone2 168 3.6 % 754 0.1 % 57 0.0 % 979 0.7 % 0.3–1.5 –
Trimethoprim- sulfamethoxazole
168 15.5 % 754 8.5 % 57 8.8 % 979 9.7 % 8–11.7 –
Erythromycin 168 13.1 % 754 6.9 % 57 12.3 % 979 8.3 % 6.7–10.2 –
Levofloxacin 168 0.0 % 754 0.0 % 57 0.0 % 979 0.0 % 0–0.4 – –
West (GE, NE, VD, JU, FR), South (TI), North–East (other cantons) according to linguistic regions.95 % confidence intervals (CI) were calculated by the Wilson score method, calculations of trends were performed by logistic regression.1Penicillin non-susceptible defined as MIC ≥ 0.064 mg/l, penicillin-resistant defined as MIC ≥2 mg/l2Penicillin-susceptible isolates were not tested but set automatically to ceftriaxone-susceptible
Table 7. i: Non-susceptibility rates of invasive Streptococcus pneumoniae isolates in humans in 2017.

Resistance in bacteria from human clinical isolates 69
an exact comparison with other countries is difficult, be-cause different breakpoints are used. Therefore, no average non-susceptibility rate is given for Europe. Despite these restrictions, non-susceptibility rates essentially seem to be higher in France (25.3 %) than in Italy (6.5 %) and Germany (4,0 %) [1]. These differences are mirrored within Switzer-land, with higher PNSP rates in the French-speaking part as well (Table 7. i). Ceftriaxone non-susceptibility is below 1 %. With 8.3 %, the macrolide non-susceptibility rate is slightly higher than the penicillin non-susceptibility rate, with higher resistance rates in western and southern Switzerland. Re-sistance against levofloxacin was nonexistent in Switzerland in 2017. As shown in Figure 7. j, resistance is higher in PNSP than in PSSP for trimethoprim-sulfamethoxazole and eryth-romycin, but not for levofloxacin, where we did not observe any non-susceptibility.
Over the last ten years, significant decreases in antibiotic resistance in S. pneumoniae were observed for penicillin, ceftriaxone and erythromycin (Table 7. i, Figure 7. k). A re-cent study published by the National Reference Center for invasive S. pneumoniae showed that such trends can be provoked by the vaccine-related decrease of the intrinsically more resistant serotypes [5]. A similar (although in the long-term not significant) trend was observed for trimetho prim-sulfamethoxazole. The reason for the single peak in this trend, which was restricted to 2015, remains unclear.
Figure 7. j: Non-susceptibility rates in invasive PSSP (penicillin-susceptible isolates) and PNSP (penicillin non-susceptible isolates) in humans in 2017.
20% 40% 60% 80% 100%
Ceftriaxone
PSSP
PNSP
Trimethoprim-sulfamethoxazole
Erythromycin
Levofloxacin
**
**
n=number of isolates tested with error bars indicating 95 % confidence intervals. Fisher Exact Tests were performed to assess for independence: * =p-value <0.05; **= p-value <0.01.
Figure 7. k: Non-susceptibility rates of invasive Streptococcus pneumoniae isolates in humans between 2008 and 2017.
0%
5%
10%
15%
20%
2008 2009 2010 2011 2012 2013 2014 2015 2016 2017
Penicillin
Ceftriaxone
Trimethoprim-sulfamethoxazole
Erythromycin
Levofloxacin

70 Resistance in bacteria from human clinical isolates
Figure 7. l: Non-susceptibility rates of invasive Enterococcus faecalis and Enterococcus faecium isolates in humans be-tween 2008 and 2017.
E. faecalis. Ampicillin
E. faecalis. Gentamicin HLR
E. faecalis. Streptomycin HLR
E. faecalis. Vancomycin
E. faecium. Ampicillin
E. faecium.Gentamicin HLR
E. faecium.Streptomycin HLR
E. faecium. Vancomycin
0%
10%
20%
30%
40%
50%
60%
70%
80%
90%
100%
2008 2009 2010 2011 2012 2013 2014 2015 2016 2017
Enterococcus faecalis 2017
West North–East South Total Trend
Antimicrobial n % n % n % n % 95 % CI 4y 10y
Ampicillin 125 0.0 % 345 0.0 % 45 2.2 % 515 0.2 % 0–1.1 –
Gentamicin HLR1 53 11.3 % 239 8.4 % 45 11.1 % 337 9.2 % 6.6–12.8 –
Streptomycin HLR1 3 66.7 % 146 15.8 % 0 – 149 16.8 % 11.6–23.6 –
Tetracycline 48 10.4 % 68 73.5 % 0 – 116 47.4 % 38.6–56.4 –
Vancomycin 188 1.1 % 388 0.0 % 46 0.0 % 622 0.3 % 0.1–1.2 – –
Linezolid 136 0.0 % 279 0.4 % 45 2.2 % 460 0.4 % 0.1–1.6 –
Enterococcus faecium 2017
West North–East South Total Trend
Antimicrobial n % n % n % n % 95 % CI 4y 10y
Ampicillin 89 84.3 % 267 82.4 % 31 77.4 % 387 82.4 % 78.3–85.9 – –
Gentamicin HLR1 26 19.2 % 193 37.3 % 29 24.1 % 248 33.9 % 28.3–40 – –
Streptomycin HLR1 2 100.0 % 109 45.0 % 0 – 111 45.9 % 37–55.2
Tetracycline 22 0.0 % 26 34.6 % 0 – 48 18.8 % 10.2–31.9 –
Vancomycin 119 0.8 % 266 2.3 % 31 6.5 % 416 2.2 % 1.1–4.1 – –
Linezolid 92 0.0 % 169 0.0 % 31 0.0 % 292 0.0 % 0–1.3 – –
West (GE, NE, VD, JU, FR), South (TI), North–East (other cantons) according to linguistic regions.95 % confidence intervals (CI) were calculated by the Wilson score method, calculations of trends were performed by logistic regression.1HLR=high-level resistance
Table 7. j: Non-susceptibility rates of invasive Enterococcus faecalis and Enterococcus faecium isolates in humans in 2017.

Resistance in bacteria from human clinical isolates 71
7.6 EnterococciEnterococci belong to the normal gastrointestinal flora of humans and animals. As such, they are often considered as commensals with low pathogenicity. However, mainly in the hospital setting, they can also cause serious infections, such as urinary tract infections, bacteremia, endocarditis, and in-traabdominal infections, in particular in seriously ill patients and immunocompromised hosts. The vast majority of en-terococcal infections are caused by Enterococcus faecalis and E. faecium. While E. faecalis isolates still remain suscep-tible to many antibiotics, and 99.8 % are even susceptible to aminopenicillins, E. faecium isolates, on the other hand, are usually resistant to aminopenicillin. In addition, E. faecium shows clearly higher resistance rates to high-level aminogly-cosides compared to E. faecalis (Table 7. j). Aminoglycoside non-susceptibility is still fairly low compared to the EU/EEA weighed average (e.g. a gentamicin high-level resistance (HLR) in E. faecalis of 9.2 % in Switzerland versus 30.5 % in Europe) and has significantly decreased during the last ten years. A decrease in gentamicin HLR in E. faecalis was also observed in almost one quarter of all European countries [1]. In contrast to the United States, vancomycin resistance is still rare in Switzerland and far below the EU/ EEA average of 11.8 % in E. faecium in 2016 [1]. As seen in Table 7. j and Figure 7. l, vancomycin resistance did not increase between 2008 and 2017, but we have noted a slight increase in 2018 (data not shown), at least in part attributable to a recent out-break of a vancomycin-resistant E. faecium clone ST796 in Switzerland [7]. Surveillance of enterococci, particular VRE, is crucial, since very few antibiotics remain active, and these are commonly associated with much higher toxicity than penicillin.
7.7 Staphylococcus aureus
Staphylococcus aureus belong to the most important micro-organisms in clinical microbiology. Besides bloodstream in-fections, S. aureus frequently causes soft-tissue infections, osteomyelitis, joint infections, and, more rarely, endocarditis and pneumonia. Methicillin-resistant S. aureus (MRSA) re-mains one of the most important causes of antimicrobial-re-sistant infections worldwide. While initially these infections were mainly hospital acquired, they have successfully spread into the community over the last years.
There are different methods to detect MRSA, and the meth-ods used for screening have changed over time. Staphylo-coccus aureus methicillin/oxacillin resistance can be de-tected either phenotypically by MIC determination, disk diffusion tests or latex agglutination to detect PBP2a, or genotypically using mecA /mecC gene detection. Due to poor correlation with the presence of mecA (the gold stand-ard for defining methicillin-resistance), oxacillin disk testing is discouraged by EUCAST and CLSI guidelines to detect S. aureus methicillin/oxacillin resistance (see also Chapter 11). In contrast, cefoxitin susceptibility is a very sensitive and specific marker of mecA /mecC -mediated methicillin resist-ance and is the drug of choice for disk diffusion testing. S.
aureus with cefoxitin MIC values >4 mg/L are methicillin resistant, mostly due to the presence of the mecA gene.
In the anresis.ch database, MRSA is defined as non-suscep-tibility to at least one of the following: methicillin, oxacillin, flucloxacillin or cefoxitin. Confirmation tests, such as PBP2a agglutination or direct detection of the mecA gene, are typi-cally not forwarded to anresis.ch. MRSA are resistant to all beta-lactams, including combinations with beta-lactam in-hibitors (e.g. amoxicillin-clavulanic acid). In 2017, the MRSA rate in Switzerland was 4.4 %, with slightly higher rates in southern Switzerland (Table 7. k). This rate is far below the European average of 13.7 %, but above MRSA rates in north-ern countries such as the Netherlands (1.2 %), Norway (1.2 %), Denmark (2.0 %), Finland (2.2 %) and Sweden (2.3 %) in 2016 [1]. Co-resistance in MRSA is frequent and is depict-ed in Figure 7. n.
Staphylococcus aureus also remains an important pathogen in the ambulatory setting, where it is the major causative agent of wounds infections and abscesses. A comparison of the resistance rates of invasive samples with outpatient samples from wound and abscesses is shown in Figure 7. m. As already shown by Olearo et al. [6], MRSA rates, and sim-ilarly, non-susceptibility rates to most other antibiotics as well, are nowadays higher in the ambulatory skin infection setting (10.2 %) than in bacteremia (4.4 %) (Figure 7. m). While MRSA rates in hospitals have been decreasing since several years, community MRSA (cMRSA) infections are increasing [6]. In addition, they often harbor the Panton-Val-entine Leukocidin (PVL) toxin, leading to the formation of abscesses. Importantly, wound infections and even skin ab-scesses usually can only be treated by a surgical procedure.
Development of resistances during the last ten years is shown in Figure 7. o. Over the past ten years, we have ob-served a significant decrease in invasive MRSA rates in Swit-zerland, from 10.1 % in 2008 to 4.4 % in 2017. Decreasing trends from 2013 to 2016 were also reported in more than one third of all European countries, leading to an overall de-crease in the population-weighted mean of EU/EEA states from 18.1 % to 13.7 % during this time period. The decrease in invasive MRSA rates was more pronounced in the West-ern part of Switzerland (data not shown). The decrease in the MRSA rate runs parallel to significant decreases in the non-susceptibility rates against ciprofloxacin, macrolides and, to a lesser extent, clindamycin and aminoglycosides in Staphylococcus aureus isolates (Figure 7. i).

72 Resistance in bacteria from human clinical isolates
Staphylococcus aureus 2017
West North–East South Total Trend
Antimicrobial n % n % n % n % 95 % CI 4y 10y
Penicillin 438 81.3 % 1217 78.3 % 125 85.6 % 1780 79.6 % 77.6–81.4 –
MRSA 470 5.1 % 1432 3.8 % 124 8.1 % 2026 4.4 % 3.6–5.4 –
Aminoglycosides 470 3.6 % 1356 1.6 % 125 1.6 % 1951 2.1 % 1.6–2.8 –
Trimethoprim– sulfamethoxazole
470 0.2 % 1269 0.7 % 125 1.6 % 1864 0.6 % 0.4–1.1 – –
Tetracycline 324 4.3 % 1038 3.3 % 125 2.4 % 1487 3.4 % 2.6–4.5 – –
Macrolides 470 16.6 % 1430 11.2 % 125 9.6 % 2025 12.3 % 11–13.9 –
Clindamycin 470 13.4 % 1429 9.1 % 125 8.0 % 2024 10.0 % 8.8–11.4 –
Vancomycin 430 0 % 1147 0 % 125 0 % 1702 0 % 0–0.2 – –
Ciprofloxacin 402 7.5 % 1380 9.2 % 125 13.6 % 1907 9.1 % 7.9–10.5 –
Fusidic acid 400 6.8 % 1162 3.0 % 125 5.6 % 1687 4.1 % 3.2–5.1 – –
Linezolid 285 0.4 % 626 0 % 1 – 912 0.1 % 0–0.6 – –
Rifampicin 470 0.6 % 1389 0.6 % 125 0 % 1984 0.6 % 0.3–1 – –
West (GE, NE, VD, JU, FR), South (TI), North–East (other cantons) according to linguistic regions.95 % confidence intervals (CI) were calculated by the Wilson score method, calculations of trends were performed by logistic regression.
Table 7. k: Susceptibility rates of invasive Staphylococcus aureus isolates in humans in 2017.
Figure 7. m: Comparison of non-susceptibility rates in invasive versus outpatient wound/abscess samples in Staphylococcus aureus in humans in 2017.
n=number of isolates tested, with error bars indicating 95 % confidence intervals. Fisher Exact Tests were performed to assess for independence: * = p-value <0.05; **= p-value <0.01.
Penicillin
MRSA
Aminoglycosides
Trimethoprim-sulfamethoxazole
Tetracycline
Macrolides
Clindamycin
Vancomycin
Ciprofloxacin
Fusidic acid
Linezolid
Rifampicin
invasive
outpatient
10% 20% 30% 60% 40% 50% 70% 80% 90% 0% n=1780
n=842
n=859
n=849
n=1487
n=649
n=858
n=2025
n=2024
n=1702
n=806
n=859
n=2026**
**
**
*
*
**
n=1951
n=1864
n=847
n=1907
n=1687
n=912
n=1984
n=858
n=480
n=794
n=791

Resistance in bacteria from human clinical isolates 73
Figure 7. n: Non-susceptibility rates of invasive MRSA (methicillin-resistant Staphylococcus aureus) and MSSA (methicillin-susceptible Staphylococcus aureus) isolates in humans 2017.
Penicillin
Aminoglycosides
Trimethoprim-sulfamethoxazole
Tetracycline
Macrolides
Clindamycin
Vancomycin
Ciprofloxacin
Fusidic acid
Linezolid
Rifampicin
MRSA
MSSA
10% 20% 30% 60% 40% 50% 70% 80% 90% 100% 0% n=79
n=89
n=89
n=87
n=1933
n=1932
n=1698 **
**
*
**
**
**
**
n=1863
n=1775
n=1414
n=85
n=70
n=88
n=80
n=1620
n=1818
n=1608
n=77
n=46
n=89
n=864
n=1893
n=number of isolates tested, with error bars indicating 95 % confidence intervals. Fisher Exact Tests were performed to assess for independence: * = p-value <0.05; **= p-value <0.01.
Figure 7. o: Non-susceptibility rates of invasive Staphylococcus aureus isolates in humans between 2008 and 2017.
10%
20%
30%
40%
50%
60%
70%
80%
90%
2008 2009 2010 2011 2012 2013 2014 2015 2016 2017
Penicillin
MRSA
Aminoglycosides
Trimethoprim-sulfamethoxazole
Tetracycline
Macrolides
Clindamycin
Vancomycin
Ciprofloxacin
Fusidic acid
Linezolid
Rifampicin
0%

74 Resistance in bacteria from human clinical isolates
References
[1] European Centre for Disease Prevention and Control.Antimicrobial resistance surveillance in Europe 2016.Annual Report of the European Antimicrobial Resis-tance Surveillance Network (EARS-Net).Stockholm: ECDC; 2017
[2] B. Hasse, A. Huttner, B. Huttner, M. Egger, G. Zanetti,J. Marschall, K. Mühlemann, S. Harbarth. Behandlungvon unkomplizierten Harnwegsinfektionen, fromhttp://www.sginf.ch/files/behandlung_von_unkompli-zierten_harnwegsinfektionen.pdf (in German)
[3] Active surveillance of antibiotic resistance prevalence inurinary tract and skin infections in the outpatient set-ting. A. Kronenberg, S. Koenig, S. Droz, K. Mühlemann.Clin Microbiol Infect. 2011 Dec;17(12):1845–1851. doi:10.1111/j.1469-0691.2011.03519.x. Epub 2011 Aug 31.
[4] Liu YY, Wang Y, Walsh TR. Yi-L-X, Zang R, Spencer Jet al. Emergence of plasmid-mediated colistin-resis-tance mechanism MCR-1 in animals and human beingsin China: a microbiological and molecular biologystudy. Lancet Infect Dis 2016.
[5] Serotype/serogroup-specific antibiotic non-suscepti- bility of invasive and non-invasive Streptococcuspneumoniae, Switzerland, 2004 to 2014. C. Hauser,A. Kronenberg, A. Allemann, K. Mühlemann, M. Hilty.Euro Surveill. 2016 May 26;21(21).
[6] Staphylococcus aureus and methicillin resistancein Switzerland: regional differences and trends from2004 to 2014. F. Olearo, W. Albrich, N. Vernaz, S.Harbarth, A. Kronenberg and the Swiss Centre ForAntibiotic Resistance Anresis. Swiss Med Wkly. 2016Sep 15;146:w14339. doi: 10.4414/smw.2016.14339.
[7] www.eurosurveillance.org/co

Resistance in bacteria from human clinical isolates 75
TextboxTreatment of the Tree Disease Fire Blight with Antibiotics
Markus Hardegger1
1 FOAG, Federal Office for Agriculture, Bern
The bacterium Erwinia amylovora damages apple, pear as well as other trees and plants of the Rosaceae family. Trees are mainly infected by way of their flowers, and therefore pollinating insects are usually responsible for the spread of E. amylovora, respectively fire blight. In 1991, for the first time, fire-blight-infected plants of a pear orchard were de-tected and destroyed in Switzerland. Years with heavy infec-tions led to the destruction of 50 ha and 100 ha of fruit-pro-ducing orchards in 2000 and 2007, respectively. For 2008, a plant protection product containing the antibiotic streptomy-cin as the active ingredient was authorized for three applica-tions during the flowering season of apple and pear trees. Trials in other countries have shown that, compared to other products, streptomycin has the best protection efficacy. Al-though the decision was welcomed by fruit producers, it was criticized by beekeepers and consumers. In addition to the authorization of streptomycin, the international research project “Gemeinsam gegen Feuerbrand” was launched in 2008 and was financed by Switzerland, Germany, Austria and Liechtenstein. The aim was to identify alternative plant protection measures to replace streptomycin applications. In the framework of this project, for example, several apple varieties presenting robustness against fire blight were found using specific tests. Streptomycin having originally been applied during the flowering season of the trees, anti-biotic residues were detected in honey of hives near treated orchards. For this reason, conditions were tightened over time. Starting in 2010, only two streptomycin applications in the evening, when bees do not fly, were authorized. Never-theless, in the years 2010 to 2012 several tons of honey con-taining streptomycin residues were destroyed. This has re-sulted in the authorization of only one streptomycin
application per season since 2014, as well as the authoriza-tion of three applications of the alternative product potassi-um aluminum sulfate (LMA) which has an overall average protection efficacy of approximately 73 per cent. Since the year 2016, authorization of streptomycin has no longer been granted. The decision was based on the fact that alterna-tives such as robust apple varieties as well as five plant pro-tection products including LMA were available. The decision was published shortly after the Swiss government accepted the national strategy on antibiotic resistance.
Treatment possibilities against fire blight for apple and pear orchards
3 × streptomycin 2008–2009
2 × streptomycin 2010–2013
1 × streptomycin 2014–2015 3 × LMA
0 × streptomycin from 2016 3 × LMA + 4 other products
Beside the research performed within “Gemeinsam gegen Feuerbrand” for alternative plant protection measures to re-place streptomycin use, specific research projects to assess environmental effects were launched and financed by differ-ent federal offices as well as the Swiss Expert Committee for Biosafety. The effect of streptomycin applications on antibiotic resistances in bacterial communities of orchards was tested. After streptomycin applications in the spring, a temporary increase in antibiotic resistance genes was found. A return to the original level was observed in autumn or the next spring1. Applications of plant protection products in orchards are not possible without drift. Therefore, sheep in two groups were analyzed. In the group grazing on a meadow next to an orchard treated with streptomycin (sim-ulation), more antibiotic multiresistant bacteria were found than in the control group grazing on an untreated meadow2.
References[1] Duffy et al. Streptomycin use in apple orchards did not
increase abundance of mobile resistance genes. FEMS Microbiol Lett 350 (2014) 180–189
[2] Scherer et al. Enhanced antibiotic multi-resistance in nasel and faecal bacteria after agricultural use of streptomycin. Environ. Microbiol. 15 (2013), 297–304

76 Resistance in bacteria from human clinical isolates
TextboxAntibacterial Resistance in the Aquatic Environment
Helmut Bürgmann1, Judith Riedo2, Michael Sinreich2, Saskia Zimmermann-Steffens2
1 Eawag, Swiss Federal Institute of Aquatic Science and Technology, Kastanienbaum 2 FOEN, Federal Office for the Environment, Bern
Antibiotic resistance research and policy is naturally focused on resistance in human pathogens. The Swiss National Strategy on Antibiotic Resistance (StAR) includes veterinary medicine, agriculture as well as the environment within its One-Health approach. This is a consequence of the now pre-vailing view that emergence, evolution and dissemination of resistance can only be properly understood and effectively combated by taking into account that resistances emerge and spread from various sources. While a dissemination of resistant pathogens is the most immediate concern, the re-lease, spread, accumulation and further evolution of mobile antibiotic resistance genes (ARGs) in the environment is un-desirable and may in the long term contribute to the anti- biotic resistance problem.
The use of antibiotics in human and veterinary medicine leads to a selection of antibiotic-resistant bacteria (ARB), not only in pathogens but also in commensal microbes. Conse-quently, ARB and ARG are discharged with household and hospital wastewater. They are also applied to fields and pas-tures with feces or manure and can finally reach lakes, rivers or groundwater. Aquaculture (fish breeding) and wastewa-ters from antibiotic production may provide other sources of antibiotics, ARBs and ARGs (Figure 1).
Currently there are no monitoring programs for antibiotic re-sistance in the environment in Switzerland. An overview of the state of knowledge for Switzerland can be found in a recent review by Czekalski et al., 2016.
Conventional biological wastewater treatment plants typi-cally reduce the total number of ARBs or ARGs by more than 95 % (Czekalski et al., 2016). Nevertheless, the number of ARBs and ARGs released with treated wastewater is higher than the background in Swiss surface waters. Wastewater treatment plants enrich for ARB, resulting in a relatively high proportion of ARB in the treated wastewater.
Based on the revised Swiss Water Protection legislation, se-lected Swiss wastewater treatment plants will be upgraded
Figure 1: Sources of antibiotics and antibiotic-resistant bacteria and potential distribution in aquatic environments.

Resistance in bacteria from human clinical isolates 77
by 2040, with treatment steps for the elimination of micro-pollutants, including antibiotics. Ozonation and powdered activated carbon (PAC) are currently the standard treat-ment options. Determining whether these techniques also reduce ARBs and ARGs was the goal of several initial studies. Results showed that (i) PAC only removes ARBs and ARGs in combination with ultrafiltration (which is costly) and that (ii) ozonation in combination with a post-treatment against oxidation by-products only has limited effects on the resistance load (Czekalski et al., 2016). Whether the latter treatment technique can be optimized is currently under investigation.
For the time being, wastewater discharge increases the abundance of certain ARGs and ARBs in the receiving wa-ters. To what extent agricultural sources also contribute is not well studied. But whatever the sources, resistant bac-teria, including problematic ESBL-producing Enterobacte-riaceae are present in surface water bodies throughout the Swiss plateau (Zurfluh et al., 2013).
Infiltration of surface water provides a potential trajectory of insufficiently treated wastewater into groundwater, the main drinking water resource, making it a direct human health issue. Fecal bacteria, potentially including ARBs, may thereby migrate into the aquifer if not attenuated dur-ing riverbank filtration. Results from a pilot study of the NAQUA National Groundwater Monitoring have shown that most of the sampled pumping stations located close to rivers in unconsolidated porous aquifers were free of fecal bacteria, even though some of them displayed fecal traces in terms of the genetic detection of human enteric viruses (Pronk et al., 2014). Vulnerable consolidated aqui-fers were more frequently affected by fecal bacteria which often also co-occurred with human virus genes. Further-more, groundwater from all aquifer types contained a high number of indigenous bacteria (> 1000 cells per ml), indi-cating the potential for ARG transfer.
Beside sewage as a source of fecal contamination and ARBs, groundwater may also be impacted by agricultural land use. Specific investigations at selected NAQUA mon-itoring sites applying microbial-source-tracking tech-niques revealed the occurrence of both human-derived markers and markers from livestock (ruminants) (Diston et al., 2015). Findings suggest pharmaceutical residues (e.g. sulfamethoxazole as an indicator parameter) and other wastewater tracers in groundwater, occasionally accom-panied by human-specific microbial markers. Although antibiotic resistance was not covered in this study, it re-veals various fecal contamination sources and thereby illustrates the potential transfer of antibiotic resistances into groundwater.
Drinking water of course typically undergoes disinfection treatment and has to fulfill strict microbiological quality re-quirements. The Swiss association of the gas and water in-dustry (SVGW) and Eawag recently conducted a survey of eight Swiss drinking water suppliers, covering a range of raw water sources and treatment options (Bürgmann & Im-minger, 2017). The occurrence of (commensal) ARBs and ARGs in the raw water was very variable, with the lowest numbers in groundwater including bank filtrate, and higher concentrations in surface water sources. Treatment always strongly reduces ARBs, although some regrowth can occur during network distribution. Overall, these results indicate that drinking water is not a major exposure pathway to envi-ronmental ARBs and ARGs.
Switzerland has excellent sanitation and drinking water treatment. Whereas contaminated water may spread resis-tant pathogens in some parts of the world, this is of no rele-vance in Switzerland. ARBs and ARGs are not wanted in the water cycle and the aim is to further reduce their input into the natural waters. A risk assessment for antibiotic resis-tance in the environment needs to be established and more knowledge in this field is required. However, measures at the source, namely in human and veterinary medicine as well as in agriculture, are a priority, as reflected in the Swiss National Strategy Antibiotic Resistance (StAR).
References[1] Bürgmann H & Imminger S (2017) Antibiotikaresis-
tenzen im Trinkwasser? Aqua & Gas 97: 60–66.[2] Czekalski N, von Gunten U & Bürgmann H (2016)
Antibiotikaresistenzen im Wasserkreislauf. Ein Über-blick über die Situation in der Schweiz. Aqua & Gas 96: 72–80.
[3] Diston D, Sinreich M, Zimmermann S., Baumgartner A & Felleisen R. (2015). Evaluation of molecular- and culture-dependent MST markers to detect fecal con-tamination and indicate viral presence in good quality groundwater. Environ Sci Technol 49: 7142–7151.
[4] Pronk M, Sinreich M, Guhl F, Egli T, Kötzsch S., Fel- leisen R, Koch M, Köster O, Raetz E, Ramseier C, Rossi P & Schürch N (2010). Auftreten von Mikroor-ganismen im Grundwasser. Ein erster landesweiter Überblick. Gas-Wasser-Abwasser 12: 1059–1071.
[5] Zurfluh K, Hachler H, Nüesch-Inderbinen M & Stephan R (2013) Characteristics of extended-spectrum be-ta-lactamase- and carbapenemase-producing Entero-bacteriaceae isolates from rivers and lakes in Switzer-land. Appl Environ Microbiol 79: 3021–3026.

8Resistance in zoonotic bacteria
in animals from primary production samples

80 Resistance in zoonotic bacteria in animals from primary production samples
Zoonoses are diseases that are transmissible from animals to humans. Infection can be acquired by contaminated food or through direct contact with animals. The severity of these diseases in humans can vary from mild symptoms to life-threatening conditions. Antimicrobial resistance in zoo-notic bacteria from animals is of special concern, since it might compromise the effective treatment of infections in humans.
8.1 Campylobacter spp.Campylobacter is by far the most commonly reported cause of human food-borne zoonoses in Switzerland as well as in the EU [1, 2]. The main cause of infection is C. jejuni, fol-lowed by C. coli. While Campylobacter causes acute gastro-enteritis in humans, broilers and pigs are usually asympto-matic carriers. Beside these reservoir hosts, Campylobacter can be detected in cattle, sheep and fowl, domestic pets and wild animals [3].
Fresh raw poultry meat is highly contaminated with Campy-lobacter. Hence, incorrect handling of raw poultry meat and the consumption of undercooked contaminated poultry meat and poultry liver are the two main causes for human campylobacteriosis. Meat from cattle and pigs and contact with pets are of lesser importance. A molecular typing of isolates from humans and animals collected between 2001
8 Resistance in zoonotic bacteria in animals from primary production samples
and 2012 in Switzerland identified chicken as the main source for human campylobacteriosis (71 % of all human cases were attributed to chicken, 19 % to cattle, 9 % to dogs and 1 % to pigs) [4].
Campylobacteriosis is usually self-limiting in humans and does not require antibacterial treatment. However, treat-ment with antibiotics is necessary for severe cases, where-by resistance to antimicrobials in Campylobacter is a source of concern. Resistance can lead to therapy failure and longer treatment duration. Fluoroquinolones, such as ciprofloxacin, and macrolides, such as clarithromycin or azithromycin, rep-resent standard therapies for severe cases of campylobac-teriosis and therefore are considered as critically important antimicrobials of highest priority [5].
This chapter includes antimicrobial resistances of Campylo-bacter jejuni and Campylobacter coli in livestock and hu-mans. Broilers were investigated in 2016 and fattening pigs in 2017.
8.1.1 Campylobacter spp. in broilers
At present, only a few antimicrobial products are licensed for use in poultry in Switzerland. More than half of them contain antimicrobial substances that belong to the highest-priority critically important antimicrobials according to the WHO [5].
Table 8. a: Campylobacter jejuni and Campylobacter coli from broilers in 2016.
2016 Campylobacter jejuni (N=140) Campylobacter coli (N=30)
Antimicrobials n % 95 % CI n % 95 % CI
Ciprofloxacin 72 51.4 43.2–59.6 20 66.7 48.8–80.8
Erythromycin 4 2.9 1.1–7.1 3 10.0 3.5–25.6
Gentamicin 2 1.4 0.4–5.1 0 0.0 0.0–11.4
Nalidixic acid 72 51.4 43.2–59.6 20 66.7 48.8–80.8
Streptomycin 10 7.1 3.9–12.6 19 63.3 45.5–78.1
Tetracycline 56 40.0 32.3–48.3 12 40.0 24.6–57.7
Number of resistances n % 95 % CI n % 95 % CI
None 54 38.6 30.9–46.8 6 20.0 9.5–37.3
1 antimicrobial 14 10.0 6.1–16.1 3 10.0 3.5–25.6
2 antimicrobials 28 20.0 14.2–27.4 4 13.3 5.3–29.7
3 antimicrobials 34 24.3 17.9–32.0 8 26.7 14.2–44.4
4 antimicrobials 8 5.7 2.9–10.9 6 20.0 9.5–37.3
>4 antimicrobials 2 1.4 0.4–5.1 3 10.0 3.5–25.6
Number of resistant strains (n) and prevalence of resistance ( %) with 95 % confidence interval (95 % CI)
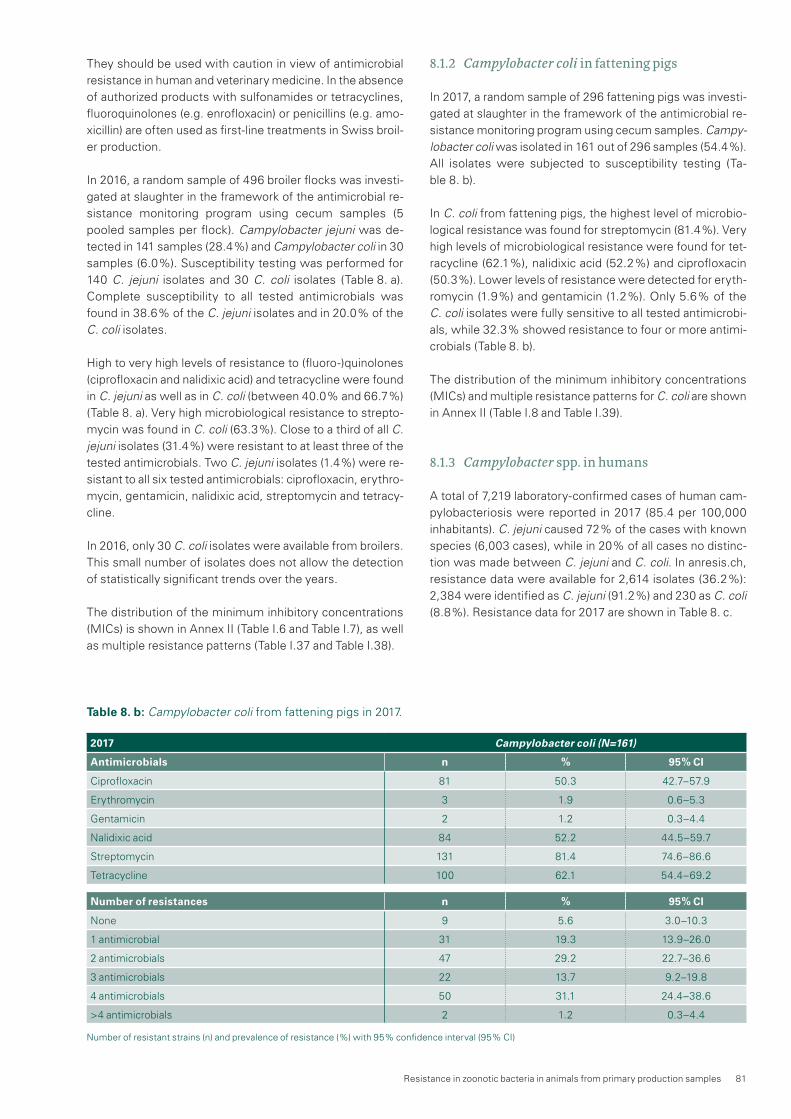
Resistance in zoonotic bacteria in animals from primary production samples 81
Table 8. b: Campylobacter coli from fattening pigs in 2017.
They should be used with caution in view of antimicrobial resistance in human and veterinary medicine. In the absence of authorized products with sulfonamides or tetracyclines, fluoroquinolones (e.g. enrofloxacin) or penicillins (e.g. amo-xicillin) are often used as first-line treatments in Swiss broil-er production.
In 2016, a random sample of 496 broiler flocks was investi-gated at slaughter in the framework of the antimicrobial re-sistance monitoring program using cecum samples (5 pooled samples per flock). Campylobacter jejuni was de-tected in 141 samples (28.4 %) and Campylobacter coli in 30 samples (6.0 %). Susceptibility testing was performed for 140 C. jejuni isolates and 30 C. coli isolates (Table 8. a). Complete susceptibility to all tested antimicrobials was found in 38.6 % of the C. jejuni isolates and in 20.0 % of the C. coli isolates.
High to very high levels of resistance to (fluoro-)quinolones (ciprofloxacin and nalidixic acid) and tetracycline were found in C. jejuni as well as in C. coli (between 40.0 % and 66.7 %) (Table 8. a). Very high microbiological resistance to strepto-mycin was found in C. coli (63.3 %). Close to a third of all C. jejuni isolates (31.4 %) were resistant to at least three of the tested antimicrobials. Two C. jejuni isolates (1.4 %) were re-sistant to all six tested antimicrobials: ciprofloxacin, erythro-mycin, gentamicin, nalidixic acid, streptomycin and tetracy-cline.
In 2016, only 30 C. coli isolates were available from broilers. This small number of isolates does not allow the detection of statistically significant trends over the years.
The distribution of the minimum inhibitory concentrations (MICs) is shown in Annex II (Table I.6 and Table I.7), as well as multiple resistance patterns (Table I.37 and Table I.38).
8.1.2 Campylobacter coli in fattening pigs
In 2017, a random sample of 296 fattening pigs was investi-gated at slaughter in the framework of the antimicrobial re-sistance monitoring program using cecum samples. Campy-lobacter coli was isolated in 161 out of 296 samples (54.4 %). All isolates were subjected to susceptibility testing (Ta-ble 8. b).
In C. coli from fattening pigs, the highest level of microbio-logical resistance was found for streptomycin (81.4 %). Very high levels of microbiological resistance were found for tet-racycline (62.1 %), nalidixic acid (52.2 %) and ciprofloxacin (50.3 %). Lower levels of resistance were detected for eryth-romycin (1.9 %) and gentamicin (1.2 %). Only 5.6 % of the C. coli isolates were fully sensitive to all tested antimicrobi-als, while 32.3 % showed resistance to four or more antimi-crobials (Table 8. b).
The distribution of the minimum inhibitory concentrations (MICs) and multiple resistance patterns for C. coli are shown in Annex II (Table I.8 and Table I.39).
8.1.3 Campylobacter spp. in humans
A total of 7,219 laboratory-confirmed cases of human cam-pylobacteriosis were reported in 2017 (85.4 per 100,000 inhabitants). C. jejuni caused 72 % of the cases with known species (6,003 cases), while in 20 % of all cases no distinc-tion was made between C. jejuni and C. coli. In anresis.ch, resistance data were available for 2,614 isolates (36.2 %): 2,384 were identified as C. jejuni (91.2 %) and 230 as C. coli (8.8 %). Resistance data for 2017 are shown in Table 8. c.
2017 Campylobacter coli (N=161)
Antimicrobials n % 95 % CI
Ciprofloxacin 81 50.3 42.7–57.9
Erythromycin 3 1.9 0.6–5.3
Gentamicin 2 1.2 0.3–4.4
Nalidixic acid 84 52.2 44.5–59.7
Streptomycin 131 81.4 74.6–86.6
Tetracycline 100 62.1 54.4–69.2
Number of resistances n % 95 % CI
None 9 5.6 3.0–10.3
1 antimicrobial 31 19.3 13.9–26.0
2 antimicrobials 47 29.2 22.7–36.6
3 antimicrobials 22 13.7 9.2–19.8
4 antimicrobials 50 31.1 24.4–38.6
>4 antimicrobials 2 1.2 0.3–4.4
Number of resistant strains (n) and prevalence of resistance ( %) with 95 % confidence interval (95 % CI)

82 Resistance in zoonotic bacteria in animals from primary production samples
Table 8. c: Non-susceptibility rates of Campylobacter coli and Campylobacter jejuni from human clinical isolates in 2017.
Campylobacter coli 2017
AntimicrobialWest North–East South Total Trend
n % n % n % n % 95 % CI 4y 10y
Macrolides1 79 10.1 % 131 20.6 % 17 52.9 % 227 19.4 % 14.8 – 25 –
Quinolones2 82 81.7 % 131 75.6 % 17 70.6 % 230 77.4 % 71.6 – 82.3 –
Campylobacter jejuni 2017
AntimicrobialWest North–East South Total Trend
n % n % n % n % 95 % CI 4y 10y
Macrolides1 733 1.1 % 1558 0.6 % 90 1.1 % 2381 0.8 % 0.5 – 1.2 –
Quinolones2 731 57.6 % 1563 56.4 % 90 56.7 % 2384 56.8 % 54.8 – 58.8
95 % confidence intervals (CI) were calculated by the Wilson score method, calculations of trends were performed by logistic regression.1 Macrolides: erythromycin, clarithromycin, azithromycin2 Fluoroquinolones: ciprofloxacin, norfloxacin, ofloxacin
Figure 8. a: Trends in resistance to fluoroquinolones and macrolides in Campylobacter coli and Campylobacter jejuni from human clinical isolates in Switzerland between 2008 and 2017.
0%
10%
20%
30%
40%
50%
60%
70%
80%
Campylobacter coli Macrolides Campylobacter coliQuinolones
Campylobacter jejuniMacrolides
Campylobacter jejuniQuinolones
2008 2009 2010 2011 2012 2013 2014 2015 2016 2017
8.1.4 Discussion
The increase of resistance to ciprofloxacin in C. jejuni from broilers is of special concern, as fluoroquinolones and mac-rolides are the drugs of choice for the treatment of severe human campylobacteriosis. Their efficacy for the treatment of Campylobacter infections in humans should be preserved. Studies estimate that Campylobacter from broilers accounts for 50–80 % of all human campylobacteriosis cases. Hence, resistant Campylobacter isolates from broilers can be passed on to humans [3], [4], [6].
In C. jejuni from broilers, microbiological resistance to cipro-floxacin has displayed a statistically significant increasing trend over the last ten years (Figure 8. b). The same trend is observed in human clinical isolates as well (Figure 8. a). While in broilers an increase from 18.3 % resistant isolates in 2008 to 51.4 % in 2016 was observed, quinolone resis-tance rates in clinical isolates from humans rose from 38.6 % to 56.8 % during the same time interval. Moreover, the re-sistance rate to tetracycline increased again in 2016 to 40 %.

Resistance in zoonotic bacteria in animals from primary production samples 83
In Switzerland, there are currently no products licensed for use in broilers containing tetracycline or streptomycin, but tetracycline is widely used in other farm animals, especially in fattening pigs and cattle. Resistance to other tested anti-microbials (erythromycin, gentamicin and streptomycin) re-mained stable or low (Figure 8. b).
Data on microbiological resistance in C. jejuni from broilers from 27 European countries in 2016 showed average levels of resistance of 66.9 % to ciprofloxacin, 50.7 % to tetracy-cline, 6.1 % to streptomycin and 1.3 % to erythromycin [7]. As in previous years, resistance levels varied greatly among countries and were generally much lower in Nordic coun-tries than in other European countries [7]. Levels of resis-tance for C. jejuni in Switzerland were below the European averages, except for streptomycin, which were slightly high-er. Besides Switzerland, Austria, the Czech Republic, Den-mark, Finland, France, Germany, Hungary, the Netherlands and Spain also observed a statistically significant increasing trend of resistance to ciprofloxacin in C. jejuni from broilers over the last years [7].
In C. coli from fattening pigs, levels of microbiological resis-tance to streptomycin decreased significantly before 2012, but thereafter an increasing trend was observed until 2015. In 2017, the rate of resistance to streptomycin was lower than in 2015 (81.4 % vs. 86.5 %). The rate of resistance to tetracycline doubled between 2013 (29.2 %) and 2015 (63.5 %), and remained on the same level in 2017 (62.1 %). Microbiological resistance levels to ciprofloxacin have in-creased steadily since 2008, apart from a slight fall in 2013, and the resistance level reached 50.3 % in 2017. The preva-lence of resistance to erythromycin has consistently been around 10 % since monitoring began in 2006, and has
reached an all-time low of 1.9 % in 2017 (Figure 8. c). Infor-mation in anresis.ch on antimicrobial resistance was availa-ble for more than one third of the reported human Campylo-bacter cases. Resistance levels were reported for fluoroquinolones and macrolides. Resistance levels of fluo-roquinolones were very high (above 50 %), and the trend has been rising over the last ten years.
Similar average levels of resistance to ciprofloxacin for C. jejuni (average 54.6 %) and C. coli (average 63.8 %) isolat-ed from humans were found in 17 EU countries in 2016. Resistance levels varied considerably between different countries, ranging from 33.3 % to 94.0 % for C. jejuni and from 31.3 % to 100.0 % for C. coli [7]. As a result, the Euro-pean Food Safety Authority and the European Centre for Disease Prevention and Control no longer consider fluoro-quinolones appropriate for the routine empirical treatment of human campylobacteriosis due to the high level of resist-ance [7]. In Switzerland, resistance levels to macrolides (erythromycin) are generally low, whereas in EU countries, resistance levels range from 0.0 % to 6.6 % for C. jejuni (av-erage 2.1 %) and from 0.0 % to 63.2 % for C. coli (average 11.0 %) [7].
The available data do not allow a direct comparison of resis-tance in Campylobacter isolates from humans and animals. The sampling strategy and methodology used for testing isolates are not the same for animals and humans. In con-trast, interpretation based on clinical breakpoints (human isolates) or epidemiological cutoffs (animal isolates) are equal, except for tetracyclines. Therefore, it must be as-sumed that the increasing trend in fluoroquinolone resis-tance in Campylobacter isolates from humans over the last ten years is due to the increase of resistance in Campylobac-
year
% resistant C. jejuni in broilers
0
5
10
15
20
25
30
35
40
45
50
55
2008 (N=115) 2009 (N=131) 2010 (N=107) 2011 (N=150) 2012 (N=171) 2013 (N=158) 2014 (N=159) 2015 (n/a) 2016 (N=140)
Ciprofloxacin Erythromycin Gentamicin Streptomycin Tetracycline
Figure 8. b: Trends in ciprofloxacin, erythromycin, gentamicin, streptomycin and tetracycline resistance in C. jejuni from broilers between 2008 and 2016 (N = total number of tested isolates; values for 2015 interpolated [n/a]).

84 Resistance in zoonotic bacteria in animals from primary production samples
ter among animals, especially C. jejuni and C. coli from broil-ers. Campylobacter infections may be acquired from domes-tically produced and imported meat or during foreign travel. A study in Switzerland has shown that resistance levels for ciprofloxacin differ substantially in isolates from domestical-ly produced and imported broiler meat [9]. On the other hand, another Swiss study has shown that campylobacte-riosis derived from abroad does not occur very frequently among Swiss patients [10]. Knowledge on the molecular mechanisms responsible for the significant increase of the resistance level to ciprofloxacin and tetracycline in Campylo-bacter is urgently needed. Facts concerning the persistence of quinolone and tetracycline resistance in thermophilic Campylobacter from poultry is summarized in Textbox “Per-sistence of quinolone and tetracycline resistance in thermo-philic Campylobacter from poultry.”
8.2 Salmonella spp.Salmonella is the second most important zoonotic bacterial pathogen in Switzerland and the EU [1], [2]. Salmonellosis in humans has to be notified (ordinance of the FOPH on labo-ratory reports), whereas the notification of resistance pro-files of these findings is not mandatory.
Human salmonellosis usually does not require antimicrobial treatment. However, in some patients, Salmonella infection can cause serious illness and sepsis. In these cases, effec-tive antimicrobials are essential for treatment and can be lifesaving. The treatment of choice for Salmonella infections is fluoroquinolones for adults and third-generation cephalo-sporins for children.
Information on antimicrobial resistance in anresis.ch was available for close to one third of the reported human Salmo-nella cases. Resistance rates are only available for ami-nopenicillins, ceftriaxone, trimethoprim-sulfamethoxazole and quinolones (Table 8. d). Serovar typing in human medi-cine is only performed for a minority of isolates. Although this information is interesting for epidemiologic purposes, in contrast to susceptibility-testing results, it is irrelevant for treatment decisions. As in veterinary medicine, S. Typhimu-rium and S. Enteritidis are the most frequent serovars spec-ified, and they differ in their antimicrobial resistance profile.
Animals can be carriers of Salmonella without showing any clinical signs. Poultry in particular often show no signs of infection. In cattle, Salmonella infection can cause fever, di-arrhea and abortion. Fever and diarrhea are less common in pigs. Transmission of Salmonella from animals to humans usually occurs through food. A wide variety of foodstuffs of animal and plant origin can be contaminated with Salmonel-la. In special settings (e. g. reptiles) Salmonella can also be transmitted through direct contact with infected animals.
In Europe, S. Enteritidis and S. Typhimurium are the most common serovars in human infections. S. Enteritidis cases are mostly associated with the consumption of contaminat-ed eggs and poultry meat, whereas S. Typhimurium cases are mostly associated with the consumption of contaminat-ed pork, beef and poultry meat. Findings of Salmonella in animals have to be notified in Switzerland, and antibacterial susceptibility is tested in one isolate from each animal spe-cies involved per incident. Isolates obtained from poultry flock samples collected within the national control program for Salmonella are also included in the data.
2008 (n/a)
2009 (N=191)
2010 (N=192)
2011 (N=185)
2012 (N=144)
2013 (N=226)
2014 (n/a)
2015 (N=156)
2016 (n/a)
2017(N=161)
% resistant C. coli in fattening pigs
Ciprofloxacin Erythromycin Gentamicin Streptomycin Tetracycline
0
10
20
30
40
50
60
70
80
90
100
year
Figure 8. c: Trends in ciprofloxacin, erythromycin, gentamicin, streptomycin and tetracycline resistance in C. coli from fattening pigs between 2008 and 2017 (N = total number of tested isolates; values for 2008, 2014 and 2016 interpolated [n/a]).

Resistance in zoonotic bacteria in animals from primary production samples 85
TextboxPersistence of Quinolone and Tetracycline Resistance in Thermophilic Campylobacter from Poultry
Sonja Kittl1
1 Institute for Veterinary Bacteriology, Vetsuisse Faculty University of Berne
Since 2008, Switzerland has observed a steady decrease in sales of tetracycline and, since 2016, also of fluoroquinolo-nes for use in food-producing animals, although species-spe-cific data are not available so far. Unfortunately, this positive development did not directly translate to a reduction of the respective resistance rates in thermophilic Campylobacter. Possible reasons for this outcome are discussed hereafter.
Resistance to fluoroquinolones in Campylobacter (C.) jejuni and C. coli is normally mediated through the point mutation C257T in the quinolone-resistance-determining region (QRDR) of the gyrA gene (encoding DNA gyrase) [1]. This single point mutation is sufficient to confer resistance, and no further modifications are necessary. Previous studies of Swiss isolates were able to detect this mutation in all pheno-typically resistant human strains [2] as well as in chicken meat isolates from retail and from slaughter [3]. The point mutation in the QRDR was additionally found to entail no fitness cost. As a matter of fact, it might even enhance the ability to colonize the chicken host [4]. Furthermore, Campy-lobacter were found to rapidly develop quinolone resistance even under treatment [5]. Thus, it is not surprising that over the last years we have seen a steady increase in quinolone-re-sistant isolates from both humans and livestock. Likewise, the EFSA reports a statistically significant increasing trend for fluoroquinolone-resistant Campylobacter in poultry in several other European countries [6]. Nevertheless, there are large differences between countries, with the Nordic European countries showing far lower rates of resistance compared to other European countries, including Switzer-land [6]. Veterinary use of fluoroquinolones is strictly regu-lated in Denmark, where the poultry industry even com-pletely ceased their usage in 2009. This measure was able to halt the increasing trend of ciprofloxacin resistance in Campylobacter, making Denmark one of the countries with the lowest rates. However, a lasting decrease was not ob-served [7]. Similar results were obtained in the US, where quinolone resistance levels in slaughter chickens remained constant after the FDA withdrew the approval for enrofloxa-cin use in poultry in 2005 [7]. This highlights the difficulty of fighting quinolone resistance in thermophilic Campylobacter once it is established, even using very strict measures, and does not bode well for the future.
The situation appears slightly more hopeful for tetracycline. Tetracycline resistance in thermophilic Campylobacter is normally mediated by the tet(O) gene encoding a ribosomal protection protein [8]. The gene can be located on the chro-
mosome or on transferable plasmids [8, 9]. Location on transferable plasmids allows for a rapid spread of resistance following tetracycline use. Tet(O)-carrying plasmids can also harbor additional resistance genes, e.g. to kanamycin [9], which can lead to coselection of resistances. However, so far there are no reports (known to the authors) of the tet(O) gene increasing fitness of Campylobacter in absence of the antibiotic. Thus, in the long run, efforts to reduce tetracy-cline resistance might be more rewarding than for quinolo-nes. Nevertheless, an increasing trend in tetracycline resis-tance over the last years was also observed in other European countries [6].
Genetic analyses to determine whether the molecular mechanisms responsible for the observed parallel increase of quinolone and tetracycline resistance in thermophilic Campylobacter in poultry are linked or not will be a task for the future.
In conclusion, long-term and international commitment will be necessary to reduce resistance, especially quinolone re-sistance, in Campylobacter. Additionally, it should not be forgotten that decreasing Campylobacter prevalence in food would also be highly beneficial, reducing the incidence of human cases and thus also decreasing quinolone use in hu-mans.
References[1] Luangtongkum T, Jeon B, Han J, Plummer P, Logue
CM, Zhang Q. Antibiotic resistance in Campylobacter: emergence, transmission and persistence. Future Microbiol. 2009;4(2):189–200. doi: 10.2217/17460913.4.2.189. PubMed PMID: 19257846; PubMed Central PMCID: PMC2691575.
[2] Kittl S, Kuhnert P, Hachler H, Korczak BM. Comparison of genotypes and antibiotic resistance of Campylobac-ter jejuni isolated from humans and slaughtered chick-ens in Switzerland. J Appl Microbiol. 2011;110(2):513–520. doi: 10.1111/j.1365–2672.2010.04906.x. PubMed PMID: 21143711.
[3] Kittl S, Korczak BM, Niederer L, Baumgartner A, Buettner S, Overesch G, et al. Comparison of geno-types and antibiotic resistances of Campylobacter jejuni and Campylobacter coli on chicken retail meat and at slaughter. Applied and environmental microbiol-ogy. 2013;79(12):3875–3878. doi: 10.1128/AEM.00493-13. PubMed PMID: 23584778; PubMed Central PMCID: PMC3675953.
[4] Luo N, Pereira S, Sahin O, Lin J, Huang S, Michel L, et al. Enhanced in vivo fitness of fluoroquinolone-resis-tant Campylobacter jejuni in the absence of antibiotic selection pressure. Proc Natl Acad Sci U S A. 2005;102(3):541–546. Epub 2005/01/07. doi: 10.1073/pnas.0408966102. PubMed PMID: 15634738; Pub-Med Central PMCID: PMCPMC545549.

86 Resistance in zoonotic bacteria in animals from primary production samples
[5] Luo N, Sahin O, Lin J, Michel LO, Zhang Q. In vivo selection of Campylobacter isolates with high levels of fluoroquinolone resistance associated with gyrA mutations and the function of the CmeABC efflux pump. Antimicrob Agents Chemother. 2003;47(1):390–394. PubMed PMID: 12499221; PubMed Central PMCID: PMCPMC148968.
[6] EFSA. The European Union summary report on antimi-crobial resistance in zoonotic and indicator bacteria from humans, animals and food in 2016. EFSA Journal. 2018. doi: 10.2903/j.efsa.2018.5182.
[7] EFSA. ECDC, EFSA and EMA Joint Scientific Opinion on a list of outcome indicators as regards surveillance of antimicrobial resistance and antimicrobial consump-tion in humans and food-producing animals. EFSA Journal. 2017. doi: 10.2903/j.efsa.2017.4666.
[8] Zhao S, Tyson GH, Chen Y, Li C, Mukherjee S, Young S, et al. Whole-Genome Sequencing Analysis Accu-rately Predicts Antimicrobial Resistance Phenotypes in Campylobacter spp. Applied and environmental micro-biology. 2016;82(2):459–466. Epub 2015/11/01. doi: 10.1128/AEM.02873-15. PubMed PMID: 26519386; PubMed Central PMCID: PMCPMC4711122.
[9] Crespo MD, Altermann E, Olson J, Miller WG, Chan-drashekhar K, Kathariou S. Novel plasmid conferring kanamycin and tetracycline resistance in the turkey-de-rived Campylobacter jejuni strain 11601MD. Plasmid. 2016;86:32–737. Epub 2016/06/09. doi: 10.1016/j.plasmid.2016.06.001. PubMed PMID: 27268853.
8.2.1 Salmonella in animals
This chapter includes antimicrobial resistances of S. Enter-itidis, S. Typhimurium and its monophasic variant in live-stock, derived from diseased and/or infected animals. Poul-try and cattle samples were available in 2016 and 2017. Isolates from pigs were detected in 2017 only.
In 2016, a total of 80 Salmonella isolates (29 from poultry, 51 from cattle) originating from different holdings and/or differ-ent sampling dates were available for susceptibility testing and are presented in Table 8. e and Table 8. f.S. Typhimurium was identified in 41 (6 from poultry, 35 from
cattle), S. Enteritidis in 29 (22 from poultry, 7 from cattle) and monophasic S. Typhimurium in 10 (1 from poultry, 9 from cattle) of the 80 isolates.
One of the S. Enteritidis isolates was resistant to colistin, while the other 28 isolates were fully susceptible to all tested antimicrobials. S. Enteritidis isolates are included in the Sal-monella spp. columns in Table 8. e and Table 8. f. Approxi-mately 80 % of the S. Typhimurium isolates from poultry (5 isolates) and cattle (28 isolates) were susceptible to all tested antimicrobials.
Salmonella ser. enteritidis 2017
West North–East South Total Trend
Antimicrobial n % n % n % n % 95 % CI 4y 10y
Aminopenicillin 99 4.0 % 74 12.2 % 5 0.0 % 178 7.3 % 4.3–12.1 – –
Ceftriaxone 99 0.0 % 44 0.0 % 1 0.0 % 144 0.0 % 0–2.6 – –
Trimethoprim– sulfamethoxazole
98 3.1 % 70 7.1 % 5 0.0 % 173 4.6 % 2.4–8.9 – –
Quinolones 82 8.5 % 66 9.1 % 5 0.0 % 153 8.5 % 5–14 –
Salmonella ser. typhimurium 2017
West North–East South Total Trend
Antimicrobial n % n % n % n % 95 % CI 4y 10y
Aminopenicillin 16 81.3 % 26 38.5 % 3 66.7 % 45 55.6 % 41.2–69.1 – –
Ceftriaxone 16 6.3 % 21 0.0 % 0 – 37 2.7 % 0.5–13.8 –
Trimethoprim– sulfamethoxazole
16 18.8 % 23 8.7 % 3 0.0 % 42 11.9 % 5.2–25 – –
Quinolones 16 18.8 % 26 15.4 % 3 0.0 % 45 15.6 % 7.7–28.8 –
West (GE, NE, VD, JU, FR), South (TI), North–East (other cantons) according to linguistic regions.95 % confidence intervals (CI) were calculated by the Wilson score method, calculations of trends were performed by logistic regression.
Table 8. d: Non-susceptibility rates of Salmonella from human clinical isolates in 2017.

Resistance in zoonotic bacteria in animals from primary production samples 87
Table 8. e: Occurrence of resistance in Salmonella spp., Salmonella Typhimurium and its monophasic variant from poultry in 2016.
2016 Salmonella spp. (N=29) Salmonella Typhimurium (N=6) Monophasic Salmonella Typhimurium (N=1)
Antimicrobials n % 95 % CI n % 95 % CI n % 95 % CI
Ampicillin 1 3.4 0.6–17.2 0 0.0 0.0–39.0 1 100.0 20.7–100.0
Azithromycin 0 0.0 0.0–11.7 0 0.0 0.0–39.0 0 0.0 0.0–79.3
Cefotaxime 0 0.0 0.0–11.7 0 0.0 0.0–39.0 0 0.0 0.0–79.3
Ceftazidime 0 0.0 0.0–11.7 0 0.0 0.0–39.0 0 0.0 0.0–79.3
Chloramphenicol 0 0.0 0.0–11.7 0 0.0 0.0–39.0 0 0.0 0.0–79.3
Ciprofloxacin 0 0.0 0.0–11.7 0 0.0 0.0–39.0 0 0.0 0.0–79.3
Colistin 2 6.9 1.9–22.0 1 16.7 3.0–56.4 0 0.0 0.0–79.3
Gentamicin 0 0.0 0.0–11.7 0 0.0 0.0–39.0 0 0.0 0.0–79.3
Meropenem 0 0.0 0.0–11.7 0 0.0 0.0–39.0 0 0.0 0.0–79.3
Nalidixic acid 0 0.0 0.0–11.7 0 0.0 0.0–39.0 0 0.0 0.0–79.3
Sulfamethoxazole 1 3.4 0.6–17.2 0 0.0 0.0–39.0 1 100.0 20.7–100.0
Tetracycline 1 3.4 0.6–17.2 0 0.0 0.0–39.0 1 100.0 20.7–100.0
Tigecycline 0 0.0 0.0–11.7 0 0.0 0.0–39.0 0 0.0 0.0–79.3
Trimethoprim 0 0.0 0.0–11.7 0 0.0 0.0–39.0 0 0.0 0.0–79.3
Number of resistances
None 26 89.7 73.6–96.4 5 83.3 43.6–97.0 0 0.0 0.0–79.3
1 antimicrobial 2 6.9 1.9–22.0 1 16.7 3.0–56.4 0 0.0 0.0–79.3
2 antimicrobials 0 0.0 0.0–11.7 0 0.0 0.0–39.0 0 0.0 0.0–79.3
3 antimicrobials 1 3.4 0.6–17.2 0 0.0 0.0–39.0 1 100.0 20.7–100.0
4 antimicrobials 0 0.0 0.0–11.7 0 0.0 0.0–39.0 0 0.0 0.0–79.3
>4 antimicrobials 0 0.0 0.0–11.7 0 0.0 0.0–39.0 0 0.0 0.0–79.3
Number of resistant strains (n) and prevalence of resistance ( %) with 95 % confidence interval (95 % CI)
One S. Typhimurium isolate from poultry was microbiologi-cally resistant to colistin (Table 8. e). Multiple resistance to ampicillin, sulfamethoxazole and tetracycline was found in four of the 35 S. Typhimurium isolates from cattle. One iso-late was additionally resistant to chloramphenicol (Ta-ble 8. f). Two S. Typhimurium isolates from cattle were re-sistant to sulfamethoxazole only, and one isolate was resistant to ampicillin and sulfamethoxazole.The single monophasic S. Typhimurium isolate from poultry showed microbiological resistance to three antimicrobials (ampicillin, sulfamethoxazole, tetracycline) (Table 8. e). All nine monophasic S. Typhimurium isolates from cattle were resistant to ampicillin and sulfamethoxazole (Table 8. f). Eight of the nine isolates were additionally resistant to tetra-cycline.
The distribution of the minimum inhibitory concentrations (MICs) and multiresistance patterns for Salmonella spp. iso-lates for 2016 is shown in Annex II (Table I.1 to Table I.2 and Table I.32 to Table I.33).
In 2017, 31 Salmonella spp. isolates from poultry, 66 from cattle and 10 from pigs underwent susceptibility testing (Ta-ble 8. g, Table 8. h and Table 8. i). S. Typhimurium was iden-tified in 51 (12 from poultry, 39 from cattle), S. Enteritidis in 26 (15 from poultry, 9 from cattle, 2 from pigs) and monopha-
sic S. Typhimurium in 30 (4 from poultry, 18 from cattle, 8 from pigs) of the 107 isolates.
All 26 S. Enteritidis isolates from poultry, cattle and pigs were fully susceptible to all tested antimicrobials. S. Enter-itidis isolates are included in the Salmonella spp. column in Table 8. g, Table 8. h, and Table 8. i.
The majority of S. Typhimurium isolates from poultry (83.3 %) and from cattle (82.1 %) were susceptible to all test-ed antimicrobials (Table 8. g and Table 8. h). Among the oth-er S. Typhimurium isolates from poultry, one was microbio-logically resistant to colistin and one to ampicillin and sulfamethoxazole. Also, two S. Typhimurium isolates from cattle showed resistance to ampicillin, chloramphenicol, sul-famethoxazole and tetracycline. Resistance to ampicillin, sulfamethoxazole and tetracycline was observed in one S. Typhimurium isolate. Single resistance to tetracycline was detected in 4 S. Typhimurium isolates from cattle.
Three of the four monophasic S. Typhimurium isolates from poultry showed microbiological resistance to three antimi-crobials (ampicillin, sulfamethoxazole, tetracycline) and one was resistant to sulfamethoxazole only (Table 8. g). Sixteen monophasic S. Typhimurium isolates from cattle were re-sistant to ampicillin, sulfamethoxazole and tetracycline. Re-

88 Resistance in zoonotic bacteria in animals from primary production samples
sistance to ampicillin and sulfamethoxazole was detected in one isolate (Table 8. h). The two monophasic S. Typhimuri-um isolates from pigs showed microbiological resistance to ampicillin, sulfamethoxazole and tetracycline (Table 8. i).
The distribution of the minimum inhibitory concentrations (MICs) and multiresistance patterns for Salmonella spp. iso-lates in 2017 is shown in Annex II (Table I.3 to Table I.5 and Table I.34 to Table I.36).
8.2.2 Nontyphoidal Salmonella in human clinical isolates
For salmonellosis, 1,848 laboratory-confirmed cases in hu-mans were reported in 2017. This represents a notification rate of 22 cases per 100,000 inhabitants. The most fre-quently reported serovars were S. Enteritidis (38 %), S. Ty-phimurium (13 %) and the monophasic variant 4,12,:i:- (11 %). Resistance data from anresis.ch were available for about one third of all laboratory-confirmed cases.
Resistance in non-typhoidal human Salmonella isolates was high for aminopenicillin (20.6 %), intermediate for quinolones (10.9 %) and low for ceftriaxone and trimetho-prim-sulfamethoxazole (1.1 % and 3.7 % respectively). In 2017, the most frequently isolated serovars were S. Enter-itidis (n=178) and S. Typhimurium (n=45), but 389 isolates
were not specified to the serovar level. Non-susceptibility rates were higher in S. Typhimurium than in S. Enteritidis for aminopenicillins (55.6 % vs. 7.3 %), trimethoprim-sul-famethoxazole (11.9 % vs. 4.6 %) and fluoroquinolones (15.6 % vs. 8.5 %). Ceftriaxone resistance was rare in both serovars (Table 8. d). Annual non-susceptibility rates have been stable for ceftriaxone since 2008 and have decreased significantly for aminopenicillins and trimethoprim-sul-famethoxazole during the last ten years (Tab. 8.d, Fig. 8. d). For quinolones, the annual non-susceptibility rates in-creased significantly from 2008 to 2017, but have remained stable during the last four years.
8.2.3 Discussion
The prevalence of Salmonella spp. in food-producing animals in Switzerland is very low as a consequence of long-term control programs. Because of this, only a few Salmonella iso-lates from animals, either from clinical material or from Sal-monella eradication programs, were available over the last years (Figure 8. e). Hence, rates of resistance and their long-term trends should be interpreted with caution.
Between 2016 and 2017, susceptibility of Salmonella spp. to all tested antimicrobials decreased from 89.7 % to 80.7 % for isolates from poultry and from 68.6 % to 62.1 % for isolates from cattle. Overall, the situation regarding antibiotic resis-
Table 8. f: Occurrence of resistance in Salmonella spp., Salmonella Typhimurium and its monophasic variant from cattle in 2016.
2016 Salmonella spp. (N=51) Salmonella Typhimurium (N=35) Monophasic Salmonella Typhimurium (N=9)
Antimicrobials n % 95 % CI n % 95 % CI n % 95 % CI
Ampicillin 14 27.5 17.1–40.9 5 14.3 6.3–29.4 9 100.0 70.1–100.0
Azithromycin 0 0.0 0.0–7.0 0 0.0 0.0–9.9 0 0.0 0.0–29.9
Cefotaxime 0 0.0 0.0–7.0 0 0.0 0.0–9.9 0 0.0 0.0–29.9
Ceftazidime 0 0.0 0.0–7.0 0 0.0 0.0–9.9 0 0.0 0.0–29.9
Chloramphenicol 1 2.0 0.3–10.3 1 2.9 0.5–14.5 0 0.0 0.0–29.9
Ciprofloxacin 0 0.0 0.0–7.0 0 0.0 0.0–9.9 0 0.0 0.0–29.9
Colistin 0 0.0 0.0–7.0 0 0.0 0.0–9.9 0 0.0 0.0–29.9
Gentamicin 0 0.0 0.0–7.0 0 0.0 0.0–9.9 0 0.0 0.0–29.9
Meropenem 0 0.0 0.0–7.0 0 0.0 0.0–9.9 0 0.0 0.0–29.9
Nalidixic acid 0 0.0 0.0–7.0 0 0.0 0.0–9.9 0 0.0 0.0–29.9
Sulfamethoxazole 16 31.4 20.3–45.0 7 20.0 10.0–35.9 9 100.0 70.1–100.0
Tetracycline 12 23.5 14.0–36.8 4 11.4 4.5–26.0 8 88.9 56.5–98.0
Tigecycline 0 0.0 0.0–7.0 0 0.0 0.0–9.9 0 0.0 0.0–29.9
Trimethoprim 0 0.0 0.0–7.0 0 0.0 0.0–9.9 0 0.0 0.0–29.9
Number of resistances
None 35 68.6 55.0–79.7 28 80.0 64.1–90.0 0 0.0 0.0–29.9
1 antimicrobial 2 3.9 1.1–13.2 2 5.7 1.6–18.6 0 0.0 0.0–29.9
2 antimicrobials 2 3.9 1.1–13.2 1 2.9 0.5–14.5 1 11.1 2.0–43.5
3 antimicrobials 11 21.6 12.5–34.6 3 8.6 3.0–22.4 8 88.9 56.5–98.0
4 antimicrobials 1 2.0 0.3–10.3 1 2.9 0.5–14.5 0 0.0 0.0–29.9
>4 antimicrobials 0 0.0 0.0–7.0 0 0.0 0.0–9.9 0 0.0 0.0–29.9
Number of resistant strains (n) and prevalence of resistance ( %) with 95 % confidence interval (95 % CI)
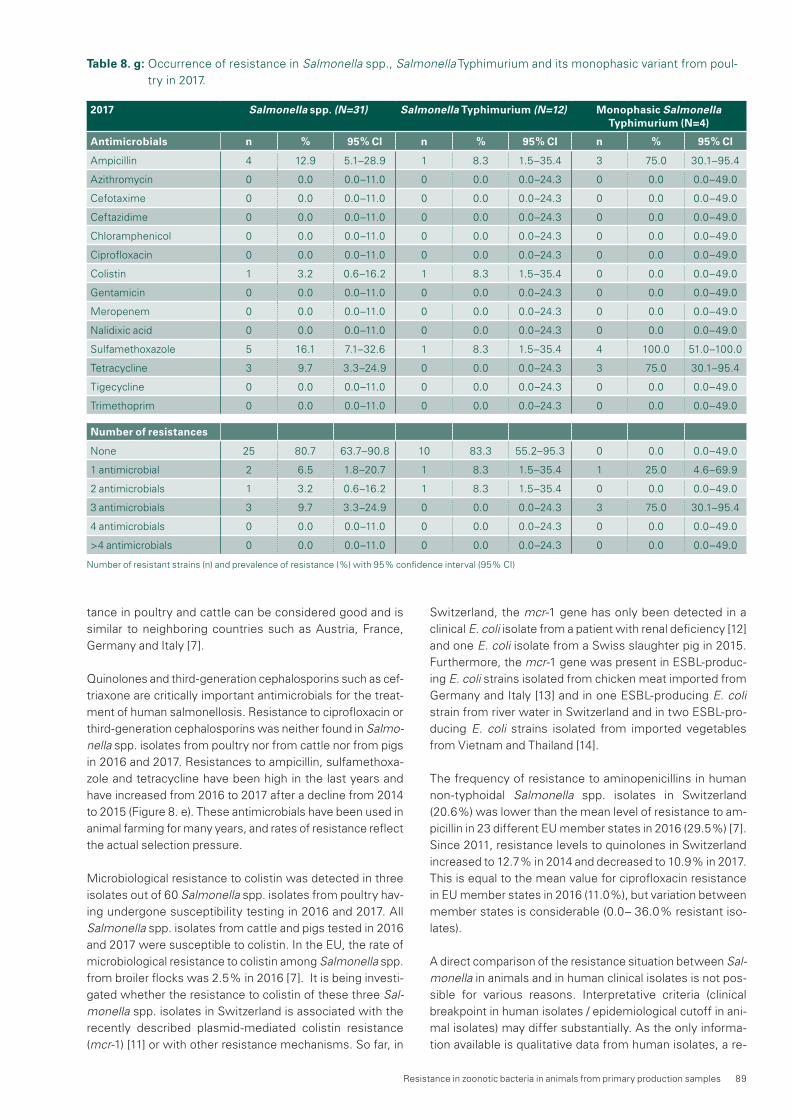
Resistance in zoonotic bacteria in animals from primary production samples 89
tance in poultry and cattle can be considered good and is similar to neighboring countries such as Austria, France, Germany and Italy [7].
Quinolones and third-generation cephalosporins such as cef-triaxone are critically important antimicrobials for the treat-ment of human salmonellosis. Resistance to ciprofloxacin or third-generation cephalosporins was neither found in Salmo-nella spp. isolates from poultry nor from cattle nor from pigs in 2016 and 2017. Resistances to ampicillin, sulfamethoxa-zole and tetracycline have been high in the last years and have increased from 2016 to 2017 after a decline from 2014 to 2015 (Figure 8. e). These antimicrobials have been used in animal farming for many years, and rates of resistance reflect the actual selection pressure.
Microbiological resistance to colistin was detected in three isolates out of 60 Salmonella spp. isolates from poultry hav-ing undergone susceptibility testing in 2016 and 2017. All Salmonella spp. isolates from cattle and pigs tested in 2016 and 2017 were susceptible to colistin. In the EU, the rate of microbiological resistance to colistin among Salmonella spp. from broiler flocks was 2.5 % in 2016 [7]. It is being investi-gated whether the resistance to colistin of these three Sal-monella spp. isolates in Switzerland is associated with the recently described plasmid-mediated colistin resistance (mcr-1) [11] or with other resistance mechanisms. So far, in
Switzerland, the mcr-1 gene has only been detected in a clinical E. coli isolate from a patient with renal deficiency [12] and one E. coli isolate from a Swiss slaughter pig in 2015. Furthermore, the mcr-1 gene was present in ESBL-produc-ing E. coli strains isolated from chicken meat imported from Germany and Italy [13] and in one ESBL-producing E. coli strain from river water in Switzerland and in two ESBL-pro-ducing E. coli strains isolated from imported vegetables from Vietnam and Thailand [14].
The frequency of resistance to aminopenicillins in human non-typhoidal Salmonella spp. isolates in Switzerland (20.6 %) was lower than the mean level of resistance to am-picillin in 23 different EU member states in 2016 (29.5 %) [7]. Since 2011, resistance levels to quinolones in Switzerland increased to 12.7 % in 2014 and decreased to 10.9 % in 2017. This is equal to the mean value for ciprofloxacin resistance in EU member states in 2016 (11.0 %), but variation between member states is considerable (0.0– 36.0 % resistant iso-lates).
A direct comparison of the resistance situation between Sal-monella in animals and in human clinical isolates is not pos-sible for various reasons. Interpretative criteria (clinical breakpoint in human isolates / epidemiological cutoff in ani-mal isolates) may differ substantially. As the only informa-tion available is qualitative data from human isolates, a re-
Table 8. g: Occurrence of resistance in Salmonella spp., Salmonella Typhimurium and its monophasic variant from poul-try in 2017.
2017 Salmonella spp. (N=31) Salmonella Typhimurium (N=12) Monophasic Salmonella Typhimurium (N=4)
Antimicrobials n % 95 % CI n % 95 % CI n % 95 % CI
Ampicillin 4 12.9 5.1–28.9 1 8.3 1.5–35.4 3 75.0 30.1–95.4
Azithromycin 0 0.0 0.0–11.0 0 0.0 0.0–24.3 0 0.0 0.0–49.0
Cefotaxime 0 0.0 0.0–11.0 0 0.0 0.0–24.3 0 0.0 0.0–49.0
Ceftazidime 0 0.0 0.0–11.0 0 0.0 0.0–24.3 0 0.0 0.0–49.0
Chloramphenicol 0 0.0 0.0–11.0 0 0.0 0.0–24.3 0 0.0 0.0–49.0
Ciprofloxacin 0 0.0 0.0–11.0 0 0.0 0.0–24.3 0 0.0 0.0–49.0
Colistin 1 3.2 0.6–16.2 1 8.3 1.5–35.4 0 0.0 0.0–49.0
Gentamicin 0 0.0 0.0–11.0 0 0.0 0.0–24.3 0 0.0 0.0–49.0
Meropenem 0 0.0 0.0–11.0 0 0.0 0.0–24.3 0 0.0 0.0–49.0
Nalidixic acid 0 0.0 0.0–11.0 0 0.0 0.0–24.3 0 0.0 0.0–49.0
Sulfamethoxazole 5 16.1 7.1–32.6 1 8.3 1.5–35.4 4 100.0 51.0–100.0
Tetracycline 3 9.7 3.3–24.9 0 0.0 0.0–24.3 3 75.0 30.1–95.4
Tigecycline 0 0.0 0.0–11.0 0 0.0 0.0–24.3 0 0.0 0.0–49.0
Trimethoprim 0 0.0 0.0–11.0 0 0.0 0.0–24.3 0 0.0 0.0–49.0
Number of resistances
None 25 80.7 63.7–90.8 10 83.3 55.2–95.3 0 0.0 0.0–49.0
1 antimicrobial 2 6.5 1.8–20.7 1 8.3 1.5–35.4 1 25.0 4.6–69.9
2 antimicrobials 1 3.2 0.6–16.2 1 8.3 1.5–35.4 0 0.0 0.0–49.0
3 antimicrobials 3 9.7 3.3–24.9 0 0.0 0.0–24.3 3 75.0 30.1–95.4
4 antimicrobials 0 0.0 0.0–11.0 0 0.0 0.0–24.3 0 0.0 0.0–49.0
>4 antimicrobials 0 0.0 0.0–11.0 0 0.0 0.0–24.3 0 0.0 0.0–49.0
Number of resistant strains (n) and prevalence of resistance ( %) with 95 % confidence interval (95 % CI)

90 Resistance in zoonotic bacteria in animals from primary production samples
Table 8. h: Occurrence of resistance in Salmonella spp., Salmonella Typhimurium and its monophasic variant from cattle in 2017.
2017 Salmonella spp. (N=66) Salmonella Typhimurium (N=39) Monophasic Salmonella Typhimurium (N=18)
Antimicrobials n % 95 % CI n % 95 % CI n % 95 % CI
Ampicillin 20 30.3 20.6–42.2 3 7.7 2.7–20.3 17 94.4 74.2–99.0
Azithromycin 0 0.0 0.0–5.5 0 0.0 0.0–9.0 0 0.0 0.0–17.6
Cefotaxime 0 0.0 0.0–5.5 0 0.0 0.0–9.0 0 0.0 0.0–17.6
Ceftazidime 0 0.0 0.0–5.5 0 0.0 0.0–9.0 0 0.0 0.0–17.6
Chloramphenicol 2 3.0 0.8–10.4 2 5.1 1.4–16.9 0 0.0 0.0–17.6
Ciprofloxacin 0 0.0 0.0–5.5 0 0.0 0.0–9.0 0 0.0 0.0–17.6
Colistin 0 0.0 0.0–5.5 0 0.0 0.0–9.0 0 0.0 0.0–17.6
Gentamicin 0 0.0 0.0–5.5 0 0.0 0.0–9.0 0 0.0 0.0–17.6
Meropenem 0 0.0 0.0–5.5 0 0.0 0.0–9.0 0 0.0 0.0–17.6
Nalidixic acid 0 0.0 0.0–5.5 0 0.0 0.0–9.0 0 0.0 0.0–17.6
Sulfamethoxazole 21 31.8 21.8–43.8 3 7.7 2.7–20.3 18 100.0 82.4–100.0
Tetracycline 23 34.8 24.5–46.9 7 17.9 9.0–32.7 16 88.9 67.2–96.9
Tigecycline 0 0.0 0.0–5.5 0 0.0 0.0–9.0 0 0.0 0.0–17.6
Trimethoprim 0 0.0 0.0–5.5 0 0.0 0.0–9.0 0 0.0 0.0–17.6
Number of resistances
None 41 62.1 50.1–72.9 32 82.1 67.3–91.0 0 0.0 0.0–17.6
1 antimicrobial 5 7.6 3.3–16.5 4 10.3 4.1–23.6 1 5.6 1.0–25.8
2 antimicrobials 1 1.5 0.3–8.1 0 0.0 0.0–9.0 1 5.6 1.0–25.8
3 antimicrobials 17 25.8 16.7–37.4 1 2.6 0.5–13.2 16 88.9 67.2–96.9
4 antimicrobials 2 3.0 0.8–10.4 2 5.1 1.4–16.9 0 0.0 0.0–17.6
>4 antimicrobials 0 0.0 0.0–5.5 0 0.0 0.0–9.0 0 0.0 0.0–17.6
Number of resistant strains (n) and prevalence of resistance ( %) with 95 % confidence interval (95 % CI)
Figure 8. d: Trends in aminopenicillin, ceftriaxone, trimethoprim-sulfamethoxazole and fluoroquinolone resistance in non-typhoidal Salmonella from human clinical isolates between 2008 and 2017.
0%
10%
20%
30%
40%
2008 2009 2010 2011 2012 2013 2014 2015 2016 2017
Aminopenicillin Ceftriaxone Trimethoprim-sulfamethoxazole
Fluoroquinolones
interpretation of the results using the same cutoff values is not possible. Regarding the favorable Salmonella situation in Swiss livestock, it is likely that a substantial part of Salmo-nella infections is acquired through imported food or foreign travel. Data on antimicrobial resistance in Salmonella from
imported food and information regarding the origin of the infection (domestic/abroad) would be necessary to com-plete the picture.

Resistance in zoonotic bacteria in animals from primary production samples 91
Table 8. i: Occurrence of resistance in Salmonella spp. and monophasic Salmonella Typhimurium from fattening pigs in 2017.
2017 Salmonella spp. (N=10) Monophasic Salmonella Typhimurium (N=8)
Antimicrobials n % 95 % CI n % 95 % CI
Ampicillin 8 80.0 49.0–94.3 8 100.0 67.6–100.0
Azithromycin 0 0.0 0.0–27.8 0 0.0 0.0–32.4
Cefotaxime 0 0.0 0.0–27.8 0 0.0 0.0–32.4
Ceftazidime 0 0.0 0.0–27.8 0 0.0 0.0–32.4
Chloramphenicol 0 0.0 0.0–27.8 0 0.0 0.0–32.4
Ciprofloxacin 0 0.0 0.0–27.8 0 0.0 0.0–32.4
Colistin 0 0.0 0.0–27.8 0 0.0 0.0–32.4
Gentamicin 0 0.0 0.0–27.8 0 0.0 0.0–32.4
Meropenem 0 0.0 0.0–27.8 0 0.0 0.0–32.4
Nalidixic acid 0 0.0 0.0–27.8 0 0.0 0.0–32.4
Sulfamethoxazole 8 80.0 49.0–94.3 8 100.0 67.6–100.0
Tetracycline 8 80.0 49.0–94.3 8 100.0 67.6–100.0
Tigecycline 0 0.0 0.0–27.8 0 0.0 0.0–32.4
Trimethoprim 0 0.0 0.0–27.8 0 0.0 0.0–32.4
Number of resistances n % 95 % CI n % 95 % CI
None 2 20.0 5.7–51.0 0 0.0 0.0–32.4
1 antimicrobial 0 0.0 0.0–27.8 0 0.0 0.0–32.4
2 antimicrobials 0 0.0 0.0–27.8 0 0.0 0.0–32.4
3 antimicrobials 8 80.0 49.0–94.3 8 100.0 67.6–100.0
4 antimicrobials 0 0.0 0.0–27.8 0 0.0 0.0–32.4
>4 antimicrobials 0 0.0 0.0–27.8 0 0.0 0.0–32.4
Number of resistant strains (n) and prevalence of resistance ( %) with 95 % confidence interval (95 % CI)
year
% resistant Salmonella spp.
0
5
10
15
20
25
30
35
40
45
2010 (N=80) 2011 (N=52) 2012 (N=42) 2013 (N=82) 2014 (N=42) 2015 (N=63) 2016 (N=80) 2017 (N=107)
Ampicillin Chloramphenicol Ciprofloxacin Colistin Tetracycline Sulfamethoxazole
Figure 8. e: Trends in ampicillin, chloramphenicol, ciprofloxacin, colistin, sulfamethoxazole and tetracycline resistance in Salmonella spp. from poultry, pigs and cattle between 2010 and 2017 (N = total number of tested isolates).

92 Resistance in zoonotic bacteria in animals from primary production samples
References
[1] Federal Food Safety and Veterinary Office. Bericht zur Überwachung von Zoonosen und lebensmittelbe-dingten Krankheitsausbrüchen – Daten 2017. Bern 2018; 41 pp. in German
[2] EFSA (European Food Safety Authority) and ECDC (European Centre for Disease Prevention and Control). The European Union summary report on trends and sources of zoonoses, zoonotic agents and food-borne outbreaks in 2016. EFSA Journal 2017;15(12):5077, 228 pp., doi:10.2903/j.efsa.2017.5077
[3] EFSA BIOHAZ Panel (EFSA Panel on Biological Haz-ards). Scientific Opinion on Quantification of the risk posed by broiler meat to human campylobacteriosis in the EU. EFSA Journal 2010; 8(1):1437, 89 pp., doi:10.2903/j.efsa.2010.1437
[4] Kittl et al. Source attribution of human Campylobacter isolates by MLST and Fla-Typing and association of genotypes with quinolone resistance. PLoS ONE 2013; 8(11): e81796. doi:10.1371/journal.pone.0081796
[5] WHO Advisory Group on Integrated Surveillance of Antimicrobial Resistance (AGISAR). Critically Impor-tant Antimicrobials for Human Medicine. 5th revision, 2016
[6] Kittl et al. Comparison of genotypes and antibiotic resistance of Campylobacter jejuni isolated from humans and slaughtered chickens in Switzerland. J Appl Microbiol 2011; 110(2): 513–520. doi:10.1111/j.1365-2672.2010.04906.x
[7] EFSA (European Food Safety Authority) and ECDC (European Centre for Disease Prevention and Control), 2018. The European Union summary report on antimi-crobial resistance in zoonotic and indicator bacteria from humans, animals and food in 2016. EFSA Journal 2018;16(2):5182, 270 pp. doi:10.2903/j.efsa.2018.5182
[8] Wieczorek et al. Antimicrobial resistance mechanisms among Campylobacter. Biomed Res Int 2013; 340605. doi:10.1155/2013/340605
[9] Kittl et al. Comparison of genotypes and antibiotic resistances of Campylobacter jejuni and Campylobac-ter coli on chicken retail meat and at slaughter. Appl Environ Microbiol 2013; 79(12): 3875–3878. doi:10.1128/AEM.00493-13
[10] Niederer et al. Genotypes and antibiotic resistances of Campylobacter jejuni and Campylobacter coli isolates from domestic and travel-associated human cases. Appl Environ Microbiol 2012, 78(1): 288–291. doi: 10.1128/AEM.06194-[ 11] Liu et al. Emergence of plasmid-mediated colistin resistance mechanism MCR-1 in animals and human beings in China: a micro-biological and molecular biological study. Lancet Infect Dis 2015; 16(2): 161–168. doi: 10.1016/S1473-3099(15)00424-7
[12] Poirel et al. Plasmid-mediated carbapenem and colis-tin resistance in a clinical isolate of Escherichia coli, Lancet Infect Dis 2016; 16(3): 281. doi:10.1016/S1473-3099(16)00006-2
[13] Zogg et al. Characteristics of ESBL-producing Entero-bacteriaceae and Methicillin-resistant Staphylococcus aureus (MRSA) isolated from Swiss and imported raw poultry meat collected at retail level. Schweizer Archiv für Tierheilkunde 2016; 158(6): 451–456. doi:10.17236/sat00071
[14] Zurfluh K, Poirel L, Nordmann P et al. Occurrence of the plasmid-borne mcr-1 colistin resistance gene in extended-spectrum-B-lactamase.producing Entero-bacteriaceae in river water and imported vegetable samples in Switzerland. Antimicrob Agents Chemo-ther 2016; 60: 2594–2595

Resistance in zoonotic bacteria in animals from primary production samples 93
TextboxModern Microbiological Surveillance for Antibiotic Drug Resistance
Daniel Wüthrich1,2, Dominque Blanc3, Gilbert Greub3, Vincent Perreten4, Jacques Schrenzel5,6, Roger Stephan7, Aitana Lebrand8, Ioannis Xenarios8, Richard Neher8,9, Adrian Egli1,2
1 Division of Clinical Microbiology, University Hospital Basel, Basel, Switzerland 2 Applied Microbiology Research, Department of Biomedicine, University of Basel, Basel, Switzerland 3 Institute for Microbiology, University Hospital of Lausanne, Lausanne, Switzerland 4 Institute of Veterinary Bacteriology, Vetsuisse Faculty, University of Bern, Bern, Switzerland 5 Bacteriology Laboratory, Service of Laboratory Medicine, Department of Genetics, Laboratory Medicine and Pathology, Geneva University Hospi-tals, Geneva, Switzerland 6 Genomic Research Laboratory, Service of Infectious Diseases, Geneva University Hospitals, Geneva, Switzerland 7 Institute for Food Safety, Vetsuisse Faculty, University of Zurich, Zurich, Switzerland 8 SIB Swiss Institute of Bioinformatics, Switzerland 9 Biozentrum, University of Basel, Basel, Switzerland
*CorrespondenceAdrian Egli, MD PhD Division of Clinical Microbiology University Hospital Basel Petersgraben 4 4031 Basel, Switzerland E-mail: [email protected] Phone: +41615565749
AbstractControlling multidrug-resistant (MDR) bacterial pathogens urgently requires new technical solutions. Molecular typing technologies such as whole genome sequencing (WGS) al-low high-resolution tracking of spatiotemporal patterns of pathogen transmission. But molecular surveillance can only realize its full potential when combined with rapid turn-around and interoperable and curated clinical and epidemi-ological metadata. To reach this goal, different centers need to share sequence and metadata in a timely fashion. To facil-itate such data sharing, a common database with stream-lined analysis workflows is necessary.
The challenge of antibiotic resistance and the technological revolution aheadThe European Centre for Disease Prevention and Control (www.ecdc.europe.eu) and the national surveillance system for antibiotic resistance and consumption (www.anresis.ch) have documented the rapid increase of multidrug-resistant (MDR) pathogens. The O’Neill report predicts that by 2050 the global expansion of MDR pathogens may exceed ten million fatal cases per year, thereby exceeding todays can-cer-related deaths. Similarly, the emergence of MDR bacte-
ria in veterinary medicine leads to a high economic burden and constitutes a serious public health concern. The human and animal compartments are tightly linked via various envi-ronmental sources such as sewage waters, farming, and the food chain. The transmission dynamics within and between compartments is poorly understood, but high-resolution typing via WGS can elucidate such transmissions. However, to derive actionable inferences and effective counter mea-sures from such methods, the following three key require-ments need to be met (Egli A et al. Swiss Medical Weekly 2018 in press): (i) A comprehensive high-resolution, portable, cost-effec-
tive and close to real-time molecular typing method to separate related from non-related pathogens;
(ii) Seamless integration of “classical” clinical and epidemi-ological metadata such as date of isolation, geograph-ical location, and the source of isolation with WGS data;
(iii) Timely sharing and merging interoperable metadata in the context of public health threats.
These goals require interdisciplinary teams consisting of mi-crobiologists, bioinformaticians, infectious disease special-ists and epidemiological experts. Stakeholders such as hos-pitals and governmental institutions need to maintain a surveillance platform where relevant information is gathered and analyzed in order to rapidly identify potential sources, to inform decision makers, and thus enable the interruption of the transmission chain.
High-throughput whole genome sequencing (WGS) and ge-nome data analysis of bacterial pathogens is a clear techno-logical revolution in clinical microbiology, as bacterial typing at the highest resolution is now possible, while also allowing for the identification of resistance and virulence genes. Transmission rates and routes within compartments can be analyzed in the context of spatiotemporal information [1]. It is expected that improving standardized workflows, e.g. through ISO accreditation and analytical bioinformatic pipe-lines, will substantially reduce costs over the next years, thus permitting comprehensive WGS. The international Ge-nomeTrakr network (accessdata.fda.gov) has already se-quenced tens of thousands of bacterial genomes each year, mostly to combat food-borne diseases.
The workflow for WGS includes a wet and a dry lab compo-nent. In the wet lab, samples are processed and sequenced. Afterwards, in the dry lab, WGS data is analyzed in order to detect differences in the bacterial sequences and to visual-ize their relationships [2]. The main goal is the reconstruction of a phylogeny that approximates a transmission tree. Due to differences in the analytical flow across Swiss labs, the Swiss Institute of Bioinformatics (SIB) has initiated a nation-wide quality assessment ring trial focusing on bacterial phy-logeny. Similarly, the ECDC has recently published an expert opinion on WGS as a tool for public health surveillance of MDR pathogens. The ECDC has concluded that the estab-

94 Resistance in zoonotic bacteria in animals from primary production samples
lishment of standards and systems enabling EU-wide use of WGS as the method of choice for typing microbial patho-gens will replace other methods, and that this will improve the accuracy and effectiveness of disease surveillance, out-break investigation and evaluation of prevention policies [3].
A Swiss molecular surveillance platform for MDR pathogensGathering interoperable pathogen, host and environmental metadata is required to provide a better understanding of transmission dynamics and thereby guide containment of such MDR pathogens. Specific tools such as Microreact (mi-croreact.org) or Nextstrain (nextstrain.org; Figure 1A) visual-ize transmission within a spatiotemporal context. However, to date, there is no specific platform in Switzerland and Eu-rope that allows integration of WGS data from various diag-nostic or reference laboratories with a special focus on sur-veillance of antibiotic resistance in combination with pathogen, host and environmental metadata.
A key feature of such a surveillance platform has to be the interoperability of data. This can be achieved with a common syntax and nomenclature starting at the time of data entry, species descriptions, and minimal datasets of documented microbiological, host and environmental information. Health-care-focused vocabularies and ontologies such as Systema-tized Nomenclature of Medicine – Clinical Terms (SNOMED CT) (www.e-health-suisse.ch) or LOINC (loinc.org) may offer detailed descriptions of the sample context [4]. Synergy ef-fects from standardized workflows and integration of the data base with the sequence bioinformatics at the individual centers should make immediate data sharing the default. Only through timely sharing can outbreak clusters be de-tected early and acted upon. Any delay in sharing quickly dis-sipates the public health benefit.
Our goal is therefore to establish a Swiss Pathogen Surveil-lance Platform (www.spsp.ch; Figure 1B) with initial funding from the NRP72 program. We will build upon the Nextstrain tool and start with methicillin-resistant Staphylococcus au-reus as a proof-of-concept pathogen. We will gradually ex-pand to different pathogens such as ESBL- and carbapene-mase-producing Enterobacteriaceae as well as other pathogenic bacteria, and incorporate specific aspects such as food safety.
We anticipate that such a platform will generate an immense benefit for public health and research institutions in Switzer-land. The platform will make it possible to (i) identify risks of MDR bacterial pathogen transmission for hospitals and pub-
lic health in Switzerland, (ii) describe and explore these risks by predicting dynamics of spread, and (iii) produce outcome control measurements of interventions, e.g. by monitoring the reduction of transmission of particular clones. In contrast to other existing resources, our project envisions real-time surveillance functionality, including the automated modelling of transmission events, epidemiological warning functions, and linkage with high-resolution geographical data.
Ethical considerations regarding epidemiological surveillanceFrom an individual’s point of view, the collection and analysis of patient data and molecular typing of pathogens raises eth-ical and patient privacy issues. Switzerland participates in the Nagoya protocol and the declaration of Taipei of the World Medical Association (www.bafu.admin.ch and www.wma.net). In addition, the collection and usage of data for research is clearly regulated via the Human Research Act (www.swissethics.ch). From a societal point of view, the transmission and spread of pathogens must be controlled at early stages. An epidemiological surveillance database is most efficient if data is shared. However, the requirements of individual data protection and public health focusing on the potential impact of MDR and virulent pathogens have to be carefully analyzed and discussed, in order to balance in-dividual protection with the potential of earlier public health action.
References[1] Revez J, Espinosa L, Albiger B, et al. Survey on the
Use of Whole-Genome Sequencing for Infectious Diseases Surveillance: Rapid Expansion of European National Capacities, 2015–2016. Frontiers in public health 2017; 5: 347.
[2] Gargis AS, Kalman L, Bick DP, et al. Good laboratory practice for clinical next-generation sequencing infor-matics pipelines. Nature biotechnology 2015; 33(7): 689–693.
[3] Struelens M, Albiger B, Catchpole M, et al. European Centre for Disease Prevention and Control. Expert opinion on whole genome sequencing for public healh surveillance. In: ECDC, editor. Stockholm: ECDC; 2016. p. 1–14.
[4] Griffiths E, Dooley D, Graham M, Van Domselaar G, Brinkman FSL, Hsiao WWL. Context Is Everything: Harmonization of Critical Food Microbiology Descrip-tors and Metadata for Improved Food Safety and Surveillance. Front Microbiol 2017; 8: 1068.

Resistance in zoonotic bacteria in animals from primary production samples 95
Figure 1: Pathogen surveillance using molecular typing data. (A) The Nextstrain tool (www.nextstrain.org) offers phy-logenetic trees of multiple pathogens, e.g. Ebola virus outbreak in West Africa. Colors represent different geographic regions. The x-axis reflects a time scale during the outbreak.
Figure 2: Envisioned workflow for the surveillance platform. After isolating a strain, collecting epidemiological data and sequencing it, the user uploads raw data and metadata into a central or local/private database using the submission por-tal. After submission, these data are quality controlled and then (semi-)automatically processed to perform tasks such as genome assembly, and MLST, SNP and resistance calling. The resulting data are used for phylogenetics and predictive modelling, e.g. transmission dynamics. All these data are stored in a structured database with controlled access, and visualized in a user-friendly interface. For open data, the structured database may also be used/queried by other applica-tions or pushed to external databases and knowledge bases. In addition to the submission portal, an administration por-tal to manage users and rights, as well as a curating portal to edit controlled vocabularies and define curated reference strains and variants (e.g. for resistance) will be developed.


9Resistance in indicator bacteria
from livestock animals

98 Resistance in indicator bacteria from livestock animals
The prevalence of antimicrobial resistance among certain bacteria of the intestinal flora can be used as an indicator of the selective pressure from use of antimicrobial agents in various populations. These bacteria constitute a reservoir of potentially transferable resistance genes that can be spread horizontally to other bacteria, including zoonotic bacteria. Antimicrobial resistance in indicator bacteria from healthy animals is monitored in order to provide information about the types of resistance present in intestinal bacteria of animal origin. Antimicrobial use leads to a selection pressure for resistant bacteria in the intestinal flora of affected animals. Monitoring allows a comparison of the effects of this selection pressure in different animal species. It also serves as a valuable early warning system to help identify emerging types of resistance in livestock populations and to monitor their potential spread.
9 Resistance in indicator bacteria from livestock animals
9.1 EnterococciIn the context of monitoring antimicrobial resistance, enterococci are indicator bacteria for the occurrence of resistances in Grampositive intestinal bacteria from livestock. Resistance can be transferred from animals to humans either by direct transmission of resistant bacterial strains or by horizontal gene transfer of resistance genes among bacteria [1]. Enterococci are generally found as commensals in the gastrointestinal tract of animals and humans. In a hospital setting, however, they can cause diseases such as urinary tract infections, sepsis or endocarditis in patients with a weakened immune system. Of particular concern in this regard are vancomycinresistant enterococci (VRE), which can spread rapidly and are difficult to treat. The responsible resistance gene is located on a transposon and can therefore
Table 9. a: Occurrence of resistance in Enterococcus faecalis and Enterococcus faecium from broilers in 2016.
2016 Enterococcus faecalis (N=31) Enterococcus faecium (N=247)
Antimicrobials n % 95 % CI n % 95 % CI
Ampicillin 0 0.0 0.0–11.0 10 4.0 2.2–7.3
Chlorampenicol 1 3.2 0.6–16.2 0 0.0 0.0–1.5
Ciprofloxacin 1 3.2 0.6–16.2 7 2.8 1.4–5.7
Daptomycin 0 0.0 0.0–11.0 16 6.5 4.0–10.3
Erythromycin 11 35.5 21.1–53.1 53 21.5 16.8–27.0
Gentamicin 0 0.0 0.0–11.0 0 0.0 0.0–1.5
Linezolid 0 0.0 0.0–11.0 0 0.0 0.0–1.5
Quinupristin/Dalfopristin* – – – 141 57.1 50.9–63.1
Teicoplanin 0 0.0 0.0–11.0 0 0.0 0.0–1.5
Tetracycline 20 64.5 46.9–78.9 56 22.7 17.9–28.3
Tigecycline 0 0.0 0.0–11.0 3 1.2 0.4–3.5
Vancomycin 1 3.2 0.6–16.2 0 0.0 0.0–1.5
Number of resistances
None 0 0.0 0.0–11.0 66 26.7 21.6–32.6
1 antimicrobial 9 29.0 16.1–46.6 93 37.7 31.8–43.8
2 antimicrobials 11 35.5 21.1–53.1 73 29.6 24.2–35.5
3 antimicrobials 10 32.3 18.6–49.9 13 5.3 3.1–8.8
4 antimicrobials 1 3.2 0.6–16.2 2 0.8 0.2–2.9
>4 antimicrobials 0 0.0 0.0–11.0 0 0.0 0.0–1.5
Number of resistant strains (n) and prevalence of resistance ( %) with 95 % confidence interval (95 % CI)* Natural resistance of E. faecalis

Resistance in indicator bacteria from livestock animals 99
easily be spread horizontally to other bacteria, prompting particular fears that vancomycin resistance might be passed from enterococci to methicillinresistant Staphylococcus au-reus (MRSA).
This chapter includes antimicrobial resistances of Entero-coccus faecalis and Enterococcus faecium in livestock. Broilers were investigated in 2016 and calves in 2017.
9.1.1 Enterococcus spp. in broilers
In 2016, a random sample of 349 broiler flocks was investigated at slaughter for the occurrence of enterococci in the framework of the antimicrobial resistance monitoring program using cecal samples (5 pooled cecal samples per flock). E. faecalis was identified in 31 samples (8.9 %) and E. faecium in 247 samples (70.8 %). Susceptibility testing was performed for all available enterococci isolates (Table 9. a).
Full susceptibility to all tested antimicrobials was observed for 26.7 % of E. faecium isolates, but for none of the E. fae-calis isolates. Multiple resistance to four of the tested antimicrobials was observed for one E. faecalis (3.2 %) and two E. faecium (0.8 %) isolates.
For E. faecalis, very high to high levels of microbiological resistance to tetracycline (64.5 %) and erythromycin (35.5 %) was found. One E. faecalis isolate was resistant to vancomy
cin (3.2 %). E. faecium isolates showed a very high level of resistance to quinupristin/dalfopristin (57.1 %) and high resistance to erythromycin (21.5 %) and tetracycline (22.7 %). Low levels of resistance in E. faecium were observed for ampicillin (4.0 %), ciprofloxacin (2.8 %), daptomycin (6.5 %) and tigecycline (1.2 %).
The distribution of the minimum inhibitory concentrations (MICs) is shown in Annex II (Table I.9 to Table I.10) and multiresistance patterns for E. faecium is shown in Annex II (Table I.40).
9.1.2 Enterococcus spp. in calves
In 2017, a random sample of 296 slaughter calves was investigated at slaughter for the occurrence of enterococci in the framework of the antimicrobial resistance monitoring program using cecal samples. 46 Enterococcus faecalis strains (15.5 %) and 129 Enterococcus faecium strains (43.6 %) were isolated and subjected to susceptibility testing (Table 9. b).
67.4 % of the E. faecalis and 4.7 % of the E. faecium isolates showed microbiological resistance to tetracycline. A high level of resistance to erythromycin was found for both E. faecalis and E. faecium (37.0 % and 20.2 % respectively).
E. faecalis isolates additionally showed a high level of resis
Table 9. b: Occurrence of resistance in Enterococcus faecalis and Enterococcus faecium from slaughter calves in 2017.
2017 Enterococcus faecalis (N=46) Enterococcus faecium (N=129)
Antimicrobials n % 95 % CI n % 95 % CI
Ampicillin 0 0.0 0.0–7.7 1 0.8 0.1–4.3
Chlorampenicol 8 17.4 9.1–30.7 0 0.0 0.0–2.9
Ciprofloxacin 1 2.2 0.4–11.3 1 0.8 0.1–4.3
Daptomycin 0 0.0 0.0–7.7 2 1.6 0.4–5.5
Erythromycin 17 37.0 24.5–51.4 26 20.2 14.1–27.9
Gentamicin 11 23.9 13.9–37.9 0 0.0 0.0–2.9
Linezolid 0 0.0 0.0–7.7 0 0.0 0.0–2.9
Quinupristin/Dalfopristin* 124 96.1 91.2–98.3
Teicoplanin 0 0.0 0.0–7.7 0 0.0 0.0–2.9
Tetracycline 31 67.4 53.0–79.1 6 4.7 2.1–9.8
Tigecycline 1 2.2 0.4–11.3 4 3.1 1.2–7.7
Vancomycin 0 0.0 0.0–7.7 0 0.0 0.0–2.9
Number of resistances
None 0 0.0 0.0–7.7 3 2.3 0.8–6.6
1 antimicrobial 15 32.6 20.9–47.0 95 73.6 65.4–80.5
2 antimicrobials 13 28.3 17.3–42.5 25 19.4 13.5–27.0
3 antimicrobials 2 4.3 1.2–14.5 5 3.9 1.7–8.8
4 antimicrobials 12 26.1 15.6–40.3 1 0.8 0.1–4.3
>4 antimicrobials 4 8.7 3.4–20.3 0 0.0 0.0–2.9
Number of resistant strains (n) and prevalence of resistance ( %) with 95 % confidence interval (95 % CI)* Intrinsic resistance of E. faecalis

100 Resistance in indicator bacteria from livestock animals
tance to gentamicin (23.9 %) and a moderate level of resistance to chloramphenicol (17.4 %). 96.1 % of the E. faecium isolates were microbiologically resistant to quinupristin/dalfopristin. A low level of resistance to tigecycline was observed for E. faecalis and E. faecium (2.2 % and 3.1 %, respectively). Resistance to linezolid, teicoplanin or vancomycin was not observed for either isolates.
Only 2.3 % of the E. faecium and none of the E. faecalis isolates were fully susceptible to all tested antimicrobials. Multiple resistance to at least 4 of the tested antimicrobials was observed for 16 E. faecalis (34.8 %) and 1 E. faecium (0.8 %) isolates.
The distribution of the minimum inhibitory concentrations (MICs) is shown in Annex II (Table I.11 to Table I.12) and multiresistance patterns for E. faecium are shown in Annex II (Table I.41).
9.1.3 Discussion
Resistance to antimicrobials is generally widespread in enterococci isolated from livestock in Switzerland. Resis tances to erythromycin and tetracycline are often found in isolates from broilers and slaughter calves. Longterm trends of both resistances vary among enterococci and types of animals (Figures 9 a–d). In the past years, a significant decreasing trend of microbiological resistance to tetracycline and eryth
romycin has been observed for E. faecalis isolates from broilers. However, resistance to tetracycline increased again since 2014 and reached 64.5 % in 2016 (Figure 9. a). Resistance to erythromycin increased in E. faecalis from broilers, but decreased in E. faecium from broilers. In E. faecalis from calves, the resistance to erythromycin is stable and decreased for E. faecium by 11 % from 2015 to 2017 (Figure 9. c and Figure 9. d). However, trends should be interpreted with caution, due to low numbers of isolates for E. faecalis.
Ampicillin is a firstline treatment for infections caused by enterococci in human medicine, and is also used in combination with gentamicin for severe infections. In 2016, ampicillin resistance was not observable among E. faecalis isolates from broilers and remained at a low level for E. faecium (4.0 %). The resistance rate for ampicillin among E. faecalis and E. faecium from calves was respectively zero and very low (0.8 %). Gentamicin resistance in E. faecalis from calves is high (23.9 %) while it is zero to very low in E. faecalis and E. faecium from broilers and in E. faecium from slaughter calves.
In the current reporting period, resistance to vancomycin was found in only one E. faecalis isolate from broilers. No enterococci isolates were resistant to linezolid. Vancomycin, a glycopeptide antibiotic, is used in combination with gentamicin instead of ampicillin if resistance to ampicillin is present. Linezolid is the drug of choice for the treatment of severe infections with vancomycinresistant enterococci (VRE).
2008(N=33)
2009(N=73)
2010(N=165)
2011(N=117)
2012(N=158)
2013(N=155)
2014(N=202)
2015 (N=n/a)
2016(N=31)
Ampicillin Chloramphenicol Erythromycin Tetracycline Gentamicin Vancomycin
0
% resistant E. faecalis in broilers
10
20
30
40
50
60
70
80
90
100
Figure 9. a: Trends in ampicillin, chloramphenicol, erythromycin, gentamicin, tetracycline and vancomycin resistance in Enterococcus faecalis from broilers between 2008 and 2016 (N = total number of tested isolates; values for 2015 interpolated [n/a]).

Resistance in indicator bacteria from livestock animals 101
2008(N=116)
2009(N=110)
2010(N=20)
2011(N=13)
2012(N=32)
2013(N=58)
2014(N=80)
2015(N=n/a)
2016(N=247)
Ampicillin Erythromycin Quinupristin/dalfopristin Tetracycline Vancomycin
0
% resistant E. faecium in broilers
10
20
30
40
50
60
70
80
90
100
The emergence of vancomycin resistance in bacteria from livestock in the past was linked to the use of avoparcin as a growth promoter. As a result, avoparcin was prohibited as a growth promoter in Europe in 1997. After the ban, a decreased incidence of VRE in the livestock population and a smaller proportion of people with VRE gut colonization could be verified [2]. Rates of resistance are low to very low in all European countries in which the level of vancomycin resistance in enterococci was investigated [3]. Resistance monitoring in livestock in Switzerland has not detected vancomycin resistance in enterococci for many years. However, resistance was occasionally detected, i.e. in one E. faecalis isolate from calves in 2013, two E. faecium isolates from fattening pigs in 2015 and one E. faecalis isolates from broilers in 2016.
Very high levels of microbiological resistance to quinupristin/dalfopristin in E. faecium from broilers and slaughter calves remain widespread. E. faecalis is not susceptible to quinupristin/dalfopristin due to its intrinsic resistance. The drug combination was originally recommended as an alternative for the treatment of VRE infections in humans. Nowadays, new antimicrobials such as linezolid or tigecycline are available for the treatment of human VRE infections.
In veterinary medicine, quinopristin/dalfopristin has never been used. Other streptogramins (e.g. virginiamycin) had been used for prophylactic treatment (although not in Switzerland). This type of indication has been prohibited in veterinary medicine throughout Europe since the late 1990s.
One explanation for the high resistance levels in isolates from livestock could be crossresistance of streptogramins, macrolides and lincosamides. Both macrolides and lincosamides are often used as medicated premixes in Swiss livestock.
Monitoring of antimicrobial resistance in humans in Switzerland shows that the proportion of clinical infections with vancomycinresistant enterococci in the past years is at a low level (1.2 % in 2017) [4]. VRE remains a widely feared hospital pathogen. However, transmission to humans via animals or food of animal origin plays a negligible role due to its very low prevalence in animals.
Since 2014, enterococci isolates have been tested for resistance to newer antimicrobials such as daptomycin, teicoplanin and tigecycline, given their importance for human health. In 2016 and 2017, all enterococci isolates from broilers and from calves have been tested. Microbiological resistance to daptomycin was found in 16 E. faecium isolates from broilers (6.5 %) and two E. faecium isolates from slaughter calves (1.6 %). None of the enterococci isolates from broilers or slaughter calves showed resistance to teicoplanin.
Resistance to tigecycline was found in three E. faecium isolates from broilers (1.2 %), one E. faecalis isolate from calves and four E. faecium isolates from calves (3.1 %). Tigecycline is not used in veterinary medicine, but plays an important role in the treatment of human VRE infections. A coselection of resistance to tigecycline and tetracycline cannot be excluded as they are chemically related to each other.
Figure 9. b: Trends in ampicillin, erythromycin, quinupristin/dalfopristin, tetracycline and vancomycin resistance in Entero-coccus faecium from broilers between 2008 and 2016 (N = total number of tested isolates; values for 2015 interpolated [n/a]).

102 Resistance in indicator bacteria from livestock animals
Figure 9. c: Trends in ampicillin, chloramphenicol, erythromycin, gentamicin, tetracycline and vancomycin resistance in Enterococcus faecalis from slaughter calves between 2008 and 2016 (N = total number of tested isolates; values for 2008, 2009, 2011, 2012, 2014 and 2016 interpolated [n/a]).
Figure 9. d: Trends in ampicillin, erythromycin, quinupristin/dalfopristin, tetracycline and vancomycin resistance in Enterococcus faecium from slaughter calves between 2008 and 2016 (N = total number of tested isolates; values for 2008, 2009, 2011, 2012, 2014 and 2016 interpolated [n/a]).
2008(N=n/a)
2009(N=n/a)
2010(N=103)
2011(N=n/a)
2012(N=n/a)
2013(N=108)
2014(N=n/a)
2015(N=56)
2016(N=n/a)
2017(N=46)
Ampicillin Chloramphenicol Erythromycin Gentamicin Tetracyclin Vancomycin
0
% resistant E. faecalis in veal
10
20
30
40
50
60
70
80
90
100
2008(N=n/a)
2009(N=n/a)
2010(N=31)
2011(N=n/a)
2012(N=n/a)
2013(N=68)
2014(N=n/a)
2015N=151)
2016(N=n/a)
2017(N=129)
Ampicillin Erythromycin Quinupristin/dalfopristin Tetracycline Vancomycin
0
% resistant E. faecium in veal
10
20
30
40
50
60
70
80
90
100

Resistance in indicator bacteria from livestock animals 103
9.2 Escherichia coli
9.2.1 Escherichia coli from broilers
In 2016, a random sample of 196 broiler flocks was investigated at slaughter for the occurrence of E. coli in the framework of the antimicrobialresistancemonitoring program using cecal samples (5 pooled cecal samples per flock). 190 Escherichia coli strains were isolated and subjected to susceptibility testing (Table 9. d).
Of the 190 tested E. coli isolates, 38.9 % were susceptible to all tested antimicrobials, whereas 8.9 % of the tested isolates were microbiologically resistant to more than four antimicrobials. None of the isolates were resistant to cefotaxime, ceftazidime or meropenem and hence, no presumptive ESBL/AmpC producers were detected. Microbiological resistance was most frequently detected for ampicillin, ciprofloxacin, nalidixic acid, sulfamethoxazole, tetracycline and trimethoprim, with resistance levels between 12.6 % and 39.5 %. These are slightly higher levels than in 2014. An exception is the resistance rate to tetracycline, which decreased compared to 2014 (Figure 9. e).
The distribution of the minimum inhibitory concentrations (MICs) is shown in Annex II (Table I. 13) and multiresistance patterns are shown in Annex II (Table I. 42).
9.2.2 Escherichia coli from fattening pigs
In 2017, a random sample of 216 fattening pigs was investigated at slaughter for the occurrence of E. coli in the framework of the antimicrobialresistancemonitoring program using cecal samples. E. coli was isolated from 197 samples which were subjected to susceptibility testing (Table 9. e).
Susceptibility to all tested antimicrobials was found in 55.8 % of the isolates. High levels of resistance to sulfamethoxazole (36.0 %) and tetracycline (20.8 %) were found, as well as a moderate level of resistance to trimethoprim (15.2 %) and ampicillin (14.2 %). Resistance levels in 2017 were generally lower than those in previous years, especially for sulfamethoxazole and tetracycline (Figure 9. e). None of the isolates were resistant to cefotaxime, ceftazidime or meropenem and hence, no presumptive ESBL/AmpC producers were detected.
Table 9. d: Occurrence of resistance in Escherichia coli from broilers in 2016.
2016 Escherichia coli (N=190)
Antimicrobials n % 95 % CI
Ampicillin 47 24.7 19.1–31.3
Azithromycin 0 0.0 0.0–2.0
Cefotaxime 0 0.0 0.0–2.0
Ceftazidime 0 0.0 0.0–2.0
Chlorampenicol 2 1.1 0.3–3.8
Ciprofloxacin 72 37.9 31.3–45.0
Colistin 0 0.0 0.0–2.0
Gentamicin 3 1.6 0.5–4.5
Meropenem 0 0.0 0.0–2.0
Nalidixic acid 75 39.5 32.8–46.6
Sulfamethoxazole 51 26.8 21.0–33.6
Tetracycline 25 13.2 9.1–18.7
Tigecycline 0 0.0 0.0–2.0
Trimethoprim 24 12.6 8.6–18.1
Sulfamethoxazole 50 25.0 19.5–31.4
Temocillin 0 0.0 0.0–1.9
Tetracycline 45 22.5 17.3–28.8
Tigecycline 0 0.0 0.0–1.9
Trimethoprim 24 12.0 8.2–17.2
Number of resistances
None 74 38.9 32.3–46.0
1 antimicrobial 26 13.7 9.5–19.3
2 antimicrobials 45 23.7 18.2–30.2
3 antimicrobials 20 10.5 6.9–15.7
4 antimicrobials 8 4.2 2.1–8.1
>4 antimicrobials 17 8.9 5.7–13.9
Number of resistant strains (n) and prevalence of resistance ( %) with 95 % confidence interval (95 % CI)

104 Resistance in indicator bacteria from livestock animals
Table 9. e: Occurrence of resistance in Escherichia coli from fattening pigs in 2017.
2017 Escherichia coli (N=197)
Antimicrobials n % 95 % CI
Ampicillin 28 14.2 10.0–19.8
Azithromycin 1 0.5 0.1–2.8
Cefotaxime 0 0.0 0.0–1.9
Ceftazidime 0 0.0 0.0–1.9
Chlorampenicol 10 5.1 2.8–9.1
Ciprofloxacin 5 2.5 1.1–5.8
Colistin 0 0.0 0.0–1.9
Gentamicin 6 3.0 1.4–6.5
Meropenem 0 0.0 0.0–1.9
Nalidixic acid 4 2.0 0.8–5.1
Sulfamethoxazole 71 36.0 29.7–43.0
Tetracycline 41 20.8 15.7–27.0
Tigecycline 0 0.0 0.0–1.9
Trimethoprim 30 15.2 10.9–20.9
Sulfamethoxazole 76 41.8 34.8–49.0
Temocillin 0 0.0 0.0–2.1
Tetracycline 54 29.7 23.5–36.7
Tigecycline 0 0.0 0.0–2.1
Trimethoprim 40 22.0 16.6–28.5
Number of resistances
None 110 55.8 48.9–62.6
1 antimicrobial 37 18.8 13.9–24.8
2 antimicrobials 17 8.6 5.5–13.4
3 antimicrobials 16 8.1 5.1–12.8
4 antimicrobials 11 5.6 3.1–9.7
>4 antimicrobials 6 3.0 1.4–6.5
Number of resistant strains (n) and prevalence of resistance ( %) with 95 % confidence interval (95 % CI)
The distribution of the minimum inhibitory concentrations (MICs) is shown in Annex II (Table I.14) and multiresistance patterns are shown in Annex II (Table I.46).
9.2.3 Escherichia coli from slaughter calves
In 2017, a random sample of 204 calves was investigated at slaughter for the occurrence of E. coli in the framework of the antimicrobialresistancemonitoring program using cecal samples. E. coli was isolated from 194 samples which were subjected to susceptibility testing (Table 9. f).
Of the isolates, 47.9 % were susceptible to all antimicrobials tested. High levels of resistance to ampicillin (38.7 %), sulfamethoxazole (46.9 %) and tetracycline (41.2 %) were found, and a moderate resistance level to trimethoprim (19.1 %). None of the isolates were resistant to cefotaxime, ceftazidime or meropenem and hence, no presumptive ESBL/AmpC producers were detected.
The distribution of the minimum inhibitory concentrations (MICs) is shown in Annex II (Table I.15) and multiresistance patterns are shown in Annex II (Table I.44).
9.2.4 Discussion
In the context of monitoring antimicrobial resistance, E. coli are indicator bacteria for the occurrence of resistances in Gramnegative intestinal bacteria from livestock. They constitute a reservoir of resistance genes that can be transferred horizontally to other bacteria including zoonotic pathogens.
From 2008 to 2012, the prevalence of E. coli from broilers in Switzerland exhibiting resistance to ciprofloxacin increased significantly (Figure 9. e). In the following years, the resistance rate decreased markedly from 46 % in 2012 to 32 % in 2014, but increased again to 37.9 % in 2016. The rates of resistance to ampicillin and sulfamethoxazole have remained rather stable since the last assessment in 2014, while the resistance rate of tetracycline has shown a remarkable decrease of 41 %.
Resistance levels of E. coli from fattening pigs and slaughter calves showed opposite trends from 2015 to 2017. In pigs, resistance rates generally decreased, especially for sulfamethoxazole from 41.8 % in 2015 to 36.0 % in 2017 and for tetracycline from 29.7 % in 2015 to 20.8 % in 2017 (Fig

Resistance in indicator bacteria from livestock animals 105
Table 9. f: Occurrence of resistance in Escherichia coli from slaughter calves in 2017.
2017 Escherichia coli (N=194)
Antimicrobials n % 95 % CI
Ampicillin 75 38.7 32.1–45.7
Azithromycin 0 0.0 0.0–1.9
Cefotaxime 0 0.0 0.0–1.9
Ceftazidime 0 0.0 0.0–1.9
Chlorampenicol 19 9.8 6.4–14.8
Ciprofloxacin 7 3.6 1.8–7.3
Colistin 0 0.0 0.0–1.9
Gentamicin 9 4.6 2.5–8.6
Meropenem 0 0.0 0.0–1.9
Nalidixic acid 7 3.6 1.8–7.3
Sulfamethoxazole 91 46.9 40.0–53.9
Tetracycline 80 41.2 34.5–48.3
Tigecycline 0 0.0 0.0–1.9
Trimethoprim 37 19.1 14.2–25.2
Sulfamethoxazole 79 41.6 34.8–48.7
Temocillin 0 0.0 0.0–2.0
Tetracycline 77 40.5 33.8–47.6
Tigecycline 0 0.0 0.0–2.0
Trimethoprim 30 15.8 11.3–21.6
Number of resistances
None 93 47.9 41.0–54.9
1 antimicrobial 10 5.2 2.8–9.2
2 antimicrobials 21 10.8 7.2–16.0
3 antimicrobials 32 16.5 11.9–22.4
4 antimicrobials 24 12.4 8.5–17.7
>4 antimicrobials 14 7.2 4.3–11.7
Number of resistant strains (n) and prevalence of resistance ( %) with 95 % confidence interval (95 % CI)
ure 9. f). Resistance rates of E. coli from slaughter calves increased slightly from 2015 to 2017, except for ciprofloxacin which decreased from 6.8 % in 2015 to 3.6 % in 2017 (Figure 9. g).
Microbiological resistance is widespread in E. coli from livestock in Switzerland. Moderate to high resistance rates to ampicillin, sulfamethoxazole and tetracycline have been found in isolates from all animals. In broilers additionally, the resistance rate to ciprofloxacin is high. Sulfonamides, tetracyclines and penicillins are the most widely used antimicrobials in pigs and calves in Switzerland. In broilers, mostly fluoroquinolones and penicillins are used. This suggests that the resistance situation found in nonpathogenic E. coli from the gastrointestinal tract in livestock actually reflects the selective pressure bacteria are exposed to as a result of the use of antimicrobials during livestock production.
Although the application of chloramphenicol in livestock was prohibited in 2001, resistance was detected in broilers (1.1 %), fattening pigs (5.1 %) and slaughter calves (9.8 %). This could potentially be due to coselection with other antimicrobials. Additionally, crossresistance between chloramphenicol and florfenicol has been described [5]. Florfenicol
is often used in pigs and cattle to treat respiratory tract infections. However, resistance rates for chloramphenicol have shown a decreasing trend or have remained at a low level over the last years.
9.3 ESBL/pAmpC-producing Escherichia coli
In recent years, broadspectrum betalactamaseproducing intestinal bacteria have increasingly been detected among livestock in various countries. Betalactamases are bacterial enzymes that enable bacteria to inactivate betalactam antimicrobials by breaking their betalactam ring. ESBLproducing intestinal bacteria are resistant to most betalactams, especially aminopenicillins (e.g. ampicillin), cephalosporins (including third and fourth generation cephalosporins) and monobactams. Plasmidmediated AmpC betalactamases mediate resistance to penicillins, second and thirdgeneration cephalosporins (including betalactamase inhibitors such as clavulanic acid) and cephamycins. However, they do not usually mediate resistance to fourth generation cephalosporins.

106 Resistance in indicator bacteria from livestock animals
Figure 9. e: Trends in ampicillin, ciprofloxacin, gentamicin, sulfamethoxazole and tetracycline resistance in Escherichia coli from broilers between 2008 and 2016 (N = total number of tested isolates, values for 2015 interpolated [n/a]).
2008(N=149)
2009(N=136)
2010(N=183)
2011(N=176)
2012(N=185)
2013(N=189)
2014(N=200)
2015(N=n/a)
2016 (N=190)
Ampicillin Ciprofloxacin Gentamicin Sulfamethoxazole Tetracycline
0
% resistant E. coli in broilers
10
20
30
40
50
60
Figure 9. f: Trends in ampicillin, ciprofloxacin, gentamicin, sulfamethoxazole and tetracycline resistance in Escherichia coli from fattening pigs between 2008 and 2017 (N = total number of tested isolates, values for 2008, 2014 and 2016 interpolated [n/a]).
2008(N=n/a)
2009(N=181)
2010(N=179)
2011(N=175)
2012(N=185)
2013(N=183)
2014(N=n/a)
2015(N=182)
2016(N=n/a)
2017(N=197)
Ampicillin Ciprofloxacin Gentamicin Sulfamethoxazole Tetracycline
0
% resistant E. coli in fattening pigs
10
20
30
40
50
60

Resistance in indicator bacteria from livestock animals 107
Both, ESBL and pAmpC are produced by intestinal bacteria. Most of them are commensals and do not induce any illness in the host. These bacteria constitute a reservoir for resistance genes that can be transmitted to pathogens by means of mobile genetic elements such as plasmids, integrons and transposons. However, resistance genes may also occur in zoonotic pathogens (e.g. Salmonella or enterohemorrhagic E. coli ). Although diseases caused by such pathogens usually do not require antimicrobial treatment, the disease may take a severe course in vulnerable patients such as young children, elderly people or patients with a weak immune system, rendering antimicrobial treatment necessary. Pathogenic bacteria harboring an ESBL or pAmpC resistance gene are difficult to treat, thus prolonging or worsening disease course. The occurrence of such bacteria in the context of severe infections of hospitalized humans in Switzerland has increased from 0.9 % in 2004 to 10.3 % in 2017 [4].
As a consequence, E. coli isolates from animals are also used to gauge the spread of bacteria that produce ESBL or pAmpC.
9.3.1 ESBL/pAmpC-producing Escherichia coli in broilers
In 2016, a random sample of 307 broiler flocks was investigated at slaughter for the occurrence of ESBL/pAmpCproducing E. coli using cecal samples (5 pooled cecal samples per flock). By applying selective enrichment methods, 161
isolates of presumptive ESBL/pAmpCproducing E. coli were isolated. This corresponds to a flock prevalence of 52.4 %. 160 isolates were then subjected to susceptibility testing (Table 9. g).
Apart from resistance to betalactam antimicrobials, recorded resistance levels to sulfonamides (52.5 %), ciprofloxacin (48.8 %), nalidixic acid (45.6 %), tetracycline (33.1 %) and trimethoprim (25.0 %) were detected. 83.1 % of the isolates were resistant to cefepime. Cefepime is a fourthgeneration cephalosporin which is more stable to some bacterial betalactamases. Thus, observed resistance to cefepime serves as an indicator for the presence of ESBL producers. 53.1 % of the isolates were microbiologically resistant to cefoxitin, which is indicative of the presence of AmpCbetalactamases. 3.8 % of the isolates showed phenotypically reduced susceptibility to ertapenem, whereas microbiological resistances to imipenem, meropenem, azithromycin, colistin, temocillin and tigecycline were not detected.
The distribution of the minimum inhibitory concentrations (MICs) is shown in Annex II (Table I.16 and Table I.17) and multiresistance patterns are shown in Annex II (Table I. 43).
9.3.2 ESBL/pAmpC-producing Escherichia coli in fattening pigs
In 2017, 52 ESBL/pAmpCproducing E. coli strains were isolated with selective enrichment methods from a random
Figure 9. g: Trends in ampicillin, ciprofloxacin, gentamicin, sulfamethoxazole and tetracycline resistance in Escherichia coli from slaughter calves between 2008 and 2017 (N = total number of tested isolates, values for 2008, 2009, 2011, 2012, 2014 and 2016 interpolated [n/a]).
2008(N=n/a)
2009(N=n/a)
2010(N=184)
2011(N=n/a)
2012(N=n/a)
2013(N=176)
2014(N=n/a)
2015(N=190)
2016(N=n/a)
2017(N=194)
Ampicillin Ciprofloxacin Gentamicin Sulfamethoxazole Tetracycline
0
10
20
30
40
50
60
70
% resistant E. coli in veal calves

108 Resistance in indicator bacteria from livestock animals
sample of 296 cecal samples from fattening pigs. This corresponds to a prevalence of 17.6 %. All isolates were subjected to susceptibility testing (Table 9. h).
Apart from the resistance to betalactam antimicrobials, high to very high microbiological resistance levels to tetracycline (61.5 %), sulfonamides (55.8 %), ciprofloxacin (36.5 %), nalidixic acid (32.7 %), trimethoprim (25.0 %) and gentamicin (21.2 %) were found. The portion of isolates resistant to cefepime was 71.2 %, and 34.6 % of the isolates were microbiologically resistant to cefoxitin. A moderate proportion of isolates showed phenotypic resistance to chloramphenicol (9.6 %), whereas the levels of resistance to azithromycin (7.7 %) were low. Microbiological resistances to colistin, ertapenem, meropenem, imipenem, temocillin and tigecycline were not detected.
The distribution of the minimum inhibitory concentrations (MICs) is shown in Annex II (Table I.18 and Table I.19) and multiresistance patterns are shown in Annex II (Table I.47).
9.3.3 ESBL/pAmpC-producing Escherichia coli from slaughter calves
In 2017, 101 ESBL/pAmpCproducing E. coli strains were isolated with selective enrichment methods from a random sample of 304 cecal samples from slaughter calves. This corresponds to a prevalence of 33.2 %. All isolates were subjected to susceptibility testing (Table 9. i).
Apart from the resistance to betalactam antimicrobials, high to extremely high microbiological resistance levels to tetracycline (86.1 %), sulfonamides (82.2 %), trimethoprim (51.5 %), ciprofloxacin (48.5 %), gentamicin (35.6 %), nalidixic acid (30.7 %) and chloramphenicol (25.7 %) were found. The portion of isolates resistant to cefepime was 61.4 %, and 46.5 % of the isolates were microbiologically resistant to cefoxitin. Levels of resistance for azithromycin (6.9 %) were low. Microbiological resistances to colistin, ertapenem, imipenem, meropenem, temocillin and tigecycline were not detected.
Table 9. g: Occurrence of resistance in ESBL/pAmpCproducing Escherichia coli from broilers in 2016.
2016 ESBL/pAmpC-producing Escherichia coli (N=160)
Antimicrobials n % 95 % CI
Ampicillin 157 98.1 94.6–99.4
Azithromycin 0 0.0 0.0–2.3
Cefepime 133 83.1 76.6–88.1
Cefotaxime* 151 94.4 89.7–97.0
Cefoxitin 85 53.1 45.4–60.7
Ceftazidime* 140 87.5 81.5–91.8
Chloramphenicol 13 8.1 4.8–13.4
Ciprofloxacin 78 48.8 41.1–56.4
Colistin 0 0.0 0.0–2.3
Ertapenem 6 3.8 1.7–7.9
Gentamicin 9 5.6 3.0–10.3
Imipenem 0 0.0 0.0–2.3
Meropenem* 0 0.0 0.0–2.3
Nalidixic acid 73 45.6 38.1–53.4
Sulfamethoxazole 84 52.5 44.8–60.1
Temocillin 0 0.0 0.0–2.3
Tetracycline 53 33.1 26.3–40.7
Tigecycline 0 0.0 0.0–2.3
Trimethoprim 40 25.0 18.9–32.2
Number of resistances n % 95 % CI
None 2 1.3 0.30–4.4
1 antimicrobial 2 1.3 0.30–4.4
2 antimicrobials 2 1.3 0.30–4.4
3 antimicrobials 46 28.7 22.30–36.2
4 antimicrobials 25 15.6 10.80–22.0
>4 antimicrobials 83 51.9 44.20–59.5
Number of resistant strains (n) and prevalence of resistance ( %) with 95 % confidence interval (95 % CI)* Result of EUVSEC2 plate

Resistance in indicator bacteria from livestock animals 109
The distribution of the minimum inhibitory concentrations (MICs) is shown in Annex II (Table I.20 and Table I.21), and multiresistance patterns are shown in Annex II (Table I.45).
9.3.4 Discussion
Using selective enrichment methods, ESBL/pAmpCproducing E. coli were found in 52.4 % of broiler flocks, 17.6 % of fattening pigs and 33.2 % of slaughter calves. The prevalence of ESBL/pAmpCproducing E. coli has clearly increased for broilers (2014: 41.8 %), and decreased for fattening pigs (2015: 25.7 %) and slaughter calves (2015: 37.6 %). Using the selective method, comparatively lower rates of ESBL/AmpCproducing E. coli were found in Switzerland than in other European countries.
Besides microbiological resistance to betalactam antimicrobials, the isolates showed high to extremely high rates of resistance to (fluoro)quinolones, sulfonamides, trimethoprim and tetracycline in all three animal species. Isolates
from slaughter calves and fattening pigs presented high rates of gentamicin resistance; isolates from all three animal species showed resistance to chloramphenicol, whereby only isolates from calves exhibit high resistance rates. Low levels of resistance to azithromycin were detected in isolates from fattening pigs and slaughter calves. None of the isolates from all three animal species were resistant to colistin, imipenem, meropenem, temocillin or tigecycline. Low levels of decreased susceptibility to ertapenem were found in broilers only.
An increasing spread of ESBL/pAmpCproducing E. coli among foodproducing animals has been observed in Europe over the past years, especially among broilers. The prevalence in broiler flocks is influenced by different factors. The prevalence of resistance among individual birds increases towards the end of the fattening period. Other influencing factors include flock management, hygiene or use of antimicrobials, especially betalactams [6]. ESBL/pAmpCproducing E. coli are transmitted via eggshell contamination along the production chain from grandparents and par
Table 9. h: Occurrence of resistance in ESBL/pAmpCproducing Escherichia coli from fattening pigs in 2017.
2017 ESBL/pAmpC-producing Escherichia coli (N=54)
Antimicrobials n % 95 % CI
Ampicillin 52 100.0 93.1–100.0
Azithromycin 4 7.7 3.0–18.2
Cefepime 37 71.2 57.7–81.7
Cefotaxime* 51 98.1 89.9–99.7
Cefoxitin 18 34.6 23.2–48.2
Ceftazidime* 51 98.1 89.9–99.7
Chloramphenicol 5 9.6 4.2–20.6
Ciprofloxacin 19 36.5 24.8–50.1
Colistin 0 0.0 0.0–6.9
Ertapenem 0 0.0 0.0–6.9
Gentamicin 11 21.2 12.2–34.0
Imipenem 0 0.0 0.0–6.9
Meropenem* 0 0.0 0.0–6.9
Nalidixic acid 17 32.7 21.5–46.2
Sulfamethoxazole 29 55.8 42.3–68.4
Temocillin 0 0.0 0.0–6.9
Tetracycline 32 61.5 48.0–73.5
Tigecycline 0 0.0 0.0–6.9
Trimethoprim 13 25.0 15.2–38.2
Number of resistances
None 0 0.0 0.0–6.9
1 antimicrobial 0 0.0 0.0–6.9
2 antimicrobials 0 0.0 0.0–6.9
3 antimicrobials 12 23.1 13.7–36.1
4 antimicrobials 8 15.4 8.0–27.5
>4 antimicrobials 32 61.5 48.0–73.5
Number of resistant strains (n) and prevalence of resistance ( %) with 95 % confidence interval (95 % CI)* Result of EUVSEC2 plate

110 Resistance in indicator bacteria from livestock animals
ents to broilers [7], [8]. Once present in a broiler farm, they spread horizontally from one flock to another. Specific bacteria can also be found in the environment of farms where they are able to survive for extended periods of time, and hence are a potential source for further transmission [9]. Another study showed that a horizontal transfer of bacteria from animals to their owners is possible [10].
Until recently, ESBL/pAmpCproducing bacteria were mainly a problem in hospital settings. Lately, they have increasingly been found in the general population as well. Here, they either occur harmlessly in the guts of healthy individuals or cause diseases such as urinary tract infections. The incidence of these types of resistance has increased in Switzerland in recent years, both in hospitals and in outpatients [11].
A study carried out in Switzerland with healthy staff of meatprocessing plants found ESBLproducing intestinal bacteria in 5.8 % of those tested [12]. Another study, which tested 291 fecal swab samples from patients of GP prac tices,
found ESBLproducing bacteria in 5.2 % of the samples [13]. Resistance genes of ESBL/pAmpCproducing E. coli display a large heterogeneity. The comparison of different genes and resistance patterns from isolates of foodproducing animals, raw meat and humans shows that the majority of isolates differ considerably [14], [15], [16]. Foodproducing animals and especially chicken meat are seen as a relevant reservoir for ESBL/pAmpCproducing E. coli. Nevertheless, the vast majority of ESBL/pAmpCproducing E. coli colonizing humans cannot be exclusively attributed to foodproducing animals or food thereof.
9.4 Methicillin-resistant Staphylococcus aureus (MRSA)
Staphylococcus aureus are skin and mucous membrane colonizing bacteria of humans and animals [17]. Usually, they do not induce any disease. However, in some cases, S. aureus
Table 9. i: Occurrence of resistance in ESBL/pAmpCproducing Escherichia coli from slaughter calves in 2017.
2017 ESBL/pAmpC-producing Escherichia coli (N=102)
Antimicrobials n % 95 % CI
Ampicillin 101 100.0 96.3–100.0
Azithromycin 7 6.9 3.4–13.6
Cefepime 62 61.4 51.6–70.3
Cefotaxime* 100 99.0 94.6–99.8
Cefoxitin 47 46.5 37.1–56.2
Ceftazidime* 93 92.1 85.1 – 95.9
Chloramphenicol 26 25.7 18.2 – 35.0
Ciprofloxacin 49 48.5 39.0 – 58.1
Colistin 0 0.0 0.0 – 3.7
Ertapenem 0 0.0 0.0 – 3.7
Gentamicin 36 35.6 27.0 – 45.4
Imipenem 0 0.0 0.0 – 3.7
Meropenem* 0 0.0 0.0 – 3.7
Nalidixic acid 31 30.7 22.5 – 40.3
Sulfamethoxazole 83 82.2 73.6 – 88.4
Temocillin 0 0.0 0.0 – 3.7
Tetracycline 87 86.1 78.1 – 91.6
Tigecycline 0 0.0 0.0 – 3.7
Trimethoprim 52 51.5 41.9 – 61.0
Number of resistances
None 0 0.0 0.0–3.7
1 antimicrobial 0 0.0 0.0–3.7
2 antimicrobials 3 3.0 1.0–8.4
3 antimicrobials 7 6.9 3.4–13.6
4 antimicrobials 5 5.0 2.1–11.1
>4 antimicrobials 86 85.1 76.9–90.8
Number of resistant strains (n) and prevalence of resistance ( %) with 95 % confidence interval (95 % CI)* Result of EUVSEC2 plate

Resistance in indicator bacteria from livestock animals 111
bacteria can infect wounds and airways. Normally, these infections can be treated without any complications using antimicrobials. In contrast, methicillinresistant S. aureus (MRSA) infections are difficult to treat. These bacteria are resistant to all betalactams (penicillins and cephalosporins) and some of them are resistant to additional classes of antimicrobials as well, leading to minimal antimicrobial treatment options and severe disease.
This chapter includes antimicrobial resistance of MRSA strains in fattening pigs and slaughter calves investigated in 2017.
9.4.1 MRSA in livestock animals
9.4.1.1 Fattening pigsIn 2017, nasal swabs from fattening pigs at slaughter were used to isolate strains of MRSA, applying selective enrichment methods. Obtained isolates were subjected to spa typing and susceptibility testing.
In 2017, 131 isolates were obtained from 298 nasal swabs, corresponding to a prevalence of 44.0 %. Sixtythree isolates belonged to spa type t034, 61 to spa type t011, 3 to spa type t1451, 2 to spa type t899 and 1 isolate each belonged to spa type t2330 and t2876, respectively.
All isolates were microbiologically resistant to betalactam antibiotics (cefoxitin and penicillin) and tetracycline (Table 9. j). High to extremely high resistance rates were found for trimethoprim (51.9 %), streptomycin (51.1 %), macrolides/lincosamides (clindamycin 51.1 %, erythromycin 45.0 %), tiamulin (50.4 %), and quinupristin/dalfopristin (50.4 %). Low to moderate resistance rates were found for kanamycin (12.2 %), ciprofloxacin (11.5 %), gentamicin (11.5 %), sulfamethoxazole (6.1 %), fusidic acid (3.1 %), rifampicin (2.3 %), mupirocin (2.3 %) and chloramphenicol. (1.5 %). All isolates were susceptible to vancomycin and linezolid, two important antimicrobials for treatment of human patients.
Table 9. j: Occurrence of resistance in MRSA from fattening pigs in 2017.
2017 Methicillin-resistant Staphylococcus aureus (N=131)
Antimicrobials n % 95 % CI
Cefoxitin 131 100.0 97.2–100.0
Chloramphenicol 2 1.5 0.4–5.4
Ciprofloxacin 15 11.5 7.1–18.0
Clindamycin 67 51.1 42.7–59.5
Erythromycin 59 45.0 36.8–53.6
Fusidic acid 4 3.1 1.2–7.6
Gentamicin 15 11.5 7.1–18.0
Kanamycin 16 12.2 7.7–18.9
Linezolid 0 0.0 0.0–2.8
Mupirocin 3 2.3 0.8–6.5
Penicillin 131 100.0 97.2–100.0
Quinupristin/Dalfopristin 66 50.4 41.9–58.8
Rifampicin 3 2.3 0.8–6.5
Streptomycin 67 51.1 42.7–59.5
Sulfamethoxazole 8 6.1 3.1–11.6
Tetracycline 131 100.0 97.2–100.0
Tiamulin 66 50.4 41.9–58.8
Trimethoprim 68 51.9 43.4–60.3
Vancomycin 0 0.0 0.0–2.8
Number of resistances
None 0 0.0 0.0–2.8
1 antimicrobial 0 0.0 0.0–2.8
2 antimicrobials 0 0.0 0.0–2.8
3 antimicrobials 24 18.3 12.6–25.8
4 antimicrobials 25 19.1 13.3–26.7
>4 antimicrobials 82 62.6 54.1–70.4
Number of resistant strains (n) and prevalence of resistance ( %) with 95 % confidence interval (95 % CI)

112 Resistance in indicator bacteria from livestock animals
The distribution of the minimum inhibitory concentrations (MICs) is shown in Annex II (Table I. 22) and multiresistance patterns are shown in Annex II (Table I. 49.)
9.4.1.2 Slaughter calvesIn 2017, 297 nasal swabs were collected from slaughter calves. By applying selective enrichment methods, 24 MRSA isolates were obtained from this random sample. Thus, the prevalence was 8.1 %. 14 isolates belonged to spa type t011, 7 to spa type t034, 1 to spa type t127 and 2 to spa type t17339.
Susceptibility testing of MRSA isolates from slaughter calves revealed that all isolates were microbiologically resistant to betalactames (cefoxitin and penicillin) and tetracycline. Very high to extremely high levels of microbiological resistance were found for macrolides/lincosamides (erythromycin/clindamycin, both 70.8 %) and streptomycin (62.5 %). The resistance levels for ciprofloxacin, gentamicin, kanamycin, quinupristin/dalfopristin, tiamulin and trimethoprim were high (20–50 %). Resistance to chloramphenicol, fusidic acid, linezolid, mupirocin, rifampicin, sulfamethoxazole and vancomycin was not detected (Table 9. k).
The distribution of the minimum inhibitory concentrations (MICs) is shown in Annex II (Table I. 23) and multiresistance patterns are shown in Annex II (Table I. 48).
9.4.3 Discussion
In Switzerland, the occurrence of MRSA in fattening pigs at slaughter increased continuously and significantly from 2009 to 2017. In 2009, the prevalence was assessed at 2.0 % [18], in 2011 at 5.6 % [19], in 2013 at 20.8 %, in 2014 at 26.5 % and in 2015 at 25.7 %. Since the last assessment in 2015, the prevalence of MRSA among fattening pigs increased by 71.2 % to 44.0 % in 2017.
The detected spa types showed that until 2015 the most prevalent spa type in Switzerland’s population of slaughtered pigs was t034 MRSA and to a lesser extent also spa type t011 (Figure 9. l). Interestingly, in 2017, spa type t011 became nearly as prevalent as spa type t034, and the extreme increase of MRSA prevalence is predominantly caused by this specific genotype. Both the t011 and the t034 genotypes are part of the clonal complex CC 398, which belongs to the
Table 9. k: Occurrence of resistance in MRSA from slaughter calves in 2017.
2017 Methicillin-resistant Staphylococcus aureus (N=24)
Antimicrobials n % 95 % CI
Cefoxitin 24 100.0 86.2–100.0
Chloramphenicol 0 0.0 0.0–13.8
Ciprofloxacin 10 41.7 24.5–61.2
Clindamycin 17 70.8 50.8–85.1
Erythromycin 17 70.8 50.8–85.1
Fusidic acid 0 0.0 0.0–13.8
Gentamicin 5 20.8 9.2–40.5
Kanamycin 6 25.0 12.0–44.9
Linezolid 0 0.0 0.0–13.8
Mupirocin 0 0.0 0.0–13.8
Penicillin 24 100.0 86.2–100.0
Quinupristin/Dalfopristin 9 37.5 21.2–57.3
Rifampicin 0 0.0 0.0–13.8
Streptomycin 15 62.5 42.7–78.8
Sulfamethoxazole 0 0.0 0.0–13.8
Tetracycline 24 100.0 86.2–100.0
Tiamulin 9 37.5 21.2–57.3
Trimethoprim 12 50.0 31.4–68.6
Vancomycin 0 0.0 0.0–13.8
Number of resistances
None 0 0.0 0.0–13.8
1 antimicrobial 0 0.0 0.0–13.8
2 antimicrobials 0 0.0 0.0–13.8
3 antimicrobials 0 0.0 0.0–13.8
4 antimicrobials 2 8.3 2.3–25.8
>4 antimicrobials 22 91.7 74.2–97.7
Number of resistant strains (n) and prevalence of resistance ( %) with 95 % confidence interval (95 % CI)

Resistance in indicator bacteria from livestock animals 113
livestockassociated MRSA (LAMRSA). MRSA CC398 is mostly found in fattening pigs, cattle and poultry, but can be transmitted between animals and humans. Not only in Switzerland but also in other European countries, most of the MRSA spa types detected in livestock were associated with LAMRSA CC398 [20].
In 2017, all MRSA isolates obtained from fattening pigs at slaughter showed microbiological resistance to betalactams (cefoxitin and penicillin) and tetracycline. Very high resistance rates were detected for clindamycin (51.1 %), erythromycin (45.0 %), quinupristin/dalfopristin (50.4 %), streptomycin (51.1 %), tiamulin (50.4 %) and trimethoprim (51.9 %). All MRSA were susceptible to linezolid and vancomycin. Nearly all MRSA spa type t034 (98.4 %) showed resistance to more than four antimicrobials, whereas only 24.6 % of MRSA spa type t011 exhibited broadspectrum resistance to more than four antimicrobials. However, the latter include therapeutically relevant antimicrobials such as gentamicin and kanamycin. In 2017, 34 isolates were resistant to nine antimicrobials. These findings underline the multiresistant nature of MRSA.
Colonization of fattening pigs with MRSA may occur during transportation to the slaughterhouse or at slaughter itself (crosscontamination). Due to this fact, the validity of data recorded at the stage of slaughter may be limited with regard to showing the change of MRSA occurrence in fattening pigs [21].
Overall data for 2017 illustrate the fact that the occurrence of MRSA in fattening pigs needs to be further investigated. Bangerter et al. [21] have conducted comprehensive studies of the individual colonization dynamics of MRSA throughout Swiss pig production. Humans in close contact with live
stock are at higher risk of being carriers of livestockassociated MRSA [22]. Although colonization of healthy humans with MRSA usually does not induce disease, MRSA introduced in hospitals may cause infections that are almost impossible to treat. At least, the occurrence of MRSA in the context of severe infections in hospitalized humans (septicemia) has decreased significantly in the past years, with a prevalence of 12.8 % in 2004, as opposed to 4.1 % in 2017 [4].
The prevalence of MRSA in slaughter calves has increased from 2.1 % in 2010 to 8.1 % in 2017. These data indicate an increasing trend as well. Therefore, the occurrence of MRSA in slaughter calves needs to be further observed.
A comparative analysis of current molecular findings from Swiss human, animal and meat MRSA isolates is described in Chapter 12.
References
[1] De Leener et al. Molecular analysis of human, porcine, and poultry Enterococcus faecium isolates and their erm(B) genes. Appl Environ Microbiol 2005; 71(5): 2766–2770. doi:10.1128/AEM.71.5.2766–2770.2005
[2] Heuer et al. Human health hazard from antimicrobialresistant enterococci in animals and food. Clin Infect Dis 2006; 43(7): 911–916. doi: 10.1086/507534
[3] EFSA (European Food Safety Authority) and ECDC (European Centre for Disease Prevention and Control). EU Summary Report on antimicrobial resistance in zoonotic and indicator bacteria from humans, animals and food in 2013. EFSA Journal 2015; 13(2):4036, 178 pp., doi:10.2903/j.efsa.2015.4036
Figure 9. h: Number of MRSA genotypes from fattening pigs between 2009 and 2017.
Number of isolates
0
10
20
30
40
50
60
70
t011 t034 t208 other (t032; t571; t899; t1145;t1250; t1451; t2279; t2741; t4475)
Genotype
2009 2010 2011 2012 2013 2014 2015 2017

114 Resistance in indicator bacteria from livestock animals
[4] ANRESIS: Antibiotic Resistance Data in Switzerland, University of Bern, www.anresis.ch, last accessed on May 31, 2018. Meldungen ausgewählter multiresistenter Mikroorganismen in der Schweiz, BAGBulletin 18/2018, Federal Office of Public Health, FOPH, p 10–11
[5] White et al. Characterization of chloramphenicol and florfenicol resistance in Escherichia coli associated with bovine diarrhea. J Clin Microbiol 2000; 38(12): 4593–4598
[6] Laube et al. Longitudinal monitoring of extendedspectrumbetalactamase/AmpCproducing Escherichia coli at German broiler chicken fattening farms. Appl Environ Microbiol 2013; 79(16): 4815–4820.doi:10.1128/AEM.0085613
[7] EFSA. Scientific Opinion on the public health risks of bacterial strains producing extendedspectrum betalactamases and/or AmpC betalactamases in foods and foodproducing animals. EFSA Journal 2011; 9(8): 2322. doi:10.2903/j.efsa.2011.2322
[8] Zurfluh et al. Vertical transmission of highly similar blaCTXM1harboring Incl1 plasmids in Escherichia coli with different MLST types in the poultry production pyramid. Front Microbiol 2014; 5: 519. doi:10.3389/fmicb.2014.00519
[9] Blaak et al. Detection of extendedspectrum betalactamase(ESBL)producing Escherichia coli on flies at poultry farms. Appl Environ Microbiol 2014; 80(1):239–246. doi: 10.1128/AEM.0261613
[10] Huijbers et al. Extendedspectrum and AmpClactamaseproducing Escherichia coli in broilers and people living and/or working on broiler farms: prevalence, risk factors and molecular characteristics. Antimicrob Agents Chemother 2014; 69(10): 2669–2675. doi:10.1093/jac/dku178
[11] Kronenberg et al. Temporal trends of extendedspectrum cephalosporinresistant Escherichia coli and Klebsiella pneumoniae isolates in in and outpatients in Switzerland, 2004 to 2011. Euro Surveill 2013;18(21). pii:20484
[12] Geser et al. Molecular identification of extendedspectrumbetalactamase genes from Enterobacteriaceae isolated from healthy human carriers in Switzerland.Antimicrob Agents Chemother 2012; 56(3): 1609–1612. doi:10.1128/AAC.0553911
[13] NüeschInderbinen et al. Crosssectional study on fecal carriage of Enterobacteriaceae with resistance to extendedspectrum cephalosporins in primary care patients. Microb Drug Resist 2013; 19(5): 362–369. doi:10.1089/mdr.2013.0013
[14] Geser et al. Occurrence and characteristics of extendedspectrum betalactamase(ESBL)producing Enterobacteriaceae in foodproducing animals, minced meat and raw milk. BMC Vet Res 2012; 8:21 doi:10.1186/17466148821.
[15] Wu G. et al. Comparative analysis of ESBLpositive Escherichia coli isolates from animals and humans from the UK, the Netherlands and Germany. PLoS One 2013; 8(9):e75392. doi:10.1371/journal.pone.0075392
[16] Sharp et al. Abschätzung des Transfers von ESBLbildenden Escherichia coli zum Menschen für Deutschland. Berliner und Münchener Tierärztliche Wochenschrift 2014; 127: 446–477. doi:10.2376/0005936127464
[17] den Heijer, C., E. van Bijnen, W. Paget, M. Pringle, H. Goossens, C. Bruggeman, F. Schellevis, E. Stobberingh, 2013: Prevalence and resistance of commensal Staphylococcus aureus, including methicillinresistant S. aureus, in nine European countries: a crosssection al study. Lancet Infectious Diseases 13(5): 409–415
[18] Overesch et al. The increase of methicillinresistant Staphylococcus aureus (MRSA) and the presence of an unusual sequence type ST49 in slaughter fattening pigs in Switzerland. BMC Veterinary Research 2011;7: 30
[19] Overesch et al. Entwicklung der Prävalenz von MRSA des Sequenztyps ST49. Fleischwirtschaft 2012; 92(12): 95–97
[20] EFSA (European Food Safety Authority) and ECDC (European Centre for Disease Prevention and Control), 2018. The European Union summary report on antimicrobial resistance in zoonotic and indicator bacteria from humans, animals and food in 2016. EFSA Journal 2018;16(2):5182, 270 pp. doi:10.2903/j.efsa.2018.5182
[21] Bangerter, P. D., Sidler, X., Perreten, V., Overesch, G., 2016: Longitudinal study on the colonization and transmission of methicillinresistant Staphylococcus aureus in fatteningpig farms. Veterinary Microbiology 183(2016): 125–134
[22] Wettstein Rosenkranz K, E. Rothenanger, I. Brodard, A. Collaud, G. Overesch, B. Bigler, J. Marschall, V. Perreten 2014: Nasal carriage of methicillinresistant Staphylococcus aureus (MRSA) among Swiss veterinary healthcare providers: detection of livestock and healthcareassociated clones. Schweizer Archiv für Tierheilkunde, Band 156, Heft 7, Juli, 317–325.

Resistance in indicator bacteria from livestock animals 115
TextboxMcr-1-Based Colistin Resistance: Filling Knowledge Gaps in View of the Spread of Plasmid-Mediated Colistin Resistance in Switzerland
Roger Stephan1, Andreas Widmer2, Patrice Nordmann3
1 Institute for Food Safety and Hygiene, Vetsuisse Faculty, University of Zurich, Zurich, Switzerland
2 Division of Infectious Diseases and Hospital Epidemiology, University of Basel, Basel, Switzerland 3 Emerging Antibiotic Resistance, Medical and Molecular Microbiology Unit, Department of Medicine, University of Fribourg, and National Reference Center for Emerging Antibiotic Resistance, University of Fribourg, Switzerland
In the past, the use of colistin has been mostly limited to veterinary medicine due to its rather severe side effects. But given the increase in multiresistant Gramnegative bacteria, the WHO recently relabeled colistin as a “critically important antibiotic.” The so far identified mechanisms of resistance were chromosomally encoded, and included modifications of the outer membrane components, mainly through the covalent addition of either phosphoethanolamine or 4deoxyaminoarabinose to the lipopolysaccharide (LPS), leading to a more positively charged LPS, thus reducing the affinity of positively charged polymyxin molecules.
The first description of a plasmidborne mobilized colistin resistance gene mcr-1 in 2016 caused great concern, as the ease of potential spread on a conjugative plasmidencoding resistance to polymyxins might drastically change the resistance situation with regard to colistin. In line with this, mcr-1 mediated colistin resistance in Enterobacteriaceae (mainly E. coli, but rarely also from a few other enterobacterial iso
lates, i.e. K. pneumoniae, Citrobacter freundii, and Salmonel-la spp. enterica) has since been reported from a wide range of geographical locations.
This project, based on a OneHealth approach and funded by the Swiss Federal Office of Public Health, aimed to provide first baseline data to estimate the occurrence and spread of mcr-1harboring Enterobacteriaceae in Switzerland. Studies on the animal level (livestock; isolates from infections of dogs and cats), on the food level (raw poultry and turkey meat on the retail level), on the healthy human level (employees of foodprocessing companies) and on isolates from clinical cases (urinary tract infections, bacteremia, diarrhea) were performed. Moreover, based on molecular characterization data of the isolates, an improved understanding of the epidemiology and spreading potential of mcr-1harboring Enterobacteriaceae should be provided.
The prevalence in human isolates in Switzerland remains very low (Liassine et al., 2016; Zurfluh et al., 2017a). Very recently, the first mcr-1harboring Salmonella enterica subsp. Enterica serovar 4,5,12:i: strain isolated from blood of a patient in Switzerland was found (Carrol et al. submitted).
However, a reservoir of the mcr-1 resistance gene in the livestock sector opens the possibility of a transfer of mcrharboring strains through the food chain to the human population.
Multilocus sequence typing (MLST) revealed many distinct sequence types which showed abundant diversity among mcr-1-positive E. coli isolates from different origins. Sequencing data provide evidence that the mcr-1 gene can
Table 1: Overview and key characteristics of sequenced mcr-1harboring plasmids from strains of different origins isolated in Switzerland
Plasmid Origin size (bp) Inc type mcr-1 gene cassette Additional resistance genes
pPC11E. coli (chicken meat, Germany)
59.826 IncI2 ISApl1mcr1orf none
pS38E. coli (chicken meat, Italy)
247.885 IncHI2Tn6330 estX-3, aadA2, aadA1a, aadA1b, cmlA1,
sul3, dfrA1b, mefB, tetA, blaCTXM1
pPF11E. coli (chicken meat, Germany)
33.308 IncX4 mcr1orf none
pPF52E. coli (turkey meat, Germany)
33.298 IncX4 mcr1orf none
pH226BE. coli (vegetables, Thailand)
209.401 IncHI1 mcr1orf none
pCDF8E. coli (UTI, human)
33.660 IncX4 mcr1-orf none
pColR598_1E. coli(human, diarrhea)
60.920 IncI2 mcr1-orf none
pColR598_2E. coli(human, diarrhea)
33.252 IncX4 mcr1-orf none
pColR664E. coli(human, diarrhea)
60.885 IncI2 mcr1-orf none

116 Resistance in indicator bacteria from livestock animals
rarely be chromosomally integrated. Transferable IncI2(size 60–61 kbp) and IncX4(size 33–35 kbp)type plasmids (Zurfluh et al., 2017b) harboring mcr-1 are mainly associated with colistinresistant strains (human and food) isolated in Switzerland (Table 1). All IncI2 and IncX4 plasmids harbored no resistance determinants other than the mcr-1 gene. Moreover, it should be mentioned that most of the sequenced mcr-1harboring plasmids lack the ISApl1 element, which is a key element mediating translocation of mcr-1 into various plasmid backbones.
Increased surveillance of the dissemination of the mcr-1 gene throughout the international food market (e.g. imported poultry and turkey meat, vegetables) and the situation in clinical strains, mainly in carbapenemaseproducing Enterobacteriaceae, is a keystone when addressing the emergence of MCRproducing bacteria.
References[1] Buess, S., NüeschInderbinen, M., Stephan, R., Zur
fluh, K. (2017). Assessment of animals as a reservoir for colistin resistance: no MCR1/MCR2producing Enterobacteriaceae detected in Swiss livestock. Journal of Global Antimicrobial Resistance 8:33–34.
[2] Carroll, L.M., Zurfluh, K., Jang, H., Gopinath, G., NüeschInderbinen, M., Poirel, L., Nordmann, P., Stephan, R., Guldimann, C. (2018). First report of an mcr-1harbouring Salmonella enterica subsp. Enteri-ca serovar 4,5,12:i: strain isolated from blood of a patient in Switzerland. International Journal of Antimicrobial Agents, submitted.
[3] Liassine, N., Assouvie, L., Descombes, M.C., Dénervaud, V., Kieffer, N., Poirel, L., Nordmann, P. (2016). Very low prevalence of MCR1/MCR2plasmidmediated colistin resistance from urinary tract Enterobacteriaceae in Switzerland. International Journal of Infectious Diseases 51:4–5.
[4] Zurfluh, K., Stephan, R., Widmer, A., Poirel, L., Nordmann, P., Nüesch, H.J., Hächler, H., NüeschInderbinen, M. (2017a). Screening for fecal carriage of MCRproducing Enterobacteriaceae in healthy humans and primary care patients. Antimicrobial Resistance and Infection Control 6:28. DOI 10.1186/s137560170186z.
[5] Zurfluh, K., NüeschInderbinen, M., Klumpp, J., Poirel, L., Nordmann, P., Stephan, R. Key features of mcr-1bearing plasmids from Escherichia coli isolated from humans and food. Antimicrobial Resistance and Infection Control (2017b) 6:91. DOI 10.1186/s1375601702508
10Resistance in bacteria
isolated from meat

118 Resistance in bacteria isolated from meat
Bacteria of the intestinal flora of livestock constitute a reser-voir of potentially transferable resistance genes that can be spread horizontally to other bacteria, including zoonotic bac-teria. Hence, antimicrobial resistance in indicator bacteria from healthy animals is monitored in order to provide infor-mation about the types of resistance present in intestinal bacteria of animal origin. During the slaughter process, car-casses are contaminated with these intestinal bacteria and reach the consumers by way of fresh meat and products thereof. Monitoring of multidrug resistant bacteria in fresh meat of broilers, cattle and pigs help to assess the risk for transmission of multidrug resistant bacteria to humans via handling and consumption of fresh meat.
10.1 ESBL/pAmpC- and carbapenemase-producing Escherichia coli
10.1.1 ESBL/pAmpC-producing Escherichia coli in chicken meat
In 2016, 302 samples of retail chicken meat were collected (205 domestic samples, i.e. chicken meat produced in Swit-zerland, and 97 imported samples, i.e. chicken meat pro-duced abroad). By applying selective enrichment methods, 149 (49.3 %) presumptive ESBL/pAmpC-producing E. coli strains were detected.
Out of 205 domestic samples (chicken meat of Swiss ori-gin), 86 were tested positive (41.9 %). In contrast, 63 out of 97 foreign samples were tested positive, corresponding to a prevalence of 64.9 % (Table 10. a).
All of these isolates were then subjected to susceptibility testing (Table 10. b). Apart from the resistance to be-ta-lactam antimicrobials, high to very high microbiological resistance levels to tetracycline (45.0 %), sulfonamides (61.1 %), ciprofloxacin (63.1 %), nalidixic acid (57.0 %) and tri-methoprim (28.9 %) were found. The portion of isolates re-sistant to cefepime was 75.8 %, and 53.7 % of the isolates were microbiologically resistant to cefoxitin. A moderate proportion of isolates showed phenotypic resistance to gen-tamicin (14.1 %), chloramphenicol (10.7 %), whereas the lev-el of resistance to azithromycin (0.7 %) was very low. Micro-biological resistances to colistin, ertapenem, meropenem, imipenem, temocillin and tigecycline were not detected.
10 Resistance in bacteria isolated from meat
The distribution of the minimum inhibitory concentrations (MICs) and the multiresistant pattern are shown in Annex II (Table I. 24–I. 25 and Table I. 50).
10.1.2 ESBL/pAmpC-producing Escherichia coli from pork meat
In 2017, 302 Swiss pork meat samples were collected from retailers and one ESBL/pAmpC-producing E. coli was isolat-ed using selective enrichment methods. This corresponds to a prevalence of approximately 0.3 %. This single isolate was subjected to antimicrobial susceptibility testing. It showed microbiological resistance to beta-lactam antimicro-bials (ampicillin, cefepime, ceftazidime, cefotaxim), but not to cefoxitin. Microbiological resistance to sulfamethoxazole, chloramphenicol, nalidixic acid, tetracycline and trimetho-prim was also found (Table 10. c).
The distribution of the minimum inhibitory concentrations (MIs) and the multiresistant pattern are shown in Annex II (Table I. 26–I. 27 and Table I. 52).
10.1.3 ESBL/pAmpC-producing Escherichia coli from beef
In 2017, 299 Swiss beef meat samples were collected from retailers and analyzed for ESBL/pAmpC-producing E. coli using selective enrichment methods. Only two samples (0.7 %) tested positive for suspected ESBL/pAmpC-produc-ing E. coli. Besides resistance to beta-lactam antimicrobials, these strains showed additional resistance to ciprofloxacin only (Table 10 d).
The distribution of the minimum inhibitory concentrations (MIs) and the multiresistant pattern are shown in Annex II (Table I. 28–I. 29 and Table I. 51).
10.1.4 Carbapenemase-producing Escherichia coli from chicken, beef and pork meat
In total, 302 chicken meat, 302 pork meat and 299 beef meat samples were collected from retailers and analyzed for carbapenemase-producing E. coli using selective enrich-ment methods. None of the meat samples tested positive for carbapenemase-producing E. coli.

Resistance in bacteria isolated from meat 119
Table 10. a: Number of samples and number of ESBL/pAmpC-producing Escherichia coli-positive samples by origin of chicken meat for 2016.
Origin No. of samples
No. of positive samples ( %)
Germany 28 15 (53.6)
Hungary 27 22 (81.5)
Austria 17 12 (70.6)
Slovenia 14 9 (64.3)
Italy 6 3 (50.0)
France 4 1 (25.0)
Argentina 1 1 (100.0)
Total foreign countries 97 63 (64.9)
Switzerland 205 86 (41.9)
Table 10. b: Occurrence of resistance of ESBL/pAmpC-producing Escherichia coli from chicken meat in 2016.
Escherichia coli (N =149) 2016
Antimicrobials n % 95 % CI
Ampicillin 149 100 97.5–100.0
Azithromycin 1 0.7 0.1–3.7
Cefepime 113 75.8 68.4 – 82.0
Cefotaxime* 146 98 94.2–99.3
Cefoxitin 80 53.7 45.7–61.5
Ceftazidime* 139 93.3 88.1–96.3
Chloramphenicol 16 10.7 6.7–16.7
Ciprofloxacin 94 63.1 55.1–70.4
Colistin 0 0 0.0–2.5
Ertapenem 0 0 0.0–2.5
Gentamicin 21 14.1 9.4–20.6
Imipenem 0 0 0.0–2.5
Meropenem* 0 0 0.0–2.5
Nalidixic acid 85 57 49.0–64.7
Sulfamethoxazole 91 61.1 53.1–68.5
Temocillin 0 0 0.0–2.5
Tetracycline 67 45 37.2–53.0
Tigecycline 0 0 0.0–2.5
Trimethoprim 43 28.9 22.2–36.6
Number of resistances n % 95 % CI
None 0 0 0.0–2.5
1 antimicrobial 0 0 0.0 – 2.5
2 antimicrobials 2 1.3 0.4 – 4.8
3 antimicrobials 25 16.8 11.6 – 23.6
4 antimicrobials 16 10.7 6.7 – 16.7
> 4 antimicrobials 106 71.1 63.4 – 77.8
N = total number of tested isolates, n = number of resistant isolates, % = percentage of resistant isolates, 95 % CI: 95 % Confidence Interval * Result of EUVSEC2 plate

120 Resistance in bacteria isolated from meat
Table 10. c: Occurrence of resistance in ESBL/pAmpC-producing Escherichia coli from pork meat in 2017.
10.2 MRSA in meat10.2.1 MRSA in chicken meat
Chicken meat was investigated in 2016. By applying selec-tive enrichment methods, nine MRSA isolates were ob-tained from 302 samples of retail chicken meat (205 sam-ples of Swiss origin, 97 samples of foreign origin). The isolates were subjected to spa typing and susceptibility test-ing. Three isolates belonged to the spa type t034 and three isolates to the spa type t1430. The spa type t2123 was found twice and t153 was detected once.
All MRSA-positive samples were chicken meat, produced abroad (eight samples from Germany, one sample from Hun-gary). Consequently, the prevalence in externally produced chicken meat was 9.3 %, while the prevalence for Swiss chicken meat was 0.0 % (Table 10 g).
Susceptibility testing confirmed MRSA, as all isolates were microbiologically resistant to beta-lactam antibiotics (cefox-
itin and penicillin). Extremely high to high resistance rates were found for macrolides/lincosamides (erythromycin 77.8 %, clindamycin 88.9 %), tetracycline (55.6 %), tiamulin (55.6 %), trimethoprim (55.6 %), quinupristin/dalfopristin (55.6 %) and ciprofloxacin (33.3 %) (Table 10. e). No microbi-ological resistance was detected for sulfamethoxazole, chlor amphenicol, fusidic acid, gentamicin, kanamycin and streptomycin. Moreover, for antimicrobials relevant in hu-man medicine, such as linezolid, mupirocin, rifampicin, and vancomycin, no resistant isolates were found.
The distribution of the minimum inhibitory concentrations (MIs) and the multiresistant pattern are shown in Annex II (Table I. 30 and Table I. 53).
10.2.2 MRSA in pork meat
Swiss pork meat was investigated in 2017. Two out of 301 examined samples tested positive for MRSA, corresponding to a prevalence of 0.7 %. One isolate belonged to the spa
Escherichia coli (N = 1) 2017
Antimicrobials n % 95 % CI
Ampicillin 1 100 20.7–100.0
Azithromycin 1 100 20.7–100.0
Cefepime 1 100 20.7–100.0
Cefotaxime* 1 100 20.7–100.0
Cefoxitin 0 0 0.0–79.3
Ceftazidime* 1 100 20.7–100.0
Chloramphenicol 1 100 20.7–100.0
Ciprofloxacin 0 0 0.0–79.3
Colistin 0 0 0.0–79.3
Ertapenem 0 0 0.0–79.3
Gentamicin 0 0 0.0–79.3
Imipenem 0 0 0.0–79.3
Meropenem* 0 0 0.0–79.3
Nalidixic acid 1 100 20.7–100.0
Sulfamethoxazole 1 100 20.7–100.0
Temocillin 0 0 0.0–79.3
Tetracycline 1 100 20.7–100.0
Tigecycline 0 0 0.0–79.3
Trimethoprim 1 100 20.7–100.0
Number of resistances n % 95 % CI
None 0 0 0.0–79.3
1 antimicrobial 0 0 0.0–79.3
2 antimicrobials 0 0 0.0–79.3
3 antimicrobials 0 0 0.0–79.3
4 antimicrobials 0 0 0.0–79.3
> 4 antimicrobials 1 100 20.7–100.0
N = total number of tested isolates, n = number of resistant isolates, % = percentage of resistant isolates, 95 % CI: 95 % Confidence Interval * Result of EUVSEC2 plate

Resistance in bacteria isolated from meat 121
type t011 (livestock-MRSA) and the other to the spa type t002. The two MRSA isolates were subjected to susceptibil-ity testing. Both MRSA were microbiologically resistant to macrolides/lincosamides, tetracycline, tiamulin, trimetho-prim and quinupristin/dalfopristin. No microbiological resis-tance was detected for sulfamethoxazole, chloramphenicol, ciprofloxacin, fusidic acid, gentamicin, kanamycin and strep-tomycin. Moreover, for antimicrobials relevant in human medicine, such as linezolid, mupirocin, rifampicin, and van-comycin, no resistant isolates were found (Table 10 f).
The distribution of the minimum inhibitory concentrations (MIC) and the multi-resistant pattern are shown in Annex II (Table I. 31 and Table I. 54).
10.2.3 MRSA in beef
Swiss beef samples were investigated in 2017. All 299 sam-ples were tested negative for MRSA.
10.3 Discussion10.3.1 ESBL/pAmpC- and carbapenemase-producing
E. coli in fresh meat
Using selective enrichment methods, ESBL/pAmpC-pro-ducing E. coli were found in 41.9 % of chicken meat sam-ples, whereas detection rates of ESBL/pAmpC-producing E. coli were very low for pork (0.3 %) and beef (0.7 %).
Compared to 2014, the prevalence of ESBL/pAmpC-produc-ing E. coli in chicken meat has clearly decreased for Switzer-land (2014: 65.5 %; 2016: 41.9 %), but also for Germany (2014: 82.2 %; 2016: 53.6 %) and Slovenia (2014: 94.7 %; 2016: 64.3 %). In contrast, the detection rate for fresh chick-en meat from Hungary still remains very high (2014: 88.9 %; 2016: 81.5 %). As the detection method was not modified during the last reporting period, the decrease seems to be a real biological finding. It is not known whether measures were taken from the Swiss poultry industry during slaughter and/or meat processing. Comparable decreasing trends in
Table 10. d: Occurrence of resistance in ESBL/pAmpC-producing Escherichia coli from beef in 2017.
Escherichia coli (N = 2) 2017
Antimicrobials n % 95 % CI
Ampicillin 2 100 34.2–100.0
Azithromycin 0 0 0.0–65.8
Cefepime 1 50 9.5 – 90.5
Cefotaxime* 2 100 34.2–100.0
Cefoxitin 1 50 9.5 – 90.5
Ceftazidime* 2 100 34.2–100.0
Chloramphenicol 0 0 0.0–65.8
Ciprofloxacin 1 50 9.5 – 90.5
Colistin 0 0 0.0–65.8
Ertapenem 0 0 0.0–65.8
Gentamicin 0 0 0.0–65.8
Imipenem 0 0 0.0–65.8
Meropenem* 0 0 0.0–65.8
Nalidixic acid 0 0 0.0–65.8
Sulfamethoxazole 0 0 0.0–65.8
Temocillin 0 0 0.0–65.8
Tetracycline 0 0 0.0–65.8
Tigecycline 0 0 0.0–65.8
Trimethoprim 0 0 0.0–65.8
Number of resistances n % 95 % CI
None 0 0 0.0–65.8
1 antimicrobial 0 0 0.0–65.8
2 antimicrobials 0 0 0.0–65.8
3 antimicrobials 1 50 9.5–90.5
4 antimicrobials 1 50 9.5–90.5
> 4 antimicrobials 0 0 0.0–65.8
N = total number of tested isolates, n = number of resistant isolates, % = percentage of resistant isolates, 95 % CI: 95 % Confidence Interval * Result of EUVSEC2 plate

122 Resistance in bacteria isolated from meat
other European countries may suggest that measures have been taken by the poultry industries on supranational levels.
The prevalence in chicken meat is influenced by the preva-lence of broilers (Chapter 9). The prevalence among individ-ual birds increases towards the end of the fattening period, and herd management, hygiene and/or use of antimicrobi-als, especially beta-lactams, influences the ESBL/pAmpC load [1]. Once present on a broiler farm, the bacteria spread horizontally from one herd to another. Specific bacteria can also be found in the environment of farms where they are able to survive for extended periods of time, and hence are a potential source for further transmission [2]. Another study showed that a horizontal transfer of bacteria from animals to their owners is possible [3].
Other studies from Switzerland confirm the high prevalence of ESBL/pAmpC-producing E. coli observed for chicken meat [4]. The prevalence of these types of resistance in chicken meat (73.3 %) is much higher than the prevalence in broiler flocks (41.8 %). This indicates that resistant bacteria are spreading by cross-contamination between animals, processing materials and staff during the slaughter process
and/or the subsequent meat processing [5]. ESBL/pAmpC -producing E. coli in chicken meat represent a potential source of transmission for humans, e.g. by kitchen utensils or hands [6]. As a consequence, adequate kitchen hygiene and proper cooking of raw chicken meat are essential.
The low prevalence of ESBL/pAmpC-producing E. coli in pork and beef (<1 %) compared to the prevalence in fatten-ing pigs (25.7 %) and veal calves (37.6 %) could be attributed to good hygiene measures during slaughtering process.
ESBL/pAmpC-producing bacteria have increasingly been found in the general population as well [7]. Here, they either occur harmlessly in the guts of healthy individuals or cause diseases such as urinary tract infections. The incidence of these types of resistance has increased in Switzerland in recent years, both in hospitals and in outpatients (see Chap-ter 7. 1) [8]. A study carried out in Switzerland in healthy staff of meat-processing plants found ESBL-producing in-testinal bacteria in 5.8 % of those tested [3]. Another study, which tested 291 fecal swab samples from patients of GP practices, found ESBL-producing bacteria in 5.2 % of the samples [9].
Table 10. e: Occurrence of MRSA from chicken meat in 2016.
Staphylococcus aureus (N = 9) 2016
Antimicrobials n % 95 % CI
Cefoxitin 9 100 70.1–100.0
Chloramphenicol 0 0 0.0–29.9
Ciprofloxacin 3 33.3 12.1–64.6
Clindamycin 8 88.9 56.5–98.0
Erythromycin (Erythromycin A) 7 77.8 45.3–93.7
Fusidic acid 0 0 0.0–29.9
Gentamicin 0 0 0.0–29.9
Kanamycin 0 0 0.0–29.9
Linezolid 0 0 0.0–29.9
Mupirocin 0 0 0.00–29.9
Penicillin 9 100 70.1–100.0
Quinupristin/Dalfopristin 5 55.6 26.7–81.1
Rifampicin 0 0 0.0–29.9
Streptomycin 0 0 0.0–29.9
Sulfamethoxazole 0 0 0.0–29.9
Tetracycline 5 55.6 26.7–81.1
Tiamulin 5 55.6 26.7–81.1
Trimethoprim 5 55.6 26.7–81.1
Vancomycin 0 0 0.0–29.9
Number of resistances n % 95 % CI
None 0 0 0.0–29.9
1 antimicrobial 0 0 0.0–29.9
2 antimicrobials 1 11.1 2.0–43.5
3 antimicrobials 0 0 0.0–29.9
4 antimicrobials 0 0 0.0–29.9
> 4 antimicrobials 8 88.9 56.5–98.0
N = total number of tested isolates, n = number of resistant isolates, % = percentage of resistant isolates, 95 % CI: 95 % Confidence Interval

Resistance in bacteria isolated from meat 123
Table 10. f: Occurrence of MRSA from pork meat in 2017.
Staphylococcus aureus (N = 2) 2017
Antimicrobials n % 95 % CI
Cefoxitin 2 100 34.20–100.00
Chloramphenicol 0 0 0.00–65.80
Ciprofloxacin 0 0 0.00–65.80
Clindamycin 0 0 0.00–65.80
Erythromycin (Erythromycin A) 0 0 0.00–65.80
Fusidic acid 0 0 0.00–65.80
Gentamicin 2 100 34.20–100.00
Kanamycin 2 100 34.20–100.00
Linezolid 0 0 0.00–65.80
Mupirocin 0 0 0.00–65.80
Penicillin 2 100 34.20–100.00
Quinupristin/Dalfopristin 0 0 0.00–65.80
Rifampicin 0 0 0.00–65.80
Streptomycin 0 0 0.00–65.80
Sulfamethoxazole 0 0 0.00–65.80
Tetracycline 1 50 9.50–90.50
Tiamulin 0 0 0.00–65.80
Trimethoprim 0 0 0.00–65.80
Vancomycin 0 0 0.00–65.80
Number of resistances n % 95 % CI
None 0 0 0.00–65.80
1 antimicrobial 0 0 0.00–65.80
2 antimicrobials 0 0 0.00–65.80
3 antimicrobials 0 0 0.00–65.80
4 antimicrobials 1 50 9.50–90.50
> 4 antimicrobials 1 50 9.50–90.50
N = total number of tested isolates, n = number of resistant isolates, % = percentage of resistant isolates, 95 % CI: 95 % Confidence Interval
Resistance genes of ESBL/pAmpC-producing E. coli display a large heterogeneity. The comparison of different genes and resistance patterns from isolates of food-producing an-imals, raw meat and humans shows that the majority of iso-lates differ considerably [10]. Currently, the vast majority of ESBL/pAmpC-producing E. coli colonizing humans cannot be exclusively attributed to food-producing animals or food, despite the fact that food-producing animals and especially chicken meat are seen as an important reservoir for ESBL/pAmpC-producing E. coli [10].
10.3.2 MRSA in fresh meat
In contrast to ESBL/pAmpC-producing E. coli in chicken meat, food as a whole is not regarded as a relevant source of MRSA infection or colonization for humans [11]. Hence, detection rates for MRSA in Swiss fresh meat was low to zero (chicken meat from abroad 9.3 %, pork 0.7 % and beef 0.0 %). Investigations revealed that the occurrence of MRSA in chicken meat produced abroad (9.3 %) is significantly higher than in chicken meat produced in Switzerland (0.0 %). Looking at the details, it becomes obvious that eight out of
nine MRSA isolates were obtained from chicken meat pro-duced in Germany (28.6 %), while chicken meat from Hun-gary showed a low prevalence (3.7 %). Chicken meat from France, Italy, Austria and Slovenia was found to be negative for MRSA, as was the case for the Swiss chicken meat sam-ples (Table 10. g).
The MRSA investigation in chicken meat revealed results similar to those obtained in 2014. Interestingly, the detected prevalence of foreign chicken meat decreased from 16.0 % in 2014 to 9.3 % in 2016. As in the previous reporting period, MRSA were mostly found in chicken meat from Germany. The MRSA investigation in Swiss pork in 2017 revealed a very low prevalence of 0.7 %, identical to the prevalence found in 2015. This is of special concern, as the MRSA prev-alence in nasal swabs from Swiss pigs increased from 25.7 % to 40.0 % in the same time period. These findings confirm the very low risk of MRSA transmission from animal to humans via meat [12]. However, one of the MRSA isolates obtained from Swiss pig meat was identified as spa type t011, which is increasingly found in Swiss pigs. This might indicate that the contamination of the meat with MRSA had occurred during slaughter of MRSA-positive pigs, and mon-

124 Resistance in bacteria isolated from meat
itoring of MRSA in Swiss pig meat is needed, although the prevalence in the reporting period was very low. The second MRSA infection in Swiss pig meat was identified as spa type t002, which is often found in humans. This may indicate a contamination during processing or packaging. Again, no MRSA was found in Swiss beef in the reporting period.
Resistance patterns of MRSA isolates are associated with the spa types. Resistance to tetracycline for example typi-cally occurs in livestock-associated MRSA (LA-MRSA) [13]. Indeed, the three isolates of spa type t034 from chicken meat were LA-MRSA and showed resistance to tetracy-cline, whereas the MRSA of spa type t153 showed no resis-tance to tetracycline. A contamination of the meat during processing or packaging was therefore very likely.
A comparative analysis of current molecular findings from Swiss human, animal and meat MRSA isolates is described in Chapter 12.
References
[1] Laube et al. Longitudinal monitoring of extended- spectrum-beta-lactamase/AmpC-producing Escheri-chia coli at German broiler-chicken-fattening farms. Appl Environ Microbiol 2013; 79(16): 4815–4820. doi:10.1128/AEM.00856-13
[2] Laube et al. Transmission of ESBL/AmpC-producing Escherichia coli from broiler chicken farms to surround-ing areas. Vet Microbiol. 2014 Aug 27;172(3–4):519–527. doi: 10.1016/j.vetmic.2014.06.008. Epub 2014 Jun 28.
[3] Geser et al. Molecular identification of extended-spec-trum-beta-lactamase genes from Enterobacteriaceae isolated from healthy human carriers in Switzerland. Antimicrob Agents Chemother 2012; 56(3): 1609–1612. doi:10.1128/AAC.05539-11
[4] Geser et al. Occurrence and characteristics of extend-ed-spectrum beta-lactamase-(ESBL)producing Entero-bacteriaceae in food-producing animals, minced meat and raw milk. BMC Vet Res 2012; 8:21 doi:10.1186/1746-6148-8-21.
[5] Von Tippelskirch et al. Prevalence and quantitative analysis of ESBL and AmpC-beta-lactamase-producing Enterobacteriaceae in broiler chicken during slaughter in Germany. Int J Food Microbiol. 2018 May 25;281:82–89.
[6] Sharp et al. Abschätzung des Transfers von ESBL-bil-denden Escherichia coli zum Menschen für Deutschland. Berliner und Münchener Tierärztliche Wochenschrift 2014; 127: 446–477. doi:10.2376/0005-936-127-464
[7] Wu G. et al. Comparative analysis of ESBL-positive Escherichia coli isolates from animals and humans from the UK, the Netherlands and Germany. PLoS One 2013; 8(9):e75392. doi:10.1371/journal.pone.0075392
[8] Kronenberg et al. Temporal trends of extended-spec-trum cephalosporin-resistant Escherichia coli and Klebsiella pneumoniae isolates in in- and outpatients in Switzerland, 2004 to 2011. Euro Surveill 2013;18(21). pii:20484
[9] Nüesch-Inderbinen et al. Cross-sectional study on fecal carriage of Enterobacteriaceae with resistance to extended-spectrum cephalosporins in primary care patients. Microb Drug Resist 2013; 19(5): 362–369. doi:10.1089/mdr.2013.0013
[10] Lazarus et al. Do human extraintestinal Escherichia coli infections resistant to expanded-spectrum cephalo-sporins originate from food-producing animals? A systematic review. Clin Infect Dis. 2015 Feb 1;60(3):439-52. doi: 10.1093/cid/ciu785. Epub 2014 Oct 9.
[11] Doyle et al. Methicillin-resistant staphylococci: implica-tions for our food supply? Anim Health Res Rev. 2012 Dec;13(2):157-80. doi: 10.1017/S1466252312000187.
[12] Lassok et al. From pig to pork: methicillin-resistant Staphylococcus aureus in the pork production chain. J Food Prot. 2013 Jun;76(6):1095-108. doi: 10.4315/0362-028X.JFP-12-341.
[13] EFSA (European Food Safety Authority) and ECDC (European Centre for Disease Prevention and Control), 2018. The European Union summary report on antimi-crobial resistance in zoonotic and indicator bacteria from humans, animals and food in 2016. EFSA Journal 2018;16(2):5182, 270 pp. doi:10.2903/j.efsa.2018.5182
Table 10. g: Number of samples and number of MRSA-positive samples by origin of chicken meat in 2016.
Origin No. of samples No. of positive samples ( %)
Germany 28 8 (28.6)
Hungary 27 1 (3.7)
Austria 17 0 (0.0)
Slovenia 14 0 (0.0)
Italy 6 0 (0.0)
France 4 0 (0.0)
Argentina 1 0 (0.0)
Total foreign countries 97 9 (9.3)
Switzerland 205 0 (0.0)

11Resistance in bacteria
from animal clinical isolates

126 Resistance in bacteria from animal clinical isolates
Monitoring of antimicrobial resistance for relevant patho-gens from diseased livestock and companion animals is im-portant for veterinarians, as it enables them to make appro-priate therapeutic antibiotic choices, which they often cannot base on an antibiogram prior to the first treatment. Moreover, these data fill another important gap regarding monitoring of antimicrobial resistance from the One-Health perspective. International organizations have recently fo-cused on these topics [1]. The establishment of a European Veterinarian Committee on Antimicrobial Susceptibility Test-ing (VetCAST) in 2015 also proves the importance of these measures.
In 2015, the Federal Food Safety and Veterinary Office (FSVO) launched a pilot project for the monitoring of veteri-nary pathogens in Switzerland, together with the Swiss na-tional reference laboratory for antibacterial resistance, the Center for Zoonoses, Animal Bacterial Diseases and Antimi-crobial Resistance (ZOBA) at the Institute of Veterinary Bac-teriology, Vetsuisse Faculty of Bern. Results presented here are an excerpt of selected pathogens which were analyzed in the framework of this pilot project [2]. All strains were isolat-ed from clinical submissions of diseased animals analyzed by the ZOBA. Samples from animals with antimicrobial treat-ment prior to sampling were excluded for this study. In con-trast to the monitoring of isolates from healthy slaughter an-imals, MIC data were interpreted according to clinical breakpoints, as recommended by the CLSI. In cases where no clinical breakpoints were available, MIC90 were calculated.
11 Resistance in bacteria from animal clinical isolates
11.1 Staphylococcus spp.Staphylococci are Gram-positive, non-motile and non-spor-ulating cocci. About 40 different Staphylococcus species are found in animals and humans, of which some are specifical-ly associated to their hosts. They belong to the normal mi-crobiota in animals and humans, but are occasionally respon-sible for opportunistic infections. They can cause a broad spectrum of diseases with varying degrees of severity.
11.1.1 Staphylococcus pseudintermedius in dogs
Staphylococcus pseudintermedius is an opportunistic path-ogen, normally found as a commensal on skin and mucosa of dogs. Like other staphylococci, S. pseudintermedius can act as an opportunistic pathogen, recognized as the leading cause of skin, ear, and postoperative bacterial infections in dogs [3]. S. pseudintermedius has gained more importance in veterinary as well as in human medicine in recent years, because of the emergence of methicillin-resistant S. pseud-intermedius (MRSP). In veterinary clinics, the prevalence for MRSP amounts to 66 %. However, 22 % of clinically healthy dogs can also be carriers of MRSP [4]. Humans with close contact to dogs have a higher risk of transmission from MRSP to humans, and infections of humans with MRSP are described in the literature [5], [6]. Colonization and/or infec-tion is therefore not only a concern for veterinarians who treat the infected animals, but also a risk for pet owners.
Table 11. a: Susceptibility rates of Staphylococcus pseudintermedius isolates in dogs.
Antimicrobials n S (n) S ( %) I (n) I ( %) R (n) R ( %)
Amoxicillin + clavulanic acid 44 43 97.7 0 0.0 1 2.3
Ampicillin 44 42 95.5 0 0.0 2 4.5
Cefalotin 44 44 100.0 0 0.0 0 0.0
Clindamycin 44 37 84.1 0 0.0 7 15.9
Enrofloxacin 44 43 97.7 1 2.3 0 0.0
Marbofloxacin 44 44 100.0 0 0.0 0 0.0
Erythromycin 44 37 84.1 0 0.0 7 15.9
Gentamicin 44 41 93.2 3 6.8 0 0.0
Oxacilin + 2 %NaCl 44 43 97.7 0 0.0 1 2.3
Penicillin G 44 33 75.0 0 0.0 11 25.0
Tetracycline 44 32 72.7 0 0.0 12 27.3
Trimethoprim-sulfamethoxazole 44 43 97.7 0 0.0 1 2.3

Resistance in bacteria from animal clinical isolates 127
A total of 44 isolates of S. pseudintermedius in dogs were investigated in 2016/2017. The origin of these bacteria strains was either canine skin or mucosal infections. None of the dogs were treated with antimicrobials before sam-pling.
High resistance rates of these strains to tetracycline (27.3 %) and penicillin (25.0 %) were detected. Moderate resistance rates were detected against clindamycin (15.9 %) and eryth-romycin (15.9 %) (Table 11. a). The joint appearance of these resistances together with the high MIC90 values (Table 11. b) for the other tested macrolides indicate a macrolide-lincos-amid-streptogramin resistance (MLS).
Low resistance rates were found for ampicillin (4.5 %), amoxicillin-clavulanic acid (2.3 %) and sulfamethoxazole-tri-methoprim (2.3 %). One isolate showed resistance to oxacil-lin, but methicillin-resistance was not confirmed. This iso-late showed resistance against eight out of 13 antimicrobials. No resistance to the tested fluoroquinolones could be de-tected. MIC90 values were low for ticarcillin, cephalosporins and macrolides. Moreover, MIC90 values for antimicrobials critically important in human medicine do not hint at poten-tially acquired resistances (Table 11. b).
11.1.2 Staphylococcus aureus from bovine mastitis
S. aureus is a major cause of clinical bovine mastitis world-wide [7], and can be detected in approximately 57 % of all herds in Switzerland. For single animals, the prevalence amounted to 14.4 % in 2013 [8]. Mastitis is usually treated with antibiotics, which are often prescribed without prior susceptibility testing. Given the recent establishment of mo-
lecular-based diagnostics of mastitis pathogens, the use of antibiotics without prior evaluation of an antibiogram is also expected to increase in the coming years [9].
In 2016/2017, a total of 56 bovine Staphylococcus aureus mastitis isolates were investigated. Against penicillin and ampicillin, a moderate resistance rate of 16.1 % was detect-ed (Table 11. c). Besides these therapeutically relevant re-sistances, S. aureus isolates showed only low resistance rates to tetracycline (3.6 %) and ciprofloxacin (1.8 %). No re-sistances to the cephalosporins ceftiofur and cefalotin and no MRSA were detected.
MIC90 values for other cephalosporins, macrolides, clinda-mycin and fluoroquinolone were low (Table 11. d). Moreover, MIC90 values for critically important antimicrobials in human medicine do not hint at acquired resistance so far.
11.2 Streptococcus equi subspecies zooepidemicus
Streptococcus spp. are Gram-positive, non-motile cocci, mainly oxidase- and catalase-negative. In contrast to S. equi subspecies equi, which is exclusively detected in horses, S. equi subspecies zooepidemicus is associated with a wide variety of diseases in horses and other species, including humans [10]. S. equi subsp. zooepidemicus is usually found in young horses, which are infected via nose or mouth. Af-terwards, colonization of mucosal surfaces and the tonsils takes place, and persistence of bacteria in the naropharynx can lead to spreading into the environment and thereby to
Table 11. b: MIC90 rates of Staphylococcus pseudintermedius isolates in dogs in 2016/2017.
Antimicrobials Test range [mg/L] MIC90 [mg/L]
Cefoperazon 0.06–32 0.5
Cefotaxime 0.015–32 0.5
Cefovecin 0.25–8 0.25
Cefoxitin 2–16 2
Cefquinom 0.015–32 0.5
Ceftiofur 0.03–64 0.25
Ciprofloxacin 0.008 - 16 0.25
Linezolid 0.03–64 1
Pirlimycin 0.03–64 8
Quinupristin-Dalfopristin 0.015–32 0.5
Ticarcillin 8–64 8
Ticarcillin + clavulanic acid 8–64 8
Tilmicosin 0.06–128 256*
Tulathromycin 0.06–32 64*
Tylosin 0.06 - 128 256*
Vancomycin 0.015–32 1
MIC90 (Minimal Inhibitory Concentration 90 ): The minimal concentration in mg/L of an antimicrobial required to inhibit the growth of 90 % of the bacteria tested.

128 Resistance in bacteria from animal clinical isolates
infection of other species. Its zoonotic potential is docu-mented in a recent publication of a human infection due to S. equi subspecies zooepidemicus [11]. In most cases, anti-microbial therapy is part of the therapy.
Twenty-two isolates of Streptococcus equi subsp. zooepi-demicus were detected in clinical cases of wound infection or septicemia in horses in 2016/2017. An earlier treatment with antimicrobials could only be excluded in 17 cases, whereas for five strains the therapeutic background re-mained unknown.
High resistance and intermediate rates of 27.2 % and 31.8 % were found against clindamycin (Table 11. e). Moreover, high resistance and intermediate rates (27.2 %, 22.7 %) were de-tected for tetracycline. In contrast, 90.0 % of the isolates showed susceptibility to penicillin. Furthermore, all isolates were sensitive to ampicillin and erythromycin. When looking at MIC90 values of antimicrobials without clinical break-points, no elevated values were measured for these antimi-crobials, including those which are critically important for human medicine (Table 11. f).
11.3 Escherichia coli in dogsE. coli is an important cause of opportunistic infections in veterinary medicine. As in human medicine, especially infec-tion of the urogenital tract with E. coli occurs frequently [12]. Antimicrobial treatment is the therapy of choice. In human medicine, the antimicrobial resistance of extraintestinal pathogenic E. coli associated with urogenital tract infections has increased dramatically in the last decade and is linked to predominant clones of E. coli [12]. Moreover, zoonotic poten-tial of extraintestinal E. coli from dogs to humans has been reported [13]. Hence, knowledge regarding antimicrobial resistances of extraintestinal E. coli isolated from urogenital tract infections of diseased dogs is important for both hu-man and veterinary medicine.
Between 2016 and 2017, 29 E. coli strains were isolated from urinary tract infections in dogs. The animals were not treated with antimicrobials before sampling.
High resistance rates (20.7 %) were detected for ampicillin and cefalotin. Moreover, the resistance rates for cefazolin
Table 11. c: Susceptibility rates of Staphylococcus aureus isolates in bovine mastitis in 2016/2017.
Antimicrobials n S (n) S ( %) I (n) I ( %) R (n) R ( %)
Amoxicillin + clavulanic acid 56 56 100.0 0 0.0 0 0.0
Ampicillin 56 47 83.9 0 0.0 9 16.1
Ceftiofur 56 56 100.0 0 0.0 0 0.0
Cefalotin 56 56 100.0 0 0.0 0 0.0
Cirpofloxacin 56 55 98.2 0 0.0 1 1.8
Erythromycin 56 56 100.0 0 0.0 0 0.0
Gentamicin 56 56 100.0 0 0.0 0 0.0
Penicillin G 56 47 83.9 0 0.0 9 16.1
Pirlimycin 56 56 100.0 0 0.0 0 0.0
Tetrazycline 56 54 96.4 0 0.0 2 3.6
Trimethoprim-sulfamethoxazole 56 56 100.0 0 0.0 0 0.0
Table 11. d: MIC90 rates of Staphylococcus aureus isolates in bovine mastitis in 2016/2017.
Antimicrobials Test range [mg/L] MIC90 [mg/L]
Cefoperazon 0.06–32 2
Cefotaxime 0.015–32 2
Cefquinom 0.015–32 0.5
Clindamycin 0.03–64 0.25
Enrofloxacin 0.008–16 0.25
Linezolid 0.03–64 4
Marbofloxacin 0.008–16 0.5
Quinupristin-Dalfopristin 0.015–32 0.5
Tilmicosin 0.06–128 1
Tulathromycin 0.06–64 8
Tylosin 0.06–128 2
MIC90 (Minimal Inhibitory Concentration 90 ): The minimal concentration in mg/L of an antimicrobial required to inhibit the growth of 90 % of the bacteria tested.

Resistance in bacteria from animal clinical isolates 129
(17.2 %) and amoxicillin + clavulanic acid (10.3 %) were mod-erate (Table 11. g). Low resistance rates were found for en-rofloxacin, marbofloxacin and tetracycline (6.9 %), and only one isolate was resistant to gentamicin and trimetho prim-sulfamethoxazole (3.4 %). No ESBL/pAmpC-or carbapene-mase-producing E. coli was detected.
The cephalosporins without available clinical breakpoints for dogs, including cefovecin and ceftiofur but excepting cefquinom, a 4th generation cephalosporin, showed rela-tively high MIC90 values (Table 11. h). The MIC90 values for colistin as well as doxycycline and florfenicol were low. In contrast, MIC90 values for nalidixic acid and ticarcillin were high.
11.4 Discussion Data from the first Swiss monitoring pilot project on antimi-crobial resistance for veterinary pathogens are presented in this report, [2]. Although only isolates from diagnostic sub-missions of the ZOBA were included, isolate selection,
methodology and interpretation were performed according to internationally ongoing programs. Therefore, these data are comparable with data from international studies, such as ComPath [14], [15] and VetPath [16] studies or GermVet [17]. In contrast, comparability to data presented in previous Swiss reports is limited, as the choice of isolates and the method used in these reports were different from the cur-rent study.
The high resistance rate of Swiss S. pseudintermedius to penicillin described in this report was comparable to resis-tance rates detected in other European countries [15]. In contrast, German canine S. pseudintermedius isolates showed much higher resistance rates for clindamycin, eryth-romycin, tetracycline and penicillin than Swiss isolates [17]. On the other hand, MIC90 values for cephalosporins in Ger-many and Switzerland were similarly low. The low resist-ance rates of Swiss S. pseudintermedius isolates to ampicil-lin and amoxicillin-clavulanic acid, which are also observed in Europe, are therapeutically very important and should be preserved for the future by prudent use of antimicrobials. In contrast to Swiss S. pseudintermedius isolates, European
Table 11. e: Susceptibility rates of Streptococcus equi subspecies zooepidemicus isolates in horses.
Antimicrobials n S (n) S ( %) I (n) I ( %) R (n) R ( %)
Ampicillin 22 22 100.0 0 0.0 0 0.0
Clindamycin 22 9 40.9 7 31.8 6 27.2
Erythromycin 22 22 100.0 0 0.0 0 0.0
Penicillin G 22 20 90.9 0 0.0 1 4.5
Tetracycline 22 11 50.0 5 22.7 6 27.2
Table 11. f: MIC90 rates of Streptococcus equi subspecies zooepidemicus isolates in horses in 2016/2017.
Antimicrobials Test range [mg/L] MIC90 [mg/L]
Amoxicillin + calvulanic acid 0.03–64 0.06
Cefalotin 0.06–128 0.12
Cefoperazon 0.06–32 0.25
Cefotaxime 0.015–2 0.06
Cefquinom 0.015–32 0.06
Ceftiofur 0.03–64 0.25
Ciprofloxacin 0.008–16 2
Enrofloxacin 0.008–16 2
Gentamicin 0.12–256 8
Linezolid 0.03–64 2
Marbofloxacin 0.008–16 2
Oxacillin+ 0.015–8 0.12
Pirlimycin 0.03–64 2
Quinupristin-Dalfopristin 0.015–32 0.5
Sulfamethoxazol-Trimethoprim 0.015–32 0.5
Tilmicosin 0.06–128 0.5
Tulathromycin 0.06–32 2
Tylosin 0.06–128 0.25
MIC90 (Minimal Inhibitory Concentration 90 ): The minimal concentration in mg/L of an antimicrobial required to inhibit the growth of 90 % of the bacteria tested.

130 Resistance in bacteria from animal clinical isolates
Table 11. g: Susceptibility rates of E. coli isolates in dogs.
Antimicrobials n S (n) S ( %) I (n) I ( %) R (n) R ( %)
Amoxiciline + clavulanic acid 29 23 79.3 3 10.3 3 10.3
Ampicilin 29 22 75.9 1 3.4 6 20.7
Cefalotin 29 16 55.2 7 24.1 6 20.7
Ciprofloxacin 29 27 93.1 0 0,0 2 6.9
Enrofloxacin 29 27 93.1 0 0,0 2 6.9
Gentamicin 29 28 96.6 0 0,0 1 3.4
Marbofloxacin 29 27 93.1 0 0,0 2 6.9
Tetracycline 29 26 89.7 1 3.4 2 6.9
Trimethoprim-sulfamethoxazole 29 28 96.6 0 0,0 1 3.4
Imipenem 29 29 100.0 0 0,0 0 0,0
Cefazolin 29 n.d. n.d. n.d. n.d 5 17.2
Table 11. h: MIC90 of E. coli isolates in dogs in 2016/17.
Antimiocrobials Test range [mg/L] MIC90 [mg/L]
Cefoperazon 0.06 – 32 32
Cefotaxime 0.015 – 32 16
Cefovecin 0.25 – 8 16*
Cefoxitin 2 – 16 32*
Cefquinom 0.015 – 32 0.5
Ceftiofur 0.03 – 64 16
Colistin 0.03 – 64 0.5
Doxycylin 0.06 – 128 8
Florfenicol 0.12 – 256 16
Nalidixic acid 0.06 – 128 256*
Neomycin 0.12 – 64 1
Streptomycin 0.25 – 512 16
Ticarcillin 8 – 64 128*
Ticarcillin + clavulanic acid 8 – 64 32
MIC90 (Minimal Inhibitory Concentration 90 ): The minimal concentration in mg/L of an antimicrobial required to inhibit the growth of 90 % of the bacteria tested.
studies reported detectable resistances to fluoroquinolo-nes, albeit on a low level. Whereas in 2014/2015 methicil-lin-resistant S. pseudintermedius (MRSP) isolates were de-tected, data of this pilot project could not confirm the presence of any MRSP within the selected isolates. Amongst others, this difference might be at least partially explained by the more specific choice of isolates. In the last report, antimicrobially treated as well as untreated animals were included, whereas in this report only untreated dogs were included in the sampling. Moreover, the isolates from the previous report were mainly derived from dogs hospital-ized in small animal clinics, whereas the current data also include dogs from small animal practitioners.
In our study, resistances to penicillin and ampicillin (16.1 %) were found to be the most prevalent resistances in S. aureus isolates from bovine mastitis. Penicillin resistance of Swiss S. aureus isolates from mastitis samples has been described previously. Overesch et al. (2013) reported penicillin resis-
tance in 16 % of Swiss S. aureus strains (n= 287) [18]. These strains were tested without selection of origin (e.g. cattle with or without antimicrobial treatment prior to sampling). The fact that, five years later exactly the same resistance rate is found for untreated isolates alone, argues for an in-creasing trend of resistance in the last years. The study from VetPath showed that the 25 % resistance rate found in Euro-pean countries is comparable to that in Switzerland [16]. For-tunately, in contrast to previous studies in Switzerland, no MRSA was detected within the strains tested. This pointed to a recently low prevalence of these multidrug-resistant pathogens in cases of bovine mastitis. Most of the S. aureus strains were found to be susceptible to aminoglycosides, macrolides and fluoroquinolones, which are antibiotics fre-quently used for mastitis treatment in Switzerland. The use of critically important antimicrobials could not be supported by our data, as first-line antibiotics with sufficient efficacy are available and potentially resistant isolates could be iden-tified by susceptibility testing.

Resistance in bacteria from animal clinical isolates 131
For S. equi subspecies zooepidemicus, very few data on antimicrobial resistance are available to date, as this patho-gen is not part of most of the monitoring systems in Europe. In Sweden, S. equi subspecies zooepidemicus isolates showed a lower resistance rate to clindamycin (6 %) [19]. In accordance with Swiss data, Swedish S. equi subspecies zooepidemicus isolates are highly susceptible to penicillin and erythromycin. Tetracyclines are not recommended due to high resistance rates, but also due to the fact that inherent susceptibility is above concentrations that can be obtained during therapy.
For Swiss extraintestinal E. coli isolates, high to moderate resistance rates were detected for ampicillin, amoxicillin/clavulanic acid and cephalosporins. The detected resistance rates are slightly higher than comparable data from Europe-an countries [14]. Moreover, MIC90 values for other cephalo-sporins, except the 4th generation cephalosporin cefquinom, pointed to acquired resistance to this therapeutically rele-vant group of antimicrobials. In contrast, resistance rates for sulfamethoxazole-trimethoprim, tetracycline and gentamicin are favorably low. Compared to the last Swiss antibiotic re-sistance report published in 2016, which states that in 2014 9 out of 82 strains (10.3 %) and in 2015 15 out of 192 strains (7.8 %) were confirmed as ESBL, the prevalence for ESBL isolated from urinary tract infection in dogs in this strain col-lection was zero. Besides the low number of isolates, the different conditions applied for strain collection, as dis-cussed in the context of detection of MRSP, are the most important reason for this phenomenon. Zogg et al. (2018) published data on high prevalences of ESBL-producing bac-teria isolated from urogenital tract infection in Swiss dogs and cats. Unfortunately, these studies focused on uropatho-genic E. coli, which differ markedly from opportunistic ex-traintestinal E. coli in their virulence and resistance pattern [20]. Moreover, in a second study, not only E. coli, but all ESBL-producing Enterobacteriaceae were described, lead-ing to a much higher detected ESBL prevalence than for E. coli alone [21].
Selected data from the first Swiss monitoring pilot project on antimicrobial resistance for veterinary pathogens exem-plified the value of conducting a Swiss monitoring of resis-tances for veterinary pathogens. In the future, this monitor-ing will be even more representative, as isolates from other Swiss laboratories will be included from 2019 on. Further-more, additional bacterial species, including other relevant Gram-positive and Gram-negative pathogens will be report-ed. Moreover, animal species under observation need to encompass livestock as well, e.g. pigs and calves, as these animals receive relevant amounts of antimicrobials for ther-apeutic and/or metaphylactic reasons. Secondly, in order to detect real changes in resistance rates over time, a consis-tent monitoring with defined methodology is needed and will be introduced in 2019 for Switzerland.
Our results demonstrate that a significant and sensitive monitoring of antibacterial resistance of bacteria causing diseases in livestock and companion animals is urgently needed. These data will provide an important insight into the
occurrence, spread and dynamics of critical antibacterial re-sistance in animal pathogens in Switzerland.
The presence of high levels of resistance to important anti-microbials underlines the need for a systematic monitoring of antimicrobial resistance. Infections in animals caused by multidrug-resistant pathogens must increasingly be expect-ed for veterinary pathogens. As in human medicine, clinical settings in particular are faced with the presence of methi-cillin-resistant staphylococci and extended-spectrum-be-ta-lactamase-producing Enterobacteriaceae, linked to a high risk of nosocomial infections. Possible therapy options for severe infections with multiresistant bacteria have to strictly follow the guidelines for prudent use, and critically impor-tant antimicrobials for human medicine should not be ap-plied to animals. The presence of multidrug-resistant bacteria in veterinary medicine does not only constitute a challenge for treatment of the diseased animals, but also represents a risk for humans because of their zoonotic po-tential.
References
[1] Reflection paper on the risk of antimicrobial resistance transfer from companion animals (2015). EMA / CVMP/ AWP / 401740 / 2013, Committee for Medicinal Prod-ucts for Veterinary Use (CVMP)
[2] Schlussbericht zum Pilotprojekt über die Überwa-chung von Antibiotikaresistenzen bei tierpathogenen Erregern. Version für Tierärzte. Mai 2018 www.blv.admin.ch
[3] Moodley et al. 2014 Antimicrobial resistance in methi-cillin-susceptible and methicillin-resistant Staphylococ-cus pseudintermedius of canine origin: literature review from 1980 to 2013. Vet Microbiol. 2014 Jul 16;171(3–4):337–341
[4] Hensel et al. 2016 Prior antibacterial drug exposure in dogs with MRSP pyoderma. Vet. Dermatol 2016; 27: 72-e20
[5] Starlander et al. 2014 Cluster of infections caused by methicillin-resistant Staphylococcus pseudintermedius in humans in a tertiary hospital. J Clin Microbiol. 2014 Aug;52(8):3118–3120
[6] Stegmann et al. 2010 Human infection associated with methicillin-resistant Staphylococcus pseudinter-medius ST71. J Antimicrob Chemother. 2010 Sep;65(9):2047–2048
[7] Monistero et al. 2018 Staphylococcus aureus Isolates from Bovine Mastitis in Eight Countries: Genotypes, Detection of Genes Encoding Different Toxins and Other Virulence Genes. Toxins 2018, 10(6), 247
[8] Kretzschmar et al. 2013 Mastitis-Management in Schweizer Milchviehbetrieben mit Eutergesundheits-problemen (2013). Schweiz Arch Tierheilkd 155(8): 453–462
[9] Hänni et al. 2011 Mastitisbekämpfung in der Schweiz: die aktuelle Diagnostiklandschaft und zukünftige Entwicklungen und Strategien. Schweiz. Arch. Tier-heilkd. 2011, 153:148–151

132 Resistance in bacteria from animal clinical isolates
[10] Waller et al. 2011 Streptococcus equi: a pathogen restricted to one host. J Med Microbiol. 2011 Sep;60(Pt 9):1231–1240
[11] Sepsis, Endocarditis, and Purulent Arthritis due to a Rare Zoonotic Infection with Streptococcus equi subspecies zooepidemicus. 2018 Case Rep Infect Dis. 2018 Jun 14;2018:3265701
[12] LeCuyver et al. 2018 Population structure and antimi-crobial resistance of canine uropathogenic Escherichia coli. J Clin Microbiol. 2018 Jul 11
[13] Reeves et al. 2011 Rates of mutation and host trans-mission for an Escherichia coli clone over 3 years. PLoS ONE 6:e26907
[14] Moyaert et al. 2017 Antimicrobial Susceptibility Moni-toring of Bacterial Pathogens Isolated from Urinary Tract Infections in Dogs and Cats Across Europe: ComPath Results. Microb Drug Resist. 2017 Apr;23(3):391–403
[15] Ludwig et al. 2016 Antimicrobial susceptibility monitor-ing of dermatological bacterial pathogens isolated from diseased dogs and cats across Europe (ComPath results). J Appl Microbiol. 2016 Nov;121(5):1254–1267
[16] De Jong et al. 2018 Monitoring of antimicrobial sus-ceptibility of udder pathogens recovered from cases of clinical mastitis in dairy cows across Europe: VetPath results. Vet Microbiol. 2018 Jan; 213:73–81
[17] BVL Germ-Vet Bericht zur Resistenzmonitoringstudie: Resistenzsituation bei klinisch wichtigen tierpathoge-nen Bakterien 2014/2015.
[18] Overesch et al. 2013 Antimicrobial susceptibility of gram-positive udder pathogens from bovine mastitis milk in Switzerland. (2013). Schweiz Arch Tierheilkd 2013 Jun; 155(6): 339–350
[19] Swedres-Svarm (2016). Consumption of antibiotics and occurrence of resistance in Sweden. Solna/Uppsa-la, ISSN1650-6332
[20] Zogg et al. 2018 Antimicrobial resistance, multilocus sequence types and virulence profiles of ESBL-produc-ing and non-ESBL-producing uropathogenic Escheri-chia coli isolated from cats and dogs in Switzerland. Vet Microbiol. 2018 Mar;216:79–84.
[21] Zogg et al. 2018 High Prevalence of Extended-Spec-trum-Lactamase-Producing Enterobacteriaceae Among Clinical Isolates From Cats and Dogs Admitted to a Veterinary Hospital in Switzerland (2018). Front. Vet. Sci.(2018)

12Analysis

134 Analysis
0
30
60
90
120
2008 2009 2010 2011 2012 2013 2014 2015 2016 2017
mg
/BM
Pigs PoultryCattle
Species
12.1 Association between anti biotic consumption and resistance in animals and in humans, a One-Health approach
12.1.1 Introduction
Resistant bacteria are present in multiple settings (e.g. hu-mans, livestock, meat, pets, water, environment), and may be transmitted from one compartment to the other. There-fore, antibiotic resistance represents a difficult challenge. It is a threat that needs to be tackled using a collaborative ap-proach, enrolling stakeholders from different fields to inter-change knowledge and find solutions. Antibiotic resistance is a health concern that can only be addressed through a One-Health approach.
12 Analysis
Hence, the European Food Safety Authority (EFSA), the Eu-ropean Centre for Disease Prevention and Control (ECDC) and the European Medicine Agency (EMA) launched the Joint Interagency Antimicrobial Consumption and Resist-ance Analysis (JIACRA) [1]. In these reports, associations between the use of antibiotics and the prevalence of resist-ant bacteria were explored for humans and livestock, using data from several European countries. In addition, a possible link between the use of antibiotics in the veterinary setting and the occurrence of resistance in humans was evaluated.
In Switzerland, a One-Health approach to reduce antibiotic resistance (StAR) has also been fostered [2]. In this context, we attempt to jointly analyze human and veterinary data for the first time in this report.
The objective was to analyze the Swiss antibiotic consump-tion and resistance data in a similar fashion as the JIACRA report. This will allow us to assess the relationship between the antibiotic consumption and resistance for humans and
Figure 12. a: Longitudinal Study Extrapolation of veterinary antibiotic sales (2008–2017).

Analysis 135
livestock at national level. However, due to a lack of data and time, only a preliminary analysis could be conducted.
12.1.2 Results
In order to analyze associations between antibiotic usage and resistance in animals, we first had to estimate the usage per animal species from the national sales data. The human use data were transformed into mg of active ingredient per kg of body mass (mg/BM) to allow a better comparison to the veterinary consumption metrics.
Veterinary antibiotic consumption dataAs described in this report, veterinary antibiotic sales de-creased substantially from 2008 to 2017. Figure 12. a pro-vides an estimate of the distribution among the main live-stock species – cattle, pigs and poultry. According to the results from the Longitudinal Study Extrapolation model (see Chapter 13 Materials and methods), we estimate that the largest decrease in antibiotic use occurred in pigs and
cattle. During the considered time period, antibiotic con-sumption in cattle decreased from 96.6 to 49.0 mg/BM, whereas the reduction in the pig sector was from 109.4 to 34.7 mg/BM.
Veterinary antibiotic use and resistanceResults on the association between antibiotic usage and an-tibiotic resistance were inconsistent. While for some combi-nations of antibiotic and bacteria the prevalence of resis-tance decreased with decreasing usage (e.g. tetracycline usage and resistance in Campylobacter coli in pigs), this ef-fect was not detectable for the majority of combinations. For some resistances, even an increase in prevalence of resis-tance was observed with decreasing usage (e.g. tetracy-cline usage and resistance in E. coli in pigs, figure 12.b).
Human antibiotic consumption dataThe estimated inpatient antibiotic consumption increased slightly from 2008 to 2017, although a consistent trend was not observed. This value varied from a minimum of 18.0 mg/
10
25
30
mg/BM
20 25 30 3515
Res
ista
nce
(%
)
2015
2017
2012
2013
2011
2010 2009
10
20
30
40
50
60
mg/BM
20 25 30 3515
Res
ista
nce
(%
)
2012
2013
2017 2015
2010
20092011
Figure 12. b: Association between the use of tetracyclines in pigs and the resistance levels in (A) E. coli (p = 0.07) and (B) Campylobacter coli (p < 0.05, but the data has a poor model fit).
0
20
40
60
80
2015 2016 2017
mg
/BM
OutpatientInpatient
Patient setting
Figure 12. c: Human antibiotic consumption in mg per kg of biomass (mg/BM) in Switzerland (2015–2017).

136 Analysis
BM in 2016 to a maximum of 16.3 mg/BM in 2011. With re-spect to outpatient antibiotic use, the values ranged from 57.8 mg/BM in 2015 to 55.2 mg/BM in 2017. Figure 12. c il-lustrates the antibiotic consumption in both patient settings from 2015 to 2017.
Human antibiotic consumption and resistanceThe models assessing the relationship between inpatient antibiotic consumption and resistance also yielded incon-sistent results. The inpatients’ use of 3rd and 4th generation cephalosporins was associated with an increased preva-lence of resistance to this group (namely cefotaxime and ceftriaxone) in E. coli in inpatient blood isolates. On the oth-er hand, the inpatient consumption of quinolones (mainly fluoroquinolones) was negatively associated with the resis-tance prevalence to ciprofloxacin in blood E. coli isolates from inpatients (Figure 12. d).
Comparison between antibiotic consumption in veterinary and human medicineFigure 12. e provides a comparison of the total antibiotic con-sumption in livestock and humans, using mg/BM as the con-sumption metric. Livestock species presented a reduced antibiotic consumption per biomass when compared to the use of these substances in human medicine.
Antibiotic consumption in livestock and resistance in human isolatesNo statistically significant results were obtained when as-sessing the relationship between cephalosporin consump-tion in livestock and the prevalence of resistance in E. coli blood isolates from outpatients. This analysis was conduct-ed for resistance to cefotaxime and ceftriaxone in human outpatients.
Figure 12. d: Association between (A) the inpatient use of 3rd and 4th generation cephalosporins and the occurrence of cefotaxime resistance in inpatients (p < 0.05); (B) the use of quinolones in inpatients and the occurrence of ciprofloxacin resistance (p < 0.05), in blood E. coli isolates in hospitalized patients.
10
25
30
mg/BM
20 25 30 3515
Res
ista
nce
(%
)
2012
2010
2014 2017
2015
2008
2011 2013
2009
0.5 0.6 1.00.90.80.7
20
30
40
50
60
mg/BM
Res
ista
nce
(%
)
2011
20102017
2016 2013
2012
2015
20092008
20142016
Figure 12. e: Antibiotic consumption in livestock and humans in mg of active ingredient per kg of biomass (mg/BM) for the time period between 2015 and 2017.
0
20
40
60
2016 20172015
mg
/BM
HumanLivestock
Antimicrobial consumption in:

Analysis 137
12.1.3 Discussion
For the first time in Switzerland, this analysis compared hu-man and veterinary data on antibiotic use, and attempted to evaluate associations between use and resistance.
Veterinary antibiotic sales decreased substantially from 2008 onwards. The reduction of antibiotic consumption in pigs and cattle was estimated to contribute the most to the abovementioned decrease. Such a trend is linked to several factors, of which the most important are likely to be: a) the bovine viral diarrhea eradication program; b) the commercial-ization of porcine circovirus-2 vaccines; c) multiple cam-paigns to raise awareness on the topic of prudent use of antibiotics; d) several measures to foster prudent use. With respect to the use of antibiotics in the human sector, an overall decrease was observed from 2015 to 2017. As re-ported for 18 of the 28 countries participating in JIACRA, the antibiotic consumption corrected for the population biomass in Switzerland was lower in food-producing animals than in humans. However, caution should be used when comparing the antibiotic consumption in the veterinary and human set-tings. Due to data limitations in the veterinary sector, a weight-based indicator was used. It is known that treatment incidence metrics provide a better estimate of the antibiotic selection pressure applied in the population. The selected metric for this analysis might have influenced the results obtained. With the initiation of the “Informationssystem An-tibiotika in der Veterinärmedizin” (IS-ABV) database, the data required for the use of treatment incidence metrics will also be available for livestock species. This is an improve-ment which should be applied in future analysis. In addition, mg/biomass in humans was calculated using an average body weight of 62.5 kg. As antibiotic therapies vary consid-erably in mg, defined daily doses (DDD) are usually used when analyzing human consumption data. The correspond-ing numbers are analyzed in chapter 5 of this report.
It is generally accepted that the use of antibiotics is linked to the selection of resistant bacteria. Nonetheless, our analysis showed inconsistent results, with a limited number of mod-els yielding a positive and statistically significant association and a good model fit. This is in contrast to the JIACRA re-port, in which more associations could be established. How-ever, it should be emphasized that the JIACRA analysis in-cluded more data points. In addition, data points represented individual countries in a given year (in our analysis, data points represented individual years in the same country).
Several factors might have influenced the obtained results. Firstly, the analyses were conducted with a very limited number of data points, making it difficult to test potential associations between the use and resistance of antibiotics. In addition, temporality was not taken into account, assum-ing that the levels of antibiotic resistance were independent for each year. It should also be noted that this analysis is subjected to what has been described as the ecological fal-lacy. This is related to the fact that the measurements of antibiotic use and resistance were not acquired from the same individuals.
As also mentioned in the JIACRA report, differences be-tween the systems of collection, testing and reporting of data on use of antibiotics and antibiotic resistance from hu-mans and food-producing animals hamper direct compari-sons. As an example, all isolates from food-producing ani-mals are from healthy animals, whereas all human isolates are from ill patients. Co-resistance might also play a role, given that it might prevent a decrease of resistance preva-lence when reducing the use of a given antibiotic class. This was not taken into account in the analyses performed. It should also be stressed that multiple factors can influence the occurrence of resistance in bacteria and not solely anti-biotic use (e.g. infection dynamics of bacteria). Finally, in a complex ecosystem, reducing one single influential factor (e.g. the use of antibiotics in animals) will not have an imme-diate and direct effect on the measured outcome. In the present case in particular, resistance will persist in other ecological niches, even if one of those niches has experi-enced a decrease in antibiotic use.
As previously described, the analysis performed has limita-tions that need to be acknowledged. However, it establishes a first step to improve the usefulness of monitoring data on antibiotic use and resistance. Certain data limitations will be improved in the future. Given that antibiotic consumption data for outpatients were only available for a short period of time (2015–2017), associations with outpatient resistance were not tested. This remains an objective to be reached in the next years. The associations between the use of antibi-otics in livestock and the occurrence of resistance in the outpatient setting will also be expanded to more substances in the upcoming years. With respect to the methodological limitations, ecological analyses are not tailored to establish causation, but they are useful in generating and exploring hypotheses. Data quality allowing, other methodologies may be used in the future.
In conclusion, a preliminary analysis of the association be-tween antibiotic consumption and resistance was conduct-ed using data collected at the national level. Further im-provements will be made to the analysis in the upcoming years. With improved data (e.g. in veterinary medicine more exact data on the use of antibiotics; in human medicine more data on the use of antibiotics in outpatients), more signifi-cant analyses to analyze possible associations between use of antibiotics and resistance will be feasible. The investiga-tion conducted also allowed us to highlight some of the dif-ficulties in producing a combined human-livestock analysis.
References
[1] ECDC (European Centre for Disease Prevention and Control), EFSA (European Food Safety Authority) and EMA (European Medicines Agency). ECDC/EFSA/EMA second joint report on the integrated analysis of the consumption of antimicrobial agents and occur-rence of antimicrobial resistance in bacteria from humans and food-producing animals – Joint Interagen-

138 Analysis
cy Antimicrobial Consumption and Resistance EFSA J 2017; 15: 135.
[2] Swiss Federal Food Safety and Veterinary Office. StAR programme. 2016. Available at: www.blv.admin.ch/blv/de/home/das-blv/strategien/nationale-strate-gie-antibiotikaresistenzen.html. Accessed June 14, 2018.
12.2 Molecular features of Swiss methicillin-resis-tant Staphylococcus aureus (MRSA)
Staphylococcus (S.) aureus is a commensal bacterium, which is found on skin and soft tissues in approximately one third of healthy humans and is also part of the normal flora of a broad variety of animals [1] [2]. Infections with S. aureus can occur when skin or tissues are damaged. Penicillins were the first line of treatment for S. aureus infections, but resistance developed quickly after these substances were marketed. The introduction of beta-lactamase-resistant modified semi-synthetic penicillin such as methicillin in 1959 seemed to solve the problem. However, one year later, the first methicillin-resistant S. aureus (MRSA) appeared [3]. Resistance to methicillin is not mediated by a beta-lactama-se. Instead, it occurs due to the acquisition of a mobile ge-
netic element called staphylococcal cassette chromosome mec (SCCmec). SCC carry a mecA gene, which encodes an altered penicillin-binding protein (PBP2a) with decreased affinity to beta-lactam antibiotics [2].
In the following decades, MRSA emerged as a major cause of health-care-associated infections in humans. Its occur-rence was restricted to hospitals and other health care facili-ties (“hospital-acquired (HA) MRSA”). In the 1990s, an in-creasing incidence of human MRSA infections that appeared independently from hospitals was observed [4]. These so-called “community-acquired (CA) MRSA” had been reported by many countries worldwide. With the emergence of MRSA in animals more recently, MRSA has gained a One-Health dimension [5]. Numerous studies have shown that especially pigs can be heavily colonized with MRSA [6] [7] [8] [9]. These “livestock-associated (LA) MRSA” can be associated with infections not only in animals but also in humans [9] [10]. Humans with regular and close contact to pigs, such as farm-ers, slaughterhouse workers and veterinarians, have a higher risk of being colonized with LA-MRSA, and thus of develop-ing infections [6] [11] [12] [13] [14]. Although production and clinical use of methicillin has stopped, the term “MRSA” has persisted and nowadays describes S. aureus which are com-pletely resistant to beta-lactam antibiotics. The treatment of MRSA in human settings is even more complicated due to the acquisition of a variety of additional multiple resistances, including vancomycin, linezolid and daptomycin [2].
Livestock species
Poultry Fattening pigs
2009 2010 2011 2012 2013 2014 2015 2016 2017
Calves
5
10
15
20
25
30
35
40
45
50
0
Pre
vale
nce
(%
)
8.16.3
00
42.1
44
25.726.5
20.5
18.1
5.65.9
2
Figure 12.2 a: MRSA prevalence in Swiss livestock between 2009 and 2017.

Analysis 139
The identification of a phenotypically resistant, mecA-negative MRSA from bovine mastitis has led to the discovery of a mecA divergent gene variant called mecC (formerly mecALGA251) [15]. This variant shares only 69 % homology to the mecA gene. Significant differences in susceptibility testing have been re-vealed: in contrast to PBP2amecA, PBP2amecC has a higher affinity to oxacillin than to cefoxitin [16]. Until now the preva-lence of MRSA with this new variant is very low [17]. A third mecA gene variant was recently found in Macrococcus caseo-lyticus, which is named mecB, since this variant was discov-ered before the mecC variant [18]. In 2018, the first mecB car-rying S. aureus, isolated from a patient in Germany, was published [19].
In order to understand the epidemiology of MRSA and the risk for the transmission from animals to humans, an in-depth look into the molecular characteristics of this patho-gen is mandatory. By means of multilocus sequence typing (MLST), based on sequence data of internal fragments of seven housekeeping genes, a highly discriminatory and re-producible tool was established. Moreover, with the intro-duction of the eBURST analysis, an internationally standard-ized grouping of related sequence types (STs) and clonal complexes (CC) was implemented [20] [21] [22]. Although MLST is the gold standard for epidemiological purposes, the method is rather laborious and expensive. Therefore, typing of the polymorphic X region of the protein A gene (spa gene) was established and proved to be highly concordant with the grouping of sequence types [23] [24].
This chapter compares molecular features of Swiss MRSA strains, isolated from livestock and meat thereof with MRSA isolates from healthy veterinarians and farmers as well as human isolates from Swiss hospitals. With this analysis, use-ful information on the distribution of HA-, CA- and LA-MRSA in human and veterinary settings can be provided, helping to obtain insights into transmission risks in Switzerland.
12.2.1 MRSA carriage in Swiss livestock
PoultryIn 2010, 398 cloacal swabs from broilers at slaughter were analyzed for MRSA. No MRSA was detected (Figure 12.2.a). Therefore, MRSA in broilers was not included in the regular antimicrobial resistance monitoring in Switzerland, as the risk for humans is assumed to be very low.
CalvesIn 2017, 297 nasal swabs were collected from slaughter calves. Twenty-four MRSA isolates were obtained from this random sample (8.1 %, Figure 12.2.a). A steady increase of MRSA in samples from Swiss calves could be observed, starting with a prevalence of 2.1 % in 2009 and increasing to 4.0 % in 2013 and 6.3 % in 2015.
Of the 24 MRSA isolates in 2017, 23 isolates belonged to the LA-MRSA type (14 × spa type t011, 7 × spa type t034, 2 × spa type t17339) (Figure 12.2.c). The two spa types t17339
Meat species
Swiss chicken meat Foreign chicken meat
2014 2015 2016 2017
Swiss pork Swiss beef
2.0
4.0
6.0
8.0
10.0
12.0
14.0
16.0
18.0
0.0
Pre
vale
nce
(%
)
1.00.0 0.0
0.7 0.70.00.0 0.0
16.0
9.3
Figure 12.2 b: MRSA prevalence in fresh meat between 2014 and 2017.

140 Analysis
were so far found exclusively in Swiss livestock. One MRSA belonged to spa type t127 (ST1), a CA-MRSA.
Fattening pigsIn Switzerland, the occurrence of MRSA in fattening pigs at slaughter increased continuously and significantly from 2009 to 2017. In 2009, the prevalence was assessed at 2.0 % [24], in 2011 at 5.6 % [25], in 2013 at 20.8 %, in 2014 at 26.5 % and in 2015 at 25.7 %. The prevalence of MRSA among fattening pigs increased to 44.0 % in 2017 (Figure 12.2.a).
All 131 isolates belonged to the LA-MRSA type (63 × spa type t034, 61 × spa type t011, 3 × spa type t1451, 2 × spa type t899, 1 × spa type t2330, 1 × spa type t2876).
12.2.2 MRSA in fresh meat
MRSA in chicken meatIn 2014, fresh chicken meat samples were analyzed for MRSA for the first time. Out of 319 samples (194 from do-mestic production and 125 from foreign production), 22 MRSA were isolated. Twenty MRSA were derived from chicken meat samples produced abroad (16 %), whereas only two strains were isolated from Swiss chicken meat (1.0 %). In 2016, analyses of 302 samples revealed a de-
crease of the MRSA prevalence in chicken meat produced abroad (9 isolates, 9.3 %). No MRSA was detected in Swiss chicken meat (Figure 12.2.b). Eight isolates were typed as LA-MRSA (3 × spa type t034, 3 × spa type t1430, 2 × spa type t2123). One isolate be-longed to spa type t153, which is not categorized (Figure 12.2.c).
MRSA in beef Fresh beef was not investigated in 2014. In 2015 and 2017, all 298 and 299 samples, respectively, were tested negative for MRSA (Figure 12.2.b).
MRSA in porkIn 2014, pork was not investigated. In 2015, two out of 302 Swiss fresh pork meat samples were tested positive for MRSA (0.7 %). Moreover, two out of 301 examined samples were tested positive for MRSA in 2017, corresponding to the same prevalence of 0.7 % as in 2015 (Figure 12.2.b).
One MRSA belonged to the LA-MRSA type (spa type t034), whereas the other MRSA isolate was categorized as HA-MRSA (spa type t002) (Figure 12.2.c).
MRSA type
LA-MRSA CA-MRSA
Chicken meat (n=9)
Veterinarians (n=13)
Calves (n=24)
Farmers (n=8)
Beef (n=0)
Inpatients (n=110)
Pork (n=2)Fattening pigs (n=131)
HA-MRSA Not categorized
20
40
60
80
100
120
140
160
200
180
0
Nu
mb
er o
f is
ola
tes
Figure 12.2 c: MRSA types from humans, animals and meat in 2016/2017.
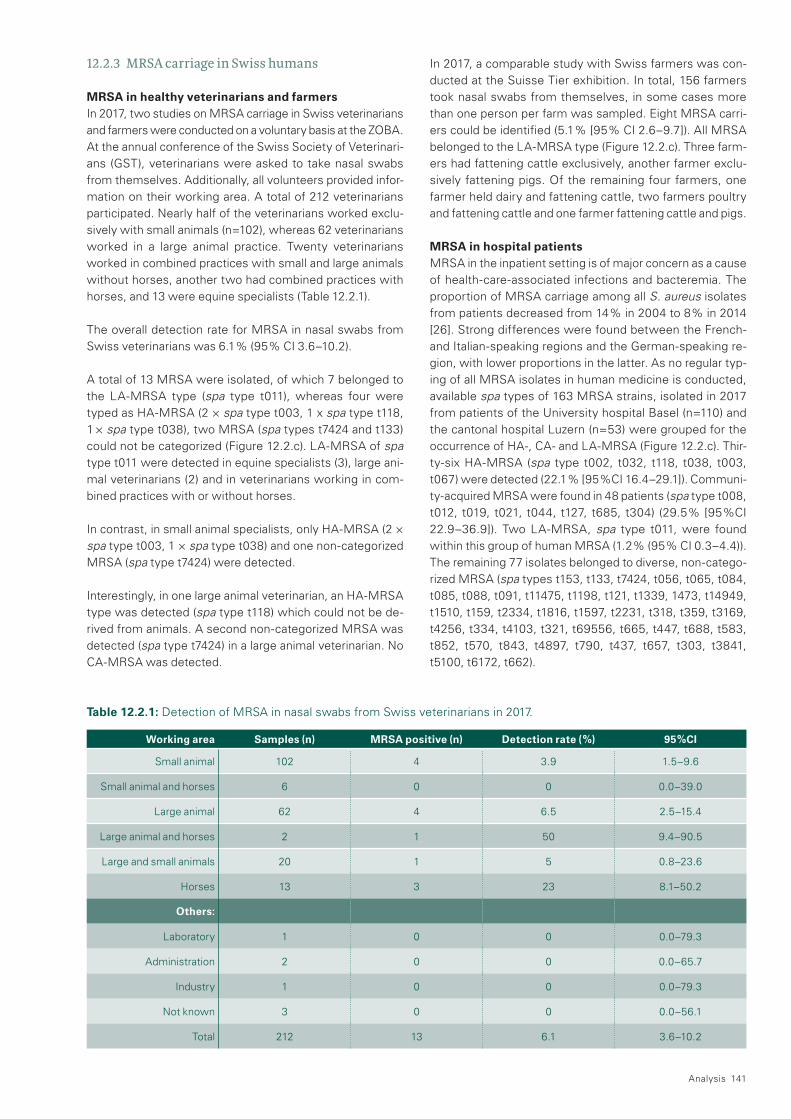
Analysis 141
12.2.3 MRSA carriage in Swiss humans
MRSA in healthy veterinarians and farmersIn 2017, two studies on MRSA carriage in Swiss veterinarians and farmers were conducted on a voluntary basis at the ZOBA. At the annual conference of the Swiss Society of Veterinari-ans (GST), veterinarians were asked to take nasal swabs from themselves. Additionally, all volunteers provided infor-mation on their working area. A total of 212 veterinarians participated. Nearly half of the veterinarians worked exclu-sively with small animals (n=102), whereas 62 veterinarians worked in a large animal practice. Twenty veterinarians worked in combined practices with small and large animals without horses, another two had combined practices with horses, and 13 were equine specialists (Table 12.2.1).
The overall detection rate for MRSA in nasal swabs from Swiss veterinarians was 6.1 % (95 % CI 3.6–10.2).
A total of 13 MRSA were isolated, of which 7 belonged to the LA-MRSA type (spa type t011), whereas four were typed as HA-MRSA (2 × spa type t003, 1 x spa type t118, 1 × spa type t038), two MRSA (spa types t7424 and t133) could not be categorized (Figure 12.2.c). LA-MRSA of spa type t011 were detected in equine specialists (3), large ani-mal veterinarians (2) and in veterinarians working in com-bined practices with or without horses.
In contrast, in small animal specialists, only HA-MRSA (2 × spa type t003, 1 × spa type t038) and one non-categorized MRSA (spa type t7424) were detected.
Interestingly, in one large animal veterinarian, an HA-MRSA type was detected (spa type t118) which could not be de-rived from animals. A second non-categorized MRSA was detected (spa type t7424) in a large animal veterinarian. No CA-MRSA was detected.
In 2017, a comparable study with Swiss farmers was con-ducted at the Suisse Tier exhibition. In total, 156 farmers took nasal swabs from themselves, in some cases more than one person per farm was sampled. Eight MRSA carri-ers could be identified (5.1 % [95 % CI 2.6–9.7]). All MRSA belonged to the LA-MRSA type (Figure 12.2.c). Three farm-ers had fattening cattle exclusively, another farmer exclu-sively fattening pigs. Of the remaining four farmers, one farmer held dairy and fattening cattle, two farmers poultry and fattening cattle and one farmer fattening cattle and pigs.
MRSA in hospital patientsMRSA in the inpatient setting is of major concern as a cause of health-care-associated infections and bacteremia. The proportion of MRSA carriage among all S. aureus isolates from patients decreased from 14 % in 2004 to 8 % in 2014 [26]. Strong differences were found between the French- and Italian-speaking regions and the German-speaking re-gion, with lower proportions in the latter. As no regular typ-ing of all MRSA isolates in human medicine is conducted, available spa types of 163 MRSA strains, isolated in 2017 from patients of the University hospital Basel (n=110) and the cantonal hospital Luzern (n=53) were grouped for the occurrence of HA-, CA- and LA-MRSA (Figure 12.2.c). Thir-ty-six HA-MRSA (spa type t002, t032, t118, t038, t003, t067) were detected (22.1 % [95 %CI 16.4–29.1]). Communi-ty-acquired MRSA were found in 48 patients (spa type t008, t012, t019, t021, t044, t127, t685, t304) (29.5 % [95 %CI 22.9–36.9]). Two LA-MRSA, spa type t011, were found within this group of human MRSA (1.2 % (95 % CI 0.3–4.4)). The remaining 77 isolates belonged to diverse, non-catego-rized MRSA (spa types t153, t133, t7424, t056, t065, t084, t085, t088, t091, t11475, t1198, t121, t1339, 1473, t14949, t1510, t159, t2334, t1816, t1597, t2231, t318, t359, t3169, t4256, t334, t4103, t321, t69556, t665, t447, t688, t583, t852, t570, t843, t4897, t790, t437, t657, t303, t3841, t5100, t6172, t662).
Working area Samples (n) MRSA positive (n) Detection rate ( %) 95 %CI
Small animal 102 4 3.9 1.5–9.6
Small animal and horses 6 0 0 0.0–39.0
Large animal 62 4 6.5 2.5–15.4
Large animal and horses 2 1 50 9.4–90.5
Large and small animals 20 1 5 0.8–23.6
Horses 13 3 23 8.1–50.2
Others:
Laboratory 1 0 0 0.0–79.3
Administration 2 0 0 0.0–65.7
Industry 1 0 0 0.0–79.3
Not known 3 0 0 0.0–56.1
Total 212 13 6.1 3.6–10.2
Table 12.2.1: Detection of MRSA in nasal swabs from Swiss veterinarians in 2017.

142 Analysis
12.2.4 Discussion
Swiss fattening pigs have shown a strong increase in the prevalence of MRSA carriage over the last ten years, reach-ing 44.0 % in 2017. Factors influencing this increase were analyzed by Bangerter et al. (2016) [27]. Moreover, in Swiss calves at slaughter, a similar trend was observed, albeit at a lower level (Figure 12.2. a). The zoonotic potential of such strains via meat or direct animal contact is of public health concern.
So far, the risk for public health due to ingestion of MRSA-positive meat and products is assumed to be low [27]. This was underlined by our data, as the prevalence of MRSA in Swiss pork, beef and chicken meat is very low (Figure 12.2. c). MRSA were only detected in chicken meat from abroad, but with a decreasing trend from 2014 to 2016. The detected MRSA belonged to the LA-MRSA type.
In contrast, the risk of humans being colonized by MRSA via close contact to animals carrying MRSA is evident. Persons at risk, such as farmers, veterinarians and slaughterhouse workers, are more likely to be colonized with MRSA than the community at large [29]. Persistence of MRSA carriage de-pends on duration and intensity of animal contact and was shown to last in the absence of exposure, e.g. during holi-days [30] [31]. The study with Swiss veterinarians and farm-ers in 2017 revealed that 6.1 % of the sampled veterinarians and 5.1 % of the tested Swiss farmers carried MRSA in their nasal mucosa. These detection rates are clearly higher than data from comparable studies in the past; Huber et al. (2011) detected MRSA in 3 % of nasal swabs from persons at risk [32]. Moreover, another study from 2012 revealed 3.8 % MRSA in Swiss veterinarians [33]. The majority of MRSA from veterinarians and farmers belonged to the LA-MRSA type (Figure 12.2.c). This is in line with the findings on MRSA isolated from livestock, which also belong to the LA-MRSA type and consist mainly of spa types t034 and t011. In these cases, transmission from animal to humans is likely. Inter-estingly, veterinarians specialized in small animals turned out to be carriers of HA-MRSA, which cannot be derived from animals but from human to human contact. Moreover, especially in dogs, S. aureus does not belong to the normal flora. Therefore, the risk of transmission of MRSA from dogs to humans is very low. In contrast, equine specialists have a higher risk for transmission of MRSA from horses to veteri-narians. This was previously published by Sieber et al. (2011) and our data confirmed that LA-MRSA is more frequently found in veterinarians working with horses [34].
The increasing MRSA colonization of Swiss livestock may lead to an increasing MRSA colonization of Swiss persons at risk and, in consequence, to a higher proportion of patients entering Swiss medical care facilities. Our data has shown that presently the vast majority of MRSA isolated from inpa-tients in two hospitals in the German-speaking region are HA- and CA-MRSA. This was also recently published by Seidl et al. (2015) for inpatient MRSA from the University Hospital Zurich [35]. However, the detection of a LA-MRSA
in two patients indicates that the above-mentioned trans-mission can occur in Switzerland.
Thanks to more rigorous hygiene management in Swiss hos-pitals, the overall proportion of MRSA among S. aureus iso-lates has decreased over the last decade. However, the steady increase of MRSA in Swiss livestock should be mon-itored carefully, as it may represent a potential risk for trans-mission of MRSA into health care facilities.
Therefore, continuous monitoring, including molecular typ-ing of both human and animal MRSA isolates, is needed.
References
[1] Cohn et al. 2010 A veterinary perspective on methicil-lin-resistant staphylococci. J. Vet. Emerg. Crit. Care (San.Antonio.) 20, 31–45
[2] Peacock et al. 2015 Mechanisms of Methicillin Resis-tance in Staphylococcus aureus. Annu. Rev. Biochem. 84, 577–601
[3] Jevons et al. 1963 Methicillin resistance in staphylo-cocci. Lancet. 1, 904–907
[4] Köck et al. 2010 Methicillin-resistant Staphylococcus aureus (MRSA): burden of disease and control chal-lenges in Europe. Euro Surveill. 15, 19688
[5] Wulf et al. 2008 MRSA in livestock animals – an epi-demic waiting to happen? Clin. Microbiol. Infect. 14, 519–521
[6] Catry et al. 2010 Reflection paper on MRSA in food-producing and companion animals: epidemiology and control options for human and animal health. Epidemiol.Infect. 138, 626–644.
[7] Smith et al. 2011 The emergence of Staphylococcus aureus ST398. Vector Borne Zoonotic Dis. 11, 327–339.
[8] Wagenaar et al. 2009 Unexpected sequence types in livestock-associated methicillin-resistant Staphylococ-cus aureus (MRSA): MRSA ST9 and a single locus variant of ST9 in pig farming in China. Vet. Microbiol. 139, 405–409
[9] Weese 2010 Methicillin-resistant Staphylococcus aureus in animals. ILAR.J 51, 233–244
[10] Van Loo 2007 Emergence of methicillin-resistant Staphylococcus aureus of animal origin in humans. Emerg. Infect. Dis. 13, 1834–1839
[11] Khanna et al. 2008 Methicillin-resistant Staphylococ-cus aureus colonization in pigs and pig farmers. Vet. Microbiol. 128, 298–330
[12] Mulders et al. 2010 Prevalence of livestock-associated MRSA in broiler flocks and risk factors for slaughter-house personnel in The Netherlands. Epidemiol. Infect. 138, 743–755
[13] Verkade 2013 Dynamics and determinants of Staphylo-coccus aureus carriage in livestock veterinarians: a prospective cohort study. Clin. Infect. Dis. 57
[14] Witte et al. 2007 Methicillin-resistant Staphylococcus aureus ST398 in humans and animals, Central Europe. Emerg. Infect. Dis. 13, 255–258

Analysis 143
[15] García-Álvarez 2011 Meticillin-resistant Staphylococ-cus aureus with a novel mecA homologue in human and bovine populations in the UK and Denmark: a descriptive study. Lancet. Infect. Dis. 11, 595–603
[16] Cartwright et al. 2013 Use of Vitek 2 antimicrobial susceptibility profile to identify mecC in methicillin-re-sistant Staphylococcus aureus. J. Clin. Microbiol. 51, 2732–2734
[17] Basset 2013 Very low prevalence of meticillin-resistant Staphylococcus aureus carrying the mecC gene in western Switzerland. J. Hosp. Infect. 83, 257–259
[18] Tsubakishita et al. 2010 Staphylococcal cassette chro-mosome mec -like element in Macrococcus caseolyti-cus. Antimicrob. Agents Chemother. 54, 1469–1475
[19] Becker et al. 2018 Plasmid-Encoded Transferable mecB-Mediated Methicillin Resistance in Staphylococ-cus aureus. Emerg Infect Dis. 2018 Feb;24(2):242–248.
[20] Enright et al. 2000 Multilocus sequence typing for characterization of methicillin-resistant and methicil-lin-susceptible clones of Staphylococcus aureus. J. Clin. Microbiol. 38, 1008–1015
[21] Feil et al. 2004. eBURST: inferring patterns of evolu-tionary descent among clusters of related bacterial genotypes from multilocus sequence typing data. J. Bacteriol. 186, 1518–1530
[22] Murchan et al. 2003 Harmonization of pulsed-field gel electrophoresis protocols for epidemiological typing of strains of methicillin-resistant Staphylococcus aureus: a single approach developed by consensus in 10 Europe-an laboratories and its application for tracing the spread of related strains. J. Clin. Microbiol. 41, 1574–1585
[23] Harmsen et al. 2003 Typing of methicillin-resistant Staphylococcus aureus in a university hospital setting by using novel software for spa repeat determination and database management. J. Clin. Microbiol. 41, 5442–5448
[24] Strommenger et al. 2008 spa typing of Staphylococcus aureus as a frontline tool in epidemiological typing. J. Clin. Microbiol. 46, 574–581
[25] Overesch et al. The increase of methicillin-resistant Staphylococcus aureus (MRSA) and the presence of an unusual sequence type ST49 in slaughter fattening pigs in Switzerland. BMC Veterinary Research 2011; 7: 30
[26] Overesch et al. Entwicklung der Prävalenz von MRSA des Sequenztyps ST49. Fleischwirtschaft 2012; 92 (12): 95–97
[27] Federal Office of Public Health and Federal Food Safety and Veterinary Office 2016 Swiss antibiotic resistance report.
[28] Bangerter, P. D., Sidler, X., Perreten, V., Overesch, G., 2016: Longitudinal study on the colonisation and transmission of methicillin-resistant Staphylococcus aureus in fattening pig farms. Veterinary Microbiology 183(2016): 125–134
[29] Van Loo et al. 2007 Methicillin-resistant Staphylococ-cus aureus in meat products, the Netherlands. Emerg. Infect. Dis. 13, 1753–1755
[30] Cuny et al. 2009 Nasal colonization of humans with methicillin-resistant Staphylococcus aureus (MRSA) CC398 with and without exposure to pigs. PLoS One 4, e6800
[1] Graveland et al. 2011 Persistence of livestock-associat-ed MRSA CC398 in humans is dependent on intensity of animal contact. PLoS One 6, e16830.
[32] Van Clefs et al. 2011 Persistence of Livestock-Associ-ated Methicillin-Resistant Staphylococcus aureus in Field Workers after Short-Term Occupation Exposure to Pigs and Veal Calves. J. Clin. Microbiol. 49.
[33] Huber et al. 2011 Prevalence and characteristics of methicillin-resistant coagulase-negative staphylococci from livestock, chicken carcasses, bulk tank milk, minced meat, and contact persons. BMC Vet.Res. 7, 6.
[34] Wettstein Rosenkranz et al. 2014 Nasal carriage of methicillin-resistant Staphylococcus aureus (MRSA) among Swiss veterinary health care providers: detec-tion of livestock- and health-care-associated clones. Schweizer Archiv für Tierheilkunde, Band 156, Heft 7, Juli, 317–325.
[35] Sieber et al. 2011 Evolution of multidrug-resistant Staphylococcus aureus infections in horses and colo-nized personnel in an equine clinic between 2005 and 2010. Microb Drug Resist. 2011 Sep;17(3):471–478
[36] Seidl et al. 2015 Clonality and antimicrobial susceptibil-ity of methicillin-resistant Staphylococcus aureus at the University Hospital Zurich, Switzerland between 2012 and 2014. Ann. Clin. Microbiol. Antimicrob. Mar 19; 14


13Materials and methods

146 Materials and methods
13.1 Data on antibacterial consumption in human medicine
13.1.1 The Anatomical Therapeutic Chemical (ATC) classification system and defined daily doses (DDD)
Data were collected regarding antibacterials for systemic consumption (group J01 of the ATC classification), antibiot-ics for treatment of tuberculosis (ATC group J04AB) and agents against amoebiasis and other protozoal diseases (ATC group P01AB) [1]. Antibiotic consumption (in grams or millions of International Units) were converted into defined daily doses (DDD) using the 2016 release of the DDD by the World Health Organization Collaborating Centre for Drug Statistics Methodology (see Annex I).
13.1.2 Data sources in the inpatient setting
For the inpatient setting, a network of voluntary acute care hospitals participating in the surveillance system anresis.ch was set up in 2004. We excluded data from ambulatory, re-habilitation, as well as long-term care geriatric and long-term care psychiatric units of these hospitals and specialized clin-ics. To measure the representativeness, we used the num-ber of hospitals, number of beds (activity type A), number of bed-days (without days of discharge) from general acute care hospitals (typology K111-K123 from FOPH) [2]. Data were collected from the entire hospitals, and separately from the adult intensive care units (ICUs) when possible. In this report, we described the antibiotic consumption for the period 2007 to 2017. Sixty-two hospital sites participated in 2007 and 67 in 2017, of which 39 were small-size (<200 beds), 19 medium-size (200–500 beds) and 9 large-size hos-pitals (>500 beds, which includes the five Swiss university hospitals). In 2016, the hospital network represented 41 % of the total number of acute somatic care hospitals and 64 % of all beds in this category in Switzerland. In 2007, thirty-sev-en hospital sites also provided data on adult ICUs. This num-ber increased to 41 (17 small-size, 16 medium-size and 8 large-size hospitals) in 2017, representing 64 % of the hospi-tals equipped with ICU beds in Switzerland. Data on hospital occupied bed-days and admissions were collected, enabling the expression of the consumption density as DDDs per 100 occupied bed-days and as DDDs per 100 admissions. Of note, the definition of bed-days given by the Swiss Federal Statistical Office (SFSO) included the day of discharge or
13 Materials and methods
transfer in the counting days until 2012, and excludes it since then. This means that there is a bias towards a slightly lower number of bed-days in comparison with the previous years and therefore, for a same number of DDDs, towards a slight-ly higher number of DDDs/100 bed-days.
13.1.3 Data sources in the outpatient setting
In the outpatient setting, data were based on two sources of data:
(i) Data for the years 2015 to 2017 were collected on behalf of the Swiss Federal Office of Public Health through IQVIA™ database which provides pharmaceutical sales data. This exhaustive dataset included the antibiotics sold to pharma-cies and dispensing physicians. As IQVIA™ follows the EphMRA classification, we accordingly collected antibiotic use data from the J01, D10B (minocycline, doxycycline oral, lymecycline), G01A1 (metronidazole oral, ornidazole oral), G04A1 (fosfomycin) and G04A9 (nitrofurantoin) classes. It allowed us to measure antibiotic consumption by linguis-tic region (German-speaking, French-speaking and Ital-ian-speaking parts of Switzerland).
(ii) PharmaSuisse, the Swiss Society of Pharmacists, provided data for the years 2013 to 2017 through the updating of the database that is entrusted to the professional cooperative of the Swiss pharmacists (OFAC, Genève). Prescription or-ders were collected at the individual level from the public pharmacies and invoices produced for health insurance companies on behalf of pharmacies. The coverage was ap-proximately 65 % of all pharmacies in Switzerland. All anti-biotics were dispensed with a prescription. The data includ-ed the quantities of antibiotics sold to a number of individuals per age group (<2; 2–11; 12–17; 18– 64; >64 years of age).
The major difference between both datasets is that prescrip-tions from self-dispensing physicians were included in the IQVIA™ database and not included in the PharmaSuisse da-tabase.
The measurement units for reporting antibiotic consumption in the outpatient setting are DDDs per 1,000 inhabitants per day (DID) and number of packages per 1,000 inhabitants per day [1]. The quantity of J01 group antibiotics was the de-nominator when measuring relative consumption.

Materials and methods 147
13.1.4 Categorization of antibiotics in 2017 Core-Access, Watch and Reserve groups
In 2017, the WHO Expert Committee on Selection and Use of Essential Medicines recommended the categorization of antibiotics into the following categories: Access, Watch and Reserve (AWaRe) [3]: – The Access group contains first- and second-choice antibi-
otics for empirical treatment of common infections. – The Watch group contains antibiotic classes within the Ac-
cess group with higher potential for selecting and promoting the spread of resistance. Antibiotics of this group should be limited to a small number of syndromes and patient groups.
– The Core-Access group are those antibiotics in the Access group that are not part of the Watch group.
– The Reserve group contains antibiotic classes that are of crucial importance for the treatment of multidrug-resistant organisms. They should be used as last-resort treatment, when all other alternatives have failed.
– Antibiotics that are not listed in one of the above groups fall into the category “Others.”
See Annex I for the list of antibiotics and their corresponding AWaRe group.
References
[1] WHO Collaborating Centre for Drug Statistics Method-ology, Guidelines for ATC classification and DDD assignment 2017. Oslo, 2018. Available at www.whocc.no/atc_ddd_index/
[2] Federal Office of Public Health, Chiffres-clés des hôpitaux suisses, 2016. Available at www.bag.admin.ch/cchs
[3] WHO Expert Committee on Selection and Use of Essential Medicines. EML 2017, Part III Guidance for interpreting the AWaRe categorization of antibiotics for drug utilization studies. Geneva, 2018.
13.2 Data on antimicrobial sales in veterinary medicine
The list of veterinary products which were granted marketing authorization during the years under review in this report (2016 and 2017) was extracted semi-automatically from the internal Swissmedic database on the basis of their ATCvet codes [1] and completed with the products which were with-drawn from the market in the period under review. Marketing authorization holders were then asked to report sales figures for their products. Products authorized for export only were excluded. They cannot be used in Switzerland and do not contribute to the development of resistance in Switzerland.
The obtained data was transmitted from Swissmedic to the Federal Food Safety and Veterinary Office (FSVO) where it was entered and assessed in a Microsoft Access database
specifically developed for this purpose. The entry of each product consists of a unique identification number, the brand name, the ATCvet code, information on the authorized meth-od of application and the target animal group. Pharmaceutical premixes are indicated separately. The entry additionally in-cludes the number of sold “basic units” (e.g. vials [incl. vol-ume], tablets, injectors, tubes or pouches/bags [incl. weight]).
Total volumes were then calculated by repeatedly multiply-ing the volume of active substance in each basic unit by the number of basic units sold. Combinable filters (year, ATCvet code, administration route) were used for specific queries. The volume of active substance contained in each product and each basic unit is recorded. In the case of antimicrobials declared in International Units, conversion factors according to the template of the European Surveillance of Veterinary Antimicrobial Consumption Project (ESVAC) of the Europe-an Medicines Agency [2] were used.
The methods of application were selected to reflect those referred to in similar reports in other countries (France, AFSSA and United Kingdom, VMD): oral, parenteral, in-tramammary and topical/external. Target animal groups are recorded on the basis of marketing authorizations. The only distinction that can be drawn is between “farm animals,” “pets” and “mixed group” because specific records on the actual target animals of administered products are not avail-able. Specific animal species or age groups were only re-corded if these were clearly mentioned in the marketing authorization (e.g. intramammary injectors for cows or prod-ucts to treat piglets).
References
[1] WHO Collaborating Centre for Drug Statistics Method-ology, Guidelines for ATCvet classification 2015. Oslo, 2014, http://www.whocc.no/atcvet
[2] European Medicines Agency, European Surveillance of Veterinary Antimicrobial Consumption, 2015. Sales of veterinary antimicrobial agents in 26 EU/EEA countries in 2013. EMA/387934/2015
13.3 Bacterial isolates from humans (clinical probes)
Currently, 25 microbiology laboratories are linked to anresis.ch (www.anresis.ch). These laboratories send their results from routine testing of all clinical bacteriology cultures on a regular basis (weekly or monthly) to the anresis.ch database. In contrast to most other surveillance systems, all antimicro-bial resistance results are sent, not restricting the dataset either to invasive isolates, or to a predefined set of microor-ganisms only. Nevertheless, all main analyses were per-formed on invasive isolates only, to allow comparison with international data. Additionally, for E. coli and S. aureus, data from outpatients (ambulatory physicians or hospital outpa-

tient departments) were included and labelled as such. Screening results and antibiotic resistance test results done as reference laboratory are labelled specifically and are not included in this report. In case of multiple isolates, only the first isolate from a given patient and calendar year was taken into account. anresis.ch provides epidemiological informa-tion such as sample location, provider of the sample, patient sex and age. In contrast, clinical data such as diagnosis, ther-apy or outcome are not available. Although we prefer quan-titative antibiotic-resistance-testing results, the majority of microbiological laboratories unfortunately send only qualita-tive, interpreted resistance data (SIR). Resistance data are not validated by anresis.ch, but only by the laboratory send-ing the data. All laboratories participating in anresis.ch are approved by Swissmedic and are enrolled in at least one external quality control program.
Non-susceptibility is defined as an isolate being either re-sistant or intermediately susceptible to a given antibiotic. Non-susceptibility to an antibiotic group is defined as a mi-croorganism with non-susceptibility against at least one an-tibiotic of the given group. Multiresistance was analyzed in accordance with the EARS-Net methodology, to allow com-parability with European data. The Wilson score method [1] was used for calculation of the 95 % confidence interval of proportions of non-susceptibility. Independence between two factors (e.g. co-resistance in MRSA/MSSA or PNSP/PSSP, comparison of resistance rates in invasive and outpa-tient samples) was analyzed by means of the Fisher Exact Test. Logistic regression was used for analysis of trends. A p<0.05 of a z-test for the predictor variable “year” was con-sidered as significant and is represented by an arrow. Statis-tical analyses were performed using R version 3.4.3.
Table 13. a: Antimicrobial resistance-monitoring-program in 2016.
Table 13. b: Antimicrobial resistance-monitoring-program in 2017.
Type of sample Number of samples Bacteria tested Number of resistance tests
Cecum – broilers 496 Campylobacter spp. 170
Cecum – broilers 196 E. coli 190
Cecum – broilers 349 Enterococci 278
Cecum – broilers 307 ESBL-prod. E. coli 160
Cecum – broilers 307 Carbapenemase-prod. E. coli 0
Meat – broilers 302 ESBL-prod. E. coli 149
Meat – broilers 302 Carbapenemase-prod. E. coli 0
Meat – broilers 302 MRSA 9
Clinical material / all species – S. enteritidis 39
Clinical material / all species – S. Typhimurium 54
Clinical material / all species – Monophasic S. typhimurium 13
Type of sample Number of samples Bacteria tested Number of resistance tests
Cecum – fattening pigs 296 Campylobacter spp. 170
Cecum – fattening pigs 216 E. coli 197
Cecum – fattening pigs 296 ESBL-prod. E. coli 52
Cecum – fattening pigs 296 Carbapenemase-prod. E. coli 0
Nasal swab – fattening pigs 298 MRSA 131
Cecum – calves 204 E. coli 194
Cecum – calves 296 Enterococci 175
Cecum – calves 304 ESBL-prod. E. coli 101
Cecum – calves 304 Carbapenemase-prod. E.coli 0
Nasal swab – calves 297 MRSA 24
Meat – fattening pigs 302 ESBL-prod. E. coli 1
Meat – fattening pigs 301 MRSA 2
Meat – fattening pigs 302 Carbapenemase-prod. E.coli 0
Meat – beef 299 ESBL-prod. E. coli 2
Meat – beef 299 MRSA 0
Meat – beef 299 Carbapenemase-prod. E.coli 0
Clinical material / all species – S. Typhimurium 58
Clinical material / all species – Monophasic S. Typhimurium 31
Clinical material / all species – S. enteritidis 28
148 Materials and methods

Reference
[1] Newcombe RG (1998). Two-sided confidence intervals for the single proportion: Comparison of seven meth-ods. Statistics in Medicine, 17, 857–872
13.4 Bacterial isolates from animals and meat thereof
13.4.1 Sampling of healthy animals at the slaughter-house
Stratified random samples were taken in the years 2016 and 2017 (Table 13. a and Table 13. b). Sampling was spread evenly throughout each year, on the basis of a sampling plan established for meat inspections. Samples were collected at the five largest poultry slaughterhouses, the seven largest pig slaughterhouses and the seven largest cattle slaughter-houses. Every slaughterhouse taking part in the program collected a number of samples proportional to the number of animals of the species slaughtered per year. This proce-dure ensured that at least 75 % of slaughtered animals be-longing to the species in question were part of the sample. In 2016, samples were taken from 496 broiler flocks. Ran-dom cecum samples were taken from five broilers per flock. In 2017, 304 cecum samples and 302 nasal swab samples were collected from fattening pigs and 304 cecum samples and 297 nasal swab samples from calves. Samples were sent to the National Reference Laboratory for antimicrobial resistance (ZOBA) for further analyses.
For calves and fattening pigs, the intention was to take sam-ples from one animal selected at random per farm and to avoid taking several samples a year from any particular farm.
The results discussed in this report illustrate the data from 2008 to 2017. In the previous years, sampling procedures and laboratory analyses, excluding ESBL/pAmpC- and carbapen-emase-producing E. coli, were performed in a similar way.
13.4.2 Sampling of meat at retailers
In 2016 and 2017, meat samples (min. 50 g) were taken from fresh, skinless, chilled, packed and untreated meat sold at the retail level. Samples were collected in all Swiss cantons throughout each year. The applied sampling scheme consid-ered each canton’s population density and market shares of retailers.
In 2017, 302 pork and 299 beef samples of domestic produc-tion were collected (Table 13. b). Approximately half of the chicken meat consumed in Switzerland is imported. Hence, imported and domestic chicken meat accounted for approx-imately one third and two thirds respectively of the 302 chicken meat samples in 2016 (Table 13. a).
13.4.3 Sampling for clinical isolates from animals
For Salmonella, no special monitoring at slaughter was fea-sible due to the very low prevalence of Salmonella spp. in Swiss livestock. Therefore, Salmonella isolates sent to ZOBA in 2016 and 2017 in connection with its function as a reference laboratory for Salmonella spp. at the primary pro-duction level as well as isolates from its own diagnostic activities were included in the monitoring (Table 13. a and Table 13. b). Most of these isolates were from clinical ma-terial of various animal species. They also included a small number of isolates derived from samples isolated as part of the national Salmonella-monitoring program in accordance with articles 257 and 258 of the Epizootic Diseases Ordi-nance of 27 June 1995 (EzDO; SR 916.401). The results discussed in this report illustrate the data from 2008 to 2017. Sampling procedures in previous years were per-formed in a similar way.
Staphylococci, streptococci and E. coli strains described in Chapter 11 (“Resistance in bacteria from animal clinical iso-lates”) were isolated from diagnostic submissions of bovine, canine and equine origin, sent to the diagnostic unit of the ZOBA by veterinarian practitioners and clinics in 2015/2016. These data are part of the pilot project for a monitoring pro-gram on antimicrobial resistance of clinical isolates from dis-eased animals launched by the Food Safety and Veterinary Office (FSVO) in 2015. Targeted bacterial and animal species combinations as well as antimicrobials tested are therefore different from the European harmonized monitoring pro-gram in livestock. Isolates are derived from animals without antimicrobial treatment before the sample was taken.
13.5 Susceptibility testing, breakpoints, processing antibiotic resistance data from human isolates
There are no mandatory Swiss guidelines for antibiotic re-sistance testing. Most laboratories initially followed CLSI guidelines and changed to EUCAST guidelines between 2011 and 2013. General use of automated systems in-creased over the years. The Swiss Society of Microbiology encourages the use of EUCAST breakpoints and provides recommendations on their website (http://www.swissmi-crobiology.ch). Nevertheless, individual laboratories are free to use guidelines other than EUCAST.
Therefore, identification methods used may differ between the different laboratories. In most laboratories, validated au- tomated systems, generally based on CLSI guidelines, were introduced during the last couple of years. There is no formal validation of species identification by anresis.ch and no sys-tematic collection of multiresistant isolates.
The antibiotic resistance data presented in this report were extracted from the database using the analysis tool SAGENT,
Materials and methods 149

Table 13. c: Epidemiological cutoff values used for the interpretation of MIC data derived from isolates in samples from healthy animals at slaughterhouse and meat thereof (including Salmonella spp. from clinical samples)
ECOFF (µg / ml) WT ≤
Substance class AntimicrobialsCampylobacter
spp.E. coli/
Salmonella spp.Enterococcus
spp.MRSA
Penicillins
Ampicillin 8 4
Oxacillin 2
Penicillin 0.125
Temocillin 32
Cephalosporins
Cefotaxime 0.25c / 0.5d
Cefotaxime / Clavulanic acid **
Ceftazidime 0.5c / 2d
Ceftazidime / Clavulanic acid **
Cefepime 0.125c
Cefoxitin 8 4
Carbapenems
Ertapenem 0.06
Imipenem 0.5c / 1d
Meropenem 0.125
Amphenicol Chloramphenicol 16 16 32 16g
Tetracyclines Tetracycline 1a / 2b 8 4 1
Glycylcyclines Tigecycline 1 0.25
(Fluoro-)quinoloneCiprofloxacin 0.5 0.064 4 1g
Nalidixic acid 16 16
Sulfonamids Sulfamethoxazole 64c / 256d, h 128g
Lincosamides Clindamycin 0.25
Aminoglycosides
Gentamicin 2 2 32 / 512h 2
Kanamycin 8g
Streptomycin 4 16g
Polymyxins Colistin 2
MacrolidesErythromycin 4a / 8b 4 1
Azithromycin 16
Cyclic lipopeptides Daptomycin 4
GlycopeptidesVancomycin 4 2
Teicoplanin 2
Diaminopyrimidins Trimethoprim 2 2
Oxazolidons Linezolid 4 4g
Streptogramins Quinupristin / Dalfopristin 1f 1g
Ansamycins Rifampin 0.032
Pleuromutilins Tiamulin 2g
Monocarbolic acid Mupirocin 1
Fusidans Fusidic acid 0.5
aC. jejuni, bC. coli, cE. coli, dSalmonella spp., eE. faecalis, fE. faecium; gECOFF for S. aureus, EUCAST clinical breakpoint (ECOFF not defined or outside test range); CLSI-clinical breakpoint (EUCAST clinical breakpoint not defined or outside test-range); ** Interpretation according to EUCAST guideline for detection of resistance mechanisms and specific resistances of clinical and/or epidemiological importance, v. 1.0, 2013.
150 Materials and methods

which is provided to all participating laboratories. For data selection, we used a methodology identical to the antibiotic surveillance systems of the ECDC (EARSS) and of the WHO Europe (CASEAR), restricting the analyzed isolates to inva-sive isolates from blood cultures or cerebrospinal fluid. Iso-lates from foreign countries were excluded. Doubles were defined as identical microorganisms from the same patient during the same calendar year and were, therefore, excluded (only first isolate per calendar year analyzed). As patient iden-tifiers are specific for individual laboratories only, it was not possible to exclude doubles if isolates from the same patient originated from different laboratories. For Salmonella spp. and Campylobacter spp. we analyzed isolates from all mate-rials (e.g. stool). Doubles were excluded as described above.
For this analysis, we used the interpreted, qualitative data (SIR) as delivered by the participating laboratories. An iso-late was considered resistant (R) to an antimicrobial agent when tested and interpreted as resistant in accordance with the breakpoint used by the local laboratory. Quantitative re-sistance data are not provided in most cases and are not used in this analysis (except for S. pneumoniae). An isolate was considered non-susceptible to an antimicrobial agent when tested and found resistant or intermediately suscepti-ble to this antibiotic. An isolate was considered resistant/intermediate to an antibiotic group, if it was tested resistant/intermediate to at least one antibiotic of this group.
Changing breakpoints over time may influence resistance data. This is especially true for S. pneumoniae, for which, in addition to changing breakpoints over time, different break-points are used for different kinds of infections. Therefore, we decided to use the dataset from the Swiss National Ref-erence Center for invasive Pneumococci, which collects all invasive S. pneumoniae isolates, and, in addition to serotyp-ing, repeats antibiotic-resistance testing in a standardized manner. This means that all isolates are tested for erythro-mycin, levofloxacin, co-trimoxazole, and oxacillin. Additional e-tests for penicillin G and ceftriaxone are performed for all oxacillin-non-susceptible strains.
13.6 Susceptibility testing, cut-offs, breakpoints, processing antimicrobial resistance data from animal isolates
All analyses of animal samples were conducted at the na-tional reference laboratory for antimicrobial resistance (ZOBA, Vetsuisse Faculty, University of Bern) using interna-tionally standardized microbiological methods.
13.6.1 Samples of healthy animals at slaughterhouse and meat thereof
Cecal samples from fattening pigs, calves and broilers were tested for Campylobacter spp., E. coli, and Enterococcus spp. using direct detection methods. For Campylobacter spp., modified charcoal cefoperazone deoxycholate agar (mCCDA) was used, for E. coli MacConkey agar and for en-terococci Slanetz-Bartley agar. After appropriate incubation, suspicious colonies were transferred onto non-selective sheep blood agar plates. Identification of suspicious colo-nies was carried out by the direct transfer method, using matrix-assisted laser desorption/ionization time-of-flight mass spectroscopy (MALDI TOF MS) (Biotyper 3.0, Bruker Daltonics, Bremen, Germany) following the manufacturer’s recommendations.
MRSA detection was performed according to published methods. In brief, nasal swab or meat samples were trans-ferred consecutively into two different enrichment broths, followed by cultivation on chromogenic MRSA-selective agar [1]. Confirmation for S. aureus was carried out by MAL-DI TOF MS (Biotyper 3.0, Bruker Daltonics, Bremen, Germa-ny). Methicillin-resistance-gene-mecA detection and deter-mination of the clonal complex (CC) CC398 were carried out by a multiplex real-time PCR, as previously published [2]. Spa type was determined as previously described and ana-lyzed using the Ridom StaphType software (Ridom StaphType, Ridom GmbH, Würzburg, Germany) [3].
Detection of ESBL/pAmpC- and carbapenemase-producing E. coli was carried out on cecal and meat samples according to the protocol of the European reference laboratory for an-timicrobial resistance (EURL, The National Food Institute, Lyngby, Denmark). In brief, samples were pre-enriched in a non-selective broth. After incubation, one loop full of broth was plated onto MacConkey agar with 1 μg/ml Cefotaxime (CTX) (Tritium, The Netherlands) for the detection of ESBL/pAmpC producing E. coli. For carbapenemase-producing E. coli, two different selective agar plates were used (CAR-BA agar plates, OXA-48 agar plates, BioMérieux Inc., Marcy l’Étoile, France). After appropriate incubation, suspicious colonies were transferred onto non-selective sheep blood agar plates. Suspected E. coli colonies were identified by MALDI TOF MS (Biotyper 3.0, Bruker Daltonics, Bremen,
Materials and methods 151

152 Materials and methods
Germany). Confirmation of ESBL/pAmpC or carbapen-emaseproduction was carried out phenotypically by MIC determination on an EUVSEC2 plate.
Isolates were cryoconserved in specific media at –80°C un-til susceptibility testing was performed. The minimal inhibi-tory concentration (MIC) of the antimicrobials was deter-mined by broth microdilution in cation-adjusted Müller-Hinton with (for Campylobacter) or without lysed horse blood, using Sensititre susceptibility plates (Trek Diagnostics Systems, Thermo Fisher, UK) according to CLSI guidelines [4]. The MIC was defined as the lowest antimicrobial concentration at which no visible bacterial growth occurred.
It is recommended that antimicrobial resistance be moni-tored by the assessment of MIC values based on epidemi-ological cutoff (ECOFF) values. Bacterial strains are consid-ered microbiologically resistant if their MIC value is above the highest MIC value observed in the wild-type population of the bacteria (WT). The ECOFF distinguishes wild types from non-wild types. These are set and published by the European Committee on Antimicrobial Susceptibility Testing (EUCAST). Interpretation of MIC followed the ECOFFs laid down in the European decision 2013/652/EU, excluding MRSA, for which ECOFFs according to EUCAST were used (Table 13. c).
Resulting microbiological resistance prevalence rates were described using the following terminology: Minimal: < 0.1 %Very low: 0.1 % to 1 %Low: > 1 % to 10 %Moderate: > 10 % to 20 % High: > 20 % to 50 %Very high: > 50 % to 70 %Extremely high: > 70 %
13.6.2 Samples of clinical animal isolates
Clinical submissions from diseased dogs, cattle and horses were cultured according to standard bacterial culture meth-ods. All isolates derived from ear/eye/nose swabs, skin/wound specimens, mastitis milk and urine from animals, and not treated with antimicrobials prior to sampling were includ-ed in the analysis. Identification to the bacterial species lev-el was performed by MALDI TOF MS (Biotyper 3.0, Bruker Daltonics, Bremen, Germany).
Isolates were cryoconserved in specific media at –80°C until susceptibility testing was performed. The minimal inhibitory concentration (MIC) of the antimicrobials was determined by broth microdilution in cation-adjusted Müller-Hinton with (for streptococci) or without lysed horse blood, using Sensititre susceptibility plates (Trek Di-agnostics Systems, Thermo Fisher, UK) according to CLSI guidelines [4]. The MIC was defined as the lowest antimi-crobial concentration at which no visible bacterial growth occurred.
Isolates were classified as susceptible or resistant accord-ing to clinical breakpoints published by the Clinical and Lab-oratory Standards Institute [5] or, if not available, by clinical breakpoints according to the European Committee on Anti-microbial Susceptibility Testing (EUCAST) guidelines (www.eucast.org). The clinical breakpoint relates primarily to the extent to which the pathogen may respond to treatment, by taking into account aspects of pharmacodynamics and phar-macokinetics as well as specific features of the host and the target organ. If no clinical breakpoints were available at all, MIC90 values were calculated. MIC90 value is defined as the minimal inhibitory concentration at which 90 % of the iso-lates tested are inhibited. Trend analyses of MIC90 values can serve as an indicator for possible resistance develop-ment within a given bacteria population.
References
[1] Overesch G. et al. The increase of methicillin-resistant Staphylococcus aureus (MRSA) and the presence of an unusual sequence type ST49 in slaughter pigs in Switzerland. BMC Vet Res. 2011, 7:30
[2] Stegger M. et al. Rapid PCR Detection of Staphylococ-cus aureus Clonal Complex 398 by Targeting the Restriction-Modification System Carrying sau1-hsdS1. J Clin Microbiol, Febr. 2011, p. 732–734
[3] Harmsen D. et al. Typing of methicillin-resistant Staph-ylococcus aureus in a university hospital setting by using novel software for spa repeat determination and database management. J Clin Microbiol 2003; 41(12):5442–5448
[4] CLSI. Performance Standards for Antimicrobial Disk and Dilution Susceptibility Tests for Bacteria Isolated From Animals.4th ed. CLSI supplement VET01-A4, Wayne, PA: Clinical and Laboratory Standards Insti-tute; 2013.
[5] CLSI. Performance Standards for Antimicrobial Disk and Dilution Susceptibility Tests for Bacteria Isolated From Animals. 3rd ed. CLSI supplement VET01S. Wayne, PA: Clinical and Laboratory Standards Insti-tute; 2015.
13.7 Methodological approach for the One-Health analysis
Data on antibacterial use and resistance Statistics on veterinary antibacterial consumption were based on sales data. Estimates per species (pigs, cattle and poultry) were calculated using the Longitudinal Study Ex-trapolation (LSE) method described by Carmo et al. (2017) [1]. Estimates were produced at the antibacterial class level using mg of active ingredient per kg of biomass (mg/BM) as the consumption metric. Resistance data for livestock re-sulted from the yearly monitoring system put in place by the Federal Food Safety and Veterinary Office. The time period considered was 2008 to 2017.

Materials and methods 153
With respect to the data used from the human sector, inpa-tient antibacterial usage was calculated based on a repre-sentative sample of acute care hospitals participating in the anresis-network (www.anresis.ch) [2]. The time period con-sidered was 2008 to 2017. Antibacterial consumption was extrapolated to the national level according to the proportion of bed-days from the hospitals participating in the anresis network. With the objective of having a similar indicator of antibacterial consumption to the one used in the veterinary calculations (i.e. mg/BM), data on the number of Swiss in-habitants was gathered [3]. To calculate the total Swiss hu-man biomass, it was assumed that the average weight of a Swiss inhabitant was 62.5 kg, as described in the JIACRA report [4]. Data for outpatient antibacterial consumption were analyzed for the time period 2015 to 2017.
Selection of antimicrobial/organism combinations For animals, the analysis of association between antibacte-rial use and resistance was conducted for the following bac-teria: Escherichia coli (E. coli), Campylobacter coli (only for pigs) and Campylobacter jejuni (only for poultry). The analy-sis was completed for cephalosporins, fluoroquinolones and macrolides (only for Campylobacter coli ). Moreover, tetracy-clines and sulfonamides were also considered for pigs and cattle, given their importance in terms of overall sales.
The analysis of association between antibacterial use and resistance in humans (use of 3rd and 4th generation cepha-losporins and resistance to cefotaxime and ceftriaxone; and use of quinolones and resistance to ciprofloxacin) was con-ducted for E. coli blood isolates from hospitalized patients. Bacterial isolates from the central nervous system were not used due to their limited number.
In addition to the abovementioned tested associations, the relationship between the use of cephalosporins in livestock (pigs, cattle and poultry) and cefotaxime and ceftriaxone re-sistance in E. coli blood isolates from outpatients was ana-lyzed, too.
Statistical analysisAssociations between antibacterial consumption and resis-tance were established using binomial regressions with a logistic link. Weights were attributed to the number of iso-lates tested to account for differences between the years. Analyses were not conducted if less than 6 years of data existed with at least 40 isolates tested per year. The proce-dure was conducted using the software R, including the packages “dplyr,” “tidyr” and “ggplot2” [6].
References
[1] Carmo LP, Schuepbach-Regula G, Muentener C,Chevance A, Moulin G, Magouras I. Approaches forquantifying antimicrobial consumption per animalspecies based on national sales data: a Swiss exam-ple, 2006 to 2013. Eurosurveillance 2017; 22. Availableat: http://dx.doi.org/10.2807/1560-7917.ES.2017.22.6.30458.
[2] Swiss Centre for Antibiotic Resistance.2018. Available at: http://www.anresis.ch.
[3] Swiss Federal Statistical Office. Swiss PopulationData. Available at: https://www.bfs.admin.ch/bfs/de/home/statistiken/bevoelkerung/stand-entwicklung.assetdetail.4782753.html.
[4] ECDC (European Centre for Disease Prevention andControl), EFSA (European Food Safety Authority) andEMA (European Medicines Agency). ECDC/EFSA/EMA second joint report on the integrated analysis ofthe consumption of antimicrobial agents and occur-rence of antimicrobial resistance in bacteria fromhumans and food-producing animals – Joint Interagen-cy Antimicrobial Consumption and Resista. EFSA J2017; 15: 135.
[5] R Core Team. R: A Language and Environment forStatistical Computing. 2016. Available at: https://www.r-project.org/.


Annex

156 Annexe: Antibiotics with defined daily dose (DDD) and AWaRe classification according to the WHO Essential Medicines List
Table I.1: Antibacterials for systemic use (ATC group J01), antibiotics for treatment of tuberculosis (ATC group J04AB) and antibiotics against amoebiasis and other protozoal diseases (ATC group P01AB) with administration route, defined daily dose (DDD) and classification by groups, i.e. Core-Access, Watch or Reserve (see Chapter 13 Materials and methods) according to the WHO.
Annex I
Antibiotics with defined daily dose (DDD) and AWaRe classification according to the WHO Essential Medicines List
ATC Group Antibiotic Name Administration Route DDD [g]Groups Core-Access [A], Watch [W], Reserve [R] or Others [O]
J01A
Doxycycline oral 0.1 A
Doxycycline parenteral 0.1 A
Lymecycline oral 0.6 O
Minocycline oral 0.2 O
Tetracycline oral 1 O
Tetracycline parenteral 1 O
Tigecyclin parenteral 0.1 R
J01B Chloramphenicol parenteral 3 A
J01C
Amoxicillin oral 1 A
Amoxicillin parenteral 1 A
Amoxicillin-clavulanic acid oral 1 A
Amoxicillin-clavulanic acid parenteral 3 A
Benzylpenicillin parenteral 3.6 A
Flucloxacillin oral 2 A
Flucloxacillin parenteral 2 A
Phenoxymethylpenicillin oral 2 A
Benzathine phenoxymethylpenicillin oral 2 A
Benzathine benzylpenicillin parenteral 3.6 A
Piperacillin parenteral 14 O
Piperacillin-tazobactam parenteral 14 W
Temocillin parenteral 2 O
Ticarcillin parenteral 15 O
Ticarcillin-clavulanic acid parenteral 15 W

Annexe: Antibiotics with defined daily dose (DDD) and AWaRe classification according to the WHO Essential Medicines List 157
ATC Group Antibiotic Name Administration Route DDD [g]Groups Core-Access [A], Watch [W], Reserve [R] or Others [O]
J01D
Aztreonam parenteral 4 R
Cefaclor oral 1 O
Cefamandole parenteral 6 O
Cefazolin parenteral 3 A
Cefepime parenteral 2 R
Cefixime oral 0.4 W
Cefotaxime parenteral 4 W
Cefoxitin parenteral 6 O
Cefpodoxime oral 0.4 W
Cefprozil oral 1 O
Ceftaroline parenteral 1.2 R
Ceftazidime parenteral 4 W
Ceftibuten oral 0.4 W
Ceftobiprole parenteral 1.5 R
Ceftolozane-tazobactam parenteral 3 R
Ceftriaxone parenteral 2 W
Cefuroxime oral 0.5 O
Cefuroxime parenteral 3 O
Ertapenem parenteral 1 W
Imipenem parenteral 2 W
Meropenem parenteral 2 W
J01E
Sulfadiazine oral 0.6 O
Sulfadiazine parenteral 0.6 O
Trimethoprim oral 0.4 A
Trimethoprim-sulfamethoxazole oral 1.92 A
Trimethoprim-sulfamethoxazole parenteral 1.92 A
J01F
Azithromycin oral 0.3 W
Clarithromycin oral 0.5 W
Clarithromycin parenteral 1 W
Clindamycin oral 1.2 A
Clindamycin parenteral 1.8 A
Erythromycin oral 2 W
Erythromycin parenteral 1 W
Roxithromycin oral 0.3 W
Spiramycin oral 3 W
J01G
Amikacin parenteral 1 A
Gentamicin oral 0.24 A
Gentamicin other 0.24 A
Gentamicin parenteral 0.24 A
Neomycin oral 5 O
Netilmicin oral 0.35 O
Netilmicin parenteral 0.35 O
Streptomycin parenteral 1 O
Tobramycin inhaled 0.3 O
Tobramycin parenteral 0.24 O

158 Annexe: Antibiotics with defined daily dose (DDD) and AWaRe classification according to the WHO Essential Medicines List
ATC Group Antibiotic Name Administration Route DDD [g]Groups Core-Access [A], Watch [W], Reserve [R] or Others [O]
J01M
Ciprofloxacin oral 1 W
Ciprofloxacin parenteral 0.5 W
Levofloxacin oral 0.5 W
Levofloxacin parenteral 0.5 W
Moxifloxacin oral 0.4 W
Moxifloxacin parenteral 0.4 W
Norfloxacin oral 0.8 W
Ofloxacin oral 0.4 W
Ofloxacin parenteral 0.4 W
J01X
Colistin oral 3 R
Colistin inhaled 3 R
Colistin parenteral 3 R
Daptomycin parenteral 0.28 R
Fosfomycin oral 3 O
Fosfomycin parenteral 8 R
Fusidic acid oral 1.5 O
Fusidic acid parenteral 1.5 O
Linezolid oral 1.2 R
Linezolid parenteral 1.2 R
Metronidazole parenteral 1.5 A
Nitrofurantoin oral 0.2 A
Ornidazole parenteral 1 O
Polymyxin B parenteral 0.15 W
Tedizolid oral 0.2 R
Tedizolid parenteral 0.2 R
Teicoplanin parenteral 0.4 W
Vancomycin oral 2 W
Vancomycin parenteral 2 W
J04AB
Rifampicin oral 0.6 –
Rifampicin parenteral 0.6 –
Rifamycin parenteral 0.6 –
Rifabutin oral 0.15 –
P01AB
Metronidazole rectal 2 A
Metronidazole oral 2 A
Ornidazole oral 1.5 O

Annex: Distribution of minimal inhibitory concentrations (MICs) and resistance patterns in bacterial isolates from animals and meat 159
Tables I.1 – I.23 show distribution of MICs in bacterial iso-lates from animals, tables I.24 – I.31 MIC data from isolates derived from meat. Vertical red lines indicate epidemiologi-cal cutoff values for resistance according to EUCAST. The white areas indicate the dilution range tested for each anti-microbial agent. Values above this range indicate MIC values > the highest concentration in the range. Values at the low-est concentration tested indicate MIC values ≤ the lowest concentration in the range. Vertical bars indicate the epide-miological cutoff values, used as interpretative criterion for microbiological resistance.
Tables I.32 – I.48 show multiresistance patterns in bacterial isolates from animals, tables I.49 – I.54 data from isolates derived from meat. The term “multiresistance pattern” is different from “multidrug resistance” (MDR). Multire-sistance patterns describe only the number of detected re-sistances to all antimicrobials tested, even though some antimicrobial classes may be represented by more than one antimicrobial.
Minimal Inhibitory Concentration (MIC) / poultry / Salmonella spp. / Number of Isolates (N=29)
0.00
8
0.01
6
0.03
2
0.06
4
0.12
5
0.25
0.5
1 2 4 8 16 32 64
128
256
512
1,02
4
2,04
8
4,09
6
Ampicillin 6 22 1
Azithromycin 21 8
Cefotaxime 28 1
Ceftazidime 29
Chloramphenicol 29
Ciprofloxacin 3 25 1
Colistin 20 7 1 1
Gentamicin 29
Meropenem 27 2
Nalidixic acid 29
Sulfamethoxazole 1 1 7 14 4 1 1
Tetracycline 28 1
Tigecycline 22 7
Trimethoprim 21 8
Table I.1: Distribution (n) of MICs (mg/L) in Salmonella spp. from poultry, 2016.
Annex II
Distribution of minimal inhibitory concentrations (MICs) and resistance patterns in bacterial isolates from animals and meat

160 Annex: Distribution of minimal inhibitory concentrations (MICs) and resistance patterns in bacterial isolates from animals and meat
Table I. 2: Distribution (n) of MICs (mg/L) in Salmonella spp. from cattle in 2016.
Minimal Inhibitory Concentration (MIC) / cattle / Salmonella spp. / number of isolates (N=51) 0.
008
0.01
6
0.03
2
0.06
4
0.12
5
0.25
0.5
1 2 4 8 16 32 64
128
256
512
1,02
4
2,0
48
4,09
6
Ampicillin 21 16 14
Azithromycin 44 7
Cefotaxime 51
Ceftazidime 51
Chloramphenicol 50 1
Ciprofloxacin 15 34 2
Colistin 44 7
Gentamicin 49 2
Meropenem 46 5
Nalidixic acid 47 4
Sulfamethoxazole 11 17 7 16
Tetracycline 39 1 11
Tigecycline 42 9
Trimethoprim 42 9
Table I. 3: Distribution (n) of MICs (mg/L) in Salmonella spp. from cattle, 2017.
Minimal Inhibitory Concentration (MIC) / cattle / Salmonella spp. / number of isolates (N=66)
0.00
8
0.01
6
0.03
2
0.06
4
0.12
5
0.25
0.5
1 2 4 8 16 32 64
128
256
512
1,02
4
2,04
8
4,09
6
Ampicillin 30 16 20
Azithromycin 53 13
Cefotaxime 64 2
Ceftazidime 66
Chloramphenicol 64 2
Ciprofloxacin 13 52 1
Colistin 58 8
Gentamicin 65 1
Meropenem 63 3
Nalidixic acid 63 3
Sulfamethoxazole 1 15 22 5 1 1 1 20
Tetracycline 43 2 2 1 18
Tigecycline 53 13
Trimethoprim 64 2

Annex: Distribution of minimal inhibitory concentrations (MICs) and resistance patterns in bacterial isolates from animals and meat 161
Table I. 5: Distribution (n) of MICs (mg/L) in Salmonella spp. from pigs, 2017.
Table I. 6: Distribution (n) of MICs (mg/L) in Campylobacter jejuni from broilers, 2016.
Minimal Inhibitory Concentration (MIC) / cattle / Salmonella spp. / number of isolates (N=66)
0.00
8
0.01
6
0.03
2
0.06
4
0.12
5
0.25
0.5
1 2 4 8 16 32 64
128
256
512
1024
2048
4096
Ampicillin 2 8
Azithromycin 8 2
Cefotaxime 10
Ceftazidime 10
Chloramphenicol 10
Ciprofloxacin 1 9
Colistin 10
Gentamicin 10 0
Meropenem 10
Nalidixic acid 10
Sulfamethoxazole 1 1
Tetracycline 2 8
Tigecycline 3 6 1
Trimethoprim 10
Minimal Inhibitory Concentration (MIC) / broilers / Campylobacter jejuni / number of isolates (N=140)
0.00
8
0.01
6
0.03
2
0.06
4
0.12
5
0.25
0.5
1 2 4 8 16 32 64
128
256
512
1024
2048
4096
Ciprofloxacin 56 11 1 2 46 16 8
Erythromycin 122 8 6 1 1 2
Gentamicin 58 54 25 1 2
Nalidixic acid 24 35 8 1 11 61
Streptomycin 5 48 69 8 6 1 3
Tetracycline 77 7 1 1 3 5 8 38
Minimal Inhibitory Concentration (MIC) / poultry / Salmonella spp. / number of isolates (N=31)
0.00
8
0.01
6
0.03
2
0.06
4
0.12
5
0.25
0.5
1 2 4 8 16 32 64
128
256
512
1,02
4
2,0
48
4,09
6
Ampicillin 11 16 4
Azithromycin 24 7
Cefotaxime 31
Ceftazidime 31
Chloramphenicol 31
Ciprofloxacin 5 26
Colistin 27 3 1
Gentamicin 30 1
Meropenem 26 5
Nalidixic acid 30 1
Sulfamethoxazole 2 11 6 6 1 1 4
Tetracycline 28 3
Tigecycline 20 11
Trimethoprim 26 5
Table I. 4: Distribution (n) of MICs (mg/L) in Salmonella spp. from poultry in 2017.

162 Annex: Distribution of minimal inhibitory concentrations (MICs) and resistance patterns in bacterial isolates from animals and meat
Table I. 7: Distribution (n) of MICs (mg/L) in Campylobacter coli from broilers, 2016.
Minimal Inhibitory Concentration (MIC) / broilers / Campylobacter coli / number of isolates (N=30)
0.00
8
0.01
6
0.03
2
0.06
4
0.12
5
0.25
0.5
1 2 4 8 16 32 64
128
256
512
1,02
4
2,0
48
4,09
6
Ciprofloxacin 7 3 1 7 9 3
Erythromycin 13 10 3 1 3
Gentamicin 3 9 14 4
Nalidixic acid 4 5 1 6 14
Streptomycin 4 4 3 1 5 13
Tetracycline 13 2 3 1 1 1 5 4
Table I. 8: Distribution (n) of MICs (mg/L) in Campylobacter coli from fattening pigs, 2017.
Minimal Inhibitory Concentration (MIC) / fattening pigs / Campylobacter coli / number of isolates (N=161)
0.00
8
0.01
6
0.03
2
0.06
4
0.12
5
0.25
0.5
1 2 4 8 16 32 64
128
256
512
1,02
4
2,0
48
4,09
6
Ciprofloxacin 66 11 3 8 29 40 4
Erythromycin 109 34 11 4 3
Gentamicin 21 68 66 4 2
Nalidixic acid 5 45 23 4 3 15 66
Streptomycin 13 14 3 5 31 95
Tetracycline 54 4 3 1 4 23 41 17 14
Table I. 9: Distribution (n) of MICs (mg/L) in Enterococcus faecalis from broilers, 2016.
Minimal Inhibitory Concentration (MIC) / broilers / Enterococcus faecalis / number of isolates (N=31)
0.00
8
0.01
6
0.03
2
0.06
4
0.12
5
0.25
0.5
1 2 4 8 16 32 64
128
256
512
1,02
4
2,04
8
4,09
6
Ampicillin 2 23 6
Chloramphenicol 3 26 1 1
Ciprofloxacin 1 3 20 6 1
Daptomycin 1 11 15 4
Erythromycin 12 4 4 2 1 8
Gentamicin 10 21
Linezolid 3 26 2
Teicoplanin 31
Tetracycline 10 1 1 7 12
Tigecycline 9 17 5
Vancomycin 18 10 2 1

Annex: Distribution of minimal inhibitory concentrations (MICs) and resistance patterns in bacterial isolates from animals and meat 163
Table I. 10: Distribution (n) of MICs (mg/L) in Enterococcus faecium from broilers, 2016.
Minimal Inhibitory Concentration (MIC) / broilers / Enterococcus faecium / number of isolates (N=247)
0.00
8
0.01
6
0.03
2
0.06
4
0.12
5
0.25
0.5
1 2 4 8 16 32 64
128
256
512
1,02
4
2,0
48
4,09
6
Ampicillin 90 57 56 34 8 1 1
Chloramphenicol 66 178 3
Ciprofloxacin 1 4 50 87 98 7
Daptomycin 6 4 18 90 113 16
Erythromycin 117 58 19 7 4 2 1 1 38
Quinupristin/ Dalfopristin
45 61 42 95 3 1
Gentamicin 155 87 5
Linezolid 1 11 188 47
Teicoplanin 246 1
Tetracycline 185 3 3 6 2 1 26 21
Tigecycline 34 125 70 15 3
Vancomycin 221 24 2
Table I. 11: Distribution (n) of MICs (mg/L) in Enterococcus faecalis from calves, 2017.
Table I. 12: Distribution (n) of MICs (mg/L) in Enterococcus faecium from calves, 2017.
Minimal Inhibitory Concentration (MIC) / veal calves / Enterococcus faecalis / number of isolates (N=46)
0.00
8
0.01
6
0.03
2
0.06
4
0.12
5
0.25
0.5
1 2 4 8 16 32 64
128
256
512
1,02
4
2,04
8
4,09
6
Ampicillin 5 39 2
Chloramphenicol 27 10 1 8
Ciprofloxacin 1 26 17 1 1
Daptomycin 11 31 3 1
Erythromycin 27 2 17
Gentamicin 27 7 1 1 1 2 7
Linezolid 21 25
Teicoplanin 46
Tetracycline 15 1 22 8
Tigecycline 2 9 26 8 1
Vancomycin 31 15
Minimal Inhibitory Concentration (MIC) / veal calves / Enterococcus faecium / number of isolates (N=129)
0.00
8
0.01
6
0.03
2
0.06
4
0.12
5
0.25
0.5
1 2 4 8 16 32 64
128
256
512
1,02
4
2,04
8
4,09
6
Ampicillin 13 60 55 0 1
Chloramphenicol 84 43 1 1
Ciprofloxacin 66 56 3 3 1
Daptomycin 1 18 8 100 1 1
Erythromycin 3 9 91 23 1 2
Gentamicin 100 29
Linezolid 2 119 8
Quinupristin / Dalfopristin
3 2 12 112
Teicoplanin 127 2
Tetracycline 122 1 1 2 3
Tigecycline 18 50 44 13 3 1
Vancomycin 127 2

164 Annex: Distribution of minimal inhibitory concentrations (MICs) and resistance patterns in bacterial isolates from animals and meat
Table I. 13: Distribution (n) of MICs (mg/L) in Escherichia coli from broilers, 2016.
Minimal Inhibitory Concentration (MIC) / broilers / Escherichia coli / number of isolates (N=190)
0.00
8
0.01
6
0.03
2
0.06
4
0.12
5
0.25
0.5
1 2 4 8 16 32 64
128
256
512
1,02
4
2,0
48
4,09
6
Ampicillin 9 78 49 7 47
Azithromycin 7 79 95 9
Cefotaxime 190
Ceftazidime 190
Chloramphenicol 178 10 1 1
Ciprofloxacin 101 12 5 23 42 4 1 1 1
Colistin 190
Gentamicin 139 44 4 3
Meropenem 188 2
Nalidixic acid 112 3 5 29 30 11
Sulfamethoxazole 26 25 56 32 6 2 1 5 37
Tetracycline 151 14 2 10 13
Tigecycline 183 7
Trimethoprim 82 67 12 5 24
Table I. 14: Distribution (n) of MICs (mg/L) in Escherichia coli from fattening pigs, 2017.
Minimal Inhibitory Concentration (MIC) / fattening pigs / Escherichia coli / number of isolates (N=197)
0.00
8
0.01
6
0.03
2
0.06
4
0.12
5
0.25
0.5
1 2 4 8 16 32 64
128
256
512
1,02
4
2,04
8
4,09
6
Ampicillin 7 67 91 4 1 27
Azithromycin 14 113 68 1 1
Cefotaxime 197
Ceftazidime 197
Chloramphenicol 181 6 3 5 2
Ciprofloxacin 177 14 1 4 1
Colistin 196 1
Gentamicin 168 23 3 2 1
Meropenem 194 3
Nalidixic acid 191 2 3 1
Sulfamethoxazole 41 37 33 15 1 1 1 1 67
Tetracycline 134 21 1 2 1 16 22
Tigecycline 178 16 3
Trimethoprim 83 69 14 1 30

Annex: Distribution of minimal inhibitory concentrations (MICs) and resistance patterns in bacterial isolates from animals and meat 165
Table I. 15: Distribution (n) of MICs (mg/L) in Escherichia coli from calves, 2017.
Minimal Inhibitory Concentration (MIC) / veal calves / Escherichia coli / number of isolates (N=194)
0.00
8
0.01
6
0.03
2
0.06
4
0.12
5
0.25
0.5
1 2 4 8 16 32 64
128
256
512
1,02
4
2,0
48
4,09
6
Ampicillin 3 38 72 6 75
Azithromycin 13 101 68 12
Cefotaxime 194
Ceftazidime 194
Chloramphenicol 171 4 3 4 2 10
Ciprofloxacin 168 17 2 3 2 1 1
Colistin 192 2
Gentamicin 165 19 1 1 8
Meropenem 194
Nalidixic acid 183 3 1 2 3 2
Sulfamethoxazole 24 40 33 6 3 1 87
Tetracycline 98 15 1 25 55
Tigecycline 169 23 2
Trimethoprim 72 64 17 4 1 36
Table I. 16: Distribution (n) of MICs (mg/L) in suspected ESBL/pAmpC-producing Escherichia coli from broilers, 2016, 1st panel.
Minimal Inhibitory Concentration (MIC) / broilers / Escherichia coli / number of isolates (N=160)
0.00
8
0.01
6
0.03
2
0.06
4
0.12
5
0.25
0.5
1 2 4 8 16 32 64
128
256
512
1,02
4
2,04
8
4,09
6
Ampicillin 2 1 2 2 153
Azithromycin 12 108 38 2
Cefotaxime 10 2 7 7 13 121
Ceftazidime 23 35 17 10 52 23
Chloramphenicol 144 3 2 1 10
Ciprofloxacin 67 12 3 13 34 9 4 1 1 7 9
Colistin 160
Gentamicin 115 34 2 1 3 4 1
Meropenem 155 5
Nalidixic acid 78 7 2 11 8 22 32
Sulfamethoxazole 3 18 24 31 8 1 0 4 71
Tetracycline 104 2 1 1 28 24
Tigecycline 145 14 1
Trimethoprim 46 65 9 40

166 Annex: Distribution of minimal inhibitory concentrations (MICs) and resistance patterns in bacterial isolates from animals and meat
Table I. 17: Distribution (n) of MICs (mg/L) in suspected ESBL/pAmpC-producing Escherichia coli from broilers, 2016, 2nd panel.
Minimal Inhibitory Concentration (MIC) / broiler / Escherichia coli / number of isolates (N=160)
0.00
8
0.01
6
0.03
2
0.06
4
0.12
5
0.25
0.5
1 2 4 8 16 32 64
128
256
512
1,02
4
2,0
48
4,09
6
Cefepime 10 17 68 7 2 14 22 18 2
Cefotaxime 9 3 8 5 13 69 25 22 6
Cefotaxime / clavulanic acid
64 17 2 1 1 6 38 31
Cefoxitin 1 13 44 17 6 16 52 11
Ceftazidime 12 8 24 28 17 64 7
Ceftazidime / clavulanic acid
62 20 1 2 8 42 25
Ertapenem 88 57 9 6
Imipenem 97 62 1
Meropenem 153 7
Temocillin 12 77 68 3
Table I. 18: Distribution (n) of MICs (mg/L) in suspected ESBL/pAmpC-producing Escherichia coli from fattening pigs, 2017, 1st panel.
Minimal Inhibitory Concentration (MIC) / fattening pigs / Escherichia coli / number of isolates (N=52)
0.00
8
0.01
6
0.03
2
0.06
4
0.12
5
0.25
0.5
1 2 4 8 16 32 64
128
256
512
1,02
4
2,04
8
4,09
6
Ampicillin 1 1 2 50
Azithromycin 2 21 26 1 1 3
Cefotaxime 3 1 4 11 35
Ceftazidime 4 14 8 17 8 3
Chloramphenicol 48 2 4
Ciprofloxacin 32 2 1 3 4 3 2 7
Colistin 54
Gentamicin 37 6 4 7
Meropenem 51 3
Nalidixic acid 35 2 0 5 12
Sulfamethoxazole 7 8 6 3 30
Tetracycline 19 2 1 12 20
Tigecycline 43 8 3
Trimethoprim 20 17 4 13

Annex: Distribution of minimal inhibitory concentrations (MICs) and resistance patterns in bacterial isolates from animals and meat 167
Table I. 19: Distribution (n) of MICs (mg/L) in suspected ESBL/pAmpC-producing Escherichia coli from fattening pigs, 2017, 2nd panel.
Table I. 20: Distribution (n) of MICs (mg/L) in suspected ESBL/pAmpC-producing Escherichia coli from calves, 2017, 1st panel.
Minimal Inhibitory Concentration (MIC) / fattening pigs / Escherichia coli / number of isolates (N=52)
0.00
8
0.01
6
0.03
2
0.06
4
0.12
5
0.25
0.5
1 2 4 8 16 32 64
128
256
512
1,02
4
2,0
48
4,09
6
Cefepime 4 11 3 7 15 9 3
Cefotaxime 1 2 5 9 4 10 10 9 2
Cefotaxime / clavulanic acid
31 5 1 2 11 1 1
Cefoxitin 2 14 18 6 5 7
Ceftazidime 1 18 4 16 10 3
Ceftazidime / clavulanic acid
21 12 3 3 8 4 1
Ertapenem 40 9 3
Imipenem 28 20 4
Meropenem 48 4
Temocillin 29 17 5 1
Minimal Inhibitory Concentration (MIC) / veal calves / Escherichia coli / number of isolates (N=101)
0.00
8
0.01
6
0.03
2
0.06
4
0.12
5
0.25
0.5
1 2 4 8 16 32 64
128
256
512
1,02
4
2,04
8
4,09
6
Ampicillin 3 4 94
Azithromycin 4 42 42 6 7
Cefotaxime 1 6 19 12 10 53
Ceftazidime 8 16 18 22 23 14
Chloramphenicol 72 3 2 1 8 15
Ciprofloxacin 45 7 2 17 9 1 2 4 14
Colistin 100 1
Gentamicin 60 5 5 6 7 18
Meropenem 99 2
Nalidixic acid 56 9 5 5 4 22
Sulfamethoxazole 5 1 7 5 2 81
Tetracycline 14 1 29 57
Tigecycline 76 21 4
Trimethoprim 17 25 5 2 52

168 Annex: Distribution of minimal inhibitory concentrations (MICs) and resistance patterns in bacterial isolates from animals and meat
Table I. 21: Distribution (n) of MICs (mg/L) in suspected ESBL/pAmpC-producing Escherichia coli from calves, 2017, 2nd panel.
Minimal Inhibitory Concentration (MIC) / veal calves / Escherichia coli / number of isolates (N=101)
0.00
8
0.01
6
0.03
2
0.06
4
0.12
5
0.25
0.5
1 2 4 8 16 32 64
128
256
512
1,02
4
2,0
48
4,09
6
Cefepime 19 20 3 5 4 10 19 12 8 1
Cefotaxime 1 5 22 9 12 6 11 11 16 8
Cefotaxime / clavulanic acid
46 9 7 15 15 7 1 1
Cefoxitin 4 33 17 16 15 10 6
Ceftazidime 2 6 16 18 25 22 11 1
Ceftazidime / clavulanic acid
38 18 8 11 15 5 5 1
Ertapenem 73 21 7
Imipenem 78 22 1
Meropenem 100 1
Temocillin 6 55 36 4
Table I. 22: Distribution (n) of MICs (mg/L) in Methicillin-resistant Staphylococcus aureus (MRSA) from fattening pigs, 2017.
Minimal Inhibitory Concentration (MIC) / fattening pigs / MRSA / number of osolates (N=131)
0.00
8
0.01
6
0.03
2
0.06
4
0.12
5
0.25
0.5
1 2 4 8 16 32 64
128
256
512
1,02
4
2,04
8
4,09
6
Cefoxitin 53 69 9
Chloramphenicol 22 104 3 1 1
Ciprofloxacin 71 44 1 1 1 9 4
Clindamycin 64 1 1 8 57
Erythromycin 24 48 1 58
Fusidic acid 127 1 3
Gentamicin 114 2 3 4 8
Kanamycin 112 3 1 2 1 12
Linezolid 30 96 5
Mupirocin 128 3
Penicillin 2 129
Quinupristin / Dalfopristin
62 3 43 17 6
Rifampicin 128 2 1
Streptomycin 23 36 5 1 66
Sulfamethoxazole 121 2 1 1 6
Tetracycline 131
Tiamulin 60 4 1 66
Trimethoprim 63 68
Vancomycin 129 2

Annex: Distribution of minimal inhibitory concentrations (MICs) and resistance patterns in bacterial isolates from animals and meat 169
Table I. 24: Distribution (n) of MICs (mg/L) in suspected ESBL/pAmpC-producing Escherichia coli from chicken meat, 2016, 1st panel.
Minimal Inhibitory Concentration (MIC) / chicken meat / Escherichia coli / number of isolates (N=149)
0.00
8
0.01
6
0.03
2
0.06
4
0.12
5
0.25
0.5
1 2 4 8 16 32 64
128
256
512
1,02
4
2,04
8
4,09
6
Ampicillin 2 5 142
Azithromycin 19 101 26 2 1
Cefotaxime 3 3 11 12 22 98
Ceftazidime 10 25 16 12 56 30
Chloramphenicol 132 1 8 3 2 3
Ciprofloxacin 47 7 1 10 37 9 5 3 2 18 10
Colistin 149
Gentamicin 96 30 2 2 8 8 3
Meropenem 149
Nalidixic acid 55 6 3 5 11 29 40
Sulfamethoxazole 7 14 24 13 6 4 81
Tetracycline 78 4 2 3 31 31
Tigecycline 139 10
Trimethoprim 67 30 9 43
Table I. 23: Distribution (n) of MICs (mg/L) in Methicillin-resistant Staphylococcus aureus (MRSA) from calves, 2017.
Minimal Inhibitory Concentration (MIC) / veal calves / MRSA / number of isolates (N=24)
0.01
0.02
0.03
0.06
0.13
0.25
0.5
1 2 4 8 16 32 64
128
256
512
1,02
4
2,0
48
4,09
6
Cefoxitin 9 15
Chloramphenicol 1 20 3
Ciprofloxacin 11 3 4 2 4
Clindamycin 7 17
Erythromycin 1 6 17
Fusidic acid 24
Gentamicin 19 2 3
Kanamycin 18 1 5
Linezolid 4 20
Mupirocin 24 1
Penicillin 24
Quinupristin / Dalfopristin
7 8 1 3 5
Rifampicin 24
Streptomycin 4 5 1 14
Sulfamethoxazole 24
Tetracycline 24
Tiamulin 13 2 9
Trimethoprim 12 12
Vancomycin 24

170 Annex: Distribution of minimal inhibitory concentrations (MICs) and resistance patterns in bacterial isolates from animals and meat
Table I. 25: Distribution (n) of MICs (mg/L) in suspected ESBL/pAmpC-producing Escherichia coli from chicken meat, 2016, 2nd panel.
Minimal Inhibitory Concentration (MIC) / chicken meat / Escherichia coli / number of isolates (N=149)
0.00
8
0.01
6
0.03
2
0.06
4
0.12
5
0.25
0.5
1 2 4 8 16 32 64
128
256
512
1,02
4
2,0
48
4,09
6
Cefepime 6 30 54 13 6 6 22 11 1
Cefotaxime 3 5 10 11 19 55 27 15 4
Cefotaxime / clavulanic acid
61 11 12 38 25 1 1
Cefoxitin 11 38 20 7 16 45 12
Ceftazidime 6 4 18 20 25 49 21 5 1
Ceftazidime / clavulanic acid
57 15 2 10 37 24 3 1
Ertapenem 86 49 14
Imipenem 79 68 2
Meropenem 145 4
Temocillin 1 14 80 50 4
Table I. 26: Distribution (n) of MICs (mg/L) in suspected ESBL/pAmpC-producing Escherichia coli from pork meat, 2017, 1st panel.
Minimal Inhibitory Concentration (MIC) / pork meat / Escherichia coli / number of isolates (N=1)
0.00
8
0.01
6
0.03
2
0.06
4
0.12
5
0.25
0.5
1 2 4 8 16 32 64
128
256
512
1,02
4
2,04
8
4,09
6
Ampicillin 1
Azithromycin 1
Cefotaxime 1
Ceftazidime 1
Chloramphenicol 1
Ciprofloxacin 1
Colistin 1
Gentamicin 1
Meropenem 1
Nalidixic acid 1
Sulfamethoxazole 1
Tetracycline 1
Tigecycline 1
Trimethoprim 1

Annex: Distribution of minimal inhibitory concentrations (MICs) and resistance patterns in bacterial isolates from animals and meat 171
Table I. 28: Distribution (n) of MICs (mg/L) in suspected ESBL/pAmpC-producing Escherichia coli from beef, 2017, 1st panel
Minimal Inhibitory Concentration (MIC) / beef meat / Escherichia coli / number of isolates (N=2)
0.00
8
0.01
6
0.03
2
0.06
4
0.12
5
0.25
0.5
1 2 4 8 16 32 64
128
256
512
1,02
4
2,04
8
4,09
6
Ampicillin 2
Azithromycin 1 1
Cefotaxime 1 1
Ceftazidime 1 1
Chloramphenicol 2
Ciprofloxacin 1 1
Colistin 2
Gentamicin 1 1
Meropenem 2
Nalidixic acid 2
Sulfamethoxazole 1 1
Tetracycline 1 1
Tigecycline 2
Trimethoprim 0 2
Table I. 27: Distribution (n) of MICs (mg/L) in suspected ESBL/pAmpC-producing Escherichia coli from pork meat, 2017, 2nd panel.
Minimal Inhibitory Concentration (MIC) / pork meat / Escherichia coli / number of isolates (N=1)
0.00
8
0.01
6
0.03
2
0.06
4
0.12
5
0.25
0.5
1 2 4 8 16 32 64
128
256
512
1,02
4
2,0
48
4,09
6
Cefepime 1
Cefotaxime 1
Cefotaxime / clavulanic acid
1
Cefoxitin 1
Ceftazidime 1
Ceftazidime / clavulanic acid
1
Ertapenem 1
Imipenem 1
Meropenem 1
Temocillin 1

172 Annex: Distribution of minimal inhibitory concentrations (MICs) and resistance patterns in bacterial isolates from animals and meat
Table I. 29: Distribution (n) of MICs (mg/L) in suspected ESBL/pAmpC-producing Escherichia coli from beef, 2017, 2nd panel.
Minimal Inhibitory Concentration (MIC) / beef meat / Escherichia coli / number of isolates (N=2)
0.00
8
0.01
6
0.03
2
0.06
4
0.12
5
0.25
0.5
1 2 4 8 16 32 64
128
256
512
1,02
4
2,0
48
4,09
6
Cefepime 1 1
Cefotaxime 1 1
Cefotaxime / clavulanic acid
1 1
Cefoxitin 1 1
Ceftazidime 1 1
Ceftazidime / clavulanic acid
1 1
Ertapenem 1 1
Imipenem 2
Meropenem 2
Temocillin 1 1
Table I. 30: Distribution (n) of MICs (mg/L) in MRSA from chicken meat, 2016.
Minimal Inhibitory Concentration (MIC) / chicken meat / MRSA / number of isolates (N=9)
0.00
8
0.01
6
0.03
2
0.06
4
0.12
5
0.25
0.5
1 2 4 8 16 32 64
128
256
512
1,02
4
2,04
8
4,09
6
Cefoxitin 1 7 1
Chloramphenicol 1 6 2
Ciprofloxacin 4 2 3
Clindamycin 1 8
Erythromycin 1 1 7
Fusidic acid 9
Gentamicin 9
Kanamycin 9
Linezolid 2 7
Mupirocin 9
Oxacilin 9
Penicillin 2 2 3 2
Rifampicin 9
Streptomycin 6 3
Sulfamethoxazole
Tetracycline 4 5
Tiamulin 4 5
Trimethoprim 4
Vancomycin 9

Annex: Distribution of minimal inhibitory concentrations (MICs) and resistance patterns in bacterial isolates from animals and meat 173
Table I. 31: Distribution (n) of MICs (mg/L) in MRSA from pork meat, 2017.
Minimal Inhibitory Concentration (MIC) / pork meat / MRSA / number of isolates (N=2)
0.00
8
0.01
6
0.03
2
0.06
4
0.12
5
0.25
0.5
1 2 4 8 16 32 64
128
256
512
1,02
4
2,0
48
4,09
6
Cefoxitin 1 1
Chloramphenicol 1 1
Ciprofloxacin 1 1
Clindamycin 2
Erythromycin 2
Fusidic acid 2
Gentamicin 1 1
Kanamycin 1 1
Linezolid 2
Mupirocin 2
Penicillin 2
Quinupristin / Dalfopristin
2
Rifampicin 2
Streptomycin 2
Sulfamethoxazole 1 1
Tetracycline 1 1
Tiamulin 2
Trimethoprim 2
Vancomycin 2

174 Annex: Distribution of minimal inhibitory concentrations (MICs) and resistance patterns in bacterial isolates from animals and meat
Table I. 32: Multiresistance patterns of Salmonella spp. from poultry, 2016.N
um
ber
of r
esis
ten
ces
Nu
mb
er o
f iso
late
s
Am
pic
illi
n
Azi
thro
myc
in
Cef
ota
xim
e
Cef
tazi
dim
e
Ch
lora
mp
hen
ico
l
Cip
rofl
oxa
cin
Co
list
in
Gen
tam
icin
Mer
op
enem
Nal
idix
ic a
cid
Su
lfam
eth
oxa
zole
Tetr
acyc
lin
e
Tig
ecyc
lin
e
Trim
eth
op
rim
4 ABM 1
3 ABM 11
2 ABM 2
1 ABM 2
0 ABM 35
ABM: antimicrobial
Nu
mb
er o
f res
iste
nce
s
Nu
mb
er o
f iso
late
s
Am
pic
illi
n
Azi
thro
myc
in
Cef
ota
xim
e
Cef
tazi
dim
e
Ch
lora
mp
hen
ico
l
Cip
rofl
oxa
cin
Co
list
in
Gen
tam
icin
Mer
op
enem
Nal
idix
ic a
cid
Su
lfam
eth
oxa
zole
Tetr
acyc
lin
e
Tig
ecyc
lin
e
Trim
eth
op
rim
3 ABM 3
2 ABM 1
1 ABM 1
0 ABM 23
ABM: antimicrobial
Table I. 33: Multiresistance patterns of Salmonella spp. from cattle, 2016.
Table I. 34: Multiresistance patterns of Salmonella spp. from poultry, 2017.
Nu
mb
er o
f res
iste
nce
s
Nu
mb
er o
f iso
late
s
Am
pic
illi
n
Azi
thro
myc
in
Cef
ota
xim
e
Cef
tazi
dim
e
Ch
lora
mp
hen
ico
l
Cip
rofl
oxa
cin
Co
list
in
Gen
tam
icin
Mer
op
enem
Nal
idix
ic a
cid
Su
lfam
eth
oxa
zole
Tetr
acyc
lin
e
Tig
ecyc
lin
e
Trim
eth
op
rim
1 ABM 2
0 ABM 26
ABM: antimicrobial

Annex: Distribution of minimal inhibitory concentrations (MICs) and resistance patterns in bacterial isolates from animals and meat 175
Nu
mb
er o
f res
iste
nce
s
Nu
mb
er o
f iso
late
s
Am
pic
illi
n
Azi
thro
myc
in
Cef
ota
xim
e
Cef
tazi
dim
e
Ch
lora
mp
hen
ico
l
Cip
rofl
oxa
cin
Co
list
in
Gen
tam
icin
Mer
op
enem
Nal
idix
ic a
cid
Su
lfam
eth
oxa
zole
Tetr
acyc
lin
e
Tig
ecyc
lin
e
Trim
eth
op
rim
4 ABM 2
3 ABM 17
2 ABM 1
1 ABM 4
1
0 ABM 41
Nu
mb
er o
f res
iste
nce
s
Nu
mb
er o
f iso
late
s
Cip
rofl
oxa
cin
Ery
thro
myc
in (E
ryth
rom
ycin
A)
Gen
tam
icin
Nal
idix
ic a
cid
Str
epto
myc
in
Tetr
acyc
lin
e
6 ABM 2
4 ABM7
1
3 ABM 34
2 ABM 28
1 ABM
12
1
1
0 ABM 54
Nu
mb
er o
f res
iste
nce
s
Nu
mb
er o
f iso
late
s
Am
pic
illi
n
Azi
thro
myc
in
Cef
ota
xim
e
Cef
tazi
dim
e
Ch
lora
mp
hen
ico
l
Cip
rofl
oxa
cin
Co
list
in
Gen
tam
icin
Mer
op
enem
Nal
idix
ic a
cid
Su
lfam
eth
oxa
zole
Tetr
acyc
lin
e
Tig
ecyc
lin
e
Trim
eth
op
rim
3 ABM 8
0 ABM 2
Table I. 35: Multiresistance patterns of Salmonella spp. from cattle, 2017.
Table I. 36: Multiresistance patterns of Salmonella spp. from pig, 2017.
Table I. 37: Multiresistance patterns of Campylobacter jejuni from broilers, 2016.

176 Annex: Distribution of minimal inhibitory concentrations (MICs) and resistance patterns in bacterial isolates from animals and meat
Nu
mb
er o
f res
iste
nce
s
Nu
mb
er o
f iso
late
s
Cip
rofl
oxa
cin
Ery
thro
myc
in (E
ryth
rom
ycin
A)
Gen
tam
icin
Nal
idix
ic a
cid
Str
epto
myc
in
Tetr
acyc
lin
e
5 ABM 3
4 ABM 6
3 ABM7
1
2 ABM3
1
1 ABM2
1
0 ABM 6
Nu
mb
er o
f res
iste
nce
s
Nu
mb
er o
f iso
late
s
Cip
rofl
oxa
cin
Ery
thro
myc
in (E
ryth
rom
ycin
A)
Gen
tam
icin
Nal
idix
ic a
cid
Str
epto
myc
in
Tetr
acyc
lin
e
5 ABM1
1
4 ABM
48
1
1
3 ABM
18
3
1
2 ABM39
8
1 ABM
21
7
2
1
0 ABM 9
Table I. 38: Multiresistance patterns of Campylobacter colii from broilers, 2016.
Table I. 39: Multiresistance patterns of Campylobacter colii from fattening pigs, 2017.

Annex: Distribution of minimal inhibitory concentrations (MICs) and resistance patterns in bacterial isolates from animals and meat 177
Table I. 40: Multiresistance patterns of Enterococcus faecium from broilers, 2016.
Nu
mb
er o
f res
iste
nce
s
Nu
mb
er o
f iso
late
s
Am
pic
illi
n
Ch
lora
mp
hen
ico
l
Cip
rofl
oxa
cin
Dap
tom
ycin
Ery
thro
myc
in (E
ryth
rom
ycin
A)
Gen
tam
icin
Lin
ezo
lid
Qu
inu
pri
stin
/Dal
fop
rist
in
Teic
op
lan
in
Tetr
acyc
lin
e
Tig
ecyc
lin
e
Van
com
ycin
4 ABM1
1
3 ABM
4
2
2
1
1
1
1
1
2 ABM
32
29
4
3
1
1
1
1
1
1 ABM
58
14
10
9
2
0 ABM 66

178 Annex: Distribution of minimal inhibitory concentrations (MICs) and resistance patterns in bacterial isolates from animals and meat
Table I. 41: Multiresistance patterns of Enterococcus faecium from calves, 2017.N
um
ber
of r
esis
ten
ces
Nu
mb
er o
f iso
late
s
Am
pic
illi
n
Ch
lora
mp
hen
ico
l
Cip
rofl
oxa
cin
Dap
tom
ycin
Ery
thro
myc
in (E
ryth
rom
ycin
A)
Gen
tam
icin
Lin
ezo
lid
Qu
inu
pri
stin
/Dal
fop
rist
in
Teic
op
lan
in
Tetr
acyc
lin
e
Tig
ecyc
lin
e
Van
com
ycin
4 ABM 1
3 ABM
3
1
1
2 ABM
21
3
1
1 ABM
93
1
1
0 ABM 3
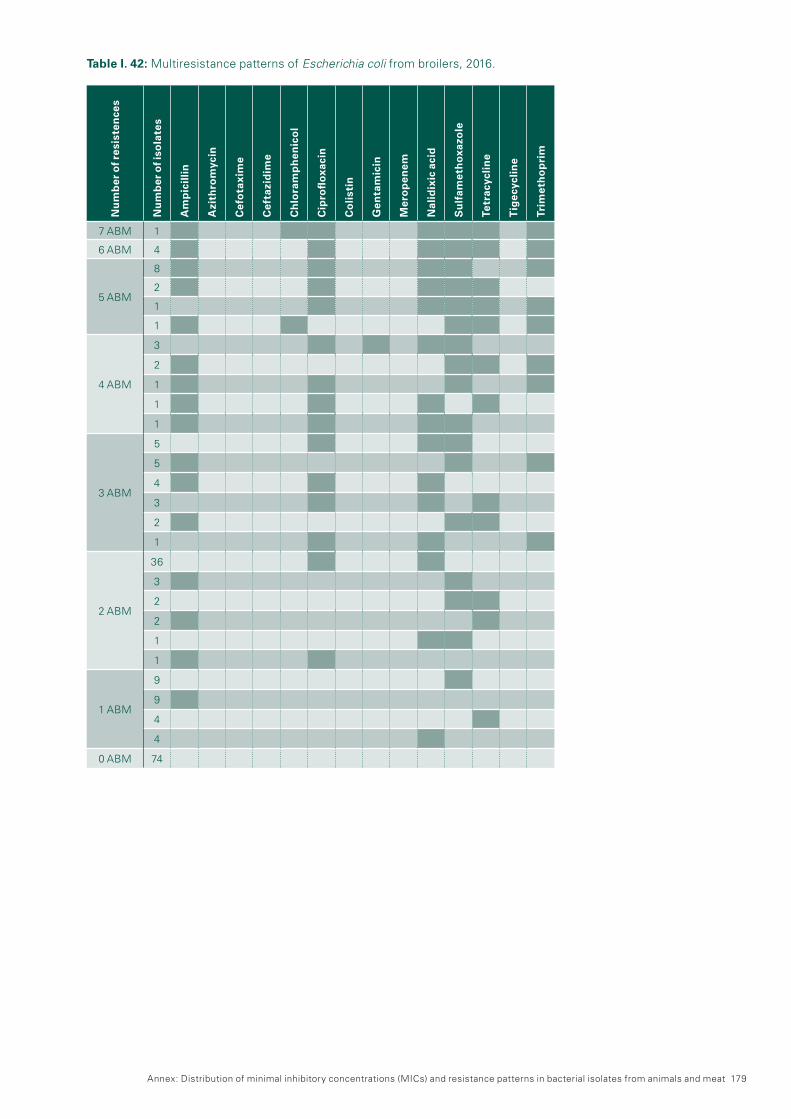
Annex: Distribution of minimal inhibitory concentrations (MICs) and resistance patterns in bacterial isolates from animals and meat 179
Table I. 42: Multiresistance patterns of Escherichia coli from broilers, 2016.
Nu
mb
er o
f res
iste
nce
s
Nu
mb
er o
f iso
late
s
Am
pic
illi
n
Azi
thro
myc
in
Cef
ota
xim
e
Cef
tazi
dim
e
Ch
lora
mp
hen
ico
l
Cip
rofl
oxa
cin
Co
list
in
Gen
tam
icin
Mer
op
enem
Nal
idix
ic a
cid
Su
lfam
eth
oxa
zole
Tetr
acyc
lin
e
Tig
ecyc
lin
e
Trim
eth
op
rim
7 ABM 1
6 ABM 4
5 ABM
8
2
1
1
4 ABM
3
2
1
1
1
3 ABM
5
5
4
3
2
1
2 ABM
36
3
2
2
1
1
1 ABM
9
9
4
4
0 ABM 74
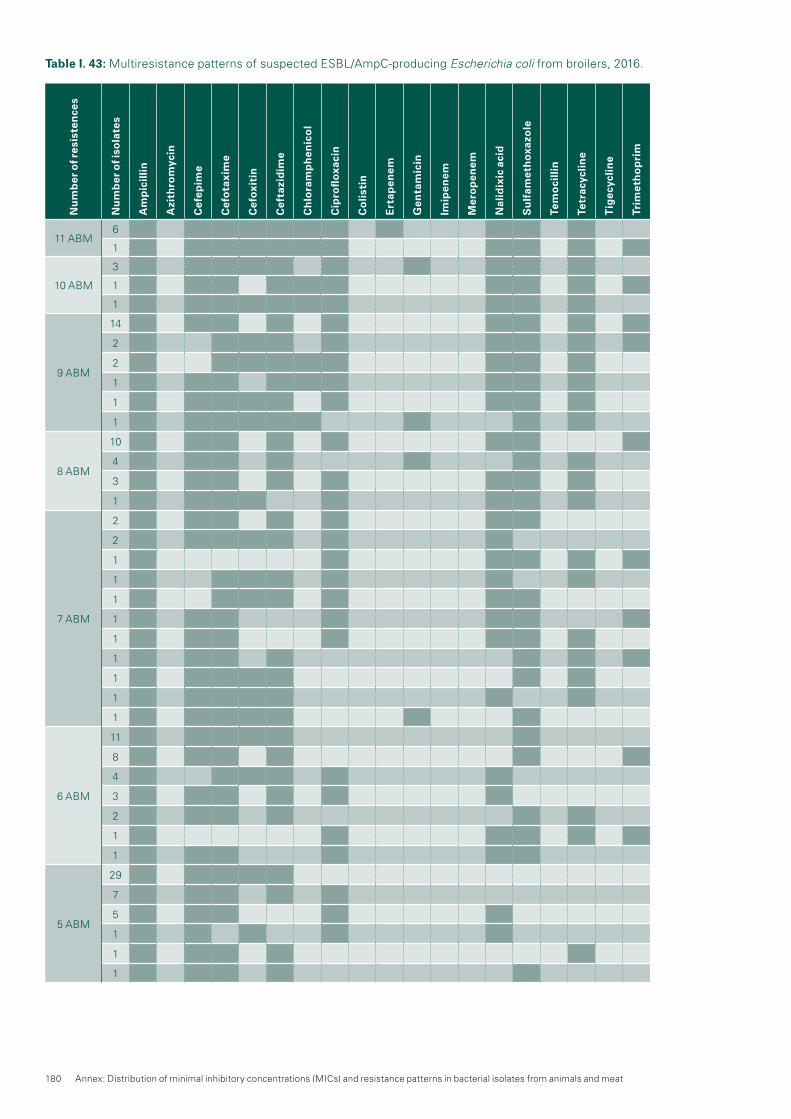
180 Annex: Distribution of minimal inhibitory concentrations (MICs) and resistance patterns in bacterial isolates from animals and meat
Table I. 43: Multiresistance patterns of suspected ESBL/AmpC-producing Escherichia coli from broilers, 2016.N
um
ber
of r
esis
ten
ces
Nu
mb
er o
f iso
late
s
Am
pic
illi
n
Azi
thro
myc
in
Cef
epim
e
Cef
ota
xim
e
Cef
oxi
tin
Cef
tazi
dim
e
Ch
lora
mp
hen
ico
l
Cip
rofl
oxa
cin
Co
list
in
Ert
apen
em
Gen
tam
icin
Imip
enem
Mer
op
enem
Nal
idix
ic a
cid
Su
lfam
eth
oxa
zole
Tem
oci
llin
Tetr
acyc
lin
e
Tig
ecyc
lin
e
Trim
eth
op
rim
11 ABM6
1
10 ABM
3
1
1
9 ABM
14
2
2
1
1
1
8 ABM
10
4
3
1
7 ABM
2
2
1
1
1
1
1
1
1
1
1
6 ABM
11
8
4
3
2
1
1
5 ABM
29
7
5
1
1
1

Annex: Distribution of minimal inhibitory concentrations (MICs) and resistance patterns in bacterial isolates from animals and meat 181
Nu
mb
er o
f res
iste
nce
s
Nu
mb
er o
f iso
late
s
Am
pic
illi
n
Azi
thro
myc
in
Cef
epim
e
Cef
ota
xim
e
Cef
oxi
tin
Cef
tazi
dim
e
Ch
lora
mp
hen
ico
l
Cip
rofl
oxa
cin
Co
list
in
Ert
apen
em
Gen
tam
icin
Imip
enem
Mer
op
enem
Nal
idix
ic a
cid
Su
lfam
eth
oxa
zole
Tem
oci
llin
Tetr
acyc
lin
e
Tig
ecyc
lin
e
Trim
eth
op
rim
4 ABM
7
4
1
1
3 ABM
3
1
1
2 ABM 2
0 ABM 2

182 Annex: Distribution of minimal inhibitory concentrations (MICs) and resistance patterns in bacterial isolates from animals and meat
Table I. 44: Multiresistance patterns of Escherichia coli from calves, 2017.N
um
ber
of r
esis
ten
ces
Nu
mb
er o
f iso
late
s
Am
pic
illi
n
Azi
thro
myc
in
Cef
ota
xim
e
Cef
tazi
dim
e
Ch
lora
mp
hen
ico
l
Cip
rofl
oxa
cin
Co
list
in
Gen
tam
icin
Mer
op
enem
Nal
idix
ic a
cid
Su
lfam
eth
oxa
zole
Tetr
acyc
lin
e
Tig
ecyc
lin
e
Trim
eth
op
rim
7 ABM2
1
6 ABM
2
2
1
5 ABM4
2
4 ABM
14
7
1
1
1
3 ABM
22
4
3
1
1
1
2 ABM
13
4
2
1
1
1 ABM
4
4
1
1
0 ABM 93

Annex: Distribution of minimal inhibitory concentrations (MICs) and resistance patterns in bacterial isolates from animals and meat 183
Nu
mb
er o
f res
iste
nce
s
Nu
mb
er o
f iso
late
s
Am
pic
illi
n
Azi
thro
myc
in
Cef
epim
e
Cef
ota
xim
e
Cef
oxi
tin
Cef
tazi
dim
e
Ch
lora
mp
hen
ico
l
Cip
rofl
oxa
cin
Co
list
in
Ert
apen
em
Gen
tam
icin
Imip
enem
Mer
op
enem
Nal
idix
ic a
cid
Su
lfam
eth
oxa
zole
Tem
oci
llin
Tetr
acyc
lin
e
Tig
ecyc
lin
e
Trim
eth
op
rim
12 ABM 1
11 ABM
5
3
1
1
10 ABM
3
2
2
1
1
1
1
9 ABM
3
3
2
1
1
1
1
1
8 ABM
8
4
3
1
1
1
1
1
1
1
7 ABM
6
1
1
1
1
1
1
1
1
6 ABM9
5
Table I. 45: Multiresistance patterns of suspected ESBL/AmpC-producing Escherichia coli from calves, 2017.

184 Annex: Distribution of minimal inhibitory concentrations (MICs) and resistance patterns in bacterial isolates from animals and meat
Nu
mb
er o
f res
iste
nce
s
Nu
mb
er o
f iso
late
s
Am
pic
illi
n
Azi
thro
myc
in
Cef
epim
e
Cef
ota
xim
e
Cef
oxi
tin
Cef
tazi
dim
e
Ch
lora
mp
hen
ico
l
Cip
rofl
oxa
cin
Co
list
in
Ert
apen
em
Gen
tam
icin
Imip
enem
Mer
op
enem
Nal
idix
ic a
cid
Su
lfam
eth
oxa
zole
Tem
oci
llin
Tetr
acyc
lin
e
Tig
ecyc
lin
e
Trim
eth
op
rim
5 ABM
1
1
1
1
1
4 ABM
3
3
1
1
3 ABM
1
1
1
1

Annex: Distribution of minimal inhibitory concentrations (MICs) and resistance patterns in bacterial isolates from animals and meat 185
Nu
mb
er o
f res
iste
nce
s
Nu
mb
er o
f iso
late
s
Am
pic
illi
n
Azi
thro
myc
in
Cef
ota
xim
e
Cef
tazi
dim
e
Ch
lora
mp
hen
ico
l
Cip
rofl
oxa
cin
Co
list
in
Gen
tam
icin
Mer
op
enem
Nal
idix
ic a
cid
Su
lfam
eth
oxa
zole
Tetr
acyc
lin
e
Tig
ecyc
lin
e
Trim
eth
op
rim
8 ABM 1
6 ABM 1
5 ABM3
1
4 ABM
4
2
2
1
1
1
3 ABM
5
3
3
3
1
1
2 ABM
6
5
4
1
1
1 ABM
23
13
1
0 ABM 110
Table I. 46: Multiresistance patterns of Escherichia coli from fattening pigs, 2017.

186 Annex: Distribution of minimal inhibitory concentrations (MICs) and resistance patterns in bacterial isolates from animals and meat
Table I. 47: Multiresistance patterns of suspected ESBL/AmpC-producing Escherichia coli from fattening pigs, 2017.
Nu
mb
er o
f res
iste
nce
s
Nu
mb
er o
f iso
late
s
Am
pic
illi
n
Azi
thro
myc
in
Cef
epim
e
Cef
ota
xim
e
Cef
oxi
tin
Cef
tazi
dim
e
Ch
lora
mp
hen
ico
l
Cip
rofl
oxa
cin
Co
list
in
Ert
apen
em
Gen
tam
icin
Imip
enem
Mer
op
enem
Nal
idix
ic a
cid
Su
lfam
eth
oxa
zole
Tem
oci
llin
Tetr
acyc
lin
e
Tig
ecyc
lin
e
Trim
eth
op
rim
12 ABM 1
11 ABM
2
1
1
10 ABM 1
9 ABM
1
1
1
1
8 ABM
1
1
1
7 ABM
4
3
1
1
1
1
6 ABM
7
1
1
5 ABM
2
2
1
1
1
1
1
1
1
4 ABM
3
3
1
1
3 ABM 2

Annex: Distribution of minimal inhibitory concentrations (MICs) and resistance patterns in bacterial isolates from animals and meat 187
Table I. 48: Multiresistance patterns of Methicillin-resistant Staphylococcus aureus from calves, 2017.
Table I. 49: Multiresistance patterns of Methicillin-resistant Staphylococcus aureus (MRSA) from fattening pigs, 2017.
Nu
mb
er o
f res
iste
nce
s
Nu
mb
er o
f iso
late
s
Cef
oxi
tin
Ch
lora
mp
hen
ico
l
Cip
rofl
oxa
cin
Cli
nd
amyc
in
Ery
thro
myc
in (E
ryth
rom
ycin
A)
Gen
tam
icin
Kan
amyc
in
Lin
ezo
lid
Mu
pir
oci
n
Pen
icil
lin
Qu
inu
pri
stin
/Dal
fop
rist
in
Rif
amp
icin
Str
epto
myc
in
Su
lfam
eth
oxa
zole
Tetr
acyc
lin
e
Tia
mu
lin
Trim
eth
op
rim
Van
com
ycin
10 ABM2
2
9 ABM 5
8 ABM 1
7 ABM2
1
6 ABM4
1
5 ABM2
2
4 ABM 2
Nu
mb
er o
f Res
iste
nce
s
Nu
mb
er o
f Iso
late
s
Cef
oxi
tin
Ch
lora
mp
hen
ico
l
Cip
rofl
oxa
cin
Cli
nd
amyc
in
Ery
thro
myc
in (E
ryth
rom
ycin
A)
Gen
tam
icin
Kan
amyc
in
Lin
ezo
lid
Mu
pir
oci
n
Pen
icil
lin
Qu
inu
pri
stin
/Dal
fop
rist
in
Rif
amp
icin
Str
epto
myc
in
Su
lfam
eth
oxa
zole
Tetr
acyc
lin
e
Tia
mu
lin
Trim
eth
op
rim
Van
com
ycin
14 ABM 1
13 ABM 2
10 ABM 2
9 ABM
34
3
2
8 ABM
18
2
1
7 ABM
2
1
1
1
6 ABM1
1
5 ABM
7
1
1
4 ABM
18
7
1
3 ABM 24

188 Annex: Distribution of minimal inhibitory concentrations (MICs) and resistance patterns in bacterial isolates from animals and meat
Table I. 50: Multiresistance patterns of suspected ESBL/AmpC-producing Escherichia coli from chicken meat, 2016.N
um
ber
of r
esis
ten
ces
Nu
mb
er o
f iso
late
s
Am
pic
illi
n
Azi
thro
myc
in
Cef
epim
e
Cef
ota
xim
e
Cef
oxi
tin
Cef
tazi
dim
e
Ch
lora
mp
hen
ico
l
Cip
rofl
oxa
cin
Co
list
in
Ert
apen
em
Gen
tam
icin
Imip
enem
Mer
op
enem
Nal
idix
ic a
cid
Su
lfam
eth
oxa
zole
Tem
oci
llin
Tetr
acyc
lin
e
Tig
ecyc
lin
e
Trim
eth
op
rim
11 ABM4
1
10 ABM
4
3
3
1
1
9 ABM
6
5
3
3
2
1
1
8 ABM
6
6
5
4
1
1
1
1
1
7 ABM
4
3
3
2
2
1
1
1
1
1
1
1
1
1
1
1

Annex: Distribution of minimal inhibitory concentrations (MICs) and resistance patterns in bacterial isolates from animals and meat 189
Nu
mb
er o
f res
iste
nce
s
Nu
mb
er o
f iso
late
s
Am
pic
illi
n
Azi
thro
myc
in
Cef
epim
e
Cef
ota
xim
e
Cef
oxi
tin
Cef
tazi
dim
e
Ch
lora
mp
hen
ico
l
Cip
rofl
oxa
cin
Co
list
in
Ert
apen
em
Gen
tam
icin
Imip
enem
Mer
op
enem
Nal
idix
ic a
cid
Su
lfam
eth
oxa
zole
Tem
oci
llin
Tetr
acyc
lin
e
Tig
ecyc
lin
e
Trim
eth
op
rim
6 ABM
7
7
5
1
1
1
5 ABM
12
4
2
2
1
4 ABM
5
3
1
1
3 ABM
4
2
1
Nu
mb
er o
f res
iste
nce
s
Nu
mb
er o
f iso
late
s
Am
pic
illi
n
Azi
thro
myc
in
Cef
epim
e
Cef
ota
xim
Cef
oxi
tin
Cef
tazi
dim
Ch
lora
mp
hen
ico
l
Cip
rofl
oxa
cin
Co
list
in
Ert
apen
em
Gen
tam
icin
Imip
enem
Mer
op
enem
Nal
idix
ic a
cid
Su
lfam
eth
oxa
zole
Tem
oci
llin
Tetr
acyc
lin
e
Tig
ecyc
lin
e
Trim
eth
op
rim
5 ABM
4 ABM
Nu
mb
er o
f res
iste
nce
s
Nu
mb
er o
f iso
late
s
Am
pic
illi
n
Azi
thro
myc
in
Cef
epim
e
Cef
ota
xim
Cef
oxi
tin
Cef
tazi
dim
Ch
lora
mp
hen
ico
l
Cip
rofl
oxa
cin
Co
list
in
Ert
apen
em
Gen
tam
icin
Imip
enem
Mer
op
enem
Nal
idix
ic a
cid
Su
lfam
eth
oxa
zole
Tem
oci
llin
Tetr
acyc
lin
e
Tig
ecyc
lin
e
Trim
eth
op
rim
11 ABM
Table I. 51: Multiresistance patterns of suspected ESBL/AmpC-producing Escherichia coli from beef, 2017.
Table I. 52: Multiresistance patterns of suspected ESBL/AmpC-producing Escherichia coli from pork meat, 2017.
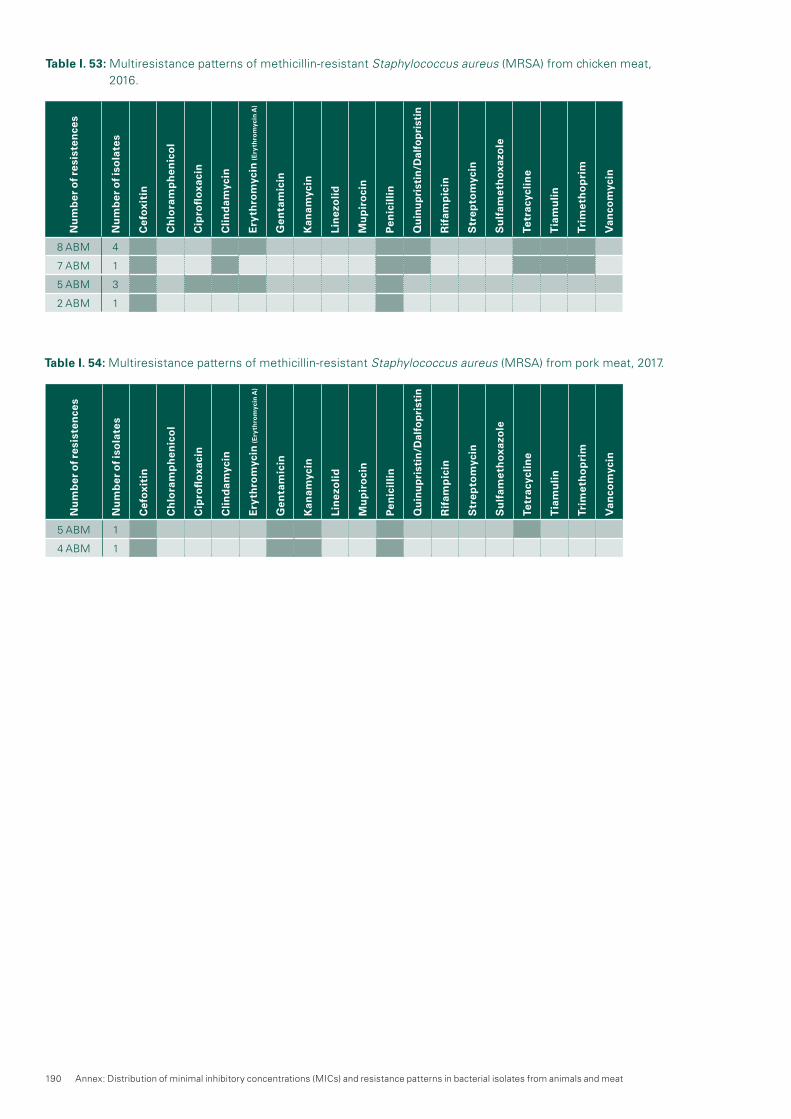
190 Annex: Distribution of minimal inhibitory concentrations (MICs) and resistance patterns in bacterial isolates from animals and meat
Table I. 53: Multiresistance patterns of methicillin-resistant Staphylococcus aureus (MRSA) from chicken meat, 2016.
Table I. 54: Multiresistance patterns of methicillin-resistant Staphylococcus aureus (MRSA) from pork meat, 2017.
Nu
mb
er o
f res
iste
nce
s
Nu
mb
er o
f iso
late
s
Cef
oxi
tin
Ch
lora
mp
hen
ico
l
Cip
rofl
oxa
cin
Cli
nd
amyc
in
Ery
thro
myc
in (E
ryth
rom
ycin
A)
Gen
tam
icin
Kan
amyc
in
Lin
ezo
lid
Mu
pir
oci
n
Pen
icil
lin
Qu
inu
pri
stin
/Dal
fop
rist
in
Rif
amp
icin
Str
epto
myc
in
Su
lfam
eth
oxa
zole
Tetr
acyc
lin
e
Tia
mu
lin
Trim
eth
op
rim
Van
com
ycin
8 ABM 4
7 ABM 1
5 ABM 3
2 ABM 1
Nu
mb
er o
f res
iste
nce
s
Nu
mb
er o
f iso
late
s
Cef
oxi
tin
Ch
lora
mp
hen
ico
l
Cip
rofl
oxa
cin
Cli
nd
amyc
in
Ery
thro
myc
in (E
ryth
rom
ycin
A)
Gen
tam
icin
Kan
amyc
in
Lin
ezo
lid
Mu
pir
oci
n
Pen
icil
lin
Qu
inu
pri
stin
/Dal
fop
rist
in
Rif
amp
icin
Str
epto
myc
in
Su
lfam
eth
oxa
zole
Tetr
acyc
lin
e
Tia
mu
lin
Trim
eth
op
rim
Van
com
ycin
5 ABM 1
4 ABM 1

IndexFigures, tables and textboxes

192 Index: Figures, tables and textboxes
Figures
pp.
36 Figure 5. a: Total antibiotic consumption (ATC group J01) expressed in DDDs per 100 bed-days (bars) and in DDDs per 100 admissions (dark line) in the hospitals and intensive care units contributing to anresis.ch over the period 2007–2017. The number of hospital net-works (or sites) contributing to anresis.ch is indicated in the corresponding bars.
37 Figure 5. b: Distribution of the total antibiotic consumption (ATC group J01) per antibiotic class in the inpatient setting in 2017 in Switzerland.
39 Figure 5. c: Consumption of antibiotics expressed in DDDs per 100 bed-days in hospitals contributing to anresis.ch in Switzerland (2007–2017).
42 Figure 5. d: Distribution of the total antibiotic consumption (ATC group J01) per antibiotic class in the outpatient setting in 2017 in Switzerland.
43 Figure 5. e: ESAC quality indicators for consumption of anti-bacterials for systemic use (ATC group J01) in the out-patient setting in Switzerland (2015–2017).
43 Figure 5. f: Total antibiotic consumption (ATC group J01) expressed in DDDs per 1,000 inhabitants per day by linguistic region in the outpatient setting in Switzerland (2015–2017).
44 Figure 5. g: Antibiotic classes per age group and overall as a proportion of the total consumption in the outpatient setting in Switzerland (2015–2017).
46 Figure 1: Antibiotic prescriptions 2017 by indication and anti-biotic group, expressed in number of prescriptions per 100,000 inhabitants.
50 Figure 6. a: Antimicrobial sales for livestock animals in the years 2008–2017 compared to the population biomass (total PCU) and the sales of active ingredients per PCU.
51 Figure 6. b: Sales of antimicrobials (in kg) licensed for in-tramammary use in 2008–2015 separated into dry cow products and products for use during lactation.
54 Figure 1: Concentration of the antibiotics sulfamethoxazole, ciprofloxacin, and clarithromycin in the effluent of a wastewater treatment plant (WWTP), in river water and in groundwater in a catchment of the canton of Zurich (detection limit 10 ng/L).
57 Figure 7. a: Comparison of non-susceptibility rates in invasive versus outpatient urinary samples in Escherichia coli isolates in humans for 2017.
57 Figure 7. b: Non-susceptibility rates in invasive Escherichia coli isolates in humans between 2008 and 2017.
58 Figure 7. c: Multiresistance in invasive E. coli isolates in humans between 2008 and 2017 (for details refer to table 7. b).
59 Figure 1: Number of carbapenemase-producing isolates per A) Enterobacteriaceae genus and B) genotypes.
61 Figure 7. d: Non-susceptibility rates in invasive Klebsiella pneumoniae isolates in humans 2008–2017.
62 Figure 7. e: Multiresistance in invasive K. pneumoniae isolates in humans from 2008–2017 (for details refer to Table 7. d).
64 Figure 7. f: Non-susceptibility rates of invasive Pseudomonas aeruginosa isolates in humans from 2008 to 2017.
65 Figure 7. g : Multiresistance in invasive Pseudomonas aeruginosa isolates in humans between 2008 and 2017 (for details refer to Table 7. f).
66 Figure 1: Acinetobacter resistance rates (number of resist-ant isolates compared to total number of isolates) per region from 2005 to 2016 in Switzerland. Standard deviation bars represent annual fluctuations per region. B) Map of the Swiss regions defined in this study.
67 Figure 7. h: Non-susceptibility rates of invasive Acinetobacter spp. isolates in humans between 2008 and 2017.
68 Figure 7. i: Multiresistance in invasive Acinetobacter spp. isolates in humans between 2008 and 2017 (for details refer to Table 7. h).
69 Figure 7. j: Non-susceptibility rates in invasive PSSP (penicil-lin-susceptible isolates) and PNSP (penicillin non-sus-ceptible isolates) in humans in 2017.
69 Figure 7. k: Non-susceptibility rates of invasive Streptococcus pneumoniae isolates in humans between 2008 and 2017.
70 Figure 7. l: Non-susceptibility rates of invasive Enterococcus faecalis and Enterococcus faecium isolates in humans between 2008 and 2017.
72 Figure 7. m: Comparison of non-susceptibility rates in inva-sive versus outpatient wound/abscess samples in Staphylococcus aureus in humans in 2017.
73 Figure 7. n: Non-susceptibility rates of invasive MRSA (methi-cillin-resistant Staphylococcus aureus) and MSSA (methicillin-susceptible Staphylococcus aureus) iso-lates in humans 2017.
73 Figure 7. o: Non-susceptibility rates of invasive Staphylococcus aureus isolates in humans between 2008 and 2017.
76 Figure 1: Sources of antibiotics and antibiotic-resistant bac-teria and potential distribution in aquatic environments.
82 Figure 8. a: Trends in resistance to fluoroquinolones and macrolides in Campylobacter coli and Campylobacter jejuni from human clinical isolates in Switzerland be-tween 2008 and 2017.
83 Figure 8. b: Trends in ciprofloxacin, erythromycin, gen-tamicin, streptomycin and tetracycline resistance in C. jejuni from broilers between 2008 and 2016 (N = total number of tested isolates; values for 2015 inter-polated [n/a]).
84 Figure 8. c: Trends in ciprofloxacin, erythromycin, gen-tamicin, streptomycin and tetracycline resistance in C. coli from fattening pigs between 2008 and 2017 (N = total number of tested isolates; values for 2008, 2014 and 2016 interpolated [n/a]).
90 Figure 8. d: Trends in aminopenicillin, ceftriaxone, trimetho-prim-sulfamethoxazole and fluoroquinolone resistance in non-typhoidal Salmonella from human clinical iso-lates between 2008 and 2017.
91 Figure 8. e: Trends in ampicillin, chloramphenicol, ciprofloxa-cin, colistin, sulfamethoxazole and tetracycline resist-ance in Salmonella spp. from poultry, pigs and cattle between 2010 and 2017 (N = total number of tested isolates).
95 Figure 1: Pathogen surveillance using molecular typing data. (A) The Nextstrain tool (www.nextstrain.org) offers phylogenetic trees of multiple pathogens. e.g. Ebola virus outbreak in West Africa. Colors represent differ-ent geographic regions. The x-axis reflects a time scale during the outbreak.
95 Figure 2: Envisioned workflow for the surveillance platform. After isolating a strain, collecting epidemiological data and sequencing it, the user uploads raw data and metadata into a central or local/private database using the submission portal. After submission, these data are quality controlled and then (semi-)automatically processed to perform tasks such as genome assem-bly, and MLST, SNP and resistance calling. The result-ing data are used for phylogenetics and predictive modelling, e.g. transmission dynamics. All these data are stored in a structured database with controlled access, and visualized in a user-friendly interface. For open data, the structured database may also be used/queried by other applications or pushed to external databases and knowledge bases. In addition to the submission portal, an administration portal to manage users and rights, as well as a curating portal to edit

Index: Figures, tables and textboxes 193
controlled vocabularies and define curated reference strains and variants (e.g. for resistance) will be devel-oped.
100 Figure 9. a: Trends in ampicillin, chloramphenicol, erythromy-cin, gentamicin, tetracycline and vancomycin resist-ance in Enterococcus faecalis from broilers between 2008 and 2016 (N = total number of tested isolates; values for 2015 interpolated [n/a]).
101 Figure 9. b: Trends in ampicillin, erythromycin, quinupristin/dalfopristin, tetracycline and vancomycin resistance in Enterococcus faecium from broilers between 2008 and 2016 (N = total number of tested isolates; values for 2015 interpolated [n/a])
102 Figure 9. c: Trends in ampicillin, chloramphenicol, erythromy-cin, gentamicin, tetracycline and vancomycin resist-ance in Enterococcus faecalis from slaughter calves between 2008 and 2016 (N = total number of tested isolates; values for 2008, 2009, 2011, 2012, 2014 and 2016 interpolated [n/a]).
102 Figure 9. d: Trends in ampicillin, erythromycin, quinupristin/dalfopristin, tetracycline and vancomycin resistance in Enterococcus faecium from slaughter calves between 2008 and 2016 (N = total number of tested isolates; values for 2008, 2009, 2011, 2012, 2014 and 2016 inter-polated [n/a]).
106 Figure 9. e: Trends in ampicillin, ciprofloxacin, gentamicin, sulfamethoxazole and tetracycline resistance in Escherichia coli from broilers between 2008 and 2016 (N = total number of tested isolates, values for 2015 interpolated [n/a]).
106 Figure 9. f: Trends in ampicillin, ciprofloxacin, gentamicin, sulfamethoxazole and tetracycline resistance in Escherichia coli from fattening pigs between 2008 and 2017 (N = total number of tested isolates, values for 2008, 2014 and 2016 interpolated [n/a]).
107 Figure 9. g: Trends in ampicillin, ciprofloxacin, gentamicin, sulfamethoxazole and tetracycline resistance in Escherichia coli from slaughter calves between 2008 and 2017 (N = total number of tested isolates, values for 2008, 2009, 2011, 2012, 2014 and 2016 interpolated [n/a]).
113 Figure 9. h: Number of MRSA genotypes from fattening pigs between 2009 and 2017.
134 Figure 12. a: Longitudinal Study Extrapolation of veterinary antibiotic sales (2008–2017).
135 Figure 12. b: Association between the use of tetracyclines in pigs and the resistance levels in (A) E. coli (p = 0.07) and (B) Campylobacter coli (p < 0.05, but the data has a poor model fit).
135 Figure 12. c: Human antibiotic consumption in mg per kg of biomass (mg/BM) in Switzerland (2015–2017).
136 Figure 12. d: Association between (A) the inpatient use of 3rd and 4th generation cephalosporins and the occur-rence of cefotaxime resistance in inpatients (p < 0.05); (B) the use of quinolones in inpatients and the occur-rence of ciprofloxacin resistance (p < 0.05), in blood E. coli isolates in hospitalized patients.
136 Figure 12. e: Antibiotic consumption in livestock and humans in mg of active ingredient per kg of biomass (mg/BM) for the time period between 2015 and 2017.
138 Figure 12.2 a: MRSA prevalence in Swiss livestock between 2009 and 2017.
139 Figure 12.2 b: MRSA prevalence in fresh meat between 2014 and 2017.
140 Figure 12.2 c: MRSA types from humans, animals and meat in 2016/2017.
Tables
pp.
37 Table 5. a: Antibiotic consumption according to the AWaRe categorization of the WHO in the inpatient setting, Switzerland (2015–2017).
38 Table 5. b: Consumption of antibiotic classes expressed in DDDs per 100 bed-days in hospitals contributing to anresis.ch in Switzerland (2007–2017).
41 Table 5. c: Consumption of antibiotic classes expressed in DDDs per 1,000 inhabitants per day in the outpatient setting in Switzerland (2015–2017).
41 Table 5. d: Antibiotic consumption according to the AWaRe categorization of the WHO in the outpatient setting in Switzerland (2015–2017).
48 Table 6. a: Sales of antibiotic classes between 2008 and 2017.
48 Table 6. b: Sales of antimicrobials according to the adminis-tration route in 2008–2017.
49 Table 6. c: Sales of different antibiotic classes licensed for livestock animals between 2008 and 2017.
50 Table 6. d: Sales of antimicrobials licensed as premixes from 2008 to 2017, according to antibiotic class.
51 Table 6. e: Sales of antimicrobials licensed for intramammary use in 2008–2017 according to antibiotic class.
52 Table 6. f: Sales of antibiotic classes licensed for companion animals in 2008–2017.
56 Table 7. a: Non-susceptibility rates of invasive Escherichia coli isolates in humans for 2017.
58 Table 7. b: Non-susceptibility combinations in invasive E. coli isolates in humans 2017. Only isolates tested against all five antibiotic groups (aminopenicillins, third-genera-tion cephalosporins, carbapenems, aminoglycosides, fluoroquinolones) were considered (n=5119/5405 [94.7 %]).
61 Table 7. c: Non-susceptibility rates of invasive Klebsiella pneumoniae isolates in humans in 2017.
62 Table 7. d: Non-susceptibility combinations in invasive K. pneumoniae isolates in humans in 2017. Only isolates tested against all four antibiotic groups (third-genera-tion cephalosporins, carbapenems, aminoglycosides, fluoroquinolones) were considered (n=959/964 [99.5 %]).
63 Table 7. e: Susceptibility rates of invasive Pseudomonas aeruginosa isolates in humans 2017.
64 Table 7. f: Non-susceptibility combinations in invasive P. aeruginosa isolates in humans in 2017. Only isolates tested against all five antibiotics or antibiotic groups (piperacillin-tazobactam, cefepime, carbapenems, aminoglycosides, ciprofloxacin) were considered (n=501/536 [93.5 %]).
65 Table 7. g: Non-susceptibility rates of invasive Acinetobacter spp. isolates in humans for 2017. Due to small num-bers, non-susceptibility rates for southern Switzerland are not shown.
67 Table 7. h: Non-susceptibility combinations in invasive Acinetobacter spp. isolates in humans in 2017. Only isolates tested against all three antibiotic groups (aminoglyco-sides, ciprofloxacin and carbapenems) were consid-ered (n=90/93 [96.8 %]).
68 Table 7. i: Non-susceptibility rates of invasive Streptococcus pneumoniae isolates in humans in 2017.
70 Table 7. j: Non-susceptibility rates of invasive Enterococcus faecalis and Enterococcus faecium isolates in humans in 2017.
72 Table 7. k: Susceptibility rates of invasive Staphylococcus aureus isolates in humans in 2017.

194 Index: Figures, tables and textboxes
129 Table 11. f: MIC90 rates of Streptococcus equi subspecies zooepidemicus isolates in horses in 2016/2017.
130 Table 11. g: Susceptibility rates of E. coli isolates in dogs.130 Table 11. h: MIC90 of E. coli isolates in dogs in 2016/17.141 Table 12.2.1: Detection of MRSA in nasal swabs from Swiss
veterinarians in 2017.148 Table 13. a: Antimicrobial-resistance-monitoring program in
2016.148 Table 13. b: Antimicrobial-resistance-monitoring program in
2017.150 Table 13. c: Epidemiological cutoff values used for the inter-
pretation of MIC data derived from isolates in samples from healthy animals at slaughterhouse and meat there-of (including Salmonella spp. from clinical samples)
Textboxes
pp.
46 Textbox: Antibiotic Prescriptions in Outpatient Medical Care53 Textbox: Antibiotic Substances in the Water Cycle59 Textbox: Temporal and Regional Prevalence of Carbapene-
mase-Producing Enterobacteriaceae from 2013 to 2017 in Switzerland
60 Textbox: The National Reference Center for Emerging Antibiotic Resistance (NARA)
66 Textbox: Carbapenem-Resistant Acinetobacter baumannii from 2005 to 2016 in Switzerland
75 Textbox: Treatment of the Tree Disease Fire Blight with Antibiotics
76 Textbox: Antibacterial Resistance in the Aquatic Environment85 Textbox: Persistence of Quinolone and Tetracycline Resis-
tance in Thermophilic Campylobacter from Poultry93 Textbox: Modern Microbiological Surveillance for Antibiotic
Drug Resistance115 Textbox: Mcr1-Based Colistin Resistance: Filling Knowledge
Gaps in View of the Spread of Plasmid-Mediated Colis-tin Resistance in Switzerland
80 Table 8. a: Campylobacter jejuni and Campylobacter coli from broilers in 2016.
81 Table 8. b: Campylobacter coli from fattening pigs in 2017.82 Table 8. c: Non-susceptibility rates of Campylobacter coli and
Campylobacter jejuni from human clinical isolates in 2017.
86 Table 8. d: Non-susceptibility rates of Salmonella from hu-man clinical isolates in 2017.
87 Table 8. e: Occurrence of resistance in Salmonella spp., Salmonella Typhimurium and its monophasic variant from poultry in 2016.
88 Table 8. f: Occurrence of resistance in Salmonella spp., Salmonella Typhimurium and its monophasic variant from cattle in 2016.
89 Table 8. g: Occurrence of resistance in Salmonella spp., Salmonella Typhimurium and its monophasic variant from poultry in 2017.
90 Table 8. h: Occurrence of resistance in Salmonella spp., Salmonella Typhimurium and its monophasic variant from cattle in 2017.
91 Table 8. i: Occurrence of resistance in Salmonella spp. and monophasic Salmonella Typhimurium from fattening pigs in 2017.
98 Table 9. a: Occurrence of resistance in Enterococcus faecalis and Enterococcus faecium from broilers in 2016.
99 Table 9. b: Occurrence of resistance in Enterococcus faecalis and Enterococcus faecium from slaughter calves in 2017.
103 Table 9. d: Occurrence of resistance in Escherichia coli from broilers in 2016.
104 Table 9. e: Occurrence of resistance in Escherichia coli from fattening pigs in 2017.
105 Table 9. f: Occurrence of resistance in Escherichia coli from slaughter calves in 2017.
108 Table 9. g: Occurrence of resistance in ESBL/pAmpC-pro-ducing Escherichia coli from broilers in 2016.
109 Table 9. h: Occurrence of resistance in ESBL/pAmpC-pro-ducing Escherichia coli from fattening pigs in 2017.
110 Table 9. i: Occurrence of resistance in ESBL/pAmpC-produc-ing Escherichia coli from slaughter calves in 2017.
111 Table 9. j: Occurrence of resistance in MRSA from fattening pigs in 2017.
112 Table 9. k: Occurrence of resistance in MRSA from slaughter calves in 2017.
115 Table 1: Overview and key characteristics of sequenced mcr1-harboring plasmids from strains of different origins isolated in Switzerland
119 Table 10. a: Number of samples and number of ESBL/pAm-pC-producing Escherichia coli positive samples by origin of chicken meat for 2016
119 Table 10. b: Occurrence of resistance of ESBL/pAmpC-pro-ducing Escherichia coli from chicken meat in 2016.
120 Table 10. c: Occurrence of resistance in ESBL/pAmpC-pro-ducing Escherichia coli from pork meat in 2017.
121 Table 10. d: Occurrence of resistance in ESBL/pAmpC-pro-ducing Escherichia coli from beef in 2017.
122 Table 10. e: Occurrence of MRSA from chicken meat in 2016.123 Table 10. f: Occurrence of MRSA from pork meat in 2017.124 Table 10. g: Number of samples and number of MRSA-posi-
tive samples by origin of chicken meat in 2016.126 Table 11. a: Susceptibility rates of Staphylococcus pseudin
termedius isolates in dogs.127 Table 11. b: MIC90 rates of Staphylococcus pseudintermedius
isolates in dogs in 2016/2017.128 Table 11. c: Susceptibility rates of Staphylococcus aureus
isolates in bovine mastitis in 2016/2017.128 Table 11. d: MIC90 rates of Staphylococcus aureus isolates in
bovine mastitis in 2016/2017.129 Table 11. e: Susceptibility rates of Streptococcus equi sub-
species zooepidemicus isolates in horses.
