usaid partnership for education: learning language mapping
TRANSCRIPT

March 2018
This publication was produced at the request of the United States Agency for International Development. It was
prepared independently by Rachel Hatch, Yvonne Cao, Dr. Carina Omoeva, Dr. Julia Frazier, and Dr. Wael Moussa
from FHI 360 and Samuel Awinkene Atintono, Avea Ephraim Nsoh, and Charles Owu-Ewie from the College of
Languages Education, Ajumako at the University of Education, Winneba.
USAID Partnership for Education: Learning
LANGUAGE MAPPING STUDY:
ANALYSIS REPORT

LANGUAGE MAPPING STUDY:
ANALYSIS REPORT
USAID PARTNERSHIP FOR EDUCATION: LEARNING
March 2018
Agreement Number: AID-641-A-15-00004
Agreement Period: 12-14, 2014 to 12-12, 2019
AOR Name: Adama Jehanfo
Submitted by: Guitele Nicoleau, Chief of Party
FHI360
2nd Floor, Omanye Aba House, NDK Building, Opposite
Accra Sports Stadium P.O. Box CT 4033|Accra, GHANA
Tel: Cell: 050 141 9988, Office:
0302.769963/740780/774910|
Fax: 0302.740809
Email: [email protected]
This document was produced for review and approval by the United
States Agency for International Development/Ghana (USAID/Ghana).
DISCLAIMER
The authors’ views expressed in this publication do not necessarily reflect the views of the United
States Agency for International Development or the United States Government.

CONTENTS ACKNOWLEDGMENTS........................................................................................................................... i
ACRONYMS ................................................................................................................................................ ii
EXECUTIVE SUMMARY .......................................................................................................................... 1
A. Introduction .................................................................................................................................... 1
B. Background...................................................................................................................................... 1
C. Project Background ....................................................................................................................... 2
D. Study Design ................................................................................................................................... 2
E. Key Findings .................................................................................................................................... 3
Pupil level language match .............................................................................................................. 4
Teacher level language match ........................................................................................................ 5
Combining pupil and teacher language match ............................................................................ 6
Teaching and learning materials .................................................................................................... 8
F. Conclusions and Recommendations.......................................................................................... 8
BACKGROUND ..................................................................................................................................... 10
A. Project Overview ......................................................................................................................... 10
B. The Language Policy in Ghana .................................................................................................. 10
STUDY DESIGN AND METHODOLOGY ....................................................................................... 12
A. Study Objectives and Analytical Framework ......................................................................... 12
Study Objectives ............................................................................................................................. 12
Study Questions .............................................................................................................................. 12
B. Study Design and Data Collection ........................................................................................... 13
Instruments ...................................................................................................................................... 13
District Selection ............................................................................................................................ 14
Data Collection ............................................................................................................................... 15
C. Limitations ..................................................................................................................................... 16
FINDINGS ................................................................................................................................................. 18
A. Pupil language match findings .................................................................................................... 18
Why focus on home language? .................................................................................................... 18
What proportion of pupils speak the approved GLOI at their schools across the 100
districts in the study? ..................................................................................................................... 19
How does pupil language match vary by GLOI and region? ................................................. 20
How do the proportions of schools with no pupils who speak the GLOI vary by GLOI
and region? ....................................................................................................................................... 21

How do the proportions of schools where all KG1-P3 pupils speak the GLOI vary by
GLOI and region? ........................................................................................................................... 22
How linguistically diverse are KG1-P3 pupil populations at schools? ................................. 23
B. Teacher language match findings .............................................................................................. 25
What proportion of KG1-P3 teachers speak the approved GLOI at their schools across
the 100 districts in the study? ...................................................................................................... 25
How does teacher language match vary by GLOI and region? ............................................ 26
How do the proportions of schools with no KG1-P3 teachers who speak the GLOI vary
by GLOI and region? ...................................................................................................................... 27
How do the proportions of schools where all KG1-P3 teachers speak the GLOI vary by
GLOI and region? ........................................................................................................................... 27
C. Overall language match findings ............................................................................................... 29
Applying the Language Match Framework ................................................................................ 30
How does overall language match vary by GLOI and region? .............................................. 31
How do the proportions of schools with no KG1-P3 pupils and no KG1-P3 teachers who
speak the GLOI vary by GLOI and region? .............................................................................. 35
How do the proportions of schools where all pupils and all KG1-P3 teachers speak the
GLOI vary by GLOI and region? ................................................................................................. 35
D. Availability of teaching and learning materials In GLOI ....................................................... 36
CONCLUSIONS AND RECOMMENDATIONS ............................................................................ 38
REFERENCES ............................................................................................................................................ 41
Annex I: Additional Analyses ................................................................................................................ 42
A. GLOI in Learning districts ........................................................................................................... 42
B. Linguistic diversity in KG1-P3 classrooms ............................................................................. 42
C. School language match scatterplots by region and GLOI ................................................... 43
D. Language Match Index ................................................................................................................. 45
Language Match Index construction ........................................................................................... 45
E. Availability of TLM in GLOI ....................................................................................................... 50
ANNEX II: Recommendations Table .................................................................................................. 52
ANNEX III: Data Collection Instruments .......................................................................................... 55
LIST OF TABLES
Table 1. The School Language Match Framework .............................................................................................. 6
Table 2. Number and proportion of schools in each school language match category ............................ 7
Table 3. Language mapping instruments .............................................................................................................. 13
Table 4. GLOI represented in each region ......................................................................................................... 14
Table 5. Number of interviews conducted ......................................................................................................... 15
Table 6. School coverage by questionnaire type (% of overall schools) ...................................................... 16
Table 7. The Language Match Framework .......................................................................................................... 30
Table 8. Overall language match (% of schools), based on study districts .................................................. 31
Table 9. Questions included in the calculation of language match sub-indices .......................................... 46
Table 10. District-level Language Match Index results .................................................................................... 47
Table 11. Availability of reading program materials in the GLOI, by GLOI ............................................... 50
Table 12. Availability of reading program materials in the GLOI, by region .............................................. 51
Table 13. Summary of policy and practice recommendations to address different types of language
match and mismatch ................................................................................................................................................ 52
LIST OF FIGURES
Figure 1. Pupil language match (% of schools), based on study districts ....................................................... 4
Figure 2. Number of languages spoken by KG1-P3 pupils in schools (% of schools), based on study
districts .......................................................................................................................................................................... 5
Figure 3. Teacher language match (% of schools), based on study districts ................................................. 6
Figure 4. School language match (% of schools) .................................................................................................. 8
Figure 5. Map of the 100 districts targeted by Learning .................................................................................. 14
Figure 6. Pupil language match (% of schools), based on study districts ..................................................... 19
Figure 7. Pupil language match (KG1-P3 pupils) by GLOI and region (% of schools), based on study
districts ........................................................................................................................................................................ 20
Figure 8. Proportion of schools with no KG1-P3 pupils who speak the GLOI, by GLOI and region,
based on study districts ........................................................................................................................................... 21
Figure 9. Proportion of schools where all KG1-P3 pupils speak the GLOI, by GLOI and region, based
on study districts ...................................................................................................................................................... 22
Figure 10. Number of languages spoken by KG1-P3 pupils in schools (% of schools), based on study
districts ........................................................................................................................................................................ 23
Figure 11. Teacher language match (% of schools), based on study districts ............................................. 25
Figure 12. Teacher language match by GLOI and region (% of schools), based on study districts ...... 26
Figure 13. Proportion of schools with no KG1-P3 teachers who speak the GLOI, by GLOI and region,
based on study districts ........................................................................................................................................... 27
Figure 14. Proportion of schools where all KG1-P3 teachers speak the GLOI, by GLOI and region,
based on study districts ........................................................................................................................................... 28
Figure 15. School language match (% of schools) .............................................................................................. 31
Figure 16. Overall language match by GLOI and region (% of schools), based on study districts ........ 32
Figure 17. Higher, medium, and lower match schools across 100 districts in Ghana ............................. 34
Figure 18. Proportion of schools with no KG1-P3 pupils and no KG1-P3 teachers who speak the
GLOI, by GLOI and region, based on study districts ...................................................................................... 35
Figure 19. Proportion of schools where all KG1-P3 pupils and KG1-P3 teachers speak the GLOI, by
GLOI and region, based on study districts ......................................................................................................... 36
Figure 20. Map of GLOI across Learning districts ............................................................................................ 42

Figure 21. Number of languages spoken by KG1-P3 pupils in classrooms (% of classrooms), based on
study districts ............................................................................................................................................................. 43
Figure 22. Scatterplots of pupil and teacher match, by region ...................................................................... 44
Figure 23. Scatterplots of pupil and teacher match, by GLOI........................................................................ 45
Figure 24. Teacher, Pupil, and TLM sub-index scores: higher on teacher and pupil match, low on TLM
match ........................................................................................................................................................................... 47

ACKNOWLEDGMENTS
The authors of this report would like to thank the following reviewers who provided
invaluable feedback, including: Dr. Barbara Trudell, Director of Research and Advocacy at SIL
Africa; Dr Stephen Adu, Technical Advisor at FHI 360 and former Deputy Director General
at the Ghana Education Service; John Gillies, Director of Global Learning Business Unit at FHI
360; Emily Koester and Sarah Strader, Literacy Specialists at FHI 360; Dr. Johnson Odharo,
Learning Deputy Chief of Party, and Dr. Guitele Nicoleau, Learning Chief of Party. The authors
are also indebted to Dr. Paul Opoku-Mensah, Executive Director of the Ghana Institute of
Linguistics, Literacy and Bible Translation (GILLBT), for his contributions.
This report would not have been possible without the close collaboration of the College of
Languages Education, Ajumako at the University of Education, Winneba, and the efforts of
more than 100 enumerators who collected data in more than 7,000 schools across all 10
regions of Ghana.
Finally, the authors would like to thank USAID/ Ghana, in particular Dr. James Dobson,
Education Director, USAID/Ghana, for his careful reading of and feedback on previous versions of the document.

ACRONYMS
CPD
EMIS
Continuous Professional Development
Education Management Information System
GES
GLOI
GOG
KG1
KG2
L1
L2
LMI
Ghana Education Service
Ghanaian Language of Instruction
Government of Ghana
Kindergarten 1
Kindergarten 2
First Language
Second Language
Language Match Index
LMF Language Match Framework
LPIE
LPWG
MOE
NaCCA
ODK
P1
P2
P3
SBI
Language Policy in Education
Language Policy Working Group
Ministry of Education
National Council for Curriculum and Assessment
Open Data Kit
Primary 1
Primary 2
Primary 3
School-Based Inset
TLM
TTC
Teaching and Learning Materials
Teacher Training College
UEW University of Education, Winneba
USAID United States Agency for International Development

1
EXECUTIVE SUMMARY A. INTRODUCTION
This report presents the results of a linguistic mapping study in 100 districts across Ghana,
conducted by the USAID Partnership for Education: Learning activity (Learning) in
collaboration with the College of Languages Education, Ajumako, of the University of
Education, Winneba (UEW). The study, which is a census of schools in the selected districts,
provides an in-depth context analysis for the implementation of the 2016 Draft Ghana
Language Policy in Education (LPIE), which designates a Ghanaian Language of Instruction
(GLOI) to each school.
The linguistic diversity of the country with over 80 languages and dialects spoken across its
216 Districts creates natural challenges in the implementation of an 11-language GLOI policy
framework. It is, therefore, important to have the depth and breadth of understanding of this
diversity to ensure that for every school, there are appropriate teacher deployment and
support mechanisms, and teaching and learning materials to ensure the success of every child,
regardless of his or her home language. This study intends to provide the necessary foundation
for establishing a greater understanding of the linguistic landscape in 100 districts and to contribute to and inform the revision of the 2016 Draft LPIE. This report is a starting point
for continued refinement in language mapping and empirical analysis of the language match
between teachers’ and pupils’ language with the approved GLOI of the school, and pupil
outcomes in reading.
B. BACKGROUND
Research has shown that children learn to read best in a language they speak and understand
(see Nsoh et al. 2001; Owu-Ewie 2013; Nsoh and Ababila 2013; Trudell 2016). Ghana was
among the first countries in sub-Saharan Africa to recognize this by approving 11 Ghanaian
languages (out of the over 80 languages spoken in the country) to be used as languages of
instruction alongside English.
An MOE policy directive in 2007 re-affirmed commitment to this bilingual system, yet
implementation of the policy faced several challenges. These included the lack of data on the
linguistic environment of schools, teacher knowledge and competency in these languages, and
the learners’ linguistic backgrounds. Furthermore, the lack of human and material resources
to support instruction in 11 languages resulted in the mismatch of teacher posting with the
linguistic conditions in schools. Finally, the absence of a legal basis for the policy also proved
to be a barrier.1
As part of its scope, Learning worked with the National Council for Curriculum and
Assessment (NaCCA) under the MOE, through the Language Policy Working Group (LPWG),
to draft a revised LPIE in 2016. This draft policy document includes a review of language policy
development from prior to independence to the present day and discusses the policy
implementation challenges noted above.
The LPWG observed that three of the biggest implementation challenges of the 2007 policy
1 Owu-Ewie, C., & Eshun, E.S., Language representation in the Ghanaian Lower primary (schools) classroom: The case
of some schools in the Central and Western Regions of Ghana. Ghana: Accra; Manuscript shared by author, 2018.

2
directive were: 1) the lack of instructional materials in the GLOI; 2) the large number of
approved Ghanaian languages, and 3) a mismatch of teacher language to school language during
the deployment process. The LPWG recommended that Learning support the conduct of a
language mapping exercise to provide data on the language situation in schools in the targeted
districts in order to inform the revision of the language policy and to develop appropriate
teaching and learning materials and strategies to improve reading performance in the early
grades using the Ghanaian languages of instruction.
C. PROJECT BACKGROUND
The USAID Partnership for Education: Learning Activity is a $71 million, five-year project that
supports the MOE and GES to improve reading performance in public primary schools in
Ghana. Learning’s EGR program seeks to improve reading and learning outcomes for an
estimated 1.1 million pupils in KG2-P2 through a systematic phonics-based approach to
reading in all 11 approved GLOI using scripted lesson plans and supplementary teaching and
learning materials developed by Learning. The EGR program is implemented in over 7,000 primary schools in 100 target districts in all 10 regions of the country. It aims to build the
capacity of over 2,000 national and district-level trainers and 30,000 KG2-P2 teachers,
Headteachers and Curriculum Leads to teach reading using Learning’s teaching and learning
materials. The Learning activity also includes a small math pilot, which tests innovative teaching
and learning approaches to improve early grade math skills. The Learning activity includes a
robust monitoring, evaluation, and learning system which, among other activities, conducts
regular monitoring to gauge the fidelity of implementation, or the extent to which the
implementation adheres to design, at the classroom and school levels.
The results of the language mapping study, captured in this report, provide insights into the
socio-linguistic composition of Ghanaian schools, allowing Learning to develop appropriate
instructional materials for teaching reading and in-service training activities for teachers of
KG2-P2 grades. It is hoped that this information, combined with training and instructional
materials, will help ensure that all Ghanaian children demonstrate improved reading outcomes
by the end of P2.
D. STUDY DESIGN
This language mapping study is a descriptive analysis of the linguistic context at the school,
teacher, and pupil levels in all schools targeted by Learning. The study has the following two
objectives:
1. To generate empirical data on the language context in Ghana’s schools and the level
of its alignment with the assigned GLOI;
2. To inform the finalization and subsequent implementation of the 2016 Draft LPIE,
supporting the creation of equitable opportunities for reading acquisition by all
children in Ghana.
It seeks to answer the following key question:
To what extent does the designation of the Ghanaian Language of Instruction
reflect the language environment of Ghanaian schools, as demonstrated by the
languages spoken by pupils, teachers, and used in teaching and learning materials?
To answer this overarching question, the study aims to address the following sub-questions:

3
1. To what extent do languages KG1-P3 pupils2 speak at home align with the GLOI of
their schools, i.e., how robust is pupil language match at schools?
2. To what extent do the languages KG1-P3 teachers speak align with the GLOI of their
schools, i.e, how robust is teacher language match at schools?
3. To what extent do both pupil and teacher languages align with the GLOI of their
schools, i.e., how robust is overall language match?
4. How widely available are TLM in the GLOI of schools?
This study is a census of all schools in the 100 districts that were selected for Learning project
implementation, corresponding to 7,105 schools at the time of data collection. These districts
were selected in early 2016 in collaboration with MOE/GES, based on District Education
Offices’ estimate of where 90% or more of pupils spoke the GLOI. This selection was
conducted before the language mapping study was completed, since certain project activities
were dependent on this district selection and could not be delayed until study completion. It
is important to note that the 100 districts are not a representative sample of all districts in
Ghana.
To conduct the study, the Learning team in collaboration with the College of Languages
Education—UEW, developed three data collection instruments: (1) a teacher questionnaire,
(2) a Headteacher questionnaire, and (3) a pupil questionnaire. The data collection was
conducted in three rounds from December 2016 to April 2017, with a comprehensive training
of enumerators preceding each round. Analysis showed that while there were slight
differences between the rounds, they did not affect the quality of the data, with minor
exclusions noted in the relevant figures. In this report, the report presents the key findings
for each of the research questions, breaking results down by GLOI and region.
Data from the three instruments were aggregated into a single database with Headteacher,
teacher, and pupil data, all linked at the school level. Each of the sources were matched with
the designated GLOI, to obtain the proportion of teachers and pupils at schools who reported
speaking the GLOI. The results of the mapping, as well as other key findings, are summarized
below.
E. KEY FINDINGS
This report examines the extent to which the languages spoken in school communities align
with the official Ghanaian languages of instruction (GLOI) in schools. The evaluation team
used the GLOI of the school as the anchor against which the languages spoken by teachers
and students are matched. First, the report looks at agreement between the home languages
of pupils and the GLOI of their school. Then, it turns to agreement between the languages
spoken by teachers and the GLOI of their school. The report then considers alignment of
both pupil and teacher languages with the GLOI, presenting a typology of school language
match conditions and the percentage of schools experiencing each condition. Finally, the
report looks at the availability of GLOI teaching and learning materials in schools. It concludes
with recommendations that address different types of language match challenges.
2 The survey questions were drafted and the research began prior to the redesign, when Learning activity covered KG1-P3. Learning was
subsequently reoriented to focus on grades KG1-P2.
4
Pupil level language match
What proportion of pupils speak the approved GLOI at their schools?
The report defines three levels of pupil language match in schools: high, medium, and low
pupil language match. Under this definition, high pupil language match occurs when at least
80% of pupils in the school speak the approved GLOI of the school; medium pupil language
match occurs when 60-80% of pupils in the school speak the approved GLOI of the school;
and low pupil language match occurs when fewer than 60% of pupils in the school speak the
approved GLOI of the school. Because this full mapping exercise does not have precedent, the report uses arbitrary cutoff points for this classification, and Learning will revisit this once
more empirical data are available between the level of match and pupil reading outcomes. The
report counts pupils as speaking the GLOI when they reported using it as their “home
language.”
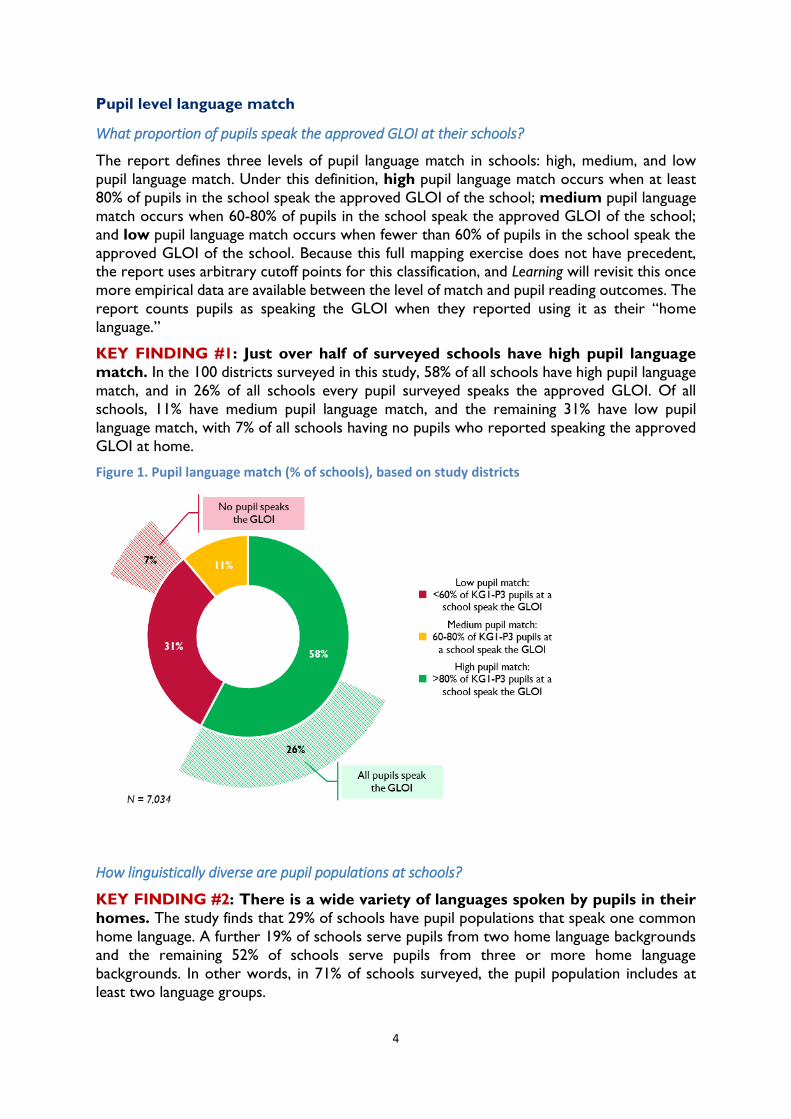
KEY FINDING #1: Just over half of surveyed schools have high pupil language
match. In the 100 districts surveyed in this study, 58% of all schools have high pupil language
match, and in 26% of all schools every pupil surveyed speaks the approved GLOI. Of all
schools, 11% have medium pupil language match, and the remaining 31% have low pupil
language match, with 7% of all schools having no pupils who reported speaking the approved
GLOI at home.
Figure 1. Pupil language match (% of schools), based on study districts
How linguistically diverse are pupil populations at schools?
KEY FINDING #2: There is a wide variety of languages spoken by pupils in their
homes. The study finds that 29% of schools have pupil populations that speak one common
home language. A further 19% of schools serve pupils from two home language backgrounds
and the remaining 52% of schools serve pupils from three or more home language
backgrounds. In other words, in 71% of schools surveyed, the pupil population includes at
least two language groups.

5
Figure 2. Number of languages spoken by KG1-P3 pupils in schools (% of schools), based on study districts
Teacher level language match
As with pupil language match, the study identifies three levels of teacher language match in
schools, adopting the same cutoffs for different levels of match. In high teacher language
match conditions, at least 80% of KG1-P3 teachers in the school speak the approved GLOI of
the school. In medium teacher language match conditions, 60-80% of KG1-P3 teachers in
the school speak the approved GLOI of the school. Finally, in low teacher language match
conditions, fewer than 60% of KG1-P3 teachers in the school speak the approved GLOI of
the school. The report considers a teacher as speaking the GLOI if they reported being able to speak it fluently.
What proportion of KG1-P3 teachers speak the approved GLOI of their schools?
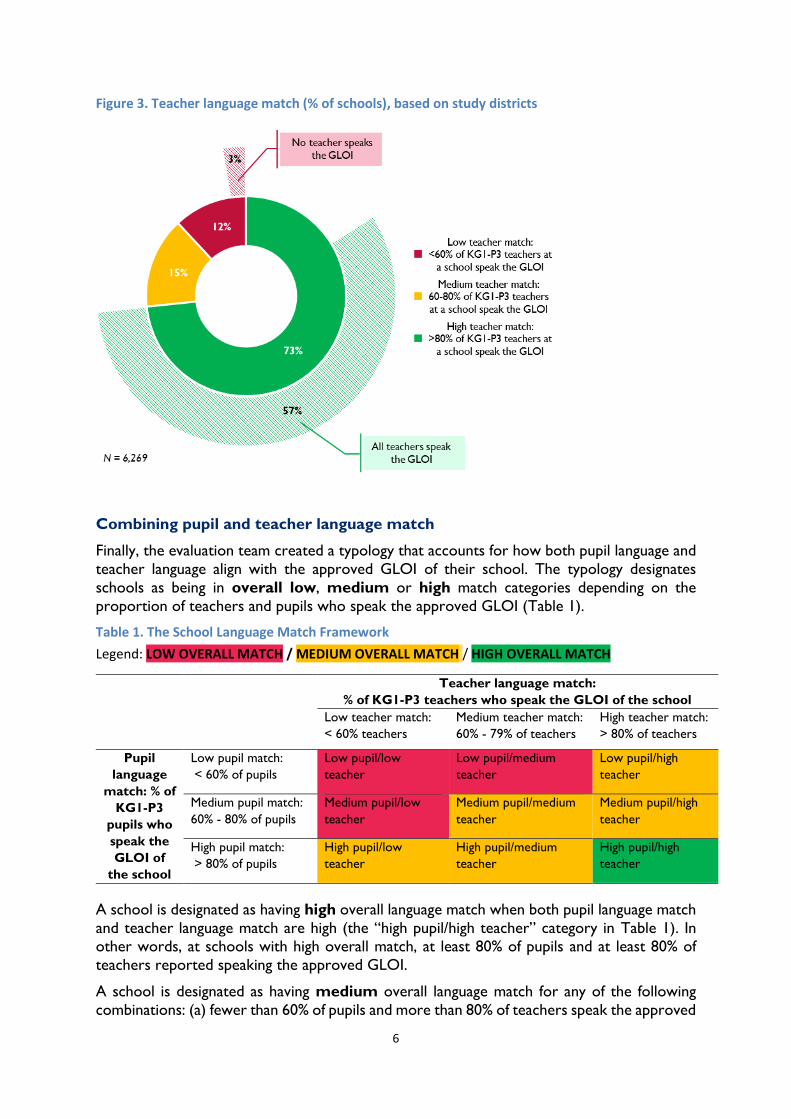
KEY FINDING #3: More than half of the schools have full teacher language match
with the GLOI. Across the 100 districts surveyed, 57% of schools have full teacher match
with all KG1-P3 teachers surveyed reporting that they speak the approved GLOI. In total,
73% of schools have high teacher language match. Additionally, 15% of schools have medium
teacher language match. The remaining 12% of schools have low teacher language match, with
3% of all schools having zero KG1-P3 teachers who reported that they speak the approved
GLOI.
6
Figure 3. Teacher language match (% of schools), based on study districts
Combining pupil and teacher language match
Finally, the evaluation team created a typology that accounts for how both pupil language and
teacher language align with the approved GLOI of their school. The typology designates
schools as being in overall low, medium or high match categories depending on the
proportion of teachers and pupils who speak the approved GLOI (Table 1).
Table 1. The School Language Match Framework
Legend: LOW OVERALL MATCH / MEDIUM OVERALL MATCH / HIGH OVERALL MATCH
Teacher language match:
% of KG1-P3 teachers who speak the GLOI of the school
Low teacher match:
< 60% teachers
Medium teacher match:
60% - 79% of teachers
High teacher match:
> 80% of teachers
Pupil
language
match: % of
KG1-P3
pupils who
speak the
GLOI of
the school
Low pupil match:
< 60% of pupils
Low pupil/low
teacher
Low pupil/medium
teacher
Low pupil/high
teacher
Medium pupil match:
60% - 80% of pupils
Medium pupil/low
teacher
Medium pupil/medium
teacher
Medium pupil/high
teacher
High pupil match:
> 80% of pupils
High pupil/low
teacher
High pupil/medium
teacher
High pupil/high
teacher
A school is designated as having high overall language match when both pupil language match
and teacher language match are high (the “high pupil/high teacher” category in Table 1). In
other words, at schools with high overall match, at least 80% of pupils and at least 80% of
teachers reported speaking the approved GLOI.
A school is designated as having medium overall language match for any of the following
combinations: (a) fewer than 60% of pupils and more than 80% of teachers speak the approved

7
GLOI of the school (“low pupil/high teacher” in Table 1); (b) 60-80% of pupils and more than
60% of teachers speak the GLOI of the school (“medium pupil/medium teacher” and “medium
pupil/high teacher”); (c) more than 80% of pupils and fewer than 80% of teachers speak the
GLOI of the school (“high pupil/low teacher” and “high pupil/medium teacher”).
Finally, a school is designated as having low overall language match in the following situations:
(a) fewer than 80% of pupils and fewer than 60% of teachers reported speaking the GLOI of
the school (“low pupil/low teacher”) or (b) fewer than 60% of pupils and fewer than 80% of
teachers reported speaking the GLOI of the school (“low pupil/medium teacher” or “medium
pupil/low teacher”).
KEY FINDING #4: Under this typology, 46% of schools have high overall language match,
41% of schools have medium overall language match, and 13% of schools have low overall
language match.
Table 2. Number and proportion of schools in each school language match category
Teacher language match:
% of KG1-P3 teachers who speak the GLOI of the school
Low teacher match:
< 60% of teachers
Medium teacher match:
60% - 79% of teachers
High teacher match:
> 80% of teachers
Pupil
language
match: % of
KG1-P3
pupils who
speak the
GLOI of
the school
Low pupil match:
< 60% of pupils
405 schools
(6.5%)
336 schools
(5.4%)
1221 schools
(19.5%)
Medium pupil match:
60% - 80% of pupils
69 schools
(1.1%)
96 schools
(1.5%)
484 schools
(7.7%)
High pupil match:
> 80% of pupils
260 schools
(4.4%)
499 schools
(8%)
2899 schools
(46.2%)

8
Figure 4. School language match (% of schools)
Teaching and learning materials
KEY FINDING #5: School environments lack teaching and learning materials
(TLM) in the GLOI of the school. NALAP and Integrated Approach materials were available
in 19%-66% of surveyed schools, depending on the region and materials. However, other TLM
such as teacher guides, pupil readers, and pupil workbooks were not available in the GLOI of
the school with the exception of teacher guides in Akuapim Twi, Fante and Ga, and teacher-
made teaching aids in Gonja. As this was before the Learning TLM were introduced, the TLM
described were the only ones that could be found in schools.
F. CONCLUSIONS AND RECOMMENDATIONS
Based on this language mapping exercise, several conclusions and recommendations were
drawn to support the implementation of the LPIE, with some immediate and longer-term
steps.
Conclusion #1: In 42% of schools, the approved GLOI of the school is not well-aligned with
the home languages spoken by pupils (corresponding to schools in the medium pupil language
match and low pupil language match categories). In fact, in 7% of all schools, no pupils reported
speaking the GLOI of the school as their home language.
Key Recommendation #1a (long-term recommendation): Re-examine the official
GLOI assigned to each school to make sure that each school has the most appropriate
of the 11 approved languages as its GLOI.
Key Recommendation #1b (long-term recommendation): Review the status of
Lowmatch
schools13%
Medium match schools
41%
High match schools
46%
Low pupil/Low teacher7% Low pupil/Medium teacher
5%
Medium pupil/Low teacher1%
Low pupil/High teacher 20%
Medium pupil/High teacher8%
Medium pupil/Medium teacher1%
High pupil/Low teacher4%
High pupil/Medium teacher 8%
High pupil/High teacher46%
N = 6,269

9
other languages beyond the 11 approved GLOI to determine whether they could
qualify for approval as a GLOI. This recommendation aligns with the revised 2016
Draft LPIE.
Conclusion #2: Linguistic diversity in schools is high: in 73% of schools, the pupil population
speaks at least two languages.
Key Recommendation #2a (long-term recommendation): In schools where there
are two dominant languages and both are among the 11 approved languages, consider
a formalized two-language system which gives pupils the choice between two GLOIs.
Key Recommendation #2b (long- and short-term recommendation): Raise
awareness of the learning needs of second language learners, and provide support to
teachers in the instructional approaches geared to these learners.
Key Recommendation #2c (long-term recommendation): All teachers should be
required to take courses in second language acquisition and teaching techniques in
pre-service and in-service. At the pre-service level, early grade teachers should be
qualified to teach two or more GLOI. This recommendation also relates to Conclusion #1 above; in schools where no pupils speak the GLOI, the use of second
language teaching techniques is crucial if pupils are to be given equitable opportunities
to learn to read.
Conclusion #3: Teacher language match is higher than pupil language match. Overall, 82%
of teachers report being able to speak and read in the approved GLOI of their school. Still,
the proportion of teachers who reported being able to speak the GLOI of their school is not
adequate in 27% of schools, where fewer than 80% of teachers speak the GLOI.
Key Recommendation #3a (long-term recommendation): Revise teacher
deployment practices to prioritize language alignment between teacher language and
GLOI of the school and, where possible, between teacher language and pupil languages,
especially for early grade teachers. Teachers should not be eligible for deployment
where they have not formally studied and/or passed a proficiency exam in the GLOI.
Key Recommendation #3b (short-term recommendation): Within schools with
medium and low match conditions, reassign teachers who speak and read GLOI to
teach reading in GLOI in the early grades. Work with teachers and community leaders
to identify sources of language support for the GLOI and/or pupil home language
where reassigning teachers is not possible.

10
BACKGROUND A. PROJECT OVERVIEW
The USAID Partnership for Education: Learning Activity is a $71 million five-year project that
supports the MOE and GES to improve reading performance in primary public schools in
Ghana. Learning’s Early Grade Reading (EGR) program seeks to improve reading and learning
outcomes for an estimated 1.1 million pupils in KG2-P2 through a systematic phonics-based
approach to reading in all 11 approved GLOI using scripted lesson plans and supplementary
teaching and learning materials, developed under Learning. The EGR program is implemented
in over 7,000 primary schools in 100 target districts in all 10 regions of the country. It aims
to build the capacity of over 2,000 national and district-level trainers and 30,000 KG2-P2
teachers, Headteachers and Curriculum Leads, to teach reading using Learning’s teaching and
learning materials. The Learning activity also includes a small math pilot, which tests innovative
teaching and learning approaches to improve early grade math skills. The Learning activity
includes a robust monitoring, evaluation, and learning system which, among other activities,
conducts regular monitoring to gauge fidelity of implementation of the program at the
classroom and school levels.
B. THE LANGUAGE POLICY IN GHANA
Research has shown that children learn to read best in a language they speak and understand
(see Nsoh et al. 2001; Owu-Ewie 2013; Nsoh and Ababila 2013; Trudell 2016). Ghana was
among the first countries in sub-Saharan Africa to recognize this by approving 11 Ghanaian
languages, out of over 80 languages spoken in the country, to be used as Ghanaian languages
of instruction (GLOI) and subjects of study alongside the English language.
Under the 2016 Draft Language Policy in Education (LPIE), the GLOI is used in the early grades
of primary school as the medium of instruction and as the language of first literacy, so that
children learn to crack the code of reading in a language that is familiar to them. Gradually,
English is introduced, orally at first during the early grades of primary school. In P3, children
begin to learn to read in English, melding their first literacy skills from the GLOI with their
oral English skills, to make English their second literacy. The medium of instruction remains
the GLOI with a gradual transition from GLOI to English during the remainder of primary
school while the GLOI continues as a subject area for the remainder of schooling. Thus, the
revised draft language policy in Ghana establishes a bilingual system, with the GLOI and English
standing side-by-side as two pillars.3
An MOE policy directive in 2007 re-affirmed commitment to this bilingual system, yet
implementation of the policy faced several challenges. These included the lack of data on the
linguistic environment of schools, teacher knowledge and competency in these languages, and
the learners’ linguistic backgrounds. Furthermore, the lack of human and material resources
to support instruction in 11 languages resulted in the mismatch of teacher posting with the
linguistic conditions in schools. Finally, the absence of a legal basis for the policy also proved
to be a barrier4.
3 The most recent language policy, which preceded the 2016 Draft LPIE, was not formalized, but was released in
the form of a directive in 2007. In that directive, English becomes the medium of instruction in P4. The 2016
Draft LPIE is under review and pending finalization by the NaCCA.
4 Owu-Ewie, C., & Eshun, E.S., Language representation in the Ghanaian Lower primary (schools) classroom: The case
of some schools in the Central and Western Regions of Ghana. Ghana: Accra; Manuscript shared by author, 2018.

11
The U.S. Agency for International Development (USAID) Ghana Partnership for Education:
Learning activity has supported the NaCCA/MOE in the drafting of the LPIE through the
Language Policy Working Group (LPWG). The revised LPIE reiterates the provisions of the
2007 directive and attempts to address the implementation challenges associated with it.
The 2016 Draft LPIE emphasizes a two-pillar approach to language of instruction in Ghanaian
schools, with one pillar being one of the 11 approved GLOI and the other pillar being English.
Per this policy, pupils would begin school using one of the 11 GLOI or those that may be
approved later and learn oral communication skills in English beginning in KG2. The GLOI
remains the primary language of instruction, with oral English lessons daily, through P2. In P5,
once pupils have a solid foundation in literacy in the GLOI, English reading and writing will be
taught as a second language, and the GLOI will be maintained as the medium of instruction
during a gradual transition from GLOI to English during the remainder of primary school.
The challenge lies in the implementation of this policy in Ghanaian schools. The linguistic
diversity of the country with over 80 languages and dialects spoken across its 216 Districts
creates natural challenges in the implementation, regardless of the selection of GLOI. It is, therefore, important to have the depth and breadth of understanding of this diversity to
ensure that for every school, there are appropriate teacher deployment and support
mechanisms, and teaching and learning materials to ensure the success of every child,
regardless of his or her home language. This study intends to provide the necessary foundation
for establishing a greater understanding of the linguistic landscape in 100 districts and to
contribute to and inform the revision of the 2016 Draft LPIE.

12
STUDY DESIGN AND
METHODOLOGY A. STUDY OBJECTIVES AND ANALYTICAL FRAMEWORK
Study Objectives
This language mapping study has two key objectives:
1. To generate empirical data on the language context in Ghana’s schools and the level
of its alignment with the assigned GLOI;
2. To inform the finalization and subsequent implementation of the 2016 Draft LPIE,
supporting the creation of equitable opportunities for reading acquisition by all
children in Ghana.
To accomplish these objectives, Learning carried out a census of schools within its100 districts,
working with the College of Languages Education, Ajumako, of the University of Education,
Winneba (UEW), to map the linguistic context of each school. This extensive study offers a
richness and nuance of data that has not until now been available to educators and policy
makers in Ghana, and has few precedents on the African continent. Understanding the degree
to which there is a language match at the school level is critical for the implementation of the
2016 Draft LPIE and the 2007 Ministry Directive. The 2016 Draft LPIE mandates that reading
instruction begins in an approved GLOI before adding reading in English in P3.5 The
combination of these three critical factors—teachers, pupils, and TLM aligned to the approved
GLOI—is the optimal implementation environment for the 2016 Draft LPIE. It is understood,
however, that this optimal combination and alignment may not always be present in an
environment as linguistically diverse as Ghana. Having the data for each school across the
three dimensions of schools, pupils, and teachers is essential for understanding where the
relative areas of strength and difficulty may lie, and what implications they hold for
implementation. This study provides the depth and breadth of information that is needed to
ensure that the policy implementation is responsive to local school and community contexts.
Study Questions
The language mapping study is a descriptive study of language-related characteristics at the
school, teacher, and pupil levels in all schools targeted by Learning. It seeks to answer the
following key question:
To what extent does the designation of the Ghanaian Language of Instruction
reflect the language environment of Ghanaian schools, as demonstrated by the
languages spoken by pupils, teachers, and used in teaching and learning materials?
5 Although it is often used as the LOI and even medium of instruction, English is not one of the
languages approved for reading instruction in the early grades of primary school according to the 2007
Directive and the 2016 Draft LPIE. Since this study sought to understand what support is needed to
implement the 2016 Draft LPIE for reading instruction in KG2–P2, it does not consider English as an
approved LOI.

13
To answer this overarching question, the study aims to address the following sub-questions:
1. To what extent do languages KG1-P3 pupils speak at home align with the GLOI of
their schools, i.e., how robust is pupil language match at schools?
2. To what extent do the languages KG1-P3 teachers speak align with the GLOI of their
schools, i.e, how robust is teacher language match at schools?
3. To what extent both pupil and teacher languages align with the GLOI of their schools,
i.e., how robust is overall language match?
4. How widely available are TLM in the GLOI of schools?
B. STUDY DESIGN AND DATA COLLECTION
The language mapping study is a descriptive school census study conducted in the 100 districts
targeted by Learning. In each district, the study gathered data from Headteachers, teachers,
and pupils in sampled classrooms. Below is a summary of the study instruments, school
selection, and data collection process.
Instruments
To conduct this language mapping study, the Learning team in collaboration with UEW
developed three data collection instruments: teacher questionnaire, Headteacher
questionnaire, and pupil group questionnaire. The main questions contained in each
instrument are presented in Table 3. The full instruments are provided in Annex III.
Table 3. Language mapping instruments
Instrument Type Key question topics
Teacher questionnaire
(administered to every KG1, KG2, P1,
P2, and P3 teacher in the school
individually)
Approved GLOI of the school
Teacher characteristics and training
Knowledge of and experience with Ghana language policy
Use of GLOI
Teaching of reading and writing and language use
Children’s language on the playground and at home
Language of TLM
Headteacher questionnaire
(administered to the Head- teacher of
the school individually)
Approved GLOI of the school
Use of GLOI by teachers
Other language use
Language of TLM
Headteacher characteristics and language knowledge
Pupil group questionnaire
(administered to KG1, KG2, P1, P2, and
P3 classes as a group6)
First and second language
Home language
Parent language
Language use and preferences
6 Due to time and budgetary constraints, it was not possible to test pupils on language skills.

14
District Selection
The selection of the 100 districts targeted by Learning was not conducted randomly. In the
second half of 2016, Learning refocused its intervention on 100 districts out of the 165
originally selected when Learning first started. To select these 100 districts, Learning
considered the level of language match at the pupil level to maximize the potential for impact
of the reading program. Because language context data were not available and critical project
implementation had to commence, district selection was done through a collaborative process
with the MOE/GES and District Education Offices (DEO). Learning selected districts where it
was estimated that at least 90% of pupils spoke the GLOI of their schools, based on reported
DEO experience. Figure 5 below shows
the location of all 100 districts targeted by
Learning. Because of this district selection
process, the findings presented in this
report should be interpreted with caution
at the regional level, and cannot be generalized to the national level. It is likely
that the results presented in this report
may present a more positive picture of
pupil language match than would a full
nationally-representative study.
Table 4 shows the approved GLOI most
represented in the Learning districts in each
region. Some GLOI only appear in certain
regions (for example, Dagaare in Upper
West; Kasem in Upper East; Dagbani; and
Gonja in Northern) while others straddle
several regions (for example, Asante Twi in
Brong Ahafo, Ashanti and Western; and
Fante in Western and Central). Since the
regions and the assigned approved GLOI
do not overlap with each other completely,
the data presented in this study were
analyzed both by GLOI and by region for
completeness.
Table 4. GLOI represented in each region
Region GLOI most represented in Learning districts
Ashanti Asante Twi
Brong Ahafo Asante Twi
Central Fante, Asante Twi
Eastern Akuapim Twi, Dangme
Greater Accra Ga, Dangme, some Asante Twi and Akuapim Twi
Northern Gonja, Dagbani
Upper East Kasem
Upper West Dagaare
Volta Ewe
Western Asante Twi, Nzema, Fante
Figure 5. Map of the 100 districts targeted by Learning

15
Data Collection
The school lists from the 2015 EMIS database informed plans for school visits in the 100
districts targeted by Learning. The data collection was conducted in several rounds due to
timing and logistical constraints: the first round of data collection occurred in Yendi Municipal
in December 2016, the second in 59 districts in January–February 2017, and the final round
covering the remaining 40 districts in March–April 2017. Only minor issues were noted
between the rounds, as indicated below, and in tables and figures.
Before each round of data collection, UEW organized a comprehensive training workshop for
enumerators and supervisors. All instruments were administered on tablets using the Open
Data Kit (ODK) platform. As expected, UEW enumerators discovered that some schools had
closed and others had reopened or had not been included in the final 2015 education
management information system (EMIS) database. Ultimately, interviews were conducted at
7,105 schools, a net increase of 152 schools compared to the 2015 EMIS coverage of the same
districts. Approximately three-quarters of schools reached were in rural areas while the
remaining quarter was in peri-urban or urban areas.
Table 5 shows the number of Headteacher, teacher, and pupil group interviews conducted in
each region. On average, the research team conducted 4.9 pupil class interviews per school
and 4.3 teacher interviews per school.
Table 5. Number of interviews conducted
Region Schools
(overall)
Headteacher
interviews
Teacher
interviews
Pupil group
interviews
Accra 218 139 1,005 966
Ashanti 1,606 1,578 4,323 7,884
Brong Ahafo 885 869 4,517 4,434
Central 1,012 996 4,786 4,938
Eastern 488 484 2,382 2,412
Northern 484 481 2,206 1,960
Upper East 120 128 509 521
Upper West 324 335 1,132 1,170
Volta 957 945 5,249 5,060
Western 1,011 974 4,670 4,784
Total 7,105 6,929 30,779 34,129
It was not always possible to conduct all three types of interviews at every school as
Headteachers, teachers, and classes were not always available. Consequently, not all 7,105
schools are represented at each level. The table indicates that there are some regions, that
is, Upper East and Upper West, where there are more Headteacher interviews than schools,
a situation that sometimes arises when there are multiple Headteachers at a listed school,
such as separate kindergarten and primary school Headteachers or streams with different
Headteachers.
Table 6 documents the school coverage for each type of questionnaire, counting a school as “covered” where at least one interview was conducted. The table also shows that in Accra, a
Headteacher interview was conducted in only 61% of schools, and in Ashanti, where a teacher

16
interview could be conducted in just 55% of schools. In these cases, district-level coverage
varied widely, but all districts are represented. Caution must be exercised where a high
proportion of schools are missing7; however, this is only a risk for teacher interviews, which
factor into the match methodology (described below). The combined match results in Section
F of this report draw from the 6,269 schools where both teacher interviews and pupil group
questionnaires were administered, which is a subset of the 7,105 schools.
Table 6. School coverage by questionnaire type (% of overall schools)
Region Schools
(overall)
Headteacher
questionnaire
Teacher
questionnaire
Pupil group
questionnaire
Accra 218 61% 95% 93%
Ashanti 1,606 97% 55% 99%
Brong Ahafo 885 97% 99% 99%
Central 1,012 97% 100% 99%
Eastern 488 98% 100% 99%
Northern 484 95% 98% 99%
Upper East 120 96% 95% 99%
Upper West 324 95% 99% 99%
Volta 957 98% 100% 99%
Western 1,011 95% 99% 99%
Total 7,105 95% 89% 99%
C. LIMITATIONS
The language mapping census is a rich source of data on language conditions in schools and
the communities they serve; however, the sheer size and complexity of a full census in 100
districts places some limitations on the depth of the data that can be collected.
First, this exercise relies on self-reported data by teachers, Headteachers, and pupils. There
was no formal testing administered to teachers or pupils to ascertain their knowledge of the
GLOI. The self-reports by the study respondents may create a positive bias in the results,
particularly for pupil data, which were reported in group settings. It is likely that the match
levels may in fact be lower than reported here. Going forward, it is recommended to integrate
a module assessing individual pupil language ability in reading assessments.
Another limitation relates to the “other”, non-GLOI languages documented during data
collection. Wherever questions referenced specific languages, the 11 approved GLOIs (as well
as Gurene and Kusaal, as common other languages) were listed and, for any other languages, an “other” option was offered. If “other” was selected, enumerators then wrote in the name
of the other languages. While only one language was typically named, in some cases multiple
languages were listed, which impacts analyses that count languages spoken by pupils. In these
7 A high proportion—more than 50% of schools—were not represented in the Headteacher interviews in Ada
East in Accra and in the teacher interviews from the following districts in Ashanti: Afigya-Kwabere, Asante-Akim
Central, Asante-Akim North, Asokore Mampong Municipal, Atwima Mponua, Bekwai Municipal, Kumasi
Metropolitan, Mampong Municipal, and Offinso Municipal.

17
cases, the structure of the dataset necessitated that the “other” category of language—
whether there was one or multiple other languages subsequently written in—was counted as
a single language. When using the impacted variables, as in the discussion of the numbers of
pupil languages at schools later in the report, the team first confirmed that only one language
was typically named.
Finally, the set of questions used in Yendi Municipal in the Northern Region (where the first
round of data collection took place during the Dagbani Prototype that preceded the project’s
scale-up to all Learning 100 districts) are slightly different from the questions used in the
second and third rounds of data collection. The questions used in Yendi were revised or
clarified based on the Yendi results to improve the questionnaires for subsequent rounds of
data collection. As a result, certain analyses in this report do not include data from Yendi
Municipal; this is noted in tables and figures where applicable. These differences are minor
and do not affect the overall findings or conclusions of this report.
18
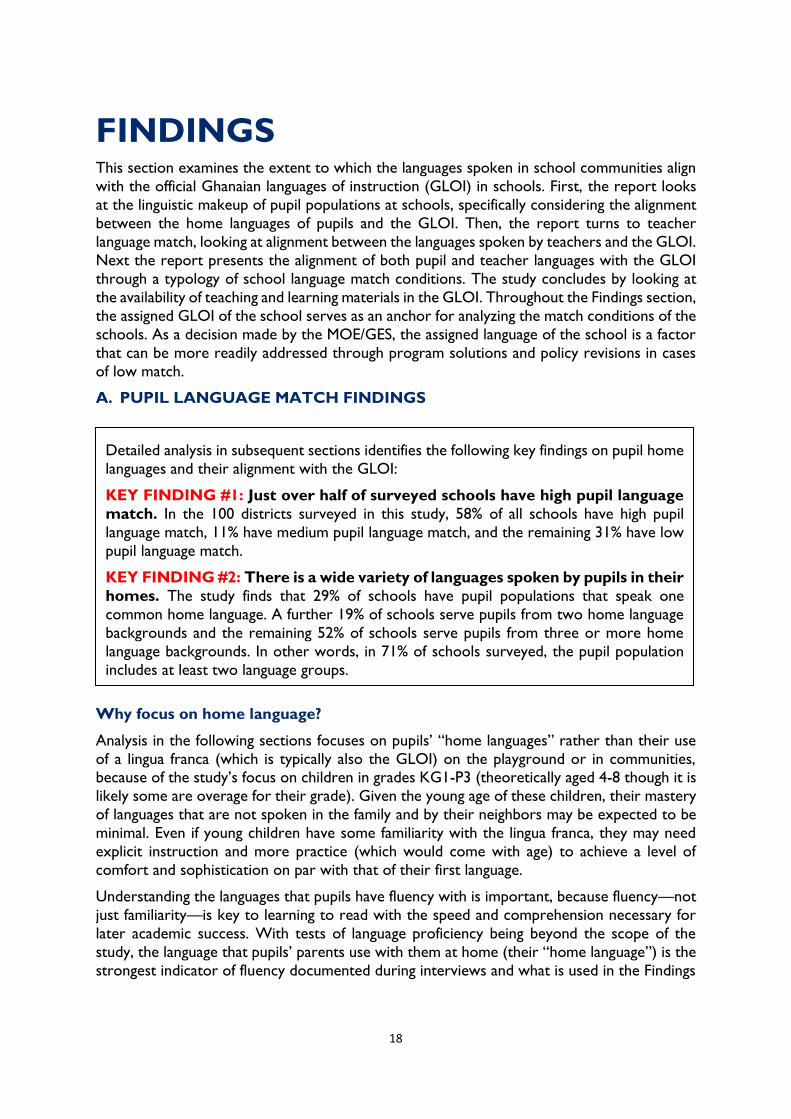
FINDINGS This section examines the extent to which the languages spoken in school communities align
with the official Ghanaian languages of instruction (GLOI) in schools. First, the report looks
at the linguistic makeup of pupil populations at schools, specifically considering the alignment
between the home languages of pupils and the GLOI. Then, the report turns to teacher
language match, looking at alignment between the languages spoken by teachers and the GLOI.
Next the report presents the alignment of both pupil and teacher languages with the GLOI
through a typology of school language match conditions. The study concludes by looking at
the availability of teaching and learning materials in the GLOI. Throughout the Findings section,
the assigned GLOI of the school serves as an anchor for analyzing the match conditions of the
schools. As a decision made by the MOE/GES, the assigned language of the school is a factor
that can be more readily addressed through program solutions and policy revisions in cases
of low match.
A. PUPIL LANGUAGE MATCH FINDINGS
Why focus on home language?
Analysis in the following sections focuses on pupils’ “home languages” rather than their use
of a lingua franca (which is typically also the GLOI) on the playground or in communities, because of the study’s focus on children in grades KG1-P3 (theoretically aged 4-8 though it is
likely some are overage for their grade). Given the young age of these children, their mastery
of languages that are not spoken in the family and by their neighbors may be expected to be
minimal. Even if young children have some familiarity with the lingua franca, they may need
explicit instruction and more practice (which would come with age) to achieve a level of
comfort and sophistication on par with that of their first language.
Understanding the languages that pupils have fluency with is important, because fluency—not
just familiarity—is key to learning to read with the speed and comprehension necessary for
later academic success. With tests of language proficiency being beyond the scope of the
study, the language that pupils’ parents use with them at home (their “home language”) is the
strongest indicator of fluency documented during interviews and what is used in the Findings
Detailed analysis in subsequent sections identifies the following key findings on pupil home
languages and their alignment with the GLOI:
KEY FINDING #1: Just over half of surveyed schools have high pupil language
match. In the 100 districts surveyed in this study, 58% of all schools have high pupil
language match, 11% have medium pupil language match, and the remaining 31% have low
pupil language match.
KEY FINDING #2: There is a wide variety of languages spoken by pupils in their
homes. The study finds that 29% of schools have pupil populations that speak one
common home language. A further 19% of schools serve pupils from two home language
backgrounds and the remaining 52% of schools serve pupils from three or more home
language backgrounds. In other words, in 71% of schools surveyed, the pupil population
includes at least two language groups.

19
section. The home language measure has the additional advantage of relying on pupil reports,
rather than teacher estimations, of pupil language skills.
It is important to keep in mind that more pupils have basic familiarity with the GLOI than are
captured in the measures of home language presented in the Findings section here; and that
we can expect children’s familiarity with the GLOI to increase through continued exposure
to it in school and beyond. For teacher reports of pupil ability in the GLOI in classrooms and
on the playground, see Annex 1 results on the Language Match Index, an alternative
methodology for considering language match that accounts for these factors.1 Bear in mind
that the estimates presented there may over-report pupils’ knowledge of the GLOI, especially
where teachers (mis)interpret mimicry of words in lessons as genuine comfort with the
GLOI—a particular risk where teachers do not have familiarity with individual pupil language
skills, especially in large classes.
What proportion of pupils speak the approved GLOI at their schools across the
100 districts in the study?
To explore the relationship between pupils’ language background and the GLOI, this section
looks at the proportion of pupils who speak the GLOI across the 100 districts covered in the
study, counting pupils as “speaking” the GLOI when they reported using it as their home
language. While many pupils speak the GLOI—on average, 71% of the pupil population
surveyed does—the findings point to cases of misalignment between pupil language and GLOI
that warrant attention.
The report groups findings on this topic, defining three levels of pupil language match in
schools: high, medium, and low pupil language match. High pupil language match occurs when
at least 80% of pupils in a school speak the approved GLOI of the school; medium pupil
language match occurs when 60-80% of pupils in a school speak the approved GLOI of the
school; and low pupil language match occurs when fewer than 60% of pupils in a school speak
the approved GLOI of the school.
Figure 6. Pupil language match (% of schools), based on study districts

20
Figure 6 applies this pupil language match framework to the 100 districts surveyed in this
study, showing that 58% of schools have high pupil language match. However, only 26% of all
schools have full pupil language match, with all pupils at those schools reporting they speak
the GLOI. Additionally, 11% of schools have medium pupil language match. The remaining
31% of schools have low pupil language match and 7% of all schools having particularly low
match, with zero pupils who reported speaking the approved GLOI.
How does pupil language match vary by GLOI and region?
Next, the report disaggregates the pupil language match findings discussed above by language
and region. Figure 7 shows the alignment between the languages pupils speak and the GLOI,
presenting the proportions of schools with high, medium, and low language match by GLOI
and region. The green sections of the bars show the proportions of schools where the vast
majority of pupils speak the GLOI with their parents, and hence have no difficulty
understanding the GLOI while the red sections of the bars show the proportions of schools
where fewer than 60% of pupils speak the GLOI (or in other words, 40% or more of pupils
DO NOT speak the GLOI at home).
Figure 7. Pupil language match (KG1-P3 pupils) by GLOI and region (% of schools), based on study districts
Looking first at pupil language match by GLOI, Figure 7 shows that Dagaare, Ewe, and Dangme
are the languages most often associated with high pupil language match in the districts
surveyed for this study—in 98% of Dagaare-medium schools, 94% of Ewe-medium, and 92%
of Dangme-medium schools, more than 80% of pupils speak the GLOI. In contrast, Ga, Gonja,
and Akuapim Twi are the languages most often associated with low pupil language match, with
over 50% of schools using those GLOIs having fewer than 60% pupils who speak the GLOI at

21
home. Turning to regional results, nearly all schools in Upper West and Volta have high pupil
language match, with 98% of schools and 94% of schools in those regions, respectively,
identified as having high pupil language match. Meanwhile, Brong Ahafo, Western, and Upper
East face the greatest challenges with pupil language match, with 60%, 54%, and 47% of schools
in those regions, respectively, experiencing low pupil language match conditions. The low
language match conditions in many Brong Ahafo, Western, and Upper East schools may occur
because different ethnic groups—and language groups—co-exist, but schools only have one
official GLOI. For instance, Kasem is used as the GLOI in Kasena Nankana district in Upper
East even though Gurene is widely spoken there. Similarly, Brong Ahafo and Western regions
are home to a number of different language communities and to different migrant farmers,
which means that some schools serve linguistically diverse communities.
How do the proportions of schools with no pupils who speak the GLOI vary by
GLOI and region?
As noted earlier, 7% of schools (525 schools) across the 100 Learning districts have extremely
low pupil language match, with no pupils who speak the GLOI. This section disaggregates
these schools by GLOI and region.
Figure 8. Proportion of schools with no KG1-P3 pupils who speak the GLOI, by GLOI and region, based on study districts
Figure 8 shows the proportion of schools with no pupils who speak the GLOI broken down
by GLOI and region. Examining results by GLOI, Kasem and Dagbani-medium schools face
the most acute challenges, with 29% of Kasem schools and 13% of Dagbani schools having no
pupils who speak the GLOI. Looking by region, Upper East and Brong Ahafo have the highest
proportion of schools with extreme low pupil language match, with 31% of schools and 24%
of schools, respectively, having no pupils that speak the GLOI of their school.

22
Because Kasem-medium schools are located in Upper East region, seeing relatively high
proportions of schools with no pupil language match for Kasem and Upper East is expected.
Indeed, although Kasem is an approved GLOI, it is not as widely spoken in Upper East as
other languages, such as Kusaal and Gurene, which explains the high proportion of schools
where pupils do not speak Kasem (although it is important to note that the districts selected
for Learning in Upper East do include Kasem speaking communities).
In Brong Ahafo, a mix of languages are spoken including Asante Twi, Akuapem Twi, and Fante
and all three languages are generally understood by the vast majority of Brong Ahafo residents.
Therefore, although a large proportion of pupils may have indicated that Asante Twi, the main
GLOI in Brong Ahafo, is not the language that they speak with their parents, Asante Twi is
still a language with which these pupils would have some familiarity.
How do the proportions of schools where all KG1-P3 pupils speak the GLOI vary
by GLOI and region?
Next, the analysis turns to cases of extremely high match—schools where all pupils speak the
GLOI. In Figure 9, which presents the proportion of schools with extremely high pupil
language match by GLOI and region, three GLOI have more than 50% of schools where all
pupils speak the GLOI: Ewe (70% of schools), Dagaare (67% of schools), and Dangme (63% of
schools). On the other hand, no Ga or Gonja-medium schools have extremely high match
and just 1% of Akuapim Twi schools do. Regionally, Volta and Upper West have the highest
proportion of schools where all pupils speak the GLOI, with 70% and 67% of schools
respectively.
Figure 9. Proportion of schools where all KG1-P3 pupils speak the GLOI, by GLOI and region, based on study districts
As these two analyses show, the 2016 Draft LPIE implementation finds more receptive ground

23
in the Volta and Upper West regions, and particularly in the Ewe, Dagaare, and Dangme
languages of instruction. Ghana can anticipate implementation challenges and more pupils
struggling with reading acquisition in Upper East and Brong Ahafo regions, especially in schools
where Kasem or Dagbani are the official GLOI.
How linguistically diverse are KG1-P3 pupil populations at schools?
As the findings on levels of pupil language match presented above show considerable variability
in the proportions of pupils who speak the GLOI, it is important to consider the diversity of
the linguistic contexts of schools. Figure 10 presents the language diversity in classes overall
across the 100 Learning districts and disaggregated by GLOI and region. Specifically, Figure 10
shows the number of home languages represented within a school community, with results
ranging from one language per school to six or more languages per school.
Figure 10 indicates that overall, only 29% of schools have pupil populations that speak one
common home language. A further 19% of schools serve pupils from two home language
backgrounds and the remaining 52% of schools serve pupils from three or more home
language backgrounds. In other words, in 71% of schools surveyed, the pupil population
includes at least two language groups.
Figure 10. Number of languages spoken by KG1-P3 pupils in schools (% of schools), based on study districts
Examining results by GLOI, schools with Ewe, Dagaare, Dangme, and Kasem as the GLOI
most commonly have pupil populations that speak one common home language, with 73% of
schools, 68% of schools, 64% of schools, and 53% of schools, respectively, with pupils from a
single language background. By contrast, over 80% of Gonja, Akuapem Twi, Asante Twi, Ga,

24
and Nzema-medium schools have more than two languages represented within pupil
populations. Ga-medium schools are particularly multilingual, with six or more languages
spoken in 80% schools with this approved GLOI.
As expected, the degree of linguistic diversity at schools also varies by region. Schools in Volta
and Upper West are most likely to have pupil populations that speak a common home
language, with 74% of schools and 68% of schools, respectively, in those regions having
students from one language background. Schools in Brong Ahafo, Western, and Ashanti, on
the other hand, have much more linguistic diversity in schools, with more than 80% of schools
serving pupils from two or more language backgrounds.
Looking jointly at Figure 8 and Figure 10 may suggest that situations with low pupil language
match also have substantial linguistic diversity. This has critical implications for policy revision
and program implementation. Although the methodologies are similar, in cases where pupils
do not all speak the GLOI, techniques for teaching in a classroom with two languages are
somewhat different from teaching in a highly multilingual class, and it would be important to
provide schools with the support that is needed for the language composition of their pupils.
It must be noted that the results in Figure 10 may overstate linguistic diversity at schools in
some cases, because, if even one pupil in grades KG1-P3 speaks a language, that language is
counted as a distinct language. Also, as subsets of school populations, classroom-level counts
of languages are, as expected, lower than school-level counts. Whereas only 29% of schools
have pupils from a common language background, 50% of classrooms do,8 suggesting that
some schools may manage linguistic diversity by grouping pupils from the same language group
together. Given these different perspectives on linguistic diversity, it would be fruitful for
future studies to explore the nuances of linguistic diversity at schools and how schools manage
that diversity.
Furthermore, examining linguistic diversity at schools raises the question of which languages
are spoken at schools. The study data show that 14% of pupils speak home languages that are
not among the 11 approved GLOI. While this suggests that the vast majority of pupils do
speak a GLOI (even if that language is not the GLOI of the school they attend), it also points
to the need to think about pupils coming from other language backgrounds.
In sum, the examination of variability in pupil language match and linguistic diversity of schools
provides insight into the strengths of the current approach as well as the possible challenge
areas in implementing GLOI. Although pupil language has not historically been seen as a
barrier to success of the local language instruction policy in Ghana, this study finds that there
are many schools where pupil language is a challenge. Indeed, in 7% of schools no pupils
reported speaking the GLOI at home, and in a sizable proportion of schools, pupils come
from different language backgrounds. In such settings, implementation of the 2016 Draft LPIE
has to consider pupil language ability in order to be successful. Reading programs should
provide support to pupils learning in a less-familiar language and support to teachers in
teaching emergent bilinguals. These should apply to classrooms where all pupils speak different
language(s) than the GLOI as well as classes where some pupils speak the GLOI and others
do not. The report discusses recommendations for these classrooms on page 38 and in Annex
II.
8 See Figure 21 in Annex I for an analysis of linguistic diversity at the classroom level.

25
B. TEACHER LANGUAGE MATCH FINDINGS
This section turns to teacher language match conditions, adopting a match framework with
the same definitions of match with teachers as were applied with pupils earlier in the report.
Specifically, high teacher language match means that at least 80% of KG1-P3 teachers in the
school speak the approved GLOI of the school; medium teacher language match means that
60-80% of KG1-P3 teachers in the school speak the approved GLOI of the school; and low
teacher language match means that fewer than 60% of KG1-P3 teachers in the school speak
the approved GLOI of the school. The report considers a teacher as speaking the GLOI if
they reported being able to speak it fluently.
What proportion of KG1-P3 teachers speak the approved GLOI at their schools
across the 100 districts in the study?
Figure 11 shows that, across the 100 districts surveyed, 73% of schools have high language
match, and 57% of schools have full teacher match, i.e., all teachers surveyed reported that
they speak the approved GLOI. Overall, 15% of schools have medium teacher language match.
The remaining 12% of schools have low teacher language match, with 3% of schools having no
teachers who reported that they speak the approved GLOI.
Figure 11. Teacher language match (% of schools), based on study districts
The analysis in subsequent sections identifies the following key finding on teacher language
match:
KEY FINDING #3: More than half of the schools have full teacher language
match with the GLOI. Across the 100 districts surveyed, 73% of schools have high
teacher language match,15% of schools have medium teacher language match, and 12% of
schools have low teacher language match.

26
How does teacher language match vary by GLOI and region?
Next, the report disaggregates findings on teacher language match, looking at the alignment
between the languages teachers speak by GLOI and region in Figure 12.
Results for GLOI suggest that Ewe, Dagaare, and Asante Twi are the languages with the most
schools with high teacher language match, with 90% of schools, 83% of schools, and 81% of
schools, respectively, with at least 80% of KG1-P3 teachers surveyed speaking the GLOI. Ga
and Kasem, on the other hand, have the highest levels of low teacher language match—55%
of Ga-medium schools and 40% of Kasem-medium schools having fewer than 60% of teacher
who speak the GLOI.
Regional results in Figure 12 show that four regions—Volta, Brong Ahafo, Ashanti, and Upper
West—have high teacher language match in over 80% of schools, with 91%, 87%, 5%, and 4%
of schools in each region, respectively, experiencing high match. In contrast, Greater Accra
and Upper East have the highest proportions of schools with low teacher match, with 44% of
schools in Greater Accra and 40% of schools in Upper East 40% having low teacher match.
The variation in teacher match may be due to the fact that current teacher deployment practices do not include language as a criterion for placement in schools and regions. This is
the case particularly for less common GLOI, such as Kasem, compared to the more common
GLOI. The study finds relatively few Kasem-GLOI schools with high teacher language match
(only 46% of schools have high match, the second lowest proportion for any GLOI) among
the districts in this study, and it is possible that teacher deployment requirements are a factor
in the language match conditions there.
Figure 12. Teacher language match by GLOI and region (% of schools), based on study districts

27
How do the proportions of schools with no KG1-P3 teachers who speak the GLOI
vary by GLOI and region?
Figure 13 shows the proportion of schools with no teachers who speak the GLOI by GLOI
and region. As noted earlier, across the 100 Learning districts, 3% of schools experience this
issue.
The GLOI with the most acute challenge are Ga, Kasem, and Gonja, with 30%, 20%, and 8%
of schools, respectively, having no teachers who speak the GLOI. The remaining eight GLOI—
Akuapim Twi, Nzema, Dagbani, Dangme, Asante Twi, Ewe, Fante, and Dagaare—all have
fewer than 5% of schools with these extreme cases of low teacher match.
Turning to regional results, Upper East and Greater Accra have the highest incidence of this
issue, with 20% of schools in Upper East and 17% of schools in Greater Accra having no
teachers who speak the GLOI of their school. Fewer than 5% of schools experience this issue
in the other eight regions, with four regions—Central, Upper West, Brong Ahafo, and
Ashanti—experiencing it in just 1% of schools.
Figure 13. Proportion of schools with no KG1-P3 teachers who speak the GLOI, by GLOI and region, based on study districts
How do the proportions of schools where all KG1-P3 teachers speak the GLOI
vary by GLOI and region?
Next, the analysis examines schools with very high teacher match, specifically schools where
all teachers speak the GLOI. As previously noted, in the majority of schools—57% overall—
all teachers speak the GLOI. This section disaggregates this finding by GLOI and region.
Figure 14 shows the proportion of schools where all teachers speak the GLOI by GLOI and
region. Three GLOI have more than two-thirds of schools where all teachers speak the GLOI:

28
Ewe, with 76% of schools; Dagaare, with 75% of schools; and Asante Twi, with 67% of schools.
In Ga, Akuapim Twi, and Dangme-medium schools, however, fewer than one-third of schools
have all teachers who speak the GLOI.
Regionally, in Volta, Upper West, Brong Ahafo, and Ashanti more than two-thirds of schools
have very high teacher language match conditions, with 76%, 74%, 71%, and 69% of schools in
each region, respectively, having all teachers speaking the GLOI. Very high teacher language
match is rarer in Greater Accra, Eastern, and Upper East, where fewer than one-third of
schools have all teachers who speak the GLOI and, like some GLOI, may warrant greater
attention to teacher language match.
Figure 14. Proportion of schools where all KG1-P3 teachers speak the GLOI, by GLOI and region, based on study districts
Regions and languages where teacher match is low present a challenge for the implementation
of 2016 Draft LPIE, and indicate areas where more resources and a careful consideration of the choice of GLOI is warranted. Teachers that do not speak the GLOI fluently are unable
to provide the strongest environment for reading instruction for their pupils, creating a
barrier for their reading acquisition. In the recommendations section, the report offer ways
to remedy this challenge.

29
C. OVERALL LANGUAGE MATCH FINDINGS
Next, the language match analysis considers pupil and teacher language match jointly through
a typology that accounts for whether the language abilities of both teachers and pupils align
with the approved GLOI. The typology designates schools as being in overall low, medium
or high match categories depending on the proportion of teachers and pupils who speak the
approved GLOI (see Table 7).
As noted above, the objective of the study is to provide insight into the depth of the linguistic
diversity for the 100 districts where Learning operates, and offer a model for continuous
context analysis to inform teaching and learning practices and language policy implementation.
The first two elements of the linguistic diversity that have implications for the implementation
of the 2016 Draft LPIE are: 1) the extent to which teachers speak the approved GLOI, and
hence, are able to use it for instruction; and 2) the extent to which pupils speak and
understand the GLOI, and hence, are able to fully benefit from instruction in the GLOI without additional support.
The combination of these two dimensions provides an initial lens for the language match
analysis that can be aggregated at the school, district, and regional levels. The language match
framework, presented in Table 7, describes one approach for classifying schools as being in
the low, medium and high overall language match categories, depending on the proportion of
teachers and pupils who speak the language fluently at the school level. Since the study is a
census of schools and teachers, and a class-level sample of pupils for each school, the match
levels represent the current context of the schools in the 100 Districts and offers important
insights vis-à-vis the environment for the implementation of the 2016 Draft LPIE. A school is
designated as having high overall language match when both pupil language match and teacher
language match are high (the “high pupil/high teacher” category in Figure 15). In other words,
at schools with high overall match, at least 80% of pupils and at least 80% of teachers reported
speaking the approved GLOI.
A school is designated as having medium overall language match for any of the following
combinations: (a) fewer than 60% of pupils and more than 80% of teachers speak the approved
GLOI of the school (“low pupil/high teacher” in Figure 15); (b) 60-80% of pupils and more
than 60% of teachers speak the GLOI of the school (“medium pupil/medium teacher” and
“medium pupil/high teacher”); (c) more than 80% of pupils and fewer than 80% of teachers
speak the GLOI of the school (“high pupil/low teacher” and “high pupil/medium teacher”).
Finally, a school is designated as having low overall language match in the following situations:
(a) fewer than 80% of pupils and fewer than 60% of teachers reported speaking the GLOI of
the school (“low pupil/low teacher”) or (b) fewer than 60% of pupils and fewer than 80% of
teachers reported speaking the GLOI of the school (“low pupil/medium teacher” or “medium
The analysis on overall language match results in the following key finding:
KEY FINDING #4: Under the language match framework typology, 46% of schools
have high overall language match, 41% of schools have medium overall
language match, and 13% of schools have low overall language match.

30
pupil/low teacher”).9Although the low category can seem restrictive—after all, even in the
upper left cell, the schools fall in the lowest match even if 50% of pupils and teachers speak
the language of instruction—this exercise is intended to serve as the first step for identifying
areas and schools where the GLOI match is less than ideal. The cut-off points were selected
to create a typology of schools for which specific recommendations for language policy
implementation can be made.
Notably, teaching and learning materials (TLM) do not factor into this language match
framework, both to preserve the clarity of the two-dimensional cross section, and as a
recognition of the fact that TLM are not, per se, elements of the “linguistic diversity context”
but rather respond to it and are subject to resource availability (not only linguistic
constraints). However, data on availability of TLM are presented as additional descriptive
elements across all of these categories in Section D, and factor into a composite Language
Match Index (LMI), which is included in Annex I.
Table 7. The Language Match Framework
Legend: LOW OVERALL MATCH / MEDIUM OVERALL MATCH / HIGH OVERALL MATCH Teacher language match:
% of KG1-P3 teachers who speak the GLOI of the school
Low teacher match:
< 60% of teachers
Medium teacher match:
60% - 79% of teachers
High teacher match:
> 80% of teachers
Pupil
language
match: % of
KG1-P3
pupils who
speak the
GLOI of
the school
Low pupil match:
< 60% of pupils
Low pupil/low
teacher
Low pupil/medium
teacher
Low pupil/high
teacher
Medium pupil match:
60% - 80% of pupils
Medium pupil/low
teacher
Medium pupil/medium
teacher
Medium pupil/high
teacher
High pupil match:
> 80% of pupils
High pupil/low
teacher
High pupil/medium
teacher
High pupil/high
teacher
Applying the Language Match Framework
Under this typology, 46% of schools have high overall language match, 41% of schools have
medium overall language match, and 13% of schools have low overall language match. Table 8
and Figure 15 show the proportion of schools that fall into each overall match category (inner
ring in Figure 15) and sub-category (outer ring in Figure 15). For instance, Figure 15 shows
that for schools that fall in the low overall language match designation (13% of all schools), 7%
of schools can be categorized as low pupil/low teacher, 5% of schools as low pupil/medium
teacher and 1% of schools as medium pupil/low teacher. In other words, the proportion of
low overall language match schools is driven by low pupil match.
9 As a reminder, the cutoff categories were set by the Learning team as initial parameters for analysis.
In the absence of prior empirical data on language match for reading acquisition, these parameters
provide a theory-based framework. As more data become available on the linkages between language
match and reading outcomes, these thresholds can be reassessed.

31
Table 8. Overall language match (% of schools), based on study districts
Teacher language match:
% of KG1-P3 teachers who speak the GLOI of the school
Low teacher match:
< 60% of teachers
Medium teacher match:
60% - 79% of teachers
High teacher match:
> 80% of teachers
Pupil
language
match: % of
KG1-P3
pupils who
speak the
GLOI of
the school
Low pupil match:
< 60% of pupils
405 schools
(6.5%)
336 schools
(5.4%)
1221 schools
(19.5%)
Medium pupil match:
60% - 80% of pupils
69 schools
(1.1%)
96 schools
(1.5%)
484 schools
(7.7%)
High pupil match:
> 80% of pupils
260 schools
(4.4%)
499 schools
(8%)
2899 schools
(46.2%)
Figure 15. School language match (% of schools)
As the figure shows, in a hypothetical situation of full teacher language match, the overall
match would increase by 12 percentage points, bringing the proportions of school with high
overall match to 58%. In the next section, the report shows the variation of overall match
across languages and regions.
How does overall language match vary by GLOI and region?
This section breaks down the estimates of overall language match, i.e., how both pupil and
teacher language skills align with the GLOI according to the framework described above, by
GLOI and region. Results are presented in Figure 16.
Lowmatch
schools13%
Medium match schools
41%
High match schools
46%
Low pupil/Low teacher7% Low pupil/Medium teacher
5%
Medium pupil/Low teacher1%
Low pupil/High teacher 20%
Medium pupil/High teacher8%
Medium pupil/Medium teacher1%
High pupil/Low teacher4%
High pupil/Medium teacher 8%
High pupil/High teacher46%
N = 6,269

32
Figure 16 shows that Ewe and Dagaare have the greatest proportions of schools with high
overall language match, with 86% and 81% of schools with those GLOIs, respectively in the
high match category. These two GLOIs stand out as having comparatively strong levels of high
overall language match, because all other GLOIs have only approximately 50% or fewer
schools with high match. Notably, Ga, Akuapim Twi, and Gonja have fewer than 20% of
schools in the high match category, with 3%, 15%, and 15% of schools in each, respectively,
having high match. Ga (with 64% of schools), followed by Kasem (with 42% of schools),
Akuapim Twi (with 38% of schools), and Gonja (31% of schools), is the GLOI with the highest
proportion of schools with low overall language match. Strikingly, no Dagaare schools fall in
the lower match category, and only 2% of Ewe schools and 5% of Dangme schools do.
Ga is historically the language of the people from the Greater Accra region and remains in
strong use in many Ga communities across Greater Accra, which explains its choice as one
of the GLOI for the region. However, with increasing urbanization, Accra has become a
multilingual metropolis. This may explain the very small percentage of higher match schools
using Ga as GLOI. In cases where GLOI and region overlap almost perfectly, the distribution is the same in Figure 16 as would be expected; this is the case for Upper East/Kasem, Upper
West/Dagaare, and Volta/Ewe. Figure 16 underscores the complexity of the language
landscape and the differences between regions and GLOI.
Figure 16. Overall language match by GLOI and region (% of schools), based on study districts
Figure 17 maps the location of low, medium, and high language match schools across the 100
districts targeted by Learning, providing a geospatial lens on the regional results overall
language match presented in Figure 16. Figure 17 shows schools with all three categories of
language match layered in one map (at top), as well separate maps with schools in each match
categories (at bottom) for clarity. The maps illuminate trends identified in Figure 16 , for

33
example, that Volta and Upper West have large proportions of schools with high overall
language match (87% and 81% of schools, respectively), that Brong Ahafo has large
proportions of schools with medium overall language match (68% of schools there), and that
Upper East and Greater Accra have relatively large proportions of schools with low overall
language match (41% and 39% of schools, respectively).
Annex I presents additional analyses. Specifically, Figure 22 and Figure 23 include scatterplots
showing the percentage of pupils speaking the GLOI on the horizontal x-axis against the
percentage of teachers on the vertical y-axis—with each dot representing one school— by
region and by GLOI. This allows to better understand the differences between schools.

34
Figure 17. Higher, medium, and lower match schools across 100 districts in Ghana

35
How do the proportions of schools with no KG1-P3 pupils and no KG1-P3 teachers
who speak the GLOI vary by GLOI and region?
Next, the analysis looks at the extreme cases of low overall match where no teachers and no
pupils speak the GLOI. Figure 18 presents these results across the 100 Learning districts—
indicating that, on average, just 1% of schools experience this type of mismatch with the GLOI.
Figure 18 also documents how the proportions of schools with no pupils or teachers speaking
the GLOI varies by GLOI and region. It reinforces the findings from previous sections that
Kasem-medium schools, which tend to be in Upper East, face particularly severe challenges
with alignment of pupil and teacher language skills to the GLOI—13% of Kasem/Upper East
schools have no pupils or teachers who speak the GLOI. Similarly, earlier sections have
highlighted the challenges faced by Ga-medium schools, which are typically in Greater Accra.
Of Ga/Greater Accra schools, 4% have no pupils or teachers who speak the GLOI. For other
GLOIs and regions, 2% or fewer schools face these acute challenges with language match.
Figure 18. Proportion of schools with no KG1-P3 pupils and no KG1-P3 teachers who speak the GLOI, by GLOI and region, based on study districts
How do the proportions of schools where all pupils and all KG1-P3 teachers speak
the GLOI vary by GLOI and region?
This section examines the extreme cases of high overall language match where all pupils and
teachers speak the GLOI. On average, this occurs in 19% of all schools included in the study,
as noted in Figure 19.
Breaking down this finding by GLOI and region, Figure 19 highlights that certain GLOI and
regions have strong overall match relative to others. For example, in 57% of Ewe-medium
schools (which are nearly always in Volta) all pupils and teachers speak the GLOI. Similarly, in
Dagaare-medium schools (which, among the districts in this study, are all within Upper West)

36
52% of schools all pupils and teachers speak the GLOI. These estimates are more than twice
as high as any other GLOI or region. Notably, among GLOI, no Gonja or Ga-medium schools
and just 1% of Akuapim Twi-medium schools have all pupils and teachers who speak the GLOI.
This is also the case for 4% of schools in Western, 6% of schools in Brong Ahafo, 6% of
schools in Greater Accra, and 7% of schools in Ashanti. As presented in the pupil-language
match section in Figure 10, these are highly linguistically diverse areas that are less likely to
have pupils, as well as staff, from a common language background.
Figure 19. Proportion of schools where all KG1-P3 pupils and KG1-P3 teachers speak the GLOI, by GLOI and region, based on study districts
Once again, the study shows that there is great variability in the degree of alignment between pupil and teacher language skills and the GLOI, with different types of challenges more
common for certain GLOIs and regions and less so for others. In the following section, the
report addresses another aspect of school language environments: teaching and learning
materials.
D. AVAILABILITY OF TEACHING AND LEARNING MATERIALS IN GLOI
For this study, the research team examined the availability and use of a range of teaching and
learning materials (TLM). The data revealed that overall, schools have limited access to
teaching and learning materials in the approved GLOI of the school. Some materials
in the survey were intended for small, limited projects, but others were intended to be
nationwide. For example, NALAP and the Integrated Approach were nationwide programs and
as such, were expected to have fairly complete national coverage. However, the data shows
that these materials are available in only 19%–66% of surveyed schools, depending on the
region and material (see the excerpt from Annex I Table 11 below). The full TLM results are

37
presented in Tables 11 and 12 in the Annex I.
Excerpt from Table 11 in Annex I: Availability of reading program materials in the GLOI, by region (% of schools)
Centr
al
Eas
tern
Gre
ater
Acc
ra
Bro
ng
Ahaf
o
Ash
anti
Volta
Upper
Eas
t
West
ern
Nort
hern
Upper
West
Tota
l
Integrated Approach 60% 66% 64% 57% 57% 59% 50% 49% 28% 29% 54%
Let's Read and Write 51% 51% 45% 41% 44% 42% 42% 39% 27% 51% 43%
NALAP pupil book 34% 37% 32% 34% 31% 21% 38% 34% 48% 30% 33%
NALAP big book 52% 58% 52% 47% 47% 42% 39% 50% 51% 34% 48%
NALAP teacher book 33% 38% 30% 31% 30% 17% 36% 27% 40% 19% 29%
The results for other types of TLM such as teacher guides, pupil readers, pupil workbooks,
and others mirror those for the reading program materials. Generally, other TLM are not
available in the GLOI, with the exception of teacher guides in Akuapim Twi, Fante, and Ga
and teacher-made teaching aids in Gonja. Overall, there seemed to be more TLM
available in Akuapem Twi, Dangme, Fante, and Ga than other GLOI (at the time
of data collection), especially for the Integrated Approach materials (see overall
TLM sub-index in the last row of Table 10 in the Annex). These languages may have
a higher rate of TLM because of proximity to Accra or because of the presence of certain
limited-scope projects operating in these language areas. For example, Ga is the GLOI in many
schools in Greater Accra, which makes it an easy place to test out and distribute materials
even if a project does not go to scale.

38
CONCLUSIONS AND
RECOMMENDATIONS This study begins to flesh out the remarkable linguistic diversity of the education environment
in the early grades of Ghana’s public primary schools and clearly identifies language match
challenges that need to be addressed. According to the data, many schools are not well-
matched to their currently assigned GLOI. The immediate result is that some pupils may not
be receiving instruction in a linguistic environment that is conducive to learning achievement
and long-term academic success. Short-term but impactful solutions may involve an immediate
review and adjustment to teacher deployment and management policies, a review of the
assigned and approved GLOI of schools and districts, a review of teacher qualification
requirements, and a focused analysis and the updating of teacher skills critical to successfully
operating in complex multi-lingual classrooms.
Teacher language match is one key part of the challenge. The study reveals that more than
80% of teachers report speaking the GLOI “confidently” or “very confidently”; however, in
2.6% of schools there are no teachers who speak the GLOI. This means that almost 20%, or
a fifth of teachers in the classroom, do not speak the GLOI with confidence. Ghana’s aim
should be that all teachers speak the language of instruction of their pupils at an adequate level to allow all pupils a chance at academic success. Improving teacher language match may
be a relatively simple solution over the medium term with a focused adjustment to teacher
deployment policies and practices. Going forward, if teachers are only deployed to schools
where they speak the GLOI, much of the mismatch would be addressed. In the longer-term,
providing incentives for teachers to expand their repertoire of GLOI, and increasing their
access to courses for less-widely spoken languages, would help further.
Strengthening pupil language match with GLOI is a more challenging issue. Pupils cannot be
easily and cost-effectively moved around according to the language they speak at home or are
most familiar with. Therefore, the education system needs to find equitable and effective ways
to meet children’s basic linguistic and academic needs close to where they live. The pupil
language mismatch can have substantial implications for equity if the language needs of only
some pupils are addressed, while others are left to struggle with instructional support in an
unfamiliar language. In 26% of schools, pupil match is not a problem: all pupils speak the GLOI.
However, in 7% of schools where no pupils speak the assigned GLOI, it is an urgent issue.
Finally, in the remaining 67% of schools, there is some degree of pupil mismatch, which means
that in those schools, at the very least, teachers need support to meet the linguistic needs of
pupils. The recommendations below provide suggestions for addressing the various issues
related to school, teacher and pupil language match10.
Conclusion #1: In 42% of schools, the approved GLOI of the school is not well aligned with
the home languages spoken by pupils (corresponding to schools in the medium pupil language
match and low pupil language match categories). In fact, in 7% of all schools, no pupils reported
speaking the GLOI of the school as their home language. In only 26% of schools is it perfectly
aligned.
10 A full recommendations table is provided in Annex II.

39
Key Recommendation #1a (long-term recommendation): Re-examine the official
GLOI assigned to each school to make sure that each school has the most appropriate
of the 11 approved languages as its GLOI.
Key Recommendation #1b (long-term recommendation): Review the status of
other languages beyond the 11 approved GLOI to determine whether they could
qualify for approval as a GLOI. This recommendation aligns with the revised 2016
Draft LPIE, which articulates a process by which additional languages can be approved
for instruction.
Conclusion #2: Linguistic diversity in schools is high: in 73% of schools, the pupil population
speaks at least two languages.
Key Recommendation #2a (long-term recommendation): In schools where there
are two dominant languages and both are among the 11 approved languages, consider
a formalized two-language system which gives pupils the choice between two GLOI.
In this case, teacher deployment would also need to be considered in order to ensure
that qualified teachers are available for both GLOI.
Key Recommendation #2b (long- and short-term recommendation): Raise
awareness of the learning needs of second language learners, and provide support to
teachers in the instructional approaches geared to these learners. There are research-
based methods for teaching content (such as reading, math, science, and civics) to
language learners while giving attention to their language development simultaneously.
Key Recommendation #2c (long-term recommendation): All teachers should be
required to take courses in second language acquisition and teaching techniques in
pre-service and in-service. At the pre-service level, early grade teachers should be
qualified to teach two or more GLOI. This recommendation also relates to Conclusion
#1 above; in schools where no pupils speak the GLOI, the use of second language
teaching techniques is crucial. Using good second language teaching techniques, a
teacher need not speak the language of the pupils in order to be successful. Many of
these methods can work with 2 more languages in the classroom.
Conclusion #3: Teacher language match is higher than pupil language match. Overall, 82%
of teachers report being able to speak and read in the approved GLOI of their school, while
only 71% of pupils report speaking the GLOI at home. Still, the proportion of teachers who
reported being able to speak the GLOI of their school is not adequate in 27% of schools,
where fewer than 80% of teachers speak the GLOI.
Key Recommendation #3a (long-term recommendation): Revise teacher
deployment policy to prioritize language alignment between teacher language and
GLOI of the school and, where possible, between teacher language and pupil languages.
Teachers should not be eligible for deployments where they have not formally studied
and/or passed a proficiency exam in the GLOI. For some GLOI that are less-widely
spoken by teachers (such as Kasem), incentives may help attract teachers to specialize
in those languages.
Key Recommendation #3b (short-term recommendation): Within schools with
medium and low match conditions, reassign teachers who speak and read the GLOI
to teach reading in the GLOI in the early grades. Work with teachers and community
leaders to identify sources of language support for the GLOI and/or pupil home
language where reassigning teachers is not possible. 

40
In sum, these conclusions and recommendations offer several insights and proposed steps to
address the challenges with language match in Ghana’s early grade classrooms in public
primary schools. These recommendations are based on data from an extensive study of the
linguistic context in Ghanaian schools, examining the level of match between the assigned
GLOI, and the languages spoken by pupils, teachers, and used in available TLM for reading
instruction. This evidence will inform the formation of the language policy and offer a
foundation for the development of the teacher rationalization assessment and subsequent
teacher deployment policies. Learning will ensure that the full scope of the findings, conclusions
and recommendations is made available to policy makers of the MoE and GES for the review
and finalization of the 2016 Draft Language Policy in Education.

41
REFERENCES
Nsoh, A. E. and Ababila J. A. (2013). Indigenous Language Policy and Planning in Ghana: the
Role of Politics, Proceedings of the 42nd Linguistics Colloquium “Language Diversity and
Language Learning: New Paths to Literacy” published by Peter Lang.
Nsoh, A.E. and Lugogye R. B. (2001). The Displacement of the Ghanaian Languages: The role
of the Ghanaian mentality. Journal of Ghanaian Languages. Pp 15–21.
Owu-Ewie, C., & Eshun, E.S., Language representation in the Ghanaian Lower primary (schools)
classroom: The case of some schools in the Central and Western Regions of Ghana. Ghana: Accra;
Manuscript shared by author, 2018.
Trudell, B. (2016). The impact of language policy and practice on children's learning: Evidence from
Eastern and Southern Africa. Report commissioned by UNICEF Eastern and Southern Africa
Regional Office, Basic Education and Gender Equality Section. UNICEF.

42
ANNEX I: ADDITIONAL
ANALYSES
This annex includes additional analyses to further explore findings described in the main body
of the report.
A. GLOI IN LEARNING DISTRICTS
Figure 20 shows the approved GLOI for each school surveyed based on the GPS coordinates
gathered during the language mapping activity. Some GLOI only appear in certain regions (for
example, Dagaare in Upper West, Kasem in Upper East, Dagbani, and Gonja in Northern)
while others straddle several regions (for example, Asante Twi in Brong Ahafo, Ashanti and
Western, Fante in Western and Central).
Figure 20. Map of GLOI across Learning districts
B. LINGUISTIC DIVERSITY IN KG1-P3 CLASSROOMS
Figure 21 presents the number of home languages represented within classrooms, with results
ranging from one language per classroom to six or more languages per classroom. This analysis
supplements Figure 10, which presented linguistic diversity at the school-level rather than the
classroom-level.
Figure 21 shows that 50% of classrooms are monolingual, i.e., in 50% of classrooms all pupils
have the same home language. An additional 22% of classrooms have pupils from two home
language backgrounds and the remaining 29% of classrooms have pupils from three or more

43
home language backgrounds.
Considering results by GLOI, classrooms in schools with Ewe, Dagaare, Dangme, and Kasem
as the GLOI most commonly have pupil populations that speak one common home language,
with 89% of classrooms, 85% of classrooms, 81% of classrooms, and 75% of classrooms,
respectively, with pupils who share a home language background. By comparison, fewer than
20% of classrooms in Ga and Gonja-medium schools have pupils from a shared home language
background, with only 6% of classrooms in Ga-medium schools and 9% of classrooms in
Gonja-medium schools serving monolingual pupil populations.
At the regional level, Volta and Upper West have the highest proportions of classrooms with
pupils from one home language background, with 90% and 85% of classrooms, respectively, in
those regions having students from one language background. Classrooms in Western and
Brong Ahafo, in contrast, have much more linguistic diversity, with 71% of classrooms serving
pupils from two or more language backgrounds in each region.
Figure 21. Number of languages spoken by KG1-P3 pupils in classrooms (% of classrooms), based on study districts
C. SCHOOL LANGUAGE MATCH SCATTERPLOTS BY REGION AND GLOI
Figure 22 and Figure 23 below shows plot the percentage of pupils speaking the GLOI on the
horizontal x-axis against the percentage of teachers on the vertical y-axis—with each dot
representing one school—to better understand the differences between schools. The
clustering of dots closer toward zero on either axis indicates lower match on that dimension.
Generally, schools fall on a continuum in all regions, with the exception of Upper West where
virtually all schools are in the top-right (high teacher–high pupil) quadrant. For Ashanti, Brong

44
Ahafo, Eastern, and Volta, teacher-level match is generally good but pupil-level match shows
large variations between schools.
Figure 22. Scatterplots of pupil and teacher match, by region
When looking at the same analysis by approved GLOI (Figure 23), it is clear that schools
where Dagaare is the GLOI generally have both high teacher and high pupil match. All GLOI
have schools where no interviewed teachers speak and/or no pupils speak the GLOI, in
particular Akuapem Twi, Asante Twi, Fante, Ga, and Kasem.

45
Figure 23. Scatterplots of pupil and teacher match, by GLOI
D. LANGUAGE MATCH INDEX The questionnaires used for the language mapping study provide a rich set of data beyond the
key questions discussed in the body of this report. In the report, to determine the level of
match between the GLOI and teachers and between the GLOI and pupils, the evaluation team
selected one key question. In the method detailed below, instead of selecting one single
question, the evaluation team constructed an index to aggregate information from multiple
questions related to language ability. This allows us to take into consideration additional data
points to provide a more nuanced understanding of language match since this Language Match
Index (LMI) yields one single score that takes into account teacher, pupil, and teaching and
learning materials (TLM) match.
Language Match Index construction
The LMI is a quantitative approach to assessing the level of match between the approved
GLOI and: 1) the teacher language, 2) the pupil language, and 3) the language of the available
TLM. Table 9 shows the questions that were included in the estimation of match across each of these dimensions. As the table indicates, under the teacher language dimension, the
evaluation team identified whether teachers speak the language of instruction fluently and
whether they deliver classroom instruction using the GLOI. Similarly, for the pupil dimension,
the evaluation team captured survey information on whether pupils in a given school speak
the GLOI at all, at home, and in the playground. Third, the TLM portion of the index looks at
the proportion of all materials that are supplied in the assigned GLOI.
Given that all survey items are binary, the evaluation team construct an index that is simply
the percentage of all items within each dimension that match the GLOI. This approach re-
weights the individual items such that, in aggregate, each dimension is not implicitly weighted
by the number of items it holds. This means, that a dimension with more or fewer items does
not signify a more or less important dimension in determining the overall language-match

46
level. Following the calculation of the teacher, pupil, and TLM LMI, the overall LMI is the sum
of the simple mean across the three indices. The reason behind using simple means for the
index is to create an index that is easy to interpret where the index ranges from 0 to 100,
with 0 indicating perfect incompatibility with the GLOI across all dimensions, and 100
indicating perfect compatibility with the GLOI.
Thus, the overall LMI is simply the average across the three language dimensions on
a scale from zero to 100, where 100 indicates a full match between the assigned LOI and
the three aforementioned dimensions, and zero reflects the opposite.11
Why construct such index scores? This allows us to combine data from multiple questions
to get a more nuanced understanding of the language environment of the school. For instance,
if pupils speak the GLOI in the playground and at home, it likely indicates that the GLOI is not
only their home language but also the lingua franca of the community and that they may feel
more comfortable with it than if they only spoke it in the playground but not at home.
Similarly, if a teacher indicates that she speaks the GLOI fluently and also uses it for classroom
discussion, to teach reading and writing and to administer exams, one could presume that this teacher has a higher ability in the GLOI than a teacher who stated speaking the GLOI fluently
but does not use it in the classroom at all.
Table 9. Questions included in the calculation of language match sub-indices
Teacher Level Match Sub-Index Materials Level Match Sub-Index –
Availability of following TLM in GLOI
Teacher speaks GLOI
Teacher is fluent in GLOI
Teacher speaks pupils’ first language
Language used by teacher to explain materials is GLOI
Language used by teacher for classroom discussion is GLOI
Language used by teacher to teach reading and writing is GLOI
Language used by teacher to administer exams is GLOI
Integrated Approach
Let's Read and Write
NALAP student book
NALAP teacher's book
EGR manual for literacy
Literacy learning through play
Teacher's guide
Pupil readers
Pupil workbooks
Pupil library books
Big books
Posters
Flash cards
Alphabet strips
Teacher made teaching aids
Other supplementary materials
Pupil Level Match Sub-Index
Classes where most/all pupils speak GLOI
Schools where at least some pupils speak GLOI on playground
Schools where at least some pupils speak GLOI at home
Overall, is there better teacher match, pupil match, or TLM match? Figure 24
shows that the scores for pupil match and teacher match are higher than TLM match, as was
mentioned in the report. The average score is 87 for teacher match, 89 for pupil match, and
27 for TLM match. This indicates that, generally, schools do not have available TLM
in the approved GLOI but that in most schools, teachers and pupils speak the
GLOI.
11 A more detailed description of the language match index is included in Annex 1.

47
Figure 24. Teacher, Pupil, and TLM sub-index scores: higher on teacher and pupil match, low on TLM match
To go beyond the sub-indices and get a sense of overall language match across the 100 districts
targeted by Learning, it is also useful to aggregate the data into one score combining the match
at all three levels (pupil, teacher and TLM). To calculate this overall LMI, the evaluation team
took the average of all three sub-indices for each school. Therefore, a LMI score of 100 means
that a given school answered “yes” to all questions included in Table 9.
It is important to note that the LMI is a relative measure that places schools on a continuum
relative each other based on a combination of factors. This methodological approach allows
for the identification of relative challenge areas that can then be followed up with more in-
depth analysis. A low LMI generally indicates lower match on either teacher or student
dimension (since TLM is a challenge across the board).
The LMI score can be used as a diagnostic tool to understand where specific schools, districts,
and regions fall on the language match continuum. Table 10 shows for each district, the score
for each sub-index as well as for the overall LMI.
Table 10. District-level Language Match Index results
Region District Teacher
Language
Match
Index
Pupil
Language
Match
Index
Materials
Language
Match
Index
Overall
Language
Match
Index
Ashanti Adansi South 92 85.8 32.3 70
Ashanti Ahafo Ano North 93.9 95.7 21 70.2
Ashanti Amansie Central 91.2 98.8 34.9 75
Ashanti Bekwai Municipal 90 97.6 31.7 73.1
Ashanti Asante-Akim Central Municipal 97.2 90.5 33.8 73.8
Ashanti Asante-Akim South 92.9 97.9 22.9 71.2
Ashanti Atwima Mponua 89 95.8 29.3 71.4
Ashanti Bosomtwe 87.9 98.1 20 68.6
Ashanti Ejisu-Juaben Municipal 88.9 97.1 36.7 74.2
Ashanti Kumasi Metropolitan 88.9 95 23.9 69.3
Ashanti Kwabre East 95.6 92.9 23.3 70.6
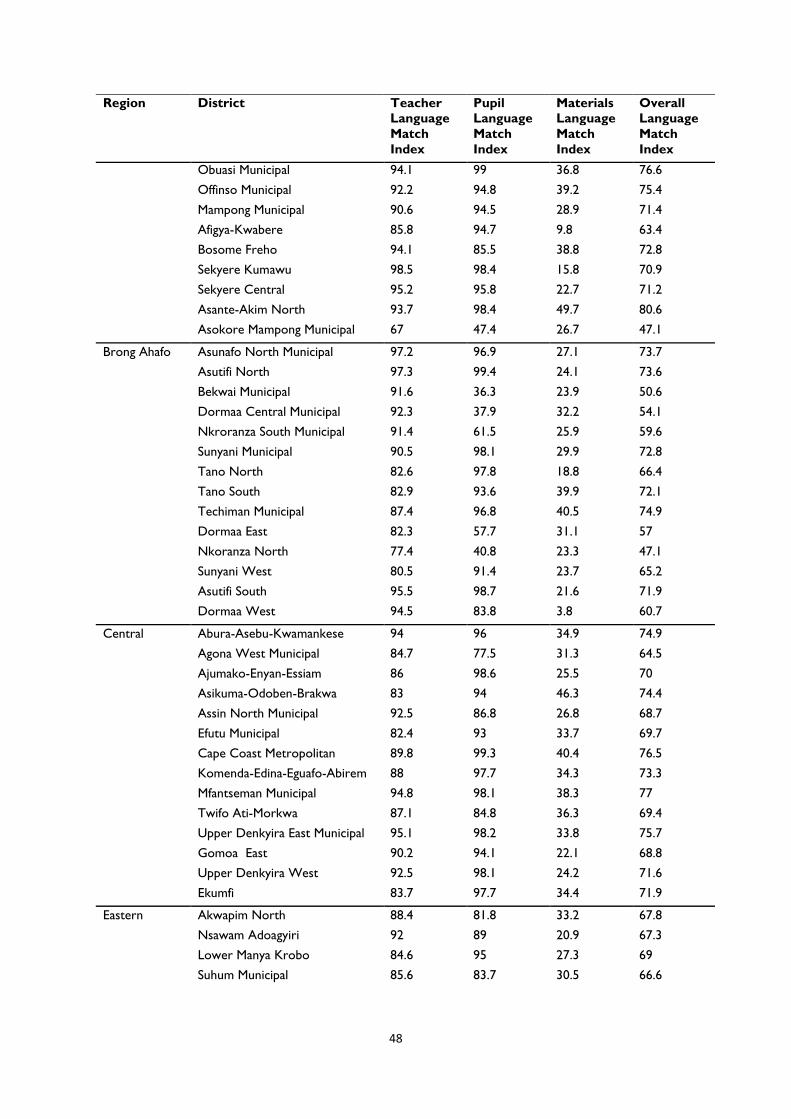
48
Region District Teacher
Language
Match
Index
Pupil
Language
Match
Index
Materials
Language
Match
Index
Overall
Language
Match
Index
Ashanti Obuasi Municipal 94.1 99 36.8 76.6
Ashanti Offinso Municipal 92.2 94.8 39.2 75.4
Ashanti Mampong Municipal 90.6 94.5 28.9 71.4
Ashanti Afigya-Kwabere 85.8 94.7 9.8 63.4
Ashanti Bosome Freho 94.1 85.5 38.8 72.8
Ashanti Sekyere Kumawu 98.5 98.4 15.8 70.9
Ashanti Sekyere Central 95.2 95.8 22.7 71.2
Ashanti Asante-Akim North 93.7 98.4 49.7 80.6
Ashanti Asokore Mampong Municipal 67 47.4 26.7 47.1
Brong Ahafo Asunafo North Municipal 97.2 96.9 27.1 73.7
Brong Ahafo Asutifi North 97.3 99.4 24.1 73.6
Brong Ahafo Bekwai Municipal 91.6 36.3 23.9 50.6
Brong Ahafo Dormaa Central Municipal 92.3 37.9 32.2 54.1
Brong Ahafo Nkroranza South Municipal 91.4 61.5 25.9 59.6
Brong Ahafo Sunyani Municipal 90.5 98.1 29.9 72.8
Brong Ahafo Tano North 82.6 97.8 18.8 66.4
Brong Ahafo Tano South 82.9 93.6 39.9 72.1
Brong Ahafo Techiman Municipal 87.4 96.8 40.5 74.9
Brong Ahafo Dormaa East 82.3 57.7 31.1 57
Brong Ahafo Nkoranza North 77.4 40.8 23.3 47.1
Brong Ahafo Sunyani West 80.5 91.4 23.7 65.2
Brong Ahafo Asutifi South 95.5 98.7 21.6 71.9
Brong Ahafo Dormaa West 94.5 83.8 3.8 60.7
Central Abura-Asebu-Kwamankese 94 96 34.9 74.9
Central Agona West Municipal 84.7 77.5 31.3 64.5
Central Ajumako-Enyan-Essiam 86 98.6 25.5 70
Central Asikuma-Odoben-Brakwa 83 94 46.3 74.4
Central Assin North Municipal 92.5 86.8 26.8 68.7
Central Efutu Municipal 82.4 93 33.7 69.7
Central Cape Coast Metropolitan 89.8 99.3 40.4 76.5
Central Komenda-Edina-Eguafo-Abirem 88 97.7 34.3 73.3
Central Mfantseman Municipal 94.8 98.1 38.3 77
Central Twifo Ati-Morkwa 87.1 84.8 36.3 69.4
Central Upper Denkyira East Municipal 95.1 98.2 33.8 75.7
Central Gomoa East 90.2 94.1 22.1 68.8
Central Upper Denkyira West 92.5 98.1 24.2 71.6
Central Ekumfi 83.7 97.7 34.4 71.9
Eastern Akwapim North 88.4 81.8 33.2 67.8
Eastern Nsawam Adoagyiri 92 89 20.9 67.3
Eastern Lower Manya Krobo 84.6 95 27.3 69
Eastern Suhum Municipal 85.6 83.7 30.5 66.6

49
Region District Teacher
Language
Match
Index
Pupil
Language
Match
Index
Materials
Language
Match
Index
Overall
Language
Match
Index
Eastern Yilo Krobo 83.5 97.3 36 72.3
Eastern Upper Manya Krobo 89 98 38.7 75.2
Eastern Akwapim South 85.2 96.7 21.8 67.9
Greater Accra Ada East 81.7 94.3 25.9 67.3
Greater Accra Ledzokuku-Krowor Municipal 65.7 85.4 29.9 60.3
Greater Accra Ada West 87.2 98.6 30.2 72
Greater Accra Kpone Katamanso 55.3 63.6 38.4 52.5
Greater Accra La Nkwantanang Madina Mun. 46.2 61.7 30.2 46
Northern West Gonja 74.5 75.8 17.9 56.1
Northern Nanumba North 60.5 65.5 27 51
Northern Yendi Municipal 78.4 60.4 35.3 58
Northern Tamale Metropolitan 74.2 99.2 18.4 64
Northern Sagnerigu 83.5 98.7 20.8 67.7
Upper East Kassena-Nankana Municipal 54.2 61.8 39.1 51.7
Upper East Kassena-Nankana West 52.3 58.5 17.9 42.9
Upper West Lawra 90.5 98.4 14.8 67.9
Upper West Nadowli-Kaleo 92.7 99.8 16.2 69.6
Upper West Wa Municipal 92.8 97.9 19 69.9
Upper West Nandom 86.1 86.7 31 67.9
Volta Agotime Ziope 97.2 99.4 22.6 73
Volta Akatsi South 97.8 99.5 28.7 75.3
Volta Anlo (Keta) Municipal 96.6 98.1 20.7 71.8
Volta Kpando 92.3 96.1 26.1 71.5
Volta South Dayi 97.2 97.9 43.7 79.6
Volta Ho Municipal 96.1 98.2 31.9 75.4
Volta Hohoe Municipal 77.3 69.6 15.4 54.1
Volta Ketu South 95.8 97.8 22.6 72.1
Volta Central Tongu 95.6 98.2 22.4 72.1
Volta South Tongu 90.3 97.5 36.8 74.9
Volta Ketu North 97.8 99.6 37.2 78.2
Volta Afadzato South 91.3 83.5 19.2 64.7
Volta Adaklu 98.3 99.8 33.5 77.2
Volta Akatsi North 98.6 98.3 14.1 70.3
Volta North Dayi 94.4 98.5 22 71.7
Volta North Tongu 94.5 98.7 16.1 69.8
Western Ahanta West 80.7 82 26.3 63
Western Wasa Amenfi East 90.9 96.6 21.9 69.8
Western Aowin 90.6 89.8 18.3 66.2
Western Bibiani-Anhwiaso-Bekwai 88.5 73.6 16.2 59.4
Western Jomoro 76.5 84.6 24.7 61.9
Western Juaboso 89.4 92.9 32.9 71.7

50
Region District Teacher
Language
Match
Index
Pupil
Language
Match
Index
Materials
Language
Match
Index
Overall
Language
Match
Index
Western Nzema East Municipal 86.4 90.9 12.6 63.3
Western Sefwi-Wiawso 90.6 91.9 34.8 72.4
Western Sekondi-Takoradi Metropolitan 89.1 98 30 72.4
Western Tarkwa-Nsuaem Municipal 90.3 87.3 30.8 69.4
Western Ellembele 82.8 95.3 12.7 63.6
Western Shama 75.7 96.8 26.7 66.4
Western Bodi 89.4 74 37 66.8
Note: Language Match Indices range from 0 to 100. A score of 0 indicates perfect mismatch between
teacher, student, and material languages, while 100 represents perfect match.
E. AVAILABILITY OF TLM IN GLOI
The two tables below show the percentage of classrooms that reported having the TLM in
the GLOI, by GLOI and by region.
Table 11. Availability of reading program materials in the GLOI, by GLOI
Dan
gm
e
Fan
te
Ga
Aku
ap
im T
wi
Asa
nte
Tw
i
Ew
e
Kase
m
Dagb
an
i
Oth
er
Dagaare
Nzem
a
Go
nja
AV
ER
AG
E
Integrated Approach 69% 63% 53% 65% 54% 58% 51% 28% 30% 29% 46% 28% 54%
Let's Read and Write 59% 50% 28% 44% 42% 42% 43% 27% 45% 51% 32% 14% 43%
NALAP pupil book 39% 32% 40% 30% 34% 21% 38% 50% 36% 31% 31% 14% 33%
NALAP big book 61% 53% 54% 52% 48% 42% 39% 52% 41% 34% 45% 36% 48%
NALAP teacher book 39% 31% 35% 31% 31% 18% 36% 42% 33% 19% 22% 14% 29%
EGR manual for literacy 4% 5% 1% 2% 3% 3% 11% 5% 3% 5% 1% 9% 3%
Literacy Learning
through Play 6% 8% 1% 2% 6% 2% 10% 13% 15% 7% 3% 3% 6%
Teacher's guide 54% 63% 55% 67% 55% 49% 33% 36% 22% 30% 40% 32% 53%
Pupil readers 45% 39% 33% 29% 32% 35% 41% 38% 36% 54% 32% 34% 36%
Pupil workbooks 25% 15% 14% 11% 14% 9% 17% 11% 33% 10% 6% 6% 13%
Pupil library books 25% 21% 12% 13% 23% 21% 23% 18% 34% 18% 6% 3% 21%
Big books 46% 40% 33% 42% 33% 32% 18% 27% 25% 20% 30% 23% 34%
Posters 37% 46% 57% 41% 40% 37% 35% 23% 21% 15% 25% 21% 38%
Flash cards 29% 36% 49% 24% 22% 22% 32% 17% 14% 13% 14% 19% 24%
Alphabet strip 25% 26% 38% 15% 14% 13% 20% 13% 10% 8% 5% 10% 16%
Material for teacher-
made teaching aids 43% 47% 45% 45% 32% 58% 13% 16% 19% 17% 18% 65% 38%
Other supplementary
materials 3% 3% 2% 1% 3% 1% 2% 3% 3% 1% 0% 1% 2%
Materials match index 34 33 31 29 27 26 26 23 23 20 19 19 28
Notes: (a) Language Match Indices range from 0 to 100. A score of 0 indicates perfect mismatch between teacher, student, and material

51
languages, while 100 represents perfect match; (b) Yendi Municipal, which was surveyed first, is not included in summary statistics on the
NALAP big book because the survey did not ask about NALAP big books in that round.
N (teachers): 30,780
Table 12. Availability of reading program materials in the GLOI, by region
Cen
tral
East
ern
Gre
ate
r A
ccra
Bro
ng A
hafo
Ash
an
ti
Vo
lta
Up
per
East
West
ern
No
rth
ern
Up
per
West
To
tal
Integrated Approach 60% 66% 64% 57% 57% 59% 50% 49% 28% 29% 54%
Let's Read and Write 51% 51% 45% 41% 44% 42% 42% 39% 27% 51% 43%
NALAP pupil book 34% 37% 32% 34% 31% 21% 38% 34% 48% 30% 33%
NALAP big book 52% 58% 52% 47% 47% 42% 39% 50% 51% 34% 48%
NALAP teacher book 33% 38% 30% 31% 30% 17% 36% 27% 40% 19% 29%
EGR manual for literacy 6% 3% 5% 2% 2% 3% 11% 3% 6% 5% 3%
Literacy Learning through Play 11% 4% 2% 4% 5% 2% 10% 5% 12% 7% 6%
Teacher's guide 59% 63% 54% 59% 57% 49% 33% 52% 36% 30% 53%
Pupil readers 44% 34% 40% 29% 31% 35% 41% 33% 38% 54% 36%
Pupil workbooks 18% 19% 16% 15% 13% 9% 17% 10% 12% 10% 13%
Pupil library books 24% 20% 18% 24% 21% 21% 23% 17% 18% 18% 21%
Big books 38% 43% 43% 30% 35% 32% 17% 36% 27% 20% 34%
Posters 46% 39% 47% 41% 40% 37% 35% 35% 22% 15% 38%
Flash cards 37% 27% 35% 20% 23% 22% 32% 21% 16% 13% 24%
Alphabet strip 28% 21% 25% 14% 13% 12% 20% 12% 12% 8% 16%
Material for teacher-made
teaching aids 44% 44% 44% 38% 29% 58% 13% 30% 19% 17% 38%
Other supplementary
materials 3% 1% 3% 2% 4% 1% 2% 1% 3% 1% 2%
Materials match index 34 32 31 28 27 26 26 25 23 2 28
Notes: (a) Language Match Indices range from 0 to 100. A score of 0 indicates perfect mismatch between teacher, student,
and material languages, while 100 represents perfect match; (b) Yendi Municipal, which was surveyed first, is not included
in summary statistics on the NALAP big book because the survey did not ask about NALAP big books in that round.
N (teachers): 30,779

52
ANNEX II: RECOMMENDATIONS
TABLE Table 13. Summary of policy and practice recommendations to address different types of language match and mismatch
Pupil Match
80–100%
Pupil Match
50–79%, 1
other L1
Pupil Match
50–79%, 2+
other L1s
Pupil Match
0–49%, 1
other L1
Pupil Match
0–49%, 2+
other L1s
High
Teacher
Match
Training for all
teachers, pre-
and in-service
on L2 teaching
techniques.
~Need to allow
extra time to
teach expected
curriculum—
depth over
breadth.
~If other L1 is
another of the
11 GLOI,
explore a
bilingual system.
~If other L1 is
not one of 11
GLOI, 1) can it
be approved? 2)
incentives for
teachers to
participate in
CPD on L2
teaching
techniques.
~Provide
teachers with
additional
materials for
and guidance on
making
instructional
materials.
~Work with
schools to
identify
additional
support—
teaching
assistants and
parent
volunteers.
~Need to allow
extra time to
teach expected
curriculum—
depth over
breadth.
~Incentive for
teachers to
participate in
CPD on L2
teaching
techniques.
~Provide
teachers with
additional
materials for
and guidance on
making
instructional
materials.
~Work with
schools to
identify
additional
support –
teaching
assistants and
parent
volunteers.
~Need to allow
extra time to
teach expected
curriculum—
depth over
breadth.
~If other L1 is
another of the
11 GLOI,
explore a
bilingual system
or a change of
GLOI.
~If other L1 is
not one of 11
GLOI, 1) can it
be approved? 2)
incentives for
teachers to
participate in
CPD on L2
teaching
techniques.
~Provide
teachers with
additional
materials for
and guidance on
making
instructional
materials.
~Work with
schools to
identify
additional
support—
teaching
assistants and
parent
volunteers.
~Need to allow
extra time to
teach expected
curriculum—
depth over
breadth.
~Incentives for
teachers to
participate in
CPD on L2
teaching
techniques.
~Provide
teachers with
additional
materials for
and guidance on
making
instructional
materials.
~Work with
schools to
identify
additional
support—
teaching
assistants and
parent
volunteers.
Low Teacher
match, T
~Review
teacher
~Review
teacher
~Review
teacher
~Review
teacher
~Review
teacher

53
Pupil Match
80–100%
Pupil Match
50–79%, 1
other L1
Pupil Match
50–79%, 2+
other L1s
Pupil Match
0–49%, 1
other L1
Pupil Match
0–49%, 2+
other L1s
does not
speak pupil
L1
deployment.
~Incentive for
teacher to 1)
relocate with
support
identifying
another post
or 2) study the
GLOI of the
area.
deployment.
Incentive for
teacher to 1)
relocate with
support
identifying
another post or
2) study the
GLOI of the
area.
~Work with
schools to
identify
additional
support—
teaching
assistants and
parent
volunteers.
deployment.
Incentive for
teacher to 1)
relocate with
support
identifying
another post or
2) study the
GLOI of the
area.
~Work with
schools to
identify
additional
support—
teaching
assistants and
parent
volunteers.
deployment.
Incentive for
teacher to 1)
relocate with
support
identifying
another post or
2) study the
GLOI of the
area.
~Work with
schools to
identify
additional
support—
teaching
assistants and
parent
volunteers.
deployment.
Incentive for
teacher to 1)
relocate with
support
identifying
another post or
2) study the
GLOI of the
area.
~Work with
schools to
identify
additional
support—
teaching
assistants and
parent
volunteers.
Low Teacher
Match, T
speaks pupil
L1
N/A ~Need to allow
extra time to
teach expected
curriculum—
depth over
breadth.
~If other L1 is
another of the
11 GLOI,
explore a
bilingual system.
~If other L1 is
not one of 11
GLOI, 1) can it
be approved? 2)
incentives for
teachers to
participate in
CPD on L2
teaching
techniques.
3) incentives for
teachers to take
courses in the
GLOI.
~Provide
teachers with
additional
materials for
and guidance on
making
instructional
N/A (not
enough of 1 L1)
~Need to allow
extra time to
teach expected
curriculum—
depth over
breadth.
~If other L1 is
another of the
11 GLOI,
explore a
bilingual system
or a change of
GLOI.
~If other L1 is
not one of 11
GLOI, 1) can it
be approved? 2)
incentives for
teachers to
participate in
CPD on L2
teaching
techniques.
~Provide
teachers with
additional
materials for
and guidance on
making
instructional
materials.
~Work with
N/A (not
enough of 1 L1)

54
Pupil Match
80–100%
Pupil Match
50–79%, 1
other L1
Pupil Match
50–79%, 2+
other L1s
Pupil Match
0–49%, 1
other L1
Pupil Match
0–49%, 2+
other L1s
materials.
~Work with
schools to
identify
additional
support—
teaching
assistants and
parent
volunteers.
schools to
identify
additional
support—
teaching
assistants and
parent
volunteers.

55
ANNEX III: DATA COLLECTION
INSTRUMENTS Note: the instruments were programmed directly into Open Data Kit (ODK). The
instruments below do not show the skip logic as it is built into the ODK file.
TEACHER
class Q1: Which class does this teacher teach?
G1 Teacher Background
q1 Q2: How long have you been a teacher in this school?
q2 Q3: How long have you been a teacher overall?
q3 Q4: Have you completed the teacher training college?
q4 Q5: What is the highest level of education you have completed?
q5 Q6: What is the teacher's rank?
G2 Assignment
Item Q7: Which grade(s) do you teach?
q6 KG1
q7 KG2
q8 P1
q9 P2
q10 P3
q11 P4
q12 P5
q13 P6
q14 Q8: What is the approved Ghanaian language of instruction for the lower primary of this school?
G3 Ghanaian Language of Instruction
Item Items
q15 Q10: Are you aware of the existence of a language policy in Ghana?
q16 Q11: Are you facing any challenges in using the approved Ghanaian language of instruction as the
medium of instruction for your class?
q18 Q12: Do most (or all) of the pupils in your class speak the approved Ghanaian language of instruction
fluently?
q19 Q13: Do you speak the first language of the majority of pupils you teach?
q20 Q14: Have you received any training in using the approved Ghanaian language ofiInstruction of this
school as your medium of instruction?
q220 Q15: How confident do you feel about speaking the approved Ghanaian language of instruction?
q221 Q16: How confident do you feel about reading the approved Ghanaian language of instruction?
q222 Q17: How many years have you spoken the approved Ghanaian language of instruction?
q223 Q18: With whom do you speak the approved Ghanaian language of instruction?
q224 Q19: Where did you learn to read the approved Ghanaian language of instruction?

56
q225 Q20: Where did you learn to write the approved Ghanaian language of instruction?
G4 Teaching Strategies
Item Q21: What challenges do you face in using the approved Ghanaian language of instruction as the medium
of instruction in the lower primary grades?
q21 Your ability to teach in the Ghanaian language of instruction
q22 Pupils' ability to speak and understand the Ghanaian language of instruction
q23 Availability of teaching and learning materials in the Ghanaian language of instruction
q24 Negative views from the community toward teaching in the language of instruction
q25 Other
q26 Q22: What other challenges do you face in using the approved Ghanaian language of instruction as the
medium of instruction in the lower primary grades?
G5 Teaching Strategies
Item Q23: What strategies do you use to teach reading and writing?
q27 Teach in English
q28 Have teachers who speak the language of instruction teach Ghanaian language across classes
q29 Have pupils translate for each other
q30 Other
q31 Q24: What other strategies do you use to teach reading and writing?
G6 New Material
Item Q25: What languages do you use to explain new material to the pupils?
q32 Akuapim Twi
q33 Asante Twi
q34 Dagaare
q35 Dagbani
q36 Dangme
q37 Ewe
q38 Fante
q39 Ga
q40 Gonja
q41 Gurene
q42 Kasem
q43 Kusaal
q44 Nzema
q45 Other
q46 Q26: What other languages do you use to explain new material to the pupils?
G7 Classroom Discussion
Item Q7: What languages do you use for classroom discussion?
q47 Akuapim Twi
q48 Asante Twi
q49 Dagaare
q50 Dagbani

57
q51 Dangme
q52 Ewe
q53 Fante
q54 Ga
q55 Gonja
q56 Gurene
q57 Kasem
q58 Kusaal
q59 Nzema
q60 Other
q61 Q28: What other languages do you use for classroom discussion?
G8 Read and Write
Item Q29: What languages do you teach your pupils to write in?
q62 Akuapim Twi
q63 Asante Twi
q64 Dagaare
q65 Dagbani
q66 Dangme
q67 Ewe
q68 Fante
q69 Ga
q70 Gonja
q71 Gurene
q72 Kasem
q73 Kusaal
q74 Nzema
q75 Other
q76 Q30: What other languages do you teach your pupils to write in?
G9 Exams
Item Q31: In what language are the exams you give your pupils?
q77 Akuapim Twi
q78 Asante Twi
q79 Dagaare
q80 Dagbani
q81 Dangme
q82 Ewe
q83 Fante
q84 Ga
q85 Gonja
q86 Gurene

58
q87 Kasem
q88 Kusaal
q89 Nzema
q90 Other
q91 Q32: In what other languages are the exams you give your pupils?
G10 Language Fluent
Item Q33: For each Ghanaian language ask the teacher if they speak the language fluently, partially, or not at
all.
q92 Akuapim Twi
q93 Asante Twi
q94 Dagaare
q95 Dagbani
q96 Dangme
q97 Ewe
q98 Fante
q99 Ga
q100 Gonja
q101 Gurene
q102 Kasem
q103 Kusaal
q104 Nzema
G11 Education
Item Q34: What Ghanaian languages have you learned at college of education or university?
q105 Akuapim Twi
q106 Asante Twi
q107 Dagaare
q108 Dagbani
q109 Dangme
q110 Ewe
q111 Fante
q112 Ga
q113 Gonja
q114 Gurene
q115 Kasem
q116 Kusaal
q117 Nzema
q118 Other
q119 Q35: What other languages have you learned at college of education or university?
G11b Education
Item Q36: What Ghanaian languages have you learned in secondary school?
q205 Akuapim Twi

59
q206 Asante Twi
q207 Dagaare
q208 Dagbani
q209 Dangme
q210 Ewe
q211 Fante
q212 Ga
q213 Gonja
q214 Gurene
q215 Kasem
q216 Kusaal
q217 Nzema
q218 Other
q219 Q37: What other languages have you learned in secondary school?
G12 Language Playground
Item Q38: What Ghanaian languages do the children in your school speak on the playground?
q120 Akuapim Twi
q121 Asante Twi
q122 Dagaare
q123 Dagbani
q124 Dangme
q125 Ewe
q126 Fante
q127 Ga
q128 Gonja
q129 Gurene
q130 Kasem
q131 Kusaal
q132 Nzema
q133 Other
q134 Q39: What other languages do children speak on the playground?
G13 Languages Area
Item Q40: What Ghanaian languages do the children in your school speak at home?
q135 Akuapim Twi
q136 Asante Twi
q137 Dagaare
q138 Dagbani
q139 Dangme
q140 Ewe
q141 Fante

60
q142 Ga
q143 Gonja
q144 Gurene
q145 Kasem
q146 Kusaal
q147 Nzema
q148 Other
q149 Q41: What other languages do children speak at home?
G14 Reading Materials
Item Q42: Do you have the following reading program materials in your school/class in the approved
Ghanaian language of instruction?
q150 Integrated Approach
q151 Let's Read and Write
q152 NALAP pupils' book
q152a NALAP big books
q153 NALAP teachers' book
q154 Enlightening the hearts: early grade reading manual for literacy at lower primary
q155 Literacy Learning through Play
G15 Learning Materials
Item Q43: What other teaching and learning materials do you have available in the approved Ghanaian
language of instruction?
q156 Teacher's guide
q157 Pupil readers
q158 Pupil workbooks
q159 Pupil library books
q160 Big books
q161 Posters
q162 Flash cards
q163 Alphabet strip
q164 Material for teacher-made teaching aids
q164a Box of supplementary materials sent by Learning
q165 Other supplementary materials
q166 Q44: Are these teaching and learning materials sufficient to enable effective teaching in the approved
Ghanaian language of instruction?
q166a Q45: Why are these teacher and learning materials not sufficient?
G16 Technology
Item Q46: Do you have access to any of the following technologies on a regular basis?
q167 Feature Phone
q168 Smart Phone
q169 Tablet
q170 Laptop
q171 Access to the Internet

61
q172 Other
q173 Q47: What other technology do you have access to on a regular basis?
META Background Data
gps Location of School
date Date of Observation
region Region
district District
school School Name
new What is the name of the school?
urban Is the school in an urban or rural setting?
gender What is the gender of the teacher?
enum Observer Name
circuit Which circuit is the school in?
HEADTEACHER
G1 School Structure
q1 How many shifts does this school have?
q2 How many streams does this school have?
q3 Is this school part of a cluster?
q4 How many schools are in your cluster?
q5 What is the name of the school where you are expected to attend cluster meetings?
q6 Is the cluster meeting site within walking distance of this school?
q6b Does your school have more than one Headteacher?
G2 Grades
Item Which grades are you responsible for as a Headteacher?
q7 KG1
q8 KG2
q9 P1
q10 P2
q11 P3
q12 P4
q13 P5
q14 P6
q15 Are any of the KG1–P3 classes in this school combined?
q16 Which grades are combined?
G3 Enrollment - Boys
note1 Ask the Headteacher to have the enrollment records ready to reference
note2 How many BOYS are enrolled in each grade, across all streams?
q17 KG1
q18 KG2

62
q19 P1
q20 P2
q21 P3
q22 P4
q23 P5
q24 P6
G4 Enrollment - Girls
note3 How many GIRLS are enrolled in each grade, across all streams?
q25 KG1
q26 KG2
q27 P1
q28 P2
q29 P3
q30 P4
q31 P5
q32 P6
G5 Teachers - MALE
note4 How many MALE teachers are in each grade?
q33 KG1
q34 KG2
q35 P1
q36 P2
q37 P3
q38 P4
q39 P5
q40 P6
G6 Teachers - FEMALE
note5 How many FEMALE teachers are in each grade?
q41 KG1
q42 KG2
q43 P1
q44 P2
q45 P3
q46 P4
q47 P5
q48 P6
G7 Ghanaian Language of Instruction
q49 What is the approved Ghanaian language of instruction for the lower primary of this school?
q50 How many lower primary teachers (KG1–P3) use the approved Ghanaian language of instruction when
teaching?
q52 How many lower primary teachers (KG1–P3) teach comfortably in the approved Ghanaian language of

63
instruction?
q53 What languages are used to teach other than the approved language of instruction or English?
G8 Teaching Strategies
Item What challenges does your school face in using the approved Ghanaian language of instruction as the
medium of instruction in the lower primary grades?
q54 Teacher's ability to teach in the Ghanaian language of instruction
q55 Pupils' ability to speak and understand the Ghanaian language of instruction
q56 Availability of teaching and learning materials in the Ghanaian language of instruction
q57 Negative views from the community toward teaching in the language of instruction
q58 Other
q59 What other challenges does your school face in using the approved Ghanaian language of instruction as
the medium of instruction in the lower primary grades?
G9 Teaching Strategies
Item What strategies are used to teach reading and writing?
q60 Teach in English
q61 Have teachers who speak the language of instruction teach Ghanaian reading and writing
q62 Have pupils translate for each other
q63 Other
q64 What other strategies are used to teach reading and writing?
G10 English
Item In this school, at what level is English used as the primary medium of instruction for reading and writing?
q65 KG1
q66 KG2
q67 P1
q68 P2
q69 P3
q70 P4
q71 P5
q72 P6
G10b English
Item In this school, at what level is English used as the primary medium of instruction for subjects other than
reading and writing?
q165 KG1
q166 KG2
q167 P1
q168 P2
q169 P3
q170 P4
q171 P5
q172 P6
q73 Which Ghanaian language do you prefer to be used as the primary language of instruction in your
school?

64
q73b Which Ghanaian language do you prefer to be used as the primary language of instruction in your
school?
G11 Reading Materials
Item Do you have the following reading program materials in your school/class in the approved Ghanaian
language of instruction?
q74 Integrated Approach
q75 Let's Read and Write
q76 NALAP pupils' book
q77 NALAP teachers' book
q77a NALAP big books
q78 Enlightening the hearts: early grade reading manual for literacy at lower primary
q79 Literacy Learning through Play
q79b Other
G12 Learning Materials
Item What other teaching and learning materials do you have available in the approved Ghanaian language of
instruction?
q80 Teacher's guide
q81 Pupil readers
q82 Pupil workbooks
q83 Pupil library books
q84 Big books
q85 Posters
q86 Flash Cards
q87 Alphabet Strip
q88 Material for teacher-made teaching aids
q89 Box of supplementary materials sent by Learning
q89b Other
q90 Are these teaching and learning materials sufficient to enable effective teaching in the approved
Ghanaian language of instruction?
q90b Why are these teacher and learning materials not sufficient?
q91 Does your school have a Curriculum Lead assigned?
G13 Curriculum Lead
q92 How many hours per week does the Curriculum Lead have available (not teaching) to perform his/her
duties?
q93 What class level(s) does the Curriculum Lead teach?
G14 Technology
Item Does the Curriculum Lead have access to any of the following technologies on a regular basis?
q94 Feature Phone
q95 Smart Phone
q96 Tablet
q97 Laptop
q98 Access to the Internet
q99 Other

65
q99b Does the phone used by the Curriculum Lead belong to the Curriculum Lead?
G15 Technology
Item Do you have access to any of the following technologies on a regular basis?
q100 Feature Phone
q101 Smart Phone
q102 Tablet
q103 Laptop
q104 Access to the Internet
q105 Other
q105b Can you charge a phone or laptop at the school?
G16 Head Teacher
q106 How many years have you been a Headteacher?
q107 Are you currently teaching as part of your role as Headteacher?
q108 Do you teach full time?
q109 Which grade(s) do you teach?
G17 Language Fluent
Item For each Ghanaian language ask the Headteacher if they speak the language fluently, partially, or not at
all.
q110 Akuapim Twi
q111 Asante Twi
q112 Dagaare
q113 Dagbani
q114 Dangme
q115 Ewe
q116 Fante
q117 Ga
q118 Gonja
q119 Gurene
q120 Kasem
q121 Kusaal
q122 Nzema
G18 Language Playground
Item What Ghanaian languages do the children in your school speak on the playground?
q123 Akuapim Twi
q124 Asante Twi
q125 Dagaare
q126 Dagbani
q127 Dangme
q128 Ewe
q129 Fante
q130 Ga
66
q131 Gonja
q132 Gurene
q133 Kasem
q134 Kusaal
q135 Nzema
q136 Other
q137 What other Ghanaian languages do the children in your school speak on the playground?
META Background Data
gps Location of School
deo What is the distance between the school and the district education office?
date Date of Observation
region Region
district District
school School Name
new What is the name of the school?
town Town
urban Is the school in an urban or rural setting?
gender What is the gender of the Headteacher?
phone Headteacher telephone number
enum Observer Name
circuit Which circuit is the school in?
note9 Thank the Headteacher for their time, then swipe to the next page, and press the 'Save Form and Exit'
button.
PUPIL
class Which class is this pupil in?
q0 Q1: How many pupils are present in the class?
G1 Class
Item Q2: Which class are you in?
q1 KG1
q2 KG2
q3 P1
q4 P2
q5 P3
G2 First Language
Item Q3: What is your first language?
q6 Akuapim Twi
q7 Asante Twi
q8 Dagaare
q9 Dagbani

67
q10 Dangme
q11 Ewe
q12 Fante
q13 Ga
q14 Gonja
q15 Gurene
q16 Kasem
q17 Kusaal
q18 Nzema
q19 Other
first First language was recorded for this many pupils:
q20 Q4: What is the other first language?
G3 Second Language
Item Q5: What is your second language?
q21 Akuapim Twi
q22 Asante Twi
q23 Dagaare
q24 Dagbani
q25 Dangme
q26 Ewe
q27 Fante
q28 Ga
q29 Gonja
q30 Gurene
q31 Kasem
q32 Kusaal
q33 Nzema
q34 Other
second Second language was recorded for this many pupils:
q35 Q6: What is the other second language?
G4 Parent Language
Item Q7: In which language(s) do your parents speak to you?
q36 Akuapim Twi
q37 Asante Twi
q38 Dagaare
q39 Dagbani
q40 Dangme
q41 Ewe
q42 Fante
q43 Ga

68
q44 Gonja
q45 Gurene
q46 Kasem
q47 Kusaal
q48 Nzema
q49 Other
parent Parents' language was recorded for this many pupils:
q50 Q8: What is the other language parents use?
G5 Home Language
Item Q9: Which language(s) do you use to play with your friends at home?
q51 Akuapim Twi
q52 Asante Twi
q53 Dagaare
q54 Dagbani
q55 Dangme
q56 Ewe
q57 Fante
q58 Ga
q59 Gonja
q60 Gurene
q61 Kasem
q62 Kusaal
q63 Nzema
q64 Other
q65 Q10: What other language do you use to play with your friends at home?
G6 Friends
Item Q11: Which language(s) do you use to play with your friends on the playground?
q66 Akuapim Twi
q67 Asante Twi
q68 Dagaare
q69 Dagbani
q70 Dangme
q71 Ewe
q72 Fante
q73 Ga
q74 Gonja
q75 Gurene
q76 Kasem
q77 Kusaal
q78 Nzema

69
q79 Other
q80 Q12: What other language do you use to play with your friends on the playground?
q81 Q13: Which language is used in teaching you in school?
q82 Q14: What languages are the books that you are learning to read?
q83 Q15: Do you understand the Ghanaian language used in teaching you?
G7 Language Preference
Item Q16: Which language do you prefer to be used in teaching you?
q84 Akuapim Twi
q85 Asante Twi
q86 Dagaare
q87 Dagbani
q88 Dangme
q89 Ewe
q90 Fante
q91 Ga
q92 Gonja
q93 Gurene
q94 Kasem
q95 Kusaal
q96 Nzema
q97 Other
prefer Preferred language was recorded for this many pupils:
q98 Q17: What is the other language pupils prefer?
META Background Data
gps Location of School
date Date of Observation
region Region
district District
school School Name
new What is the name of the school?
urban Is the school in an urban or rural setting?
enum Observer Name
circuit Which circuit is the school in?

U.S. Agency for International Development
1300 Pennsylvania Avenue, NW
Washington, DC 20523