usd 309 nickerson-south hutchinson - ksde.org finance/budget/budget... · the board of education,...
TRANSCRIPT

USD 309 Nickerson-South Hutchinson

i
• Budget General Information (characteristics of district)
• Supplemental Information for Tables in Summary of Expenditures
• KSDE Website Information Available
• Summary of Expenditures (Sumexpen.xls)
Order of Contents

1
2012-2013 Budget General Information USD #: 309 Nickerson- South Hutchinson
Introduction Unified School District 309 Nickerson-South Hutchinson maintains a philosophy that all
students can learn and that schools have a responsibility to provide educational equality for all students.
The Board of Education, administration, and staff are dedicated to the creation of a dynamic environment for the purpose of educating a diverse community of life-long learners. Quality education is designed to nurture self-esteem, creativity, personal growth and health, and provide knowledge and the acquisition of essential skills, which will prepare students to be flexible and adaptable in an ever-changing environment as we move toward a global society.
U.S.D. 309 believes that the total community must be regarded as a learning resource where students develop the basic values, social skills, morals, and attitudes required to be responsible and productive citizens in a democratic society.
The district maintains that excellence in education occurs best when competent people with empathy, vision, and courage work together toward common goals in an atmosphere that is supportive and trusting.
The budget is designed to support the philosophy of the district and the students. U.S.D. 309 enrolls approximately 1150 students from the communities of Hutchinson, South Hutchinson and Nickerson. The organization includes two elementary schools, one middle school and one high school. Special education services are provided through a Reno County Education Cooperative Agreement with Buhler, Haven, Fairfield, and Pretty Prairie school districts.
Although the district only covers 187.5 square miles, the district maintains a transportation department that operates approximately thirty bus routes. Nearly eighty percent of the student population is transported to and from school each and everyday with district owned buses. The district also maintains a staff that operates the district’s food service program and building maintenance and custodial services.
VISION
Unified School District 309 Nickerson-South Hutchinson will be a leader in providing educational programs and experiences, training and knowledge with 21st Century tools and skills for students to excel in the global environment. Staff will be dedicated to providing opportunities for academic excellence in all subjects, building a firm foundation for life-long learning.
Through collaboration with the community and students, USD 309 will provide a safe, supportive environment with educational opportunities empowering every student to become a self-assured, responsible, and economically productive citizen. The district exists to serve the unique academic, physical, social and emotional needs of the students.
Students and staff will create a community of empowered learners in an atmosphere of mutual respect and trust. Students will be inspired and challenged to learn, grow, and accomplish academic, social, and vocational goals.
All USD 309 staff shall be committed to the students, each other, and the education profession as one team to achieve excellence in learning and teaching. Students, parents, the school board, and the community shall be members of the team to create an outstanding student centered learning environment, which supports experiences in curricular and extra-curricular activities for all children.

2
Board Members
Linda Owen, President 3200 Mona Hutchinson, KS 67502 Tel: 620-662-3937 Email: [email protected]
Jeff McConnell, Vice President 3101 Homestead Hutchinson, KS 67502 Tel: 620-727-0103 Email: [email protected]
Jamie Arneson, Member 519 S. Plum South Hutchinson, KS 67505 Tel: 620-727-0656 Email: [email protected]
David Hawthorne, Member 7707 N. Monroe Hutchinson, KS 67502 Tel. 620-662-0499 Email: [email protected]
Tammy Davis, Member 318 S. Poplar South Hutchinson, KS 67505 Tel: 620-662-2201 Email: [email protected]
Duane Phillips, Member 10404 N. Wilson Road Hutchinson, KS 67502 Tel: 620-422-3371 Email: [email protected]
Danno Ochs, Member 3111 Millwood Hutchinson, KS 67502 Tel: 620-200-0202 Email: [email protected]
Key Staff Superintendent: Dr. William Hagerman Assistant Superintendent: Mr. Brian Cordel Business Office Staff:
Business Manager/Clerk Ms. Kristi Rohling Curriculum & Instruction Staff: Mr. Brian Cordel
Federal Programs Director Mr. Brian Cordel R.C.E.C. Director Dr. Lynn Love Other Contacts:
Nickerson High School Principal Mr. Kevin Abbott Nickerson Asst. High School Principal Mr. Rick Blosser Reno Valley Middle School Principal Mr. Vince Naccarato South Hutchinson Elementary Principal Ms. Midgley Simmons Nickerson Elementary Principal Mr. Terry George
Transportation Director Mr. Roy Lewis Building & Grounds Director Mr. Danny Dennis Technology Coordinator Mr. Aaron Bell Food Service Coordinator Ms. Debbie Vagts
3
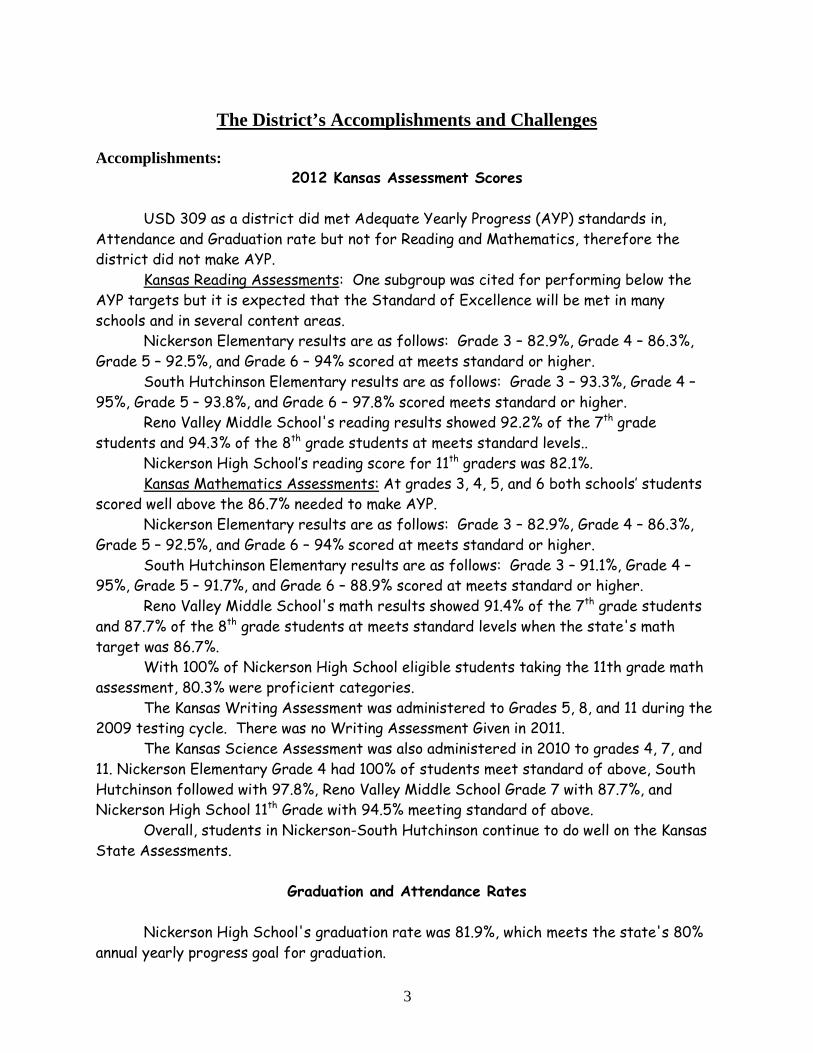
The District’s Accomplishments and Challenges Accomplishments:
2012 Kansas Assessment Scores USD 309 as a district did met Adequate Yearly Progress (AYP) standards in,
Attendance and Graduation rate but not for Reading and Mathematics, therefore the district did not make AYP.
Kansas Reading Assessments: One subgroup was cited for performing below the AYP targets but it is expected that the Standard of Excellence will be met in many schools and in several content areas.
Nickerson Elementary results are as follows: Grade 3 – 82.9%, Grade 4 – 86.3%, Grade 5 – 92.5%, and Grade 6 – 94% scored at meets standard or higher.
South Hutchinson Elementary results are as follows: Grade 3 – 93.3%, Grade 4 – 95%, Grade 5 – 93.8%, and Grade 6 – 97.8% scored meets standard or higher.
Reno Valley Middle School's reading results showed 92.2% of the 7th grade students and 94.3% of the 8th grade students at meets standard levels..
Nickerson High School’s reading score for 11th graders was 82.1%. Kansas Mathematics Assessments: At grades 3, 4, 5, and 6 both schools’ students
scored well above the 86.7% needed to make AYP. Nickerson Elementary results are as follows: Grade 3 – 82.9%, Grade 4 – 86.3%,
Grade 5 – 92.5%, and Grade 6 – 94% scored at meets standard or higher. South Hutchinson Elementary results are as follows: Grade 3 – 91.1%, Grade 4 –
95%, Grade 5 – 91.7%, and Grade 6 – 88.9% scored at meets standard or higher. Reno Valley Middle School's math results showed 91.4% of the 7th grade students
and 87.7% of the 8th grade students at meets standard levels when the state's math target was 86.7%.
With 100% of Nickerson High School eligible students taking the 11th grade math assessment, 80.3% were proficient categories.
The Kansas Writing Assessment was administered to Grades 5, 8, and 11 during the 2009 testing cycle. There was no Writing Assessment Given in 2011.
The Kansas Science Assessment was also administered in 2010 to grades 4, 7, and 11. Nickerson Elementary Grade 4 had 100% of students meet standard of above, South Hutchinson followed with 97.8%, Reno Valley Middle School Grade 7 with 87.7%, and Nickerson High School 11th Grade with 94.5% meeting standard of above.
Overall, students in Nickerson-South Hutchinson continue to do well on the Kansas State Assessments.
Graduation and Attendance Rates
Nickerson High School's graduation rate was 81.9%, which meets the state's 80% annual yearly progress goal for graduation.

4
The district's attendance rate was 96.5%, which is above the state's 90.0% district annual yearly progress goal. This indicator has been stable for the past couple of years.
Community Services After-school Programs In 2005, Reno Valley Middle School—the only school in Kansas--was recognized at the 21st Century Community Learning Centers Summer Institute in Chicago as one of ten After-School Programs in the nation for its accomplishments in successfully enhancing and enriching science in the After-School Program. On-site visits by McREL and SEDL confirmed the school’s quality science activities and instruction. The following year, technology was included as an area in which the school was recognized for accomplishments.
In 2006-2007, Reno Valley Middle and South Hutchinson Elementary had after-school tutoring programs that were provided through KSDE Enhancement grants and additional funds rose by the schools.
These programs will continue in the 2012-2013 School Year at South Hutchinson Elementary, Reno Valley Middle School and Nickerson High School thanks in part to three new grants. Community Learning Centers were implemented and established during the 2008-09 School Year. The 21st Century Community Learning Centers Program is a five-year grant commitment by the State and the District. Preschool Programs The Parents as Teachers program provides parenting education for adults with children from prenatal through age three. Parenting classes, home visits with a parent educator, and group and family play sessions are held regularly. Head Start classes are available at two locations for three and four year-old children. The classes meet four days each week at Nickerson Elementary and South Hutchinson Elementary. USD 309 collaborates with USD 308 and other Reno County school districts to provide this program. Our At-Risk Four Year-Old Preschool provides educational opportunities for half-day preschool experiences for fourteen children. This program is located at Nickerson Elementary. USD 309 will provide preschool experiences for children at South Hutchinson Elementary through a special grant called the Universal Preschool Program. The program will also be expanded to the Nickerson community through a partnership with the Kids Krossing Preschool located at the Nickerson United Methodist Church.
Full Day Kindergarten
The district turned its attention to providing all day every day kindergarten for all kindergarten students in the district during the 2005-2006 School Year. We are in our seventh year of offering all day every day kindergarten. Early Childhood programs return huge benefits for all children that participate and parents love the program.

5
Technology
USD 309 to support the use of technology in the learning environment. Beginning with the 2004-2005 School Year, every student at Nickerson High School was equipped with an iBook laptop computer that is also connected to the network, district resources and Internet via a wireless connection. Learning anytime, anyplace, anywhere became reality at NHS during this year. The program expanded to include Reno Valley Middle School for the 2006-2007 School Year. The one-to-one program is slightly different at the middle school where students are not allowed to take the laptops home each day. Students have to check their laptop out for special projects. The units will assist students at school with valuable research tools and interactive learning. Beginning the 2011-12 school year, students at Nickerson High School and at Reno Valley Middle School were given an iPad as their one-to-one computing device. This was a major shift in how teachers at both levels instruct, and in the tools that student have to enhance their learning. That program continues for the 2012-13 school year. PowerSchool student information system allows teachers, students and parents’ instant access to student information, grades, and other tools anytime, anyplace, and anywhere the individual has access to the Internet. This web-based program allows greater flexibility for all users. This student information system was initiated Kindergarten through Grade Twelve during the fall of 2004 and will have a major revision/update this fall.
All teachers have their own laptops. Wireless carts have been added for students at both elementary schools. Nickerson Elementary School completed a Tech Rich Classroom Grant with Stafford Elementary during the 2006-07 School Year. Nickerson Elementary has added a great deal of technology with the addition of Smartboards and Projectors to stimulate the learning senses of the students in every classroom. South Hutchinson Elementary has participated in a Tech Rich Classroom Grant at the fifth and sixth grade levels with Riley Elementary at Great Bend during the past two years. For the 2010-11 school year, Reno Valley Middle School partnering with Larned Middle School, received a Tech Rich Classroom Grant at the7-8th level. Those grants finished at the end of the 2011-12 school year, but the impact continues. Students at Nickerson High School, Reno Valley Middle School and Nickerson Elementary School will continue to use the Computer Performance System (CPS) in their classrooms to beam their answers to teacher-selected questions. Teachers use the systems to monitor students' progress in grasping concepts and information to ensure mastery of district curriculum objectives.
All schools have technology labs, laptop carts, iPad carts, Internet access in all classrooms, and opportunities for students to use and improve their technology skills. During the upcoming year the district will complete its new technology plan that will encompass, expanding 21st Century Skills with 21st Century Tools, and the addition of more PBL (Project Based Learning).

6
Challenges Although there are many challenges that face all educational institutions, the most difficult issue that each of us will face over the next several years is that the pool of qualified teachers will continue to shrink considerably. The problem will continue to grow as our current staff begins to retire and leave the profession. Health insurance will also continue to be an issue for USD 309 as well. The district has increased the district's contribution to health care for staff to encourage employees to enroll in the program and provide a quality benefit for all members. A good health insurance program is necessary to assist the district in recruiting and retaining quality educators and other employees. A major concern that will be addressed is the decline of the Graduation Rate at Nickerson High School. Students that drop out before finishing high school, sacrifice considerable financial opportunity, and will face a very difficult future when it comes to employment and financial rewards. USD 309 has built an outstanding After School Program. At this point grant funds continue to support our state and nationally recognized Out of School Time Programs.

7
Supplemental Information for the Following Tables 1. Summary of Total Expenditures by Function (All Funds)
The total expenditure table and graph allows us to examine how our district funds were actually spent over the past two years and plan and estimate cost for the future. Two new funds were created for the FY2006 Budget. The At-Risk Fund and the At-Risk Four-Year-Old Funds were created by the legislature to track expenditures for At-Risk Students. All transportation expenditures are coded and recorded within the general fund.
2. Summary of General Fund Expenditures by Function
The general fund expenditures remain primarily consistent from year to year. Transportation expenditures continue to be paid directly from the general fund. Expenditures that will be moved to the LOB are additional general administration expenditures, (insurance, technology and nurses salaries, supplies, etc), all utility cost (electric, gas and water), and several other student support expenditures. With this move the general fund can now account for the added transportation expenditures and lack of BSAAP increase. This is reflected in the other cost line item summary.
3. Summary of Supplemental General Fund Expenditures by Function
For the past several years the Supplemental General Fund or the LOB, was used primarily for other items that were generally considered above and beyond or in addition to the general fund. Today the LOB accounts for general operating expenditures such as utility cost, insurance cost, transfers to At-Risk Funds, and other general and instructional expenditures. The supplemental general fund has become a major part of the budget planning. With the court decision and legislation this fund has doubled with state aide resources, which make this fund more viable for day-to-day operating cost. The fund has been maxed out at our legal percentage for the past three years.
4. Summary of General and Supplemental General Fund Expenditures by Function
Since the General Fund and the LOB are governed by the same rules, regulations and laws, it is only appropriate to examine how the expenditures in each sub category compare from year to year.
5. Summary of Special Education Fund by Function There have been very few changes in the special education fund over the past several years. The only major change that took place during the FY2004 was the fact that the state began to funnel the Categorical Aide payment or CAT Aide through the general fund in each school district rather than a direct payment to the Special Education Cooperatives. This major increase in the Instruction sub category took place between FY2002 and FY2003. The expenditures from this fund are mainly due to the

8
district’s responsibility to Reno County Education Cooperative (RCEC) in the form of CAT Aide payment and the district’s share of the assessment. Other costs are our special education transportation cost, which our own transportation department provides.
6. Instruction Expenditures (1000) This analysis of the budget allows us to examine what fund and how much money is being expended on instructional cost. Instruction cost is the main expenditure of the district encompassing more than fifty percent of total expenditures. This is where the majority of the teacher’s salaries are paid.
7. Student and Instructional Support Expenditures (2100 & 2200) The student and instructional support expenditures are the function codes for school counselors, librarians, and support personnel. These expenditures are considered support to instruction rather than instruction. This is where the Parents-As-Teachers program is paid from as well as staff development activities for our teachers.
8. General Administration Expenditures (2300) General Administration codes the expenditures that are considered to be district wide expenditures. These include central office salaries, insurance expenditures, and board related expenses.
9. School Administration Expenditures (2400) The School Administration codes expenditures that include building administrators’ salaries, building level clerical staff salaries, and administrative supplies.
10. Operations and Maintenance Expenditures (2600) The Operations and Maintenance expenditures include custodial salaries, utilities cost, building and grounds equipment and supplies to maintain the upkeep of the building and grounds.
11. Other Costs (2500, 2800 & 2900: Other Supplemental Services) (3000: Non-Instruction
Services) Other Costs are used to track so called non-instructional expenditures. This is where all of the district’s At-Risk Program expenditures are coming from as well as the new change for our transportation expenditures. Other Costs category also included the majority of the food service salaries, food, and supplies. Other costs might also include data processing equipment or supplies.
12. Capital Improvements (4000) Capital Improvements are the cost associated with the improvement, replacement, or repair of the district’s property. Such items as roof repair or replacement, some types of equipment, and/or construction cost are all items that would be acceptable expenditures from the code 4000.

9
13. Debt Services (5000) and Transfers (5200) The Debt Service is the accounting of our yearly payments on the bonds. Expenditures are paid twice a fiscal year on September 1st and March 1st to retire our outstanding bonds. The September payment is an interest plus principal payment. The March payment is an interest only payment. The Transfers code (5200) tracks all of the transfers from one fund to another. Such transfers include transfers from general fund or supplemental general fund (LOB) to the special education fund, staff development fund, drivers’ education fund, or vocational education fund.
14. Miscellaneous Information – Transfers There were no funds setup to be transferred back into the General Fund from
various funds that have an ending cash balance for USD 309.
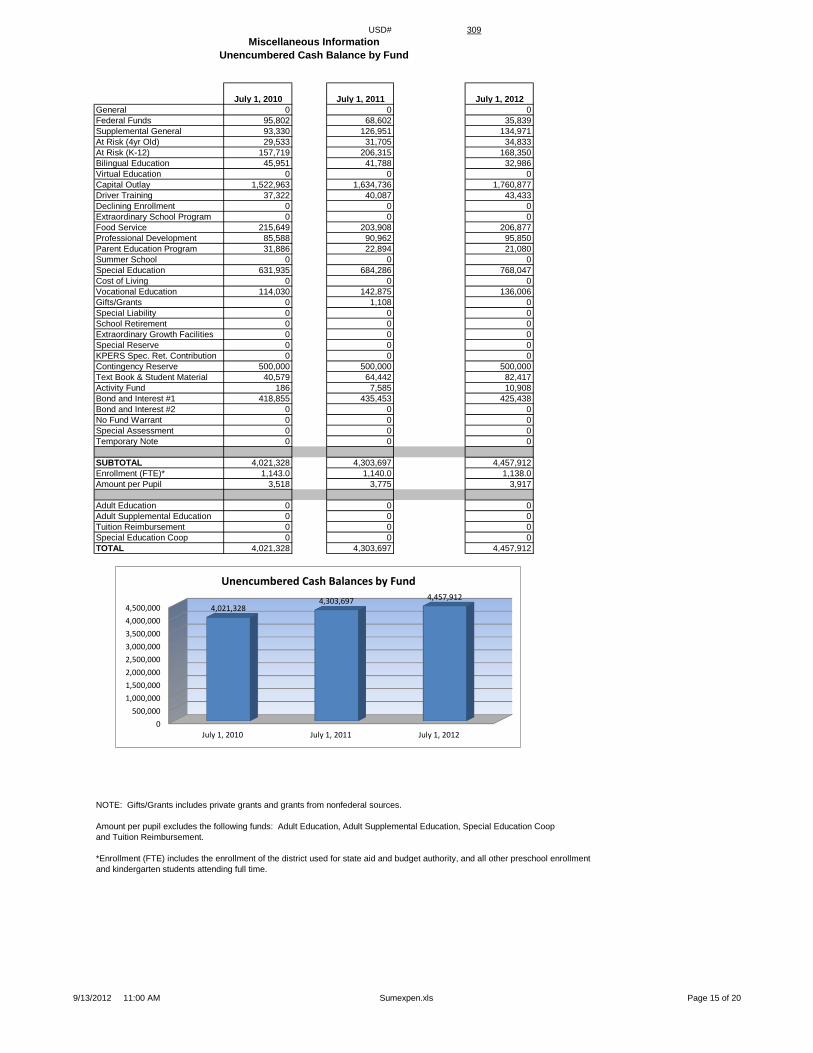
15. Miscellaneous Information Unencumbered Cash Balance by Fund The unencumbered cash balance is an analysis of the cash on hand in each of the funds on July 1 of each year. Each fund is governed by law to the extent of what the carryover or cash balance may be. As you can tell the total cash balance has been going down for the past several years. This is a trend that sets off alarms for the future. Also, a caution needs to be observed here. Certain funds such as the LOB are not necessarily expendable cash. These types of funds are regulated by the legal published budget and these dollars are taxes in process. Therefore, these dollars are carried to the next tax year and figures in to reduce the amount of taxes needed to fund the next year’s budget.
16. Reserve Funds Unencumbered Cash Balance This fund does not pertain to USD 309.
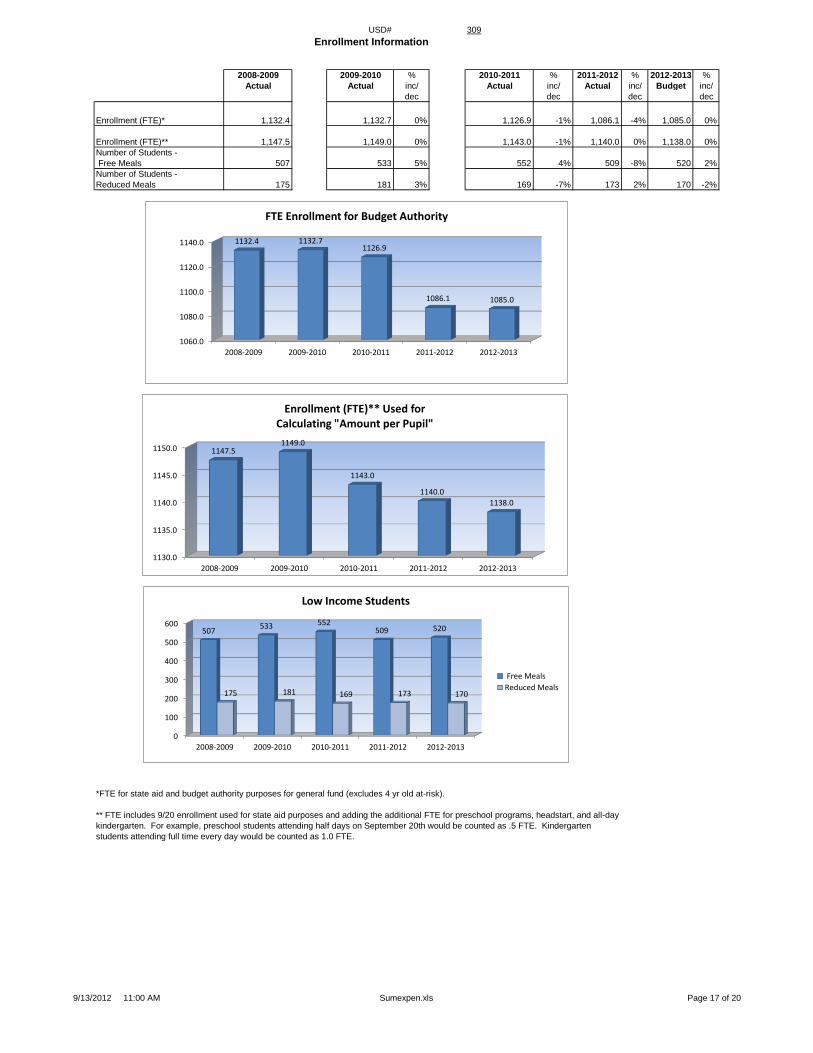
17. Other Information - FTE Other Information is a five year and three year analysis of our student head count or FTE and is used to calculate the district’s budget authority for the General Fund. The budget authority from the General Fund is used to calculate the Supplemental General Fund (LOB) on a percentage basis. The FTE numbers are used for several calculations that make up the budget process. Free meals are used to calculate our budget authority for the At-Risk Program.
18. Miscellaneous Information Mill Rates by Fund These charts and graphs analyze the mill rate for you the, taxpayer. For USD 309 there are only four categories used to collect local tax dollars to support your local educational program. The General Fund will collect 20 mills. This is set by the State. Supplemental General Fund (LOB) is a little more complex. The LOB will fluctuate from year to year. There are many factors that cause this fluctuation, but the main reason is the amount of resources needed to fund the percentage of the General Fund

10
authority each year. Capital Outlay can only be changed by resolution and is currently established at 4.00 mills. Finally the Bond and Interest will change with the valuation that is used in the calculations each year and can only be used to pay for outstanding bonds.
19. Other Information – Assessed Valuation and Bonded Indebtedness The last graph analyzes the district’s valuation. Valuation is the fair market value of the tangible property within the boundaries of the school district.
Note: The FTE (full time equivalency) used in this report to calculate the “Amount Per Pupil” is defined as following: Enrollment (FTE) includes the enrollment of the district used for state aid and budget authority, and all other preschool enrollment and kindergarten students attending full time.

11
KSDE Website Information Available K-12 Statistics (Building, District or State Totals) http://svapp15586.ksde.org/k12/k12.aspx
• Attendance / Enrollment Reports • Staff Reports • Graduates / Dropouts Reports • Crime / Violence Reports
School Finance Reports and Publications http://www.ksde.org/Default.aspx?tabid=1870
• Certified Personnel • Enrollment • Dropouts • Graduates • Salary Reports
Kansas Building Report Card http://svapp15586.ksde.org/rcard/
• Attendance Rate • Graduation Rate • Dropout Rate • School Violence • Assessments
o Reading o Mathematics o Writing
• Graduates Passing Adv. Science Courses • Graduates Passing Adv. Math Courses

USD# 309
Summary of Total Expenditures By Function
(All Funds)
% % % % %
2010-2011 of 2011-2012 of inc/ 2012-2013 of inc/
Actual Tot Actual Tot dec Budget Tot dec
Instruction 7,110,528 56% 7,236,543 56% 2% 7,352,654 53% 2%
Student & Instructional Support 582,797 5% 574,369 4% -1% 585,936 4% 2%
General Administration 478,145 4% 474,653 4% -1% 498,612 4% 5%
School Administration (Building) 998,798 8% 812,124 6% -19% 860,030 6% 6%
Operations & Maintenance 1,136,389 9% 1,235,568 10% 9% 1,265,304 9% 2%
Capital Improvements 179,446 1% 249,513 2% 39% 610,000 4% 144%
Debt Services 508,803 4% 506,415 4% 0% 508,981 4% 1%
Other Costs 1,783,374 14% 1,901,185 15% 7% 2,125,677 15% 12%
Total Expenditures 12,778,280 100% 12,990,370 100% 2% 13,807,194 100% 6%
Amount per Pupil $11,180 $11,395 2% $12,133 6%
Note: Percentages on charts are within +-1% due to rounding used. Pie graph percentages may differ from charts for this reason also.
Further definition of what goes into each category:
Instruction - 1000 Operations & Maintenance - 2600
Student & Instructional Support - 2100 & 2200 Other Costs - 2500, 2900 and 3000 and all others not included elsewhere
General Administration - 2300 Capital Improvements - 4000
School Administration (Building) - 2400 Debt Services - 5100 Transfers - 5200
The funds that are included in the categories above are: General, Supplemental General, Bilingual Education, At Risk(4yr Old), At Risk(K-
12), Virtual Education, Capital Outlay, Driver Education, Extraordinary School Program, Summer School, Special Education, Vocational
Education, Professional Development, Bond & Interest #1, Bond & Interest #2, No-Fund Warrant, Special Assessment, Parent Education,
School Retirement, Student Materials Revolving & Textbook Rental, Tuition Reimbursement, Gifts/Grants, KPERS Special Retirement
Contribution, Contingency, Special Liability Expense, Federal Funds, Adult Education, Adult Supplemental Education, Activity Fund and
Special Education Coop Fund.
0
1,000,000
2,000,000
3,000,000
4,000,000
5,000,000
6,000,000
7,000,000
8,000,000
Instruction Student &Instructional
Support
GeneralAdministration
SchoolAdministration
(Building)
Operations &Maintenance
CapitalImprovements
Debt Services Other Costs
7,352,654
585,936 498,612 860,030
1,265,304 610,000 508,981
2,125,677
Summary of Total Expenditures by Function (All Funds)
2010-2011
2011-2012
2012-2013
Instruction 53%
Student & Instructional Support
4%
General Administration 4%
School Administration (Building)
6%
Operations & Maintenance 9%
Capital Improvements 5%
Debt Services 4%
Other Costs 15%
2012-13 Summary of Total Expenditures by Function
Instruction
Student & Instructional Support
General Administration
School Administration (Building)
Operations & Maintenance
Capital Improvements
Debt Services
Other Costs
9/13/2012 11:00 AM Sumexpen.xls Page 1 of 20

USD# 309
Summary of General Fund Expenditures
by Function
% % % % %
2010-2011 of 2011-2012 of inc/ 2012-2013 of inc/
Actual Tot Actual Tot dec Budget Tot dec
Instruction 2,929,949 52% 2,742,534 50% -6% 2,813,865 50% 3%
Student & Instructional Support 443,940 8% 408,400 7% -8% 421,850 7% 3%
General Administration 333,299 6% 327,129 6% -2% 338,343 6% 3%
School Administration (Building) 593,128 10% 576,373 10% -3% 589,200 10% 2%
Operations & Maintenance 852,902 15% 902,092 16% 6% 910,824 16% 1%
Capital Improvements 0 0% 0 0% 0% 0 0% 0%
Other Costs 517,490 9% 564,146 10% 9% 577,408 10% 2%
Total Expenditures 5,670,708 100% 5,520,674 100% -3% 5,651,490 100% 2%
Amount per Pupil $4,961 $4,843 -2% $4,966 3%
The Summary of General Fund Expenditures chart information comes from pages 6-13 and only uses the 'General Fund' line items.
0
500,000
1,000,000
1,500,000
2,000,000
2,500,000
3,000,000
Instruction Student &Instructional
Support
GeneralAdministration
SchoolAdministration
(Building)
Operations &Maintenance
CapitalImprovements
Other Costs
2,813,865
421,850 338,343
589,200
910,824
0
577,408
Summary of General Fund Expenditures
2010-2011
2011-2012
2012-2013
Instruction 50%
Student & Instructional Support
8%
General Administration 6%
School Administration (Building)
10%
Operations & Maintenance 16%
Other Costs 10%
2012-2013 Summary of General Fund Expenditures by Function
Instruction
Student & Instructional Support
General Administration
School Administration (Building)
Operations & Maintenance
Capital Improvements
Other Costs
9/13/2012 11:00 AM Sumexpen.xls Page 2 of 20

USD# 309
Summary of Supplemental General Fund Expenditures
by Function
% % % % %
2010-2011 of 2011-2012 of inc/ 2012-2013 of inc/
Actual Tot Actual Tot dec Budget Tot dec
Instruction 356,445 24% 469,456 31% 32% 486,700 33% 4%
Student & Instructional Support 81,624 6% 70,851 5% -13% 79,548 5% 12%
General Administration 123,647 8% 110,546 7% -11% 114,500 8% 4%
School Administration (Building) 357,783 25% 178,892 12% -50% 175,000 12% -2%
Operations & Maintenance 217,901 15% 226,881 15% 4% 247,100 17% 9%
Capital Improvements 0 0% 0 0% 0% 0 0% 0%
Other Costs 318,923 22% 434,250 29% 36% 361,782 25% -17%
Total Expenditures 1,456,323 100% 1,490,876 100% 2% 1,464,630 100% -2%
Amount per Pupil $1,274 $1,308 3% $1,287 -2%
The Summary of Supplemental General Fund Expenditures chart information comes from pages 6-13 and only uses the 'Supplemental
General Fund' line items.
0
50,000
100,000
150,000
200,000
250,000
300,000
350,000
400,000
450,000
500,000
Instruction Student &Instructional
Support
GeneralAdministration
SchoolAdministration
(Building)
Operations &Maintenance
CapitalImprovements
Other Costs
486,700
79,548
114,500
175,000
247,100
0
361,782
Summary of Supplemental General Expenditures by Function
2010-2011
2011-2012
2012-2013
Instruction 33%
Student & Instructional Support
5%
General Administration 8% School Administration
(Building) 12%
Operations & Maintenance 17%
Other Costs 25%
2012-2013 Summary of Supplemental General Fund Expenditures by Function
Instruction
Student & Instructional Support
General Administration
School Administration (Building)
Operations & Maintenance
Capital Improvements
Other Costs
9/13/2012 11:00 AM Sumexpen.xls Page 3 of 20
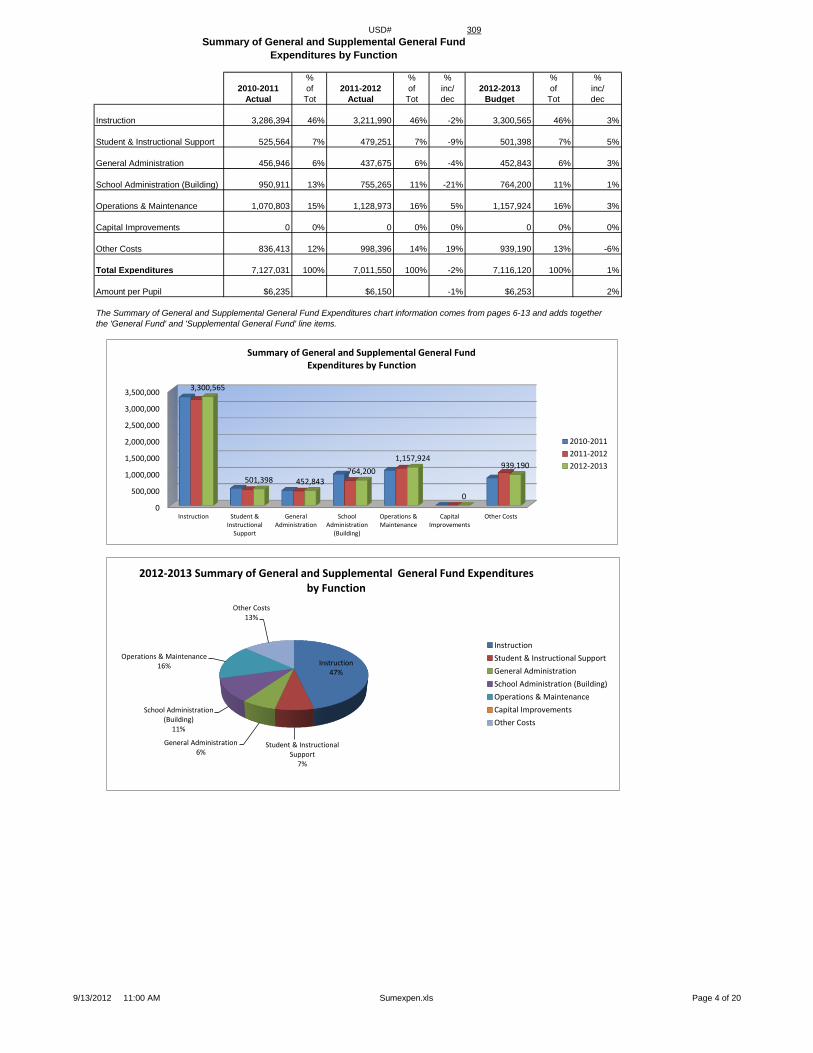
USD# 309
Summary of General and Supplemental General Fund
Expenditures by Function
% % % % %
2010-2011 of 2011-2012 of inc/ 2012-2013 of inc/
Actual Tot Actual Tot dec Budget Tot dec
Instruction 3,286,394 46% 3,211,990 46% -2% 3,300,565 46% 3%
Student & Instructional Support 525,564 7% 479,251 7% -9% 501,398 7% 5%
General Administration 456,946 6% 437,675 6% -4% 452,843 6% 3%
School Administration (Building) 950,911 13% 755,265 11% -21% 764,200 11% 1%
Operations & Maintenance 1,070,803 15% 1,128,973 16% 5% 1,157,924 16% 3%
Capital Improvements 0 0% 0 0% 0% 0 0% 0%
Other Costs 836,413 12% 998,396 14% 19% 939,190 13% -6%
Total Expenditures 7,127,031 100% 7,011,550 100% -2% 7,116,120 100% 1%
Amount per Pupil $6,235 $6,150 -1% $6,253 2%
The Summary of General and Supplemental General Fund Expenditures chart information comes from pages 6-13 and adds together
the 'General Fund' and 'Supplemental General Fund' line items.
0
500,000
1,000,000
1,500,000
2,000,000
2,500,000
3,000,000
3,500,000
Instruction Student &Instructional
Support
GeneralAdministration
SchoolAdministration
(Building)
Operations &Maintenance
CapitalImprovements
Other Costs
3,300,565
501,398 452,843 764,200
1,157,924
0
939,190
Summary of General and Supplemental General Fund Expenditures by Function
2010-2011
2011-2012
2012-2013
Instruction 47%
Student & Instructional Support
7%
General Administration 6%
School Administration (Building)
11%
Operations & Maintenance 16%
Other Costs 13%
2012-2013 Summary of General and Supplemental General Fund Expenditures by Function
Instruction
Student & Instructional Support
General Administration
School Administration (Building)
Operations & Maintenance
Capital Improvements
Other Costs
9/13/2012 11:00 AM Sumexpen.xls Page 4 of 20
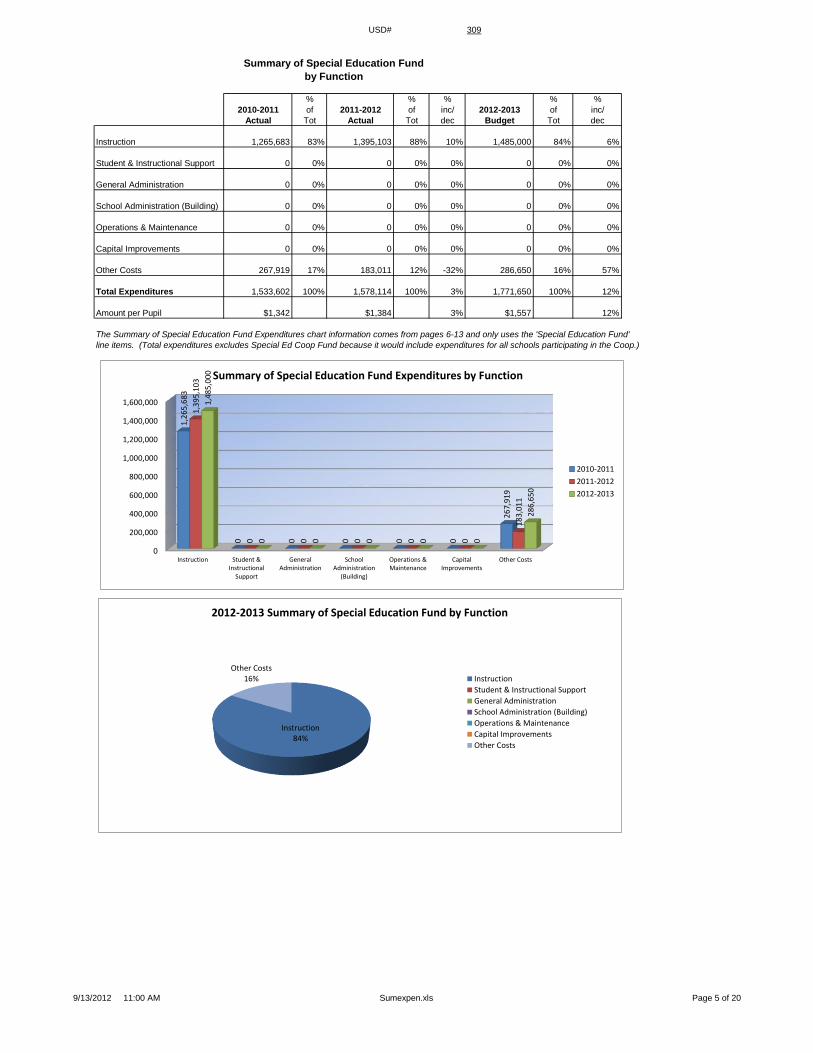
USD# 309
Summary of Special Education Fund
by Function
% % % % %
2010-2011 of 2011-2012 of inc/ 2012-2013 of inc/
Actual Tot Actual Tot dec Budget Tot dec
Instruction 1,265,683 83% 1,395,103 88% 10% 1,485,000 84% 6%
Student & Instructional Support 0 0% 0 0% 0% 0 0% 0%
General Administration 0 0% 0 0% 0% 0 0% 0%
School Administration (Building) 0 0% 0 0% 0% 0 0% 0%
Operations & Maintenance 0 0% 0 0% 0% 0 0% 0%
Capital Improvements 0 0% 0 0% 0% 0 0% 0%
Other Costs 267,919 17% 183,011 12% -32% 286,650 16% 57%
Total Expenditures 1,533,602 100% 1,578,114 100% 3% 1,771,650 100% 12%
Amount per Pupil $1,342 $1,384 3% $1,557 12%
The Summary of Special Education Fund Expenditures chart information comes from pages 6-13 and only uses the 'Special Education Fund'
line items. (Total expenditures excludes Special Ed Coop Fund because it would include expenditures for all schools participating in the Coop.)
0
200,000
400,000
600,000
800,000
1,000,000
1,200,000
1,400,000
1,600,000
Instruction Student &Instructional
Support
GeneralAdministration
SchoolAdministration
(Building)
Operations &Maintenance
CapitalImprovements
Other Costs
1,2
65
,68
3
0
0
0
0
0
26
7,9
19
1,3
95
,10
3
0
0
0
0
0
18
3,0
11
1,4
85
,00
0
0
0
0
0
0
28
6,6
50
Summary of Special Education Fund Expenditures by Function
2010-2011
2011-2012
2012-2013
Instruction 84%
Other Costs 16%
2012-2013 Summary of Special Education Fund by Function
Instruction
Student & Instructional Support
General Administration
School Administration (Building)
Operations & Maintenance
Capital Improvements
Other Costs
9/13/2012 11:00 AM Sumexpen.xls Page 5 of 20

USD# 309
Instruction Expenditures (1000)
% %
2010-2011 2011-2012 inc/ 2012-2013 inc/
Actual Actual dec Budget dec
General 2,929,949 2,742,534 -6% 2,813,865 3%
Federal Funds 489,299 424,762 -13% 401,880 -5%
Supplemental General 356,445 469,456 32% 486,700 4%
At Risk (4yr Old) 60,828 61,872 2% 64,300 4%
At Risk (K-12) 1,184,169 1,188,115 0% 1,195,500 1%
Bilingual Education 58,994 56,540 -4% 63,600 12%
Virtual Education 0 0 0% 0 0%
Capital Outlay 79,894 45,466 -43% 120,000 164%
Driver Education 8,666 11,510 33% 12,380 8%
Declining Enrollment 0 0 0% 0 0%
Extraordinary School Program 0 0 0% 0 0%
Food Service 0 0 0% 0 0%
Professional Development 0 0 0% 0 0%
Parent Education Program 0 0 0% 0 0%
Summer School 0 0 0% 0 0%
Special Education 1,265,683 1,395,103 10% 1,485,000 6%
Cost of Living 0 0 0% 0 0%
Vocational Education 351,082 321,869 -8% 293,550 -9%
Gifts/Grants 1,892 3,521 86% 0 -100%
Special Liability 0 0 0% 0 0%
School Retirement 0 0 0% 0 0%
Extraordinary Growth Facilities 0 0 0% 0 0%
Special Reserve 0 0 0%
KPERS Spec. Ret. Contribution 254,383 425,471 67% 415,879 -2%
Contingency Reserve 0 0 0%
Text Book & Student Material 33,093 41,702 26%
Activity Fund 36,151 48,622 34% 0 -100%
Bond and Interest #1 0 0 0% 0 0%
Bond and Interest #2 0 0 0% 0 0%
No-Fund Warrant 0 0 0% 0 0%
Special Assessment 0 0 0% 0 0%
Temporary Note 0 0 0% 0 0%
SUBTOTAL 7,110,528 7,236,543 2% 7,352,654 2%
Enrollment (FTE)* 1,143.0 1,140.0 0% 1,138.0 0%
Amount per Pupil 6,221 6,348 2% 6,461 2%
Adult Education 0 0 0% 0 0%
Adult Supplemental Education 0 0 0% 0 0%
Tuition Reimbursement 0 0 0% 0 0%
Special Education Coop 0 0 0% 0 0%
TOTAL 7,110,528 7,236,543 2% 7,352,654 2%
NOTE: Gifts/Grants includes private grants and grants from nonfederal sources.
Amount per pupil excludes the following funds: Adult Education, Adult Supplemental Education, Special Education Coop
and Tuition Reimbursement.
*Enrollment (FTE) includes the enrollment of the district used for state aid and budget authority, and all other preschool enrollment
and kindergarten students attending full time.
6,950,000
7,000,000
7,050,000
7,100,000
7,150,000
7,200,000
7,250,000
7,300,000
7,350,000
7,400,000
2010-2011 2011-2012 2012-2013
7,110,528
7,236,543
7,352,654
Instruction Expenditures
0
500,000
1,000,000
1,500,000
2,000,000
2,500,000
3,000,000
2010-2011 2011-2012 2012-2013
2,929,949 2,742,534 2,813,865
356,445 469,456 486,700
1,265,683 1,395,103 1,485,000
Instruction Expenditures
GeneralSupplemental GeneralSpecial Education
9/13/2012 11:00 AM Sumexpen.xls Page 6 of 20
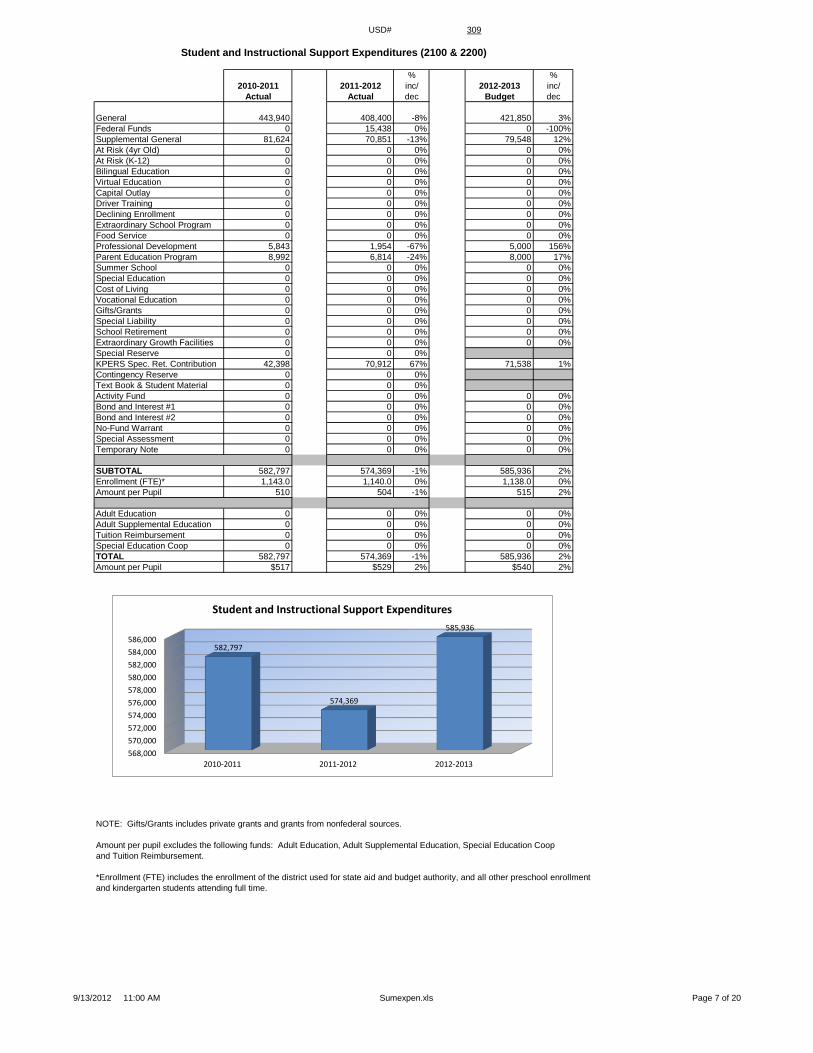
USD# 309
Student and Instructional Support Expenditures (2100 & 2200)
% %
2010-2011 2011-2012 inc/ 2012-2013 inc/
Actual Actual dec Budget dec
General 443,940 408,400 -8% 421,850 3%
Federal Funds 0 15,438 0% 0 -100%
Supplemental General 81,624 70,851 -13% 79,548 12%
At Risk (4yr Old) 0 0 0% 0 0%
At Risk (K-12) 0 0 0% 0 0%
Bilingual Education 0 0 0% 0 0%
Virtual Education 0 0 0% 0 0%
Capital Outlay 0 0 0% 0 0%
Driver Training 0 0 0% 0 0%
Declining Enrollment 0 0 0% 0 0%
Extraordinary School Program 0 0 0% 0 0%
Food Service 0 0 0% 0 0%
Professional Development 5,843 1,954 -67% 5,000 156%
Parent Education Program 8,992 6,814 -24% 8,000 17%
Summer School 0 0 0% 0 0%
Special Education 0 0 0% 0 0%
Cost of Living 0 0 0% 0 0%
Vocational Education 0 0 0% 0 0%
Gifts/Grants 0 0 0% 0 0%
Special Liability 0 0 0% 0 0%
School Retirement 0 0 0% 0 0%
Extraordinary Growth Facilities 0 0 0% 0 0%
Special Reserve 0 0 0%
KPERS Spec. Ret. Contribution 42,398 70,912 67% 71,538 1%
Contingency Reserve 0 0 0%
Text Book & Student Material 0 0 0%
Activity Fund 0 0 0% 0 0%
Bond and Interest #1 0 0 0% 0 0%
Bond and Interest #2 0 0 0% 0 0%
No-Fund Warrant 0 0 0% 0 0%
Special Assessment 0 0 0% 0 0%
Temporary Note 0 0 0% 0 0%
SUBTOTAL 582,797 574,369 -1% 585,936 2%
Enrollment (FTE)* 1,143.0 1,140.0 0% 1,138.0 0%
Amount per Pupil 510 504 -1% 515 2%
Adult Education 0 0 0% 0 0%
Adult Supplemental Education 0 0 0% 0 0%
Tuition Reimbursement 0 0 0% 0 0%
Special Education Coop 0 0 0% 0 0%
TOTAL 582,797 574,369 -1% 585,936 2%
Amount per Pupil $517 $529 2% $540 2%
NOTE: Gifts/Grants includes private grants and grants from nonfederal sources.
Amount per pupil excludes the following funds: Adult Education, Adult Supplemental Education, Special Education Coop
and Tuition Reimbursement.
*Enrollment (FTE) includes the enrollment of the district used for state aid and budget authority, and all other preschool enrollment
and kindergarten students attending full time.
568,000
570,000
572,000
574,000
576,000
578,000
580,000
582,000
584,000
586,000
2010-2011 2011-2012 2012-2013
582,797
574,369
585,936
Student and Instructional Support Expenditures
9/13/2012 11:00 AM Sumexpen.xls Page 7 of 20

USD# 309
General Administration Expenditures (2300)
% %
2010-2011 2011-2012 inc/ 2012-2013 inc/
Actual Actual dec Budget dec
General 333,299 327,129 -2% 338,343 3%
Federal Funds 0 0 0% 0 0%
Supplemental General 123,647 110,546 -11% 114,500 4%
At Risk (4yr Old) 0 0 0% 0 0%
At Risk (K-12) 0 0 0% 0 0%
Bilingual Education 0 0 0% 0 0%
Virtual Education 0 0 0% 0 0%
Capital Outlay 0 1,522 0% 10,000 557%
Driver Training 0 0 0% 0 0%
Declining Enrollment 0 0 0% 0 0%
Extraordinary School Program 0 0 0% 0 0%
Food Service 0 0 0% 0 0%
Professional Development 0 0 0% 0 0%
Parent Education Program 0 0 0% 0 0%
Summer School 0 0 0% 0 0%
Special Education 0 0 0% 0 0%
Cost of Living 0 0 0% 0 0%
Vocational Education 0 0 0% 0 0%
Gifts/Grants 0 0 0% 0 0%
Special Liability Expense 0 0 0% 0 0%
School Retirement 0 0 0% 0 0%
Extraordinary Growth Facilities 0 0 0% 0 0%
Special Reserve 0 0 0%
KPERS Spec. Ret. Contribution 21,199 35,456 67% 35,769 1%
Contingency Reserve 0 0 0%
Text Book & Student Material 0 0 0%
Activity Fund 0 0 0% 0 0%
Bond and Interest #1 0 0 0% 0 0%
Bond and Interest #2 0 0 0% 0 0%
No-Fund Warrant 0 0 0% 0 0%
Special Assessment 0 0 0% 0 0%
Temporary Note 0 0 0% 0 0%
SUBTOTAL 478,145 474,653 -1% 498,612 5%
Enrollment (FTE)* 1,143.0 1,140.0 0% 1,138.0 0%
Amount per Pupil 418 416 0% 438 5%
Adult Education 0 0 0% 0 0%
Adult Supplemental Education 0 0 0% 0 0%
Tuition Reimbursement 0 0 0% 0 0%
Special Education Coop 0 0 0% 0 0%
TOTAL 478,145 474,653 -1% 498,612 5%
NOTE: Gifts/Grants includes private grants and grants from nonfederal sources.
Amount per pupil excludes the following funds: Adult Education, Adult Supplemental Education, Special Education Coop
and Tuition Reimbursement.
*Enrollment (FTE) includes the enrollment of the district used for state aid and budget authority, and all other preschool enrollment
and kindergarten students attending full time.
460,000
465,000
470,000
475,000
480,000
485,000
490,000
495,000
500,000
2010-2011 2011-2012 2012-2013
478,145 474,653
498,612
General Administration Expenditures
9/13/2012 11:00 AM Sumexpen.xls Page 8 of 20

USD# 309
School Administration Expenditures (2400)
% %
2010-2011 2011-2012 inc/ 2012-2013 inc/
Actual Actual dec Budget dec
General 593,128 576,373 -3% 589,200 2%
Federal Funds 0 0 0% 0 0%
Supplemental General 357,783 178,892 -50% 175,000 -2%
At Risk (4yr Old) 0 0 0% 0 0%
At Risk (K-12) 0 0 0% 0 0%
Bilingual Education 0 0 0% 0 0%
Virtual Education 0 0 0% 0 0%
Capital Outlay 13,969 130 -99% 40,000 30669%
Driver Training 0 0 0% 0 0%
Declining Enrollment 0 0 0% 0 0%
Extraordinary School Program 0 0 0% 0 0%
Food Service 0 0 0% 0 0%
Professional Development 0 0 0% 0 0%
Parent Education Program 0 0 0% 0 0%
Summer School 0 0 0% 0 0%
Special Education 0 0 0% 0 0%
Cost of Living 0 0 0% 0 0%
Vocational Education 0 0 0% 0 0%
Gifts/Grants 0 0 0% 0 0%
Special Liability Expense 0 0 0% 0 0%
School Retirement 0 0 0% 0 0%
Extraordinary Growth Facilities 0 0 0% 0 0%
Special Reserve 0 0 0%
KPERS Spec. Ret. Contribution 33,918 56,729 67% 55,830 -2%
Contingency Reserve 0 0 0%
Text Book & Student Material 0 0 0%
Activity Fund 0 0 0% 0 0%
Bond and Interest #1 0 0 0% 0 0%
Bond and Interest #2 0 0 0% 0 0%
No-Fund Warrant 0 0 0% 0 0%
Special Assessment 0 0 0% 0 0%
Temporary Note 0 0 0% 0 0%
SUBTOTAL 998,798 812,124 -19% 860,030 6%
Enrollment (FTE)* 1,143.0 1,140.0 0% 1,138.0 0%
Amount per Pupil 874 712 -18% 756 6%
Adult Education 0 0 0% 0 0%
Adult Supplemental Education 0 0 0% 0 0%
Tuition Reimbursement 0 0 0% 0 0%
Special Education Coop 0 0 0% 0 0%
TOTAL 998,798 812,124 -19% 860,030 6%
NOTE: Gifts/Grants includes private grants and grants from nonfederal sources.
Amount per pupil excludes the following funds: Adult Education, Adult Supplemental Education, Special Education Coop
and Tuition Reimbursement.
*Enrollment (FTE) includes the enrollment of the district used for state aid and budget authority, and all other preschool enrollment
and kindergarten students attending full time.
0
100,000
200,000
300,000
400,000
500,000
600,000
700,000
800,000
900,000
1,000,000
2010-2011 2011-2012 2012-2013
998,798
812,124 860,030
School Administration Expenditures
9/13/2012 11:00 AM Sumexpen.xls Page 9 of 20

USD# 309
Operations and Maintenance Expenditures (2600)
% %
2010-2011 2011-2012 inc/ 2012-2013 inc/
Actual Actual dec Budget dec
General 852,902 902,092 6% 910,824 1%
Federal Funds 0 0 0% 0 0%
Supplemental General 217,901 226,881 4% 247,100 9%
At Risk (4yr Old) 0 0 0% 0 0%
At Risk (K-12) 0 0 0% 0 0%
Bilingual Education 0 0 0% 0 0%
Virtual Education 0 0 0% 0 0%
Capital Outlay 19,404 35,371 82% 40,000 13%
Driver Training 0 0 0% 0 0%
Declining Enrollment 0 0 0% 0 0%
Extraordinary School Program 0 0 0% 0 0%
Food Service 12,264 14,495 18% 15,550 7%
Professional Development 0 0 0% 0 0%
Parent Education Program 0 0 0% 0 0%
Summer School 0 0 0% 0 0%
Special Education 0 0 0% 0 0%
Cost of Living 0 0 0% 0 0%
Vocational Education 0 0 0% 0 0%
Gifts/Grants 0 0 0% 0 0%
Special Liability 0 0 0% 0 0%
School Retirement 0 0 0% 0 0%
Extraordinary Growth Facilities 0 0 0% 0 0%
Special Reserve 0 0 0%
KPERS Spec. Ret. Contribution 33,918 56,729 67% 51,830 -9%
Contingency Reserve 0 0 0%
Text Book & Student Material 0 0 0%
Activity Fund 0 0 0% 0 0%
Bond and Interest #1 0 0 0% 0 0%
Bond and Interest #2 0 0 0% 0 0%
No-Fund Warrant 0 0 0% 0 0%
Special Assessment 0 0 0% 0 0%
Temporary Note 0 0 0% 0 0%
SUBTOTAL 1,136,389 1,235,568 9% 1,265,304 2%
Enrollment (FTE)* 1,143.0 1,140.0 0% 1,138.0 0%
Amount per Pupil 994 1,084 9% 1,112 3%
Adult Education 0 0 0% 0 0%
Adult Supplemental Education 0 0 0% 0 0%
Tuition Reimbursement 0 0 0% 0 0%
Special Education Coop 0 0 0% 0 0%
TOTAL 1,136,389 1,235,568 9% 1,265,304 2%
NOTE: Gifts/Grants includes private grants and grants from nonfederal sources.
Amount per pupil excludes the following funds: Adult Education, Adult Supplemental Education, Special Education Coop
and Tuition Reimbursement.
*Enrollment (FTE) includes the enrollment of the district used for state aid and budget authority, and all other preschool enrollment
and kindergarten students attending full time.
1,060,000
1,080,000
1,100,000
1,120,000
1,140,000
1,160,000
1,180,000
1,200,000
1,220,000
1,240,000
1,260,000
1,280,000
2010-2011 2011-2012 2012-2013
1,136,389
1,235,568
1,265,304
Operations and Maintenance Expenditures
9/13/2012 11:00 AM Sumexpen.xls Page 10 of 20

USD# 309
Other Costs
(2500 & 2900: Other Supplemental Services)
(2700: Transportation)
(3000: Non-Instruction Services)
% %
2010-2011 2011-2012 inc/ 2012-2013 inc/
Actual Actual dec Budget dec
General 517,490 564,146 9% 577,408 2%
Federal Funds 0 0 0% 0 0%
Supplemental General 318,923 434,250 36% 361,782 -17%
At Risk (4yr Old) 0 0 0% 0 0%
At Risk (K-12) 0 0 0% 0 0%
Bilingual Education 0 0 0% 0 0%
Virtual Education 0 0 0% 0 0%
Capital Outlay 0 0 0% 135,000 0%
Driver Training 0 0 0% 0 0%
Declining Enrollment 0 0 0% 0 0%
Extraordinary School Program 0 0 0% 0 0%
Food Service 622,104 622,599 0% 664,050 7%
Professional Development 18,783 33,358 78% 38,500 15%
Parent Education Program 0 0 0% 0 0%
Summer School 0 0 0% 0 0%
Special Education 267,919 183,011 -32% 286,650 57%
Cost of Living 0 0 0% 0 0%
Vocational Education 0 0 0% 0 0%
Gifts/Grants 0 0 0% 0 0%
Special Liability 0 0 0% 0 0%
School Retirement 0 0 0% 0 0%
Extraordinary Growth Facilities 0 0 0% 0 0%
Special Reserve 0 0 0%
KPERS Spec. Ret. Contribution 38,155 63,821 67% 62,287 -2%
Contingency Reserve 0 0 0%
Text Book & Student Material 0 0 0%
Activity Fund 0 0 0% 0 0%
Bond and Interest #1 0 0 0% 0 0%
Bond and Interest #2 0 0 0% 0 0%
No-Fund Warrant 0 0 0% 0 0%
Special Assessment 0 0 0% 0 0%
Temporary Note 0 0 0% 0 0%
SUBTOTAL 1,783,374 1,901,185 7% 2,125,677 12%
Enrollment (FTE)* 1,143.0 1,140.0 0% 1,138.0 0%
Amount per Pupil 1,560 1,668 7% 1,868 12%
Adult Education 0 0 0% 0 0%
Adult Supplemental Education 0 0 0% 0 0%
Tuition Reimbursement 0 0 0% 0 0%
Special Education Coop 0 0 0% 0 0%
TOTAL 1,783,374 1,901,185 7% 2,125,677 12%
NOTE: Gifts/Grants includes private grants and grants from nonfederal sources.
Amount per pupil excludes the following funds: Adult Education, Adult Supplemental Education, Special Education Coop
and Tuition Reimbursement.
*Enrollment (FTE) includes the enrollment of the district used for state aid and budget authority, and all other preschool enrollment
and kindergarten students attending full time.
1,600,000
1,700,000
1,800,000
1,900,000
2,000,000
2,100,000
2,200,000
2010-2011 2011-2012 2012-2013
1,783,374
1,901,185
2,125,677
Other Costs
9/13/2012 11:00 AM Sumexpen.xls Page 11 of 20

USD# 309
Capital Improvements Expenditures (4000)
% %
2010-2011 2011-2012 inc/ 2012-2013 inc/
Actual Actual dec Budget dec
General 0 0 0% 0 0%
Federal Funds 0 0 0% 0 0%
Supplemental General 0 0 0% 0 0%
At Risk (4yr Old) 0 0 0% 0 0%
At Risk (K-12) 0 0 0% 0 0%
Bilingual Education 0 0 0% 0 0%
Virtual Education 0 0 0% 0 0%
Capital Outlay 179,446 249,513 39% 610,000 144%
Driver Training 0 0 0% 0 0%
Declining Enrollment 0 0 0% 0 0%
Extraordinary School Program 0 0 0% 0 0%
Food Service 0 0 0% 0 0%
Professional Development 0 0 0% 0 0%
Parent Education Program 0 0 0% 0 0%
Summer School 0 0 0% 0 0%
Special Education 0 0 0% 0 0%
Cost of Living 0 0 0% 0 0%
Vocational Education 0 0 0% 0 0%
Gifts/Grants 0 0 0% 0 0%
Special Liability 0 0 0% 0 0%
School Retirement 0 0 0% 0 0%
Extraordinary Growth Facilities 0 0 0% 0 0%
Special Reserve 0 0 0%
KPERS Spec. Ret. Contribution 0 0 0% 0 0%
Contingency Reserve 0 0 0%
Text Book & Student Material 0 0 0%
Activity Fund 0 0 0% 0 0%
Bond and Interest #1 0 0 0% 0 0%
Bond and Interest #2 0 0 0% 0 0%
No-Fund Warrant 0 0 0% 0 0%
Special Assessment 0 0 0% 0 0%
Temporary Note 0 0 0% 0 0%
SUBTOTAL 179,446 249,513 39% 610,000 144%
Enrollment (FTE)* 1,143.0 1,140.0 0% 1,138.0 0%
Amount per Pupil 157 219 39% 536 145%
Adult Education 0 0 0% 0 0%
Adult Supplemental Education 0 0 0% 0 0%
Tuition Reimbursement 0 0 0% 0 0%
Special Education Coop 0 0 0% 0 0%
TOTAL 179,446 249,513 39% 610,000 144%
NOTE: Gifts/Grants includes private grants and grants from nonfederal sources.
Amount per pupil excludes the following funds: Adult Education, Adult Supplemental Education, Special Education Coop
and Tuition Reimbursement.
*Enrollment (FTE) includes the enrollment of the district used for state aid and budget authority, and all other preschool enrollment
and kindergarten students attending full time.
0
100,000
200,000
300,000
400,000
500,000
600,000
700,000
2010-2011 2011-2012 2012-2013
179,446
249,513
610,000
Capital Improvements (4000)
9/13/2012 11:00 AM Sumexpen.xls Page 12 of 20

USD# 309
Debt Services Expenditures (5100)
% %
2010-2011 2011-2012 inc/ 2012-2013 inc/
Actual Actual dec Budget dec
General 0 0 0% 0 0%
Federal Funds 0 0 0% 0 0%
Supplemental General 0 0 0% 0 0%
At Risk (4yr Old) 0 0 0% 0 0%
At Risk (K-12) 0 0 0% 0 0%
Bilingual Education 0 0 0% 0 0%
Virtual Education 0 0 0% 0 0%
Capital Outlay 0 0 0% 0 0%
Driver Training 0 0 0% 0 0%
Declining Enrollment 0 0 0% 0 0%
Extraordinary School Program 0 0 0% 0 0%
Food Service 0 0 0% 0 0%
Professional Development 0 0 0% 0 0%
Parent Education Program 0 0 0% 0 0%
Summer School 0 0 0% 0 0%
Special Education 0 0 0% 0 0%
Cost of Living 0 0 0% 0 0%
Vocational Education 0 0 0% 0 0%
Gifts/Grants 0 0 0% 0 0%
Special Liability 0 0 0% 0 0%
School Retirement 0 0 0% 0 0%
Extraordinary Growth Facilities 0 0 0% 0 0%
Special Reserve 0 0 0%
KPERS Spec. Ret. Contribution 0 0 0% 0 0%
Contingency Reserve 0 0 0%
Text Book & Student Material 0 0 0%
Activity Fund 0 0 0% 0 0%
Bond and Interest #1 508,803 506,415 0% 508,981 1%
Bond and Interest #2 0 0 0% 0 0%
No-Fund Warrant 0 0 0% 0 0%
Special Assessment 0 0 0% 0 0%
Temporary Note 0 0 0% 0 0%
SUBTOTAL 508,803 506,415 0% 508,981 1%
Enrollment (FTE)* 1,143.0 1,140.0 0% 1,138.0 0%
Amount per Pupil 445 444 0% 447 1%
Adult Education 0 0 0% 0 0%
Adult Supplemental Education 0 0 0% 0 0%
Tuition Reimbursement 0 0 0% 0 0%
Special Education Coop 0 0 0% 0 0%
TOTAL 508,803 506,415 0% 508,981 1%
NOTE: Gifts/Grants includes private grants and grants from nonfederal sources.
Amount per pupil excludes the following funds: Adult Education, Adult Supplemental Education, Special Education Coop
and Tuition Reimbursement.
*Enrollment (FTE) includes the enrollment of the district used for state aid and budget authority, and all other preschool enrollment
and kindergarten students attending full time.
505,000
505,500
506,000
506,500
507,000
507,500
508,000
508,500
509,000
2010-2011 2011-2012 2012-2013
508,803
506,415
508,981
Debt Services (5100)
9/13/2012 11:00 AM Sumexpen.xls Page 13 of 20

USD# 309
Transfers (5200)
% %
2010-2011 2011-2012 inc/ 2012-2013 inc/
Actual Actual dec Budget dec
General 2,385,837 2,325,050 -3% 2,311,976 -1%
Federal Funds 0 0 0% 0 0%
Supplemental General 1,250,000 1,205,346 -4% 1,235,000 2%
At Risk (4yr Old) 0 0 0% 0 0%
At Risk (K-12) 0 0 0% 0 0%
Bilingual Education 0 0 0% 0 0%
Virtual Education 0 0 0% 0 0%
Capital Outlay
Driver Training 0 0 0% 0 0%
Declining Enrollment 0 0 0% 0 0%
Extraordinary School Program 0 0 0% 0 0%
Food Service 0 0 0% 0 0%
Professional Development 0 0 0% 0 0%
Parent Education Program 0 0 0% 0 0%
Summer School 0 0 0% 0 0%
Special Education 0 0 0% 0 0%
Cost of Living 0 0 0% 0 0%
Vocational Education 0 0 0% 0 0%
Gifts/Grants 0 0 0% 0 0%
Special Liability 0 0 0% 0 0%
School Retirement 0 0 0% 0 0%
Extraordinary Growth Facilities 0 0 0% 0 0%
Special Reserve 0 0 0%
KPERS Spec. Ret. Contribution 0 0 0% 0 0%
Contingency Reserve 0 0 0% 0 0%
Text Book & Student Material 0 0 0% 0 0%
Activity Fund 0 0 0% 0 0%
Bond and Interest #1 0 0 0% 0 0%
Bond and Interest #2 0 0 0% 0 0%
No-Fund Warrant 0 0 0% 0 0%
Special Assessment 0 0 0% 0 0%
Temporary Note 0 0 0% 0 0%
SUBTOTAL 3,635,837 3,530,396 -3% 3,546,976 0%
Enrollment (FTE)* 1,143.0 1,140.0 0% 1,138.0 0%
Amount per Pupil 3,181 3,097 -3% 3,117 1%
Adult Education 0 0 0% 0 0%
Adult Supplemental Education 0 0 0% 0 0%
Tuition Reimbursement 0 0 0% 0 0%
Special Education Coop 0 0 0% 0 0%
TOTAL 3,635,837 3,530,396 -3% 3,546,976 0%
NOTE: Gifts/Grants includes private grants and grants from nonfederal sources.
Amount per pupil excludes the following funds: Adult Education, Adult Supplemental Education, Special Education Coop
and Tuition Reimbursement.
*Enrollment (FTE) includes the enrollment of the district used for state aid and budget authority, and all other preschool enrollment
and kindergarten students attending full time.
3,460,000
3,480,000
3,500,000
3,520,000
3,540,000
3,560,000
3,580,000
3,600,000
3,620,000
3,640,000
2010-2011 2011-2012 2012-2013
3,635,837
3,530,396 3,546,976
Transfers (5200)
9/13/2012 11:00 AM Sumexpen.xls Page 14 of 20
USD# 309
Miscellaneous Information
Unencumbered Cash Balance by Fund
July 1, 2010 July 1, 2011 July 1, 2012
General 0 0 0
Federal Funds 95,802 68,602 35,839
Supplemental General 93,330 126,951 134,971
At Risk (4yr Old) 29,533 31,705 34,833
At Risk (K-12) 157,719 206,315 168,350
Bilingual Education 45,951 41,788 32,986
Virtual Education 0 0 0
Capital Outlay 1,522,963 1,634,736 1,760,877
Driver Training 37,322 40,087 43,433
Declining Enrollment 0 0 0
Extraordinary School Program 0 0 0
Food Service 215,649 203,908 206,877
Professional Development 85,588 90,962 95,850
Parent Education Program 31,886 22,894 21,080
Summer School 0 0 0
Special Education 631,935 684,286 768,047
Cost of Living 0 0 0
Vocational Education 114,030 142,875 136,006
Gifts/Grants 0 1,108 0
Special Liability 0 0 0
School Retirement 0 0 0
Extraordinary Growth Facilities 0 0 0
Special Reserve 0 0 0
KPERS Spec. Ret. Contribution 0 0 0
Contingency Reserve 500,000 500,000 500,000
Text Book & Student Material 40,579 64,442 82,417
Activity Fund 186 7,585 10,908
Bond and Interest #1 418,855 435,453 425,438
Bond and Interest #2 0 0 0
No Fund Warrant 0 0 0
Special Assessment 0 0 0
Temporary Note 0 0 0
SUBTOTAL 4,021,328 4,303,697 4,457,912
Enrollment (FTE)* 1,143.0 1,140.0 1,138.0
Amount per Pupil 3,518 3,775 3,917
Adult Education 0 0 0
Adult Supplemental Education 0 0 0
Tuition Reimbursement 0 0 0
Special Education Coop 0 0 0
TOTAL 4,021,328 4,303,697 4,457,912
NOTE: Gifts/Grants includes private grants and grants from nonfederal sources.
Amount per pupil excludes the following funds: Adult Education, Adult Supplemental Education, Special Education Coop
and Tuition Reimbursement.
*Enrollment (FTE) includes the enrollment of the district used for state aid and budget authority, and all other preschool enrollment
and kindergarten students attending full time.
0
500,000
1,000,000
1,500,000
2,000,000
2,500,000
3,000,000
3,500,000
4,000,000
4,500,000
July 1, 2010 July 1, 2011 July 1, 2012
4,021,328 4,303,697 4,457,912
Unencumbered Cash Balances by Fund
9/13/2012 11:00 AM Sumexpen.xls Page 15 of 20

USD# 309
Reserve Funds
Unencumbered Cash Balance
July 1, 2010 July 1, 2011 July 1, 2012
Special Reserve 0 0 0
TOTAL OTHER 0 0 0
Amount per Pupil $0 $0 $0
*School districts are authorized by law to self insure rather than purchase insurance for the following categories: Worker's Comp,
Health Insurance, Life Insurance, Property and Casualty (Risk Management) and Disability Income Insurance. Monies are placed
in the Self Insured Fund to pay for claims which may arise from the categories listed above.
0
0
0
1
1
1
July 1, 2010 July 1, 2011 July 1, 2012
0 0 0
Unencumbered Cash Balances by Fund (Reserve Funds Only)
9/13/2012 11:00 AM Sumexpen.xls Page 16 of 20
USD# 309
2008-2009 2009-2010 % 2010-2011 % 2011-2012 % 2012-2013 %
Actual Actual inc/ Actual inc/ Actual inc/ Budget inc/
dec dec dec dec
Enrollment (FTE)* 1,132.4 1,132.7 0% 1,126.9 -1% 1,086.1 -4% 1,085.0 0%
Enrollment (FTE)** 1,147.5 1,149.0 0% 1,143.0 -1% 1,140.0 0% 1,138.0 0%
Number of Students -
Free Meals 507 533 5% 552 4% 509 -8% 520 2%
Number of Students -
Reduced Meals 175 181 3% 169 -7% 173 2% 170 -2%
4 years worth
*FTE for state aid and budget authority purposes for general fund (excludes 4 yr old at-risk).
** FTE includes 9/20 enrollment used for state aid purposes and adding the additional FTE for preschool programs, headstart, and all-day
kindergarten. For example, preschool students attending half days on September 20th would be counted as .5 FTE. Kindergarten
students attending full time every day would be counted as 1.0 FTE.
Enrollment Information
1130.0
1135.0
1140.0
1145.0
1150.0
2008-2009 2009-2010 2010-2011 2011-2012 2012-2013
1147.5 1149.0
1143.0
1140.0
1138.0
Enrollment (FTE)** Used for Calculating "Amount per Pupil"
0
100
200
300
400
500
600
2008-2009 2009-2010 2010-2011 2011-2012 2012-2013
507 533 552
509 520
175 181 169 173 170
Low Income Students
Free Meals
Reduced Meals
1060.0
1080.0
1100.0
1120.0
1140.0
2008-2009 2009-2010 2010-2011 2011-2012 2012-2013
1132.4 1132.7 1126.9
1086.1 1085.0
FTE Enrollment for Budget Authority
9/13/2012 11:00 AM Sumexpen.xls Page 17 of 20

USD# 309
Miscellaneous Information
Mill Rates by Fund
2010-2011 2011-2012 2012-2013
Actual Actual Budget
General 20.000 20.000 20.000
Supplemental General 21.799 22.668 22.555
Adult Education 0.000 0.000 0.000
Capital Outlay 1.990 1.986 2.000
Declining Enrollment 0.000 0.000 0.000
Cost of Living 0.000 0.000 0.000
Special Liability 0.000 0.000 0.000
School Retirement 0.000 0.000 0.000
Extraordinary Growth Facilities 0.000 0.000 0.000
Bond and Interest #1 5.137 4.861 4.745
Bond and Interest #2 0.000 0.000 0.000
No Fund Warrant 0.000 0.000 0.000
Special Assessment 0.000 0.000 0.000
Temporary Note 0.000 0.000 0.000
TOTAL USD 48.926 49.515 49.300
Historical Museum 0.000 0.000 0.000
Public Library Board 0.000 0.000 0.000
Public Library Brd & Emp Benf 0.000 0.000 0.000
Recreation Commission 0.000 0.000 0.000
Rec Comm Employee Bnfts 0.000 0.000 0.000
TOTAL OTHER 0.000 0.000 0.000
0.000
10.000
20.000
30.000
40.000
50.000
60.000
70.000
80.000
2010-2011 2011-2012 2012-2013
48.926 49.515 49.300
Total USD Mill Rates
General 40%
Supplemental General 46%
Capital Outlay 4%
Bond and Interest #1 10%
2012-2013 Miscellaneous Information Mill Rates by Fund (Total USD)
GeneralSupplemental GeneralAdult EducationCapital OutlaySpecial LiabilitySchool RetirementDeclining EnrollmentCost of LivingBond and Interest #1Bond and Interest #2Extraordinary Growth FacilitiesNo Fund WarrantSpecial AssessmentTemporary Note
9/13/2012 11:00 AM Sumexpen.xls Page 18 of 20

USD# 309
Other Information
2010-2011 2011-2012 2012-2013
Actual Actual Budget
Assessed Valuation $62,638,436 $63,069,805 $64,976,651
Bonded Indebtedness $4,160,000 $3,795,000 $3,420,000
$61,000,000
$61,500,000
$62,000,000
$62,500,000
$63,000,000
$63,500,000
$64,000,000
$64,500,000
$65,000,000
2010-2011 2011-2012 2012-2013
$62,638,436
$63,069,805
$64,976,651
Assessed Valuation
$0
$500,000
$1,000,000
$1,500,000
$2,000,000
$2,500,000
$3,000,000
$3,500,000
$4,000,000
$4,500,000
2010-2011 2011-2012 2012-2013
$4,160,000 $3,795,000
$3,420,000
Bonded Indebtedness
9/13/2012 11:00 AM Sumexpen.xls Page 19 of 20
USD 309
2012-13 Estimated Sources of Revenue--2012-13 Estimated
Amount July 1, 2012 State Federal Local July 1, 2013
Fund Budgeted Cash Balance Interest Transfers Other Cash Balance
General 7,963,466 0 6,846,607 0 0 1,116,859 XXXXXXXX
Supplemental General 2,699,630 134,971 1,032,123 1,532,536 XXXXXXXX
Adult Education 0 0 0 0 0 0 0 0
At Risk (4yr Old) 64,300 34,833 0 0 65,000 0 35,533
Adult Supplemental Education 0 0 0 0 0 0
At Risk (K-12) 1,195,500 168,350 0 0 1,180,000 0 152,850
Bilingual Education 63,600 32,986 0 0 60,000 3,000 32,386
Virtual Education 0 0 0 0 0 0
Capital Outlay 955,000 1,760,877 0 0 0 181,868 987,745
Driver Training 12,380 43,433 3,150 0 10,000 0 44,203
Declining Enrollment 0 0 0 0 XXXXXXXX
Extraordinary School Program 0 0 0 0 0 0
Food Service 679,600 206,877 6,444 426,933 0 0 195,800 156,454
Professional Development 43,500 95,850 0 0 40,000 0 92,350
Parent Education Program 8,000 21,080 0 0 0 5,000 0 18,080
Summer School 0 0 0 0 0 0 0
Special Education 1,771,650 768,047 0 0 0 1,856,976 35,000 888,373
Vocational Education 293,550 136,006 8,450 0 0 330,000 0 180,906
Special Liability Expense Fund 0 0 0 0 0
Special Reserve Fund 0 XXXXXXXX
Gifts and Grants 0 0 0 0
Textbook & Student Materials Revolving 82,417 XXXXXXXX
School Retirement 0 0 0 0 0
Extraordinary Growth Facilities 0 0 0 0 XXXXXXXXX
KPERS Special Retirement Contribution 693,133 0 693,133 XXXXXXXXX
Contingency Reserve 500,000 XXXXXXXXX
Activity Funds 10,908 XXXXXXXXX
Tuition Reimbursement 0 0 0 0 0
Bond and Interest #1 508,981 425,438 147,604 0 0 339,813 403,874
Bond and Interest #2 0 0 0 0 0 0 0
No Fund Warrant 0 0 0 0
Special Assessment 0 0 0 0
Temporary Note 0 0 0 0 0
Coop Special Education 0 0 0 0 0 0 0
Federal Funds 401,880 35,839 xxxxxxxxxxx 381,041 xxxxxxxxxxxx xxxxxxxxxxxx xxxxxxxxxxx 15,000
Cost of Living 0 0 xxxxxxxxxxx xxxxxxxxxxx xxxxxxxxxxxx 0 0 XXXXXXXXX
SUBTOTAL 17,354,170 4,457,912 8,737,511 807,974 0 3,546,976 3,404,876 3,007,754
Less Transfers 3,546,976
TOTAL Budget Expenditures $13,807,194
Sources of Revenue and Proposed Budget for 2012-13
9/13/2012 11:00 AM Code No. 99a