use of alternative fuels and hybrid vehicles by small urban
TRANSCRIPT

Use of Alternative Fuels and Hybrid Vehicles by Small Urban and Rural Transit Systems
Jeremy Mattson
Small Urban & Rural Transit Center Upper Great Plains Transportation Institute
North Dakota State University, Fargo
April 2012

Acknowledgements The author would like to thank the transit providers who responded to the survey. This research was sponsored by the Federal Transit Administration and United States Department of Transportation, and conducted by the Small Urban & Rural Transit Center within the Upper Great Plains Transportation Institute at North Dakota State University. The guidance of Jill Hough, Director of the Small Urban & Rural Transit Center, Jarrett Stoltzfus, FTA Project Manager for the project, is also acknowledged. North Dakota State University does not discriminate on the basis of age, color, disability, gender expression/identity, genetic information, marital status, national origin, public assistance status, sex, sexual orientation, status as a U.S. veteran, race or religion. Direct inquiries to the Vice President for Equity, Diversity and Global Outreach, 205 Old Main, (701)231-7708.

ABSTRACT A survey was conducted of small urban and rural transit agencies regarding their use of alternative fuels and hybrid vehicles. Responses were received from 115 transit providers across the country, including 31 that use biodiesel, eight that use E85, 10 that use compressed natural gas (CNG), four that use propane, and 24 that own hybrid-electric vehicles. Larger agencies and those operating in urban areas tend to be more likely to adopt alternatives than smaller, rural providers. Improving public perception, reducing emissions, and reducing operating costs tend to be the greatest motivating factors for adopting these alternatives, in addition to political directives and incentives. Concerns about infrastructure development and costs, vehicle costs, maintenance, and fuel supply are the greatest deterrents to adoption. Those agencies that have adopted alternative fuels or hybrids have been mostly satisfied with their experience, but some problems were identified. An analysis of satisfaction with biodiesel indicates that agencies with a larger fleet size and those that have committed a larger percentage of their fleet to biodiesel have been more satisfied with the fuel. Findings provide useful information to transit operators considering adoption of alternative fuels and hybrids and to policy makers considering policies on alternative fuels and hybrids.


TABLE OF CONTENTS
1. INTRODUCTION .............................................................................................................................. 1
1.1 Objectives ....................................................................................................................................... 1 1.2 Methods .......................................................................................................................................... 1
2. BACKGROUND ................................................................................................................................. 3
2.1 Biodiesel .................................................................................................................................... 3 2.2 E85 ............................................................................................................................................ 3 2.3 Propane ...................................................................................................................................... 3 2.4 Natural Gas ................................................................................................................................ 4 2.5 Hybrid-Electric Buses ............................................................................................................... 4
3. BENEFITS AND DETERRENTS TO ADOPTION ........................................................................ 5
3.1 Emissions .................................................................................................................................. 5 3.2 Greenhouse Gas Emissions ....................................................................................................... 7 3.3 Fuel Efficiency .......................................................................................................................... 8 3.4 Performance/Reliability ............................................................................................................. 9 3.5 Cost ............................................................................................................................................ 9
3.5.1 Capital Costs.................................................................................................................... 9 3.5.2 Operating Costs ............................................................................................................. 10 3.5.3 Total Costs ..................................................................................................................... 11
3.6 Availability .............................................................................................................................. 12 3.7 Characteristics of Agencies that have had Success ................................................................. 12
4. SURVEY DESIGN AND ADMINISTRATION ............................................................................. 13
5. AGENCY CHARACTERISTICS ................................................................................................... 15
6. BIODIESEL ...................................................................................................................................... 19
6.1 Biodiesel Users ........................................................................................................................ 19 6.2 Biodiesel Non-Users ................................................................................................................ 25
7. E85 ................................................................................................................................................. 27
7.1 E85 Users ................................................................................................................................ 27 7.2 E85 Non-Users ........................................................................................................................ 30
8. PROPANE ......................................................................................................................................... 33
8.1 Propane Users .......................................................................................................................... 33 8.2 Propane Non-Users .................................................................................................................. 36
9. NATURAL GAS ............................................................................................................................... 39
9.1 Natural Gas Users .................................................................................................................... 39 9.2 Natural Gas Non-Users ........................................................................................................... 42
10. HYBRID-ELECTRIC VEHICLES ................................................................................................. 45
10.1 Hybrid Users............................................................................................................................ 45 10.2 Hybrid Non-Users ................................................................................................................... 49

11. DIFFERENCES BETWEEN USERS AND NON-USERS ........................................................... 51
11.1 Agency Characteristics ............................................................................................................ 51 11.2 Perceived Benefits ................................................................................................................... 52 11.3 Deterrents ................................................................................................................................ 52
12. DIFFERENCES BETWEEN FUELS ............................................................................................. 55
12.1 Reasons for Adoption .............................................................................................................. 55 12.2 Deterrents and Problems with Use .......................................................................................... 56 12.3 Satisfaction .............................................................................................................................. 57
13. DIFFERENCES BETWEEN URBAN AND RURAL TRANSIT PROVIDERS ........................ 59
14. FACTORS AFFECTING BIODIESEL AND HYBRID ADOPTION AND
SATISFACTION .............................................................................................................................. 61
14.1 Factors Affecting Adoption ..................................................................................................... 61 14.2 Factors Affecting Satisfaction with Biodiesel ......................................................................... 63
15. SUMMARY AND CONCLUSIONS ............................................................................................... 65
REFERENCES .......................................................................................................................................... 67
APPENDIX A. ALTERNATIVE FUELS AND HYBRID VEHICLES SURVEY ............................. 71
APPENDIX B. DIFFERENCES BETWEEN USERS AND NON-USERS REGARDING PERCEIVED BENEFITS AND DETERRENTS .......................................................................... 90

LIST OF FIGURES
Figure 5.1 Locations of Transit Agencies Responding to Survey ......................................................... 15
Figure 5.2 Alternative Fuel and Hybrid Vehicle Use by Responding Agencies ................................... 17
Figure 5.3 Locations of Responding Transit Agencies that use Alternative Fuels or Hybrids ............. 18
Figure 6.1 Biodiesel Blends Used by Agencies that Use Biodiesel ...................................................... 19
Figure 6.2 Reasons for Adopting Biodiesel ........................................................................................... 20
Figure 6.3 Deterrents before Adoption by Biodiesel Users ................................................................... 21
Figure 6.4 Satisfaction with Biodiesel ................................................................................................... 22
Figure 6.5 Reported Problems with Biodiesel ....................................................................................... 23
Figure 6.6 Comparison of Deterrents with Actual Problems Experienced for Biodiesel Users ............ 23
Figure 6.7 Deterrents for Agencies Not Using Biodiesel ...................................................................... 25
Figure 6.8 Potential Benefits of Biodiesel Identified by Agencies Not Using the Fuel ........................ 26
Figure 7.1 Reasons for Adopting E85 ................................................................................................... 27
Figure 7.2 Deterrents Before Adoption by E85 Users ........................................................................... 28
Figure 7.3 Reported Problems with E85 ............................................................................................... 29
Figure 7.4 Deterrents for Agencies with Flex Fuel Vehicles that do not use E85 ................................. 30
Figure 7.5 Benefits of E85 Identified by Non Users ............................................................................. 31
Figure 8.1 Reasons for Adopting Propane Given by Agencies that Use the Fuel ................................. 33
Figure 8.2 Deterrents for Using Propane Considered by Agencies that Adopted the Fuel ................... 34
Figure 8.3 Problems Reported with Using Propane .............................................................................. 35
Figure 8.4 Deterrents from Adopting Propane by Agencies that do not use Propane ........................... 36
Figure 8.5 Perceived Benefits of Propane by Agencies that do not use Propane .................................. 37
Figure 9.1 Reasons Given for Adopting CNG ...................................................................................... 39
Figure 9.2 Deterrents for Adopting CNG Considered by Agencies that Use CNG .............................. 40
Figure 9.3 Problems Reported with CNG Vehicles............................................................................... 41
Figure 9.4 Deterrents for Adopting CNG by Agencies not Using CNG ............................................... 42
Figure 9.5 Perceived Benefits of CNG by Agencies not using CNG .................................................... 43
Figure 10.1 Reasons Given for Adopting Hybrid-Electric Vehicles ....................................................... 45
Figure 10.2 Deterrents for Hybrid Vehicles Considered by Agencies that Use Hybrids ........................ 46
Figure 10.3 Problems Reported with Hybrid-Electric Vehicles .............................................................. 47
Figure 10.4 Comparison of Concerns before Adopting and Reported Problems with Hybrid-Electric Vehicles ...................................................................................................... 48
Figure 10.5 Deterrents for Adopting Hybrid Vehicles by Agencies that do not use Hybrids ................. 49
Figure 10.6 Perceived Benefits of Hybrids by Non-Users ...................................................................... 50
Figure B.1 Comparison of Perceived Biodiesel Benefits between Users and Non-Users ..................... 90
Figure B.2 Comparison of Perceived E85 Benefits between Users and Non-Users .............................. 91
Figure B.3 Comparison of Perceived CNG Benefits between Users and Non-Users ............................ 91
Figure B.4 Comparison of Perceived Hybrid Benefits between Users and Non-Users ......................... 92
Figure B.5 Comparison of Biodiesel Deterrents between Users and Non-Users ................................... 93
Figure B.6 Comparison of CNG Deterrents between Users and Non-Users ......................................... 94
Figure B.7 Comparison of Hybrid Deterrents between Users and Non-Users ....................................... 95

LIST OF TABLES
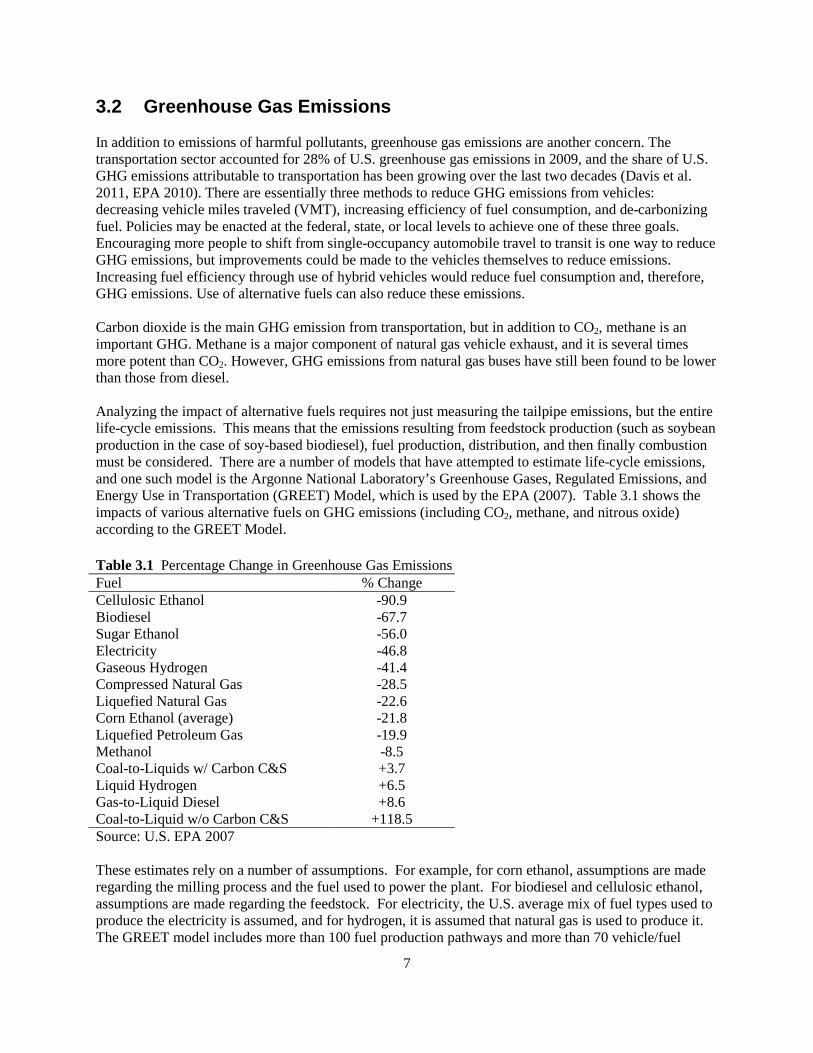
Table 3.1 Percentage Change in Greenhouse Gas Emissions .................................................................. 7
Table 3.2 Average Vehicle Purchase Price, by Vehicle Type ............................................................... 10
Table 3.3 Capital and Operating Costs for Full-Size Transit Bus, by Vehicle Type ............................. 11
Table 4.1 Number of Transit Agencies Surveyed .................................................................................. 13
Table 5.1 Operating Data for Agencies Responding to Survey ............................................................. 16
Table 5.2 Operating Characteristics of Small Urban and Rural Providers ............................................ 16
Table 11.1 Agency Characteristics, Comparison between Alternative Fuel and Hybrid Users and Non-users ........................................................................................................................ 51
Table 12.1 Reasons for Adopting Alternative Fuels and Hybrids ........................................................... 55
Table 12.2 Satisfaction Reported with Each Alternative Fuel and Hybrid .............................................. 57
Table 13.1 Use of Alternative Fuels and Hybrid Vehicles, by Urban and Rural ..................................... 59
Table 13.2 Satisfaction with Alternative Fuels and Hybrid Vehicles, by Urban and Rural .................... 60
Table 14.1 Results from Binary Logit Models of Adoption .................................................................... 62
Table 14.2 Factors Affecting Satisfaction with Biodiesel Use, Results from Ordered Logit Model ...... 64


1
1. INTRODUCTION Transit agencies of all sizes across the country have been or are considering using alternative fuels or hybrid-electric vehicles. The use of these alternatives has increased in recent years due to concerns about environmental and energy issues and increased incentives and regulations from local, state, and federal governments that have encouraged their use. Transit agencies have been leaders in using alternative fuel vehicles. Smaller transit agencies, including those operating in small urban and rural areas, however, may face greater difficulties in transitioning to alternative fuel or hybrid vehicles. Infrastructure or capital costs could be prohibitively expensive, or they could lack the resources and expertise to successfully operate these vehicles. Furthermore, the supply of alternative fuel or hybrid vehicles that are designed to meet their standards could be limited, as could an adequate and dependable supply of the fuel in rural and small urban areas. Reliability and maintenance issues could also be a concern for smaller agencies that could face significant disruptions in service if any of their vehicles are out of service. Small urban and rural transit agencies need to be fully informed of the costs and benefits of alternative fuels and hybrid vehicles before adoption, and they can learn from the experiences of those that have been using these alternatives. Decision makers also need to understand the needs and concerns of transit agencies. Policies should be adopted so they avoid encouraging agencies to adopt alternatives that are too costly or problematic. An understanding of the factors motivating an agency to adopt an alternative fuel and the deterrents that prevent them from doing so could also be helpful for policy makers and industry leaders who desire increased use of alternative fuels and hybrid vehicles.
1.1 Objectives The objectives of this study are 1) to identify and describe the usage of alternative fuel and hybrid vehicles by small urban and rural transit agencies; 2) to identify the motivating factors for the adoption of alternative fuels and hybrids for these agencies; 3) to document the deterrents for adoption; 4) to describe the experience of transit agencies that have adopted alternative fuels or hybrid vehicles, including costs, fuel economy, maintenance, reliability, etc., and the overall satisfaction; 5) to determine how use varies by characteristics of transit agencies and beliefs about deterrents and benefits; and 6) to determine which factors explain the difference between those agencies with a satisfactory experience and those that have experienced difficulties. 1.2 Methods
To accomplish these objectives, a survey was conducted of small urban and rural transit providers. Small urban providers are defined as those operating in urbanized areas with a population below 200,000. Responses were received from 115 agencies across the country. This study examines the use of biodiesel, E85, propane, natural gas, and hybrid-electric vehicles. The survey asked users to identify motivations and concerns regarding their decision to adopt and to describe problems experienced and their overall satisfaction. Non-users were asked to identify deterrents and potential benefits from adoption. Differences between users and non-users, small urban providers and rural providers, and between the different fuel alternatives were analyzed. Survey design and administration are discussed in section 4, characteristics of responding agencies are presented in section 5, and results from the survey are analyzed in sections 6-13. A logit model is developed and estimated in section 14 to analyze the impacts of agency characteristics and perceived benefits and deterrents on the adoption and satisfaction with biodiesel and hybrid vehicles. The next two sections of the paper provide background information on alternative fuels and hybrid vehicles, including a review of previous studies on the benefits and deterrents of each.

2

3
2. BACKGROUND
This study examined biodiesel, E85, propane, natural gas, and hybrid-electric vehicles. Descriptions of each of these are provided in this section. 2.1 Biodiesel The technical definition of biodiesel is a fuel composed of mono-alkyl esters of long chain fatty acids derived from vegetable oils or animal fats and meeting the requirements of American Society for Testing and Materials (ASTM) D 6751 (National Biodiesel Board 2012). Biodiesel is most often blended with petroleum-based diesel fuel, at varying concentrations, for use in existing diesel engines, with little or no modifications required. In the United States, biodiesel is mostly produced from domestically grown soybeans, or in some cases, canola or other vegetable oils, recycled vegetable oils, or animal fats. Since it is domestically produced, it could lessen dependence on imports of foreign oil. Many states and cities are now requiring or encouraging use of biodiesel blends in state- or city-owned, diesel-powered vehicles. 2.2 E85 E85 is a fuel for use in Flexible Fuel Vehicles (FFVs) made up of 85% ethanol and 15% unleaded gasoline. The American Coalition for Ethanol reports that there are more than 8.5 million FFVs, which can run on straight gasoline or any blend of ethanol up to 85%, currently on American roads as of 2011. Ethanol is the most common biofuel in the United States, and currently most U.S. ethanol is produced from corn. Support for ethanol, like biodiesel, is based on it being a domestically produced renewable fuel. Due to increased demand and government policies supporting the product, U.S. ethanol production rose steadily over the past decade. Most of the ethanol has been mixed at blends of 10% or less, but the number of E85 pumps has also increased nationwide. 2.3 Propane Liquified Petroleum Gas (LPG), also known as propane, is produced as a by-product of natural gas processing and crude oil refining. According to the U.S. Department of Energy (2010a), it accounts for about 2% of energy used in the United States, but less than 2% of U.S. propane consumption is used for transportation fuel. The Texas Transportation Institute (TTI) (2007) found it was the only alternative fuel used by small urban and rural transit providers in Texas. Propane is used to fuel small transit and school buses, while compressed natural gas is more common in large transit vehicles (TTI 2007). There is a trend away from using propane, though, and toward use of other alternative fuels and vehicle technologies, such as hybrids (Werpy et al. 2010). Werpy et al. (2010) noted that propane has found some success in the paratransit bus market. Most propane consumed in the United States is domestically produced, providing support for use of the fuel as a means to reduce dependence on foreign energy sources. The United States and Canada are the world’s largest producers of LPG (Werpy et al. 2010).

4
2.4 Natural Gas Natural gas is a fossil fuel composed mostly of methane. As a transportation fuel, it can be used in the form of compressed natural gas (CNG) or liquefied natural gas (LNG). Like propane, most (about 87%) natural gas in the United States is produced domestically, with some also imported from Canada (U.S. Department of Energy 2011). Most natural gas is extracted from gas and oil wells. Natural gas accounts for approximately one-quarter of the energy used in the United States, but only about .01% is used for transportation fuel (U.S. Department of Energy 2010b). 2.5 Hybrid-Electric Buses Hybrid-electric buses use similar technologies as those used in hybrid-electric cars and trucks, including regenerative braking, electric motors, and battery storage. Most hybrid buses, though, couple electric motors with diesel engines, instead of the typical gasoline-electric hybrid configurations used in light-duty vehicles. A hybrid-electric vehicle consists of a fuel-burning prime power source, generally an internal combustion engine, coupled with an electrochemical or electrostatic energy storage device. Hybrid vehicles are favored for their improved fuel economy. Recent government policies have encouraged the purchase of hybrid buses. For example, the Federal Transit Administration (FTA), in 2010 and 2011, awarded funding through its Clean Fuels Grant Program and the Transit Investment in Greenhouse Gas and Energy Reduction (TIGGER) Program to a number of transit systems for the purchase of hybrid buses.

5
3. BENEFITS AND DETERRENTS TO ADOPTION Alternative fuels and hybrid vehicles have become popular due to their perceived environmental and energy security benefits. Studies have shown that their use can reduce emissions of harmful pollutants and greenhouse gases. Since alternative fuels are largely produced domestically, increased use of these fuels would reduce dependence on foreign energy sources and could benefit local economies. Biofuels, such as biodiesel or ethanol, are also made from renewable resources, lessening our need for fossil fuels. In addition, as prices of gasoline and diesel rise, there could be some cost advantages to using certain alternative fuels. A number of government incentives have also made alternative fuels and hybrid vehicles more attractive economically for transit agencies. A study by the Federal Transit Administration (2006) found that the reasons transit agencies choose alternative fuels instead of diesel include:
• Complying with federal air quality regulations in non-attainment or maintenance areas • Reducing tailpipe emissions of particulate matter and toxic gases • Improving local air quality • Improving public perception of transit to attract new riders • Higher levels of federal or state assistance for purchase of alternative fuel buses • Recent price increases of oil • Reducing dependency on foreign oil • Industry groups advocating specific fuels • Achieving local priorities such as increasing use of fuels derived from local sources
A number of barriers, however, have inhibited greater use of alternative fuels in transit vehicles. The FTA study found that these barriers include:
• Higher capital costs of alternative fuel vehicles and supporting facilities • Higher operating costs, including fuel and maintenance costs • Reliability and durability concerns • Limited availability of alternative fuels • Risk of interruptions in fuel delivery
Additional details regarding the potential benefits of alternative fuels and hybrid vehicles, as well as the disadvantages, or barriers, that deter agencies from adopting these alternatives, is provided in this section. 3.1 Emissions In many parts of the country, air pollution is a major public health concern. Several studies have examined the impact that alternative fuels and hybrids have on emissions of these harmful pollutants. The most common diesel emissions are carbon monoxide (CO), nitrogen oxides (NOx), particulate matter (PM), and hydrocarbons (HC). These four pollutants are subject to U.S. EPA motor vehicle emissions standards. Particulate matter is a general term used to describe the mixture of solid particles and liquid droplets in the air. These particles, which are produced from diesel and gasoline engines, can affect respiratory health and can carry toxic substances into the lungs and bloodstream. CO is a poison, and NOx and HC can form ground level ozone, a principal component of smog. Alternative fuel vehicles have been found to produce fewer emissions and are inherently cleaner than conventional diesel because they do not contain toxins such as benzene (FTA 2006). Peterson and Mattson (2008) reviewed studies on the impacts of biodiesel on emissions. These studies show that the use of biodiesel significantly reduces both tailpipe and life-cycle emissions of CO and PM
6
as well as tailpipe emissions of HC, while the effects on NOx emissions are mixed. The EPA estimates that use of a 20% biodiesel blend (B20) results in a 10.1% decrease in PM emissions, a 2.0% reduction in NOx emissions, and a 21.1% reduction in non-methane hydrocarbons (NMHC) (FTA 2006). Higher or lower blends of biodiesel would naturally have greater or smaller impacts on emissions. The FTA (2007) assumed in its analysis that use of B20 increased NOx emissions by 3.3% and decreased PM and hydrocarbon emissions by 20% and 15%, respectively. The FTA (2007) cited studies that have found B20 buses to have lower tailpipe PM and NMHC emissions than ultra-low-sulfer diesel (ULSD) fueled conventional buses, but they had slightly higher tailpipe NOx emissions. CNG buses have been promoted for their reduced emissions. Nylund et al. (2004) found that CNG buses have extremely low particulate emissions. The combustion of methane is free from soot. Their study found more favorable results for CNG than those from some previous studies, which they attribute to the previous studies unfairly comparing diesels equipped with exhaust after-treatment with CNG vehicles without catalysts. Their study, conducted in Europe, compared the best available diesel technology with the best available CNG technology. They noted that all technologies benefit from effective exhaust after-treatment. CNG and propane buses, however, could be equipped with less effective emission controls since they may be able to meet the standards without them, and there is little incentive for manufacturers to outperform the standards (FTA 2006). LNG buses have the same emissions characteristics as CNG buses (FTA 2006). Propane has the potential to have lower toxic, CO, and NMHC emissions, but it varies depending on whether the engine is calibrated to run rich or lean (Werpy et al. 2010 citing EPA 2002). It may be expected that since hybrids are more fuel efficient, they would produce fewer particulate emissions. However, Vikara and Holmen (2006) surprisingly found no statistically significant difference in PM emissions between parallel design hybrid-electric diesel and conventional diesel buses. They concluded that it would be much more cost effective to reduce PM emissions by installing diesel particulate filter (DPF) aftertreatment on a conventional diesel bus rather than investing in a substantially more expensive parallel hybrid bus. The FTA (2007), on the other hand, found that hybrid buses produced lower tailpipe PM and NMHC emissions than both diesel and CNG buses, and that hybrid buses also had lower NOx emissions at low-speed operations. CNG buses were found to have the lowest NOx emissions on other cycles. Compared with ULSD buses, the NC Transit Alternative Fuels Committee (2008) found that diesel hybrids emit 5% less NOx, 57% less PM, and 21% less CO2, and compared with B20 buses, they emitted 8% less NOx and 45% less PM. Conventional diesel engines themselves have become much cleaner over the last several years, emitting several times less PM than older engines. Schimek, in 1998, noted that because of dramatic improvements in diesel technologies, the incremental benefits of alternative fuels are declining. In a study published in 2001, Schimek wrote that the most cost-effective alternatives for reducing emissions further are retrofitting older engines with emissions controls and tighter new-vehicle standards. He also concluded that while alternative fuel options can produce lower emissions than conventional diesel buses, their cost does not justify their use. EPA emissions standards have continued to become more stringent over the past decade. Emissions standards for diesel engines increased in 2004, 2007, and again in 2010, so older engines are targets for retrofit options. Common retrofit options include the diesel particulate filter (DPF), diesel oxidation catalyst (DOC), and exhaust gas recirculation (EGR) (NC Transit Alternative Fuels Committee 2008). The FTA (2007) noted that emissions are influenced strongly by bus route and bus operation conditions, so that the performance of different types of buses will be impacted by factors such as average speed and the terrain of the route.
7
3.2 Greenhouse Gas Emissions In addition to emissions of harmful pollutants, greenhouse gas emissions are another concern. The transportation sector accounted for 28% of U.S. greenhouse gas emissions in 2009, and the share of U.S. GHG emissions attributable to transportation has been growing over the last two decades (Davis et al. 2011, EPA 2010). There are essentially three methods to reduce GHG emissions from vehicles: decreasing vehicle miles traveled (VMT), increasing efficiency of fuel consumption, and de-carbonizing fuel. Policies may be enacted at the federal, state, or local levels to achieve one of these three goals. Encouraging more people to shift from single-occupancy automobile travel to transit is one way to reduce GHG emissions, but improvements could be made to the vehicles themselves to reduce emissions. Increasing fuel efficiency through use of hybrid vehicles would reduce fuel consumption and, therefore, GHG emissions. Use of alternative fuels can also reduce these emissions. Carbon dioxide is the main GHG emission from transportation, but in addition to CO2, methane is an important GHG. Methane is a major component of natural gas vehicle exhaust, and it is several times more potent than CO2. However, GHG emissions from natural gas buses have still been found to be lower than those from diesel. Analyzing the impact of alternative fuels requires not just measuring the tailpipe emissions, but the entire life-cycle emissions. This means that the emissions resulting from feedstock production (such as soybean production in the case of soy-based biodiesel), fuel production, distribution, and then finally combustion must be considered. There are a number of models that have attempted to estimate life-cycle emissions, and one such model is the Argonne National Laboratory’s Greenhouse Gases, Regulated Emissions, and Energy Use in Transportation (GREET) Model, which is used by the EPA (2007). Table 3.1 shows the impacts of various alternative fuels on GHG emissions (including CO2, methane, and nitrous oxide) according to the GREET Model. Table 3.1 Percentage Change in Greenhouse Gas Emissions Fuel % Change Cellulosic Ethanol -90.9 Biodiesel -67.7 Sugar Ethanol -56.0 Electricity -46.8 Gaseous Hydrogen -41.4 Compressed Natural Gas -28.5 Liquefied Natural Gas -22.6 Corn Ethanol (average) -21.8 Liquefied Petroleum Gas -19.9 Methanol -8.5 Coal-to-Liquids w/ Carbon C&S +3.7 Liquid Hydrogen +6.5 Gas-to-Liquid Diesel +8.6 Coal-to-Liquid w/o Carbon C&S +118.5 Source: U.S. EPA 2007 These estimates rely on a number of assumptions. For example, for corn ethanol, assumptions are made regarding the milling process and the fuel used to power the plant. For biodiesel and cellulosic ethanol, assumptions are made regarding the feedstock. For electricity, the U.S. average mix of fuel types used to produce the electricity is assumed, and for hydrogen, it is assumed that natural gas is used to produce it. The GREET model includes more than 100 fuel production pathways and more than 70 vehicle/fuel

8
systems. Assumptions also must be made regarding the energy efficiencies and GHG emissions from fuel production activities. Large uncertainties exist in some of the key assumptions. Key issues affecting biofuel results include nitrogen fertilizer plants (energy use and use of coal or natural gas as feedstock), farming (crop yields, energy, and chemical inputs), energy use in ethanol plants (type of process), credits of co-products of ethanol, N2O conversion factors of nitrogen fertilizer, and land use changes and resulting GHG emissions (Wang 2008). The impact on land use is one issue for which there is much debate. An increase in production of crops for biofuels may cause some land that was not previously farmed to be brought into production, which results in the loss of a carbon sink and the release of carbon. Beer et al. (2002) similarly found that biodiesel and ethanol emit the fewest GHG emissions on a life-cycle basis, and that LPG and CNG also have fewer GHG emissions than diesel. LNG was found to have the higher life-cycle GHG emissions due to the energy required to liquefy and cool the fuel. The preceding analysis did not compare the effectiveness of each versus hybrid buses, but the FTA (2007) found that life-cycle GHG emissions for hybrid buses was lower than that for B20 or CNG buses. B20 buses were also found by the FTA (2007) to have lower GHG emissions than CNG buses. 3.3 Fuel Efficiency Lower fuel efficiency may be a concern with some alternative fuels. Ethanol has a BTU content less than that of gasoline, causing lower fuel efficiency. The ethanol industry has argued, however, that ethanol’s properties as an oxygenate would provide more complete burning and offset some of the BTU loss (American Coalition for Ethanol). The American Coalition for Ethanol conducted their own study and found that vehicles averaged 1.5% lower mileage with E10, 2.2% lower mileage with E20, and 5.1% lower mileage with E30, indicating that some of the BTU loss was indeed offset. They did not test E85, however. E85, though, is priced below gasoline, so comparisons of the cost per unit energy would need to be made. A few studies have found that fuel economy decreases slightly with biodiesel, while others have found no measurable change. The EPA (2002) estimated that the energy content of conventional diesel is 129,500 BTUs per gallon and that for 100% canola- or soybean-based biodiesel is about 119,200 BTUs per gallon. Plant-based pure biodiesel, therefore, has 7.9% less energy content per gallon than conventional diesel. Based on this reduced energy content, B20 would be expected to produce a 1.6% reduction in fuel economy. Some studies have shown reductions in fuel economy in this range while others have found no measurable difference. Proc et al. (2006) reported that laboratory testing revealed a 2% reduction in fuel economy for the B20 transit buses, but they found no difference in on-road miles per gallon between the B20 and regular diesel groups. The BIOBUS Project (2003) found that the energy efficiency of biodiesel is comparable to that of petroleum diesel. There was also no impact on fuel economy found for transit buses operating on B20 in St. Louis (Clean Cities 2002). The U.S. Department of Energy’s (DOE) Energy Efficiency and Renewable Energy (EERE) indicate in the Clean Cities Fact Sheet that biodiesel fuel economy is 1% to 2% lower than that for diesel (FTA 2007). Barnitt et al. (2008) found B20 buses to have 1.7% lower fuel economy than ULSD buses, while Peterson and Mattson (2008) could not attribute any changes in fuel economy to the adoption of biodiesel by Metro Area Transit in Fargo, North Dakota. Low fuel efficiency was found to be a problem for propane buses used by small urban and rural transit agencies in Texas (TTI 2007). The energy content of propane, on a gallon-to-gallon basis, is 73% that of gasoline (Werpy et al. 2010 citing EERE 2009). Therefore, like ethanol, more propane fuel is needed to travel an equivalent distance. According to Transit Cooperative Research Program (TCRP) Report 146, propane buses typically get 15% to 30% fewer miles per gallon than comparable diesel buses (Science Applications International Corporation 2011).

9
The NC Transit Alternative Fuels Committee Report (2008) found that diesel hybrid buses are 19% more fuel efficient than ULSD buses, which they noted was at the low end of other studies that showed a 20% to 40% increase in efficiency. Clark et al. (2009) found fuel economy advantages ranging from 14% to 48% for four different test sites. Fuel economy and the advantages of hybrid vehicles vary significantly by speed. Hybrids provide greater benefit with slower speed, stop-and-go driving. Use of hybrid buses for rural transit, therefore, may provide little benefit. 3.4 Performance/Reliability One concern for any agency considering alternative fuels or hybrid vehicles is the performance and reliability of those vehicles, especially for smaller agencies. The impact of breakdowns on service for transit providers with a small fleet size is significant. Barnitt et al. (2008) found reliability to be similar between B20 and ULSD buses. Cold weather performance of biodiesel can be a concern, however, as documented by Peterson and Mattson (2008). According to a survey of state DOTs by Humberg et al. (2006), the most common deterrent for biodiesel adoption among these agencies, besides cost, was a concern about cold weather performance. The cold flow properties of biodiesel, which can be measured by its cloud point, pour point, and cold filter plugging point, are a significant limiting factor for use of the fuel. It gels at much higher temperatures than petroleum diesel and can cause fuel filters to plug. Blending biodiesel with regular diesel minimizes the disadvantage. Many studies have shown that biodiesel blends can be used successfully even in colder climates, though a few problems have been reported. Cold weather behavior was not found to be a widespread problem for those state transportation agencies that had adopted the fuel (Humburg et al. 2006). TTI (2007) found that significant mechanical downtime is a problem for propane vehicles used by small urban and rural transit agencies in Texas. Another concern is access to technical and mechanical expertise for repairs of propane vehicles (TTI 2007). Performance of CNG buses has been found to be similar to that of diesel buses, though there may be slight reductions in acceleration and hill climbing ability (Science Applications International Corporation 2011). Some research has shown CNG buses to be more reliable, but those studies compared newer CNG buses with older diesel buses (Science Applications International Corporation 2011). Comparing reliability is difficult because it varies significantly between bus models and for different types of service, regardless of fuel type. 3.5 Cost Costs of adopting alternative fuels or hybrid vehicles can be a major deterrent. These costs include both capital costs, such as vehicle costs and infrastructure costs, and operating costs, including fuel costs and maintenance costs. 3.5.1 Capital Costs Transit agencies considering alternative fuel or hybrid vehicles need to consider the added capital costs. These capital costs include vehicle cost, fueling facility cost, and maintenance facility cost. Fueling facility costs are incurred when constructing new natural gas or propane fueling facilities or when modifying the existing fueling facility to account for hybrid buses, such as by adding chargers that may be needed for certain battery technologies. TTI (2007) noted that while LPG fueling stations cost more than diesel, they cost significantly less than natural gas stations. Maintenance facility costs may be incurred if

10
modifications to the transit system’s maintenance facilities are required. There are no additional infrastructure costs for biodiesel or ULSD buses because they require just the infrastructure, presumably, already in place for conventional diesel buses. Transit agencies will need to consider whether they need to build all new facilities or if they can retrofit existing facilities and absorb the costs associated with each. Infrastructure needs could also depend on climate. CNG and LNG are more popular in warmer climates where fueling is performed outdoors with minimal infrastructure required to meet fire codes. In colder climates, where all bus storage, maintenance, and fueling operations occur indoors, the cost of retrofitting an existing facility for CNG to meet fire code requirements may be prohibitive. The Alternative Fuels Group of the Cleaner Vehicles Task Force (2000) concluded that the main barriers affecting the introduction of LPG, CNG, and hybrid-electric vehicles is the high cost of these vehicles compared with conventional vehicles. Their study was published a decade ago, but capital cost still remains a significant barrier. Alternative fuel vehicles are more expensive because they are produced in small volumes and have costlier on-board fuel storage and specialized components. Data from the American Public Transportation Association’s (APTA) 2011 Public Transportation Vehicle Database were collected and analyzed to show the differences in average vehicle purchase prices by vehicle type. The CNG buses were, on average, 13%-26% more expensive than similarly-sized diesel buses, and diesel-hybrid buses were 74%-106% more expensive (Table 3.2). For smaller cutaway buses, similar price premiums of 80%-100% can be found for hybrid vehicles and up to 60% for CNG buses. The cost premiums could decline if the technologies become more widely commercialized. For propane buses, a 30-foot bus has historically cost $25,000 to $45,000 more than a comparable diesel bus, according to TCRP Report 146 (Science Applications International Corporation 2011). Table 3.2 Average Vehicle Purchase Price, by Vehicle Type Bus Type Bus Size Diesel LNG CNG
Diesel-Hybrid
30-foot $250,452 $298,427 $314,323 $517,152 35-foot $280,870 $285,707 $342,452 $549,357 40-foot $312,212 $322,424 $351,378 $544,165
Source: 2011 APTA Public Transportation Vehicle Database
3.5.2 Operating Costs Fuel costs and maintenance costs may be impacted by the decision to use alternative fuel or hybrid vehicles. Operating costs could potentially be lower, providing an incentive to purchase these vehicles. However, as Anderson and King (1999) argue, the cost difference has to be great enough to overcome the hassles of changing to a new fuel. For example, transit operators can reduce fuel cost by using CNG or hybrid vehicles, but the price difference needs to be great enough to justify the higher purchasing cost of these vehicles and the fuel infrastructure required for CNG. As diesel and gasoline prices increase, though, these alternative fuel vehicles and hybrids become more attractive. Although users of hybrid buses can benefit from lower fuel costs, these buses require new batteries at least once during their life-cycle. The FTA (2007) reported that packs of nickel-metal hydride (NiHM) batteries have a life of five to seven years with a replacement cost of $35,000 to $45,000, in 2007, while Clark et al. (2009) estimated an average cost of $27,500 for replacing a battery pack in a full-size bus.

11
Operating costs for some alternative fuels could actually be higher. TTI’s (2007) survey of small urban and rural transit systems in Texas revealed that propane vehicles are more expensive to operate than traditionally fueled vehicles. Werpy et al. (2010) cite price data from the DOE’s Clean Cities Price Report that show the average price of propane was $1.08 per gasoline gallon equivalent (GGE) higher than gasoline and $1.22 per GGE higher than diesel, and propane users are vulnerable to price spikes. The propane prices in these reports, however, might not accurately depict the prices that fleets, especially those with their own on-site storage, can negotiate, so the price difference might be smaller or nonexistent. Fuel cost could be a deterrent to adoption of propane unless the fleet can secure a long-term contract for a lower price (Werpy et al. 2010). Fuel costs for E85 and biodiesel could potentially be higher than that for conventional fuel. The American Coalition for Ethanol found, however, that even though ethanol blends have lower fuel efficiency, the fuel costs are generally lower due to the lower cost of ethanol. Maintenance costs for B20 buses were not found to be significantly different than those for ULSD buses, according to Barnitt et al. (2008), though the B20 buses had a higher incidence of fuel filter and fuel injector replacements. The FTA (2007), comparing hybrid, CNG, B20, and ULSD buses, estimated that operating costs are lowest for CNG buses, partly due to lower fuel costs (despite poorer fuel efficiency). Although hybrid buses offer the best fuel efficiency, the FTA (2007) found this was offset by the battery replacement cost. 3.5.3 Total Costs West Virginia University’s Center for Alternative Fuels, Engines, & Emissions (CAFEE) conducted a 12-year life-cycle cost (LCC) analysis for a fleet size of 100 buses, considering diesel hybrid electric buses, conventional diesel buses fueled with ultra-low sulfur diesel and B20 biodiesel, and natural gas buses, all of 40-foot length with 2007 cost data (FTA 2007). They found that diesel buses generally are the most economical, and diesel buses fueled with B20 have only slightly higher overall costs due to greater fuel expense. If only 20% of the bus procurement cost was considered, they found that the life-cycle costs for the four bus types were fairly similar, and that changes in fuel costs and battery technology would influence which are the most cost effective. TCRP Report 146 (Science Applications International Corporation 2011) compared costs for a number of alternative fuels and advanced vehicles. Some of their findings for full-size buses (i.e., 35- to 40-foot lengths) are shown in Table 3.3. Table 3.3 Capital and Operating Costs for Full-Size Transit Bus, by Vehicle Type
Diesel B100 Gasoline E100 Natural Gas Propane Hybrid
New Vehicle ($) 350,000 350,000 262,500 367,500 375,000 380,000 455,000 Facility Conversion ($/50 buses) NA 400 100,000 100,000 1,750,000 875,000 5,000 Fuel ($/diesel gallon equivalent (DGE), unless stated otherwise) 2.51 3.57 2.5 3.19 (E85) 1.91 2.62 2.51
Fuel Economy (miles/DGE) 3.2 3.3 2.4 3.2 2.7 3.4 4.01
Propulsion System Maintenance ($/mile) 0.16 0.16 0.18 0.18 0.18 0.18 0.19
Facility Maintenance and Operation ($/mile) 0.18 0.18 0.18 0.18 0.23 0.18 0.18 Source: TCRP Report 146, Science Applications International Corporation 2011

12
3.6 Availability Availability of vehicles, fueling infrastructure, or the fuel itself could limit use by small urban and rural transit agencies. Lack of availability is a major impediment to use of propane. According to Werpy et al. (2010), the potential exists for substantial propane production in the United States due to ample natural gas and petroleum processing, but transportation users have to compete with industrial and other users for the supply. Scarcity of LPG fueling infrastructure was found to be a problem in Texas, even though Texas has the most LPG fueling sites in the country (TTI 2007). For rural transit systems that travel long distances and operate in sparsely populated areas, fuel station availability and vehicle range are significant concerns. Fuel availability has also been found to be a problem for some operators of CNG buses, and those that do not have on-site fueling were much more likely to report negative experiences (Eudy 2002). One concern with propane and natural gas vehicles for small urban and rural transit agencies is vehicle range, as they may have limited access to fueling infrastructure (TTI 2007). Making long-distance trips was found to be difficult in a survey of small urban and rural providers in Texas (TTI 2007). Even though ethanol and biodiesel have become fairly common, availability of E85 stations and dependable biodiesel supply could still limit use in some areas of the country. 3.7 Characteristics of Agencies that have had Success Eudy (2002) surveyed transit operators about their experience with natural gas buses. This study examined the differences between those agencies that have had success with natural gas and those that have had challenges. Key findings indicated that training, adequate fueling infrastructure, commitment to the program, and understanding the costs and planning ahead were all critical to successful adoption. Promotion of the program can also be a benefit. Many of the transit agencies surveyed credited their success to an extensive training program that helped in understanding and maintaining natural gas buses. These findings could likely be applied to other alternative fuels. Fleet size could have some impact on success. Eudy (2002) found that agencies operating 10 or fewer natural gas buses were more likely to experience challenges. Agencies with fewer natural gas buses may have less experience operating and maintaining that type of bus. The percentage of the fleet that is converted to the alternative fuel could be important. Eudy (2002) found that some agencies converted a very small percentage of their fleet to natural gas, while others converted a majority of their fleet. Those agencies with a higher percentage of their fleet operating on natural gas were more likely to have success with the alternative fuel. The study suggests that commitment to the alternative fuel is important for success. While this study examined only natural gas, the finding may also apply to other alternative fuels and hybrids.

13
4. SURVEY DESIGN AND ADMINISTRATION Previous research has identified advantages and disadvantages or using alternative fuels and hybrid buses. However, less is known about the factors that motivate agencies to adopt these alternatives or the degree to which different deterrents are preventing adoption, especially among small urban and rural transit agencies. A survey was conducted of small urban and rural transit agencies to learn more about these motivating factors and the experiences transit providers have had with alternative fuels and hybrids. The survey focused on biodiesel, E85, propane, natural gas, and hybrid-electric vehicles. It asked users to identify their motivations for adoption, concerns before adoption, overall satisfaction, and problems experienced, among other questions. Non-users were asked to identify deterrents to adoption, potential benefits from adoption, and if they have plans to adopt within the next five years. The findings provide useful information to transit operators considering adoption and to policy makers considering policies on alternative fuels and hybrids. The survey was targeted toward transit providers in small urban or rural areas. Small urban providers were defined as those receiving section 5307 funding and operating in areas with a population below 200,000, and rural providers were defined as those receiving section 5311 funding. A list of small urban transit agencies was obtained from the 2008 National Transit Database (NTD). Using the NTD, 394 transit systems were identified. Contact information for these systems was obtained largely through the NTD website and through the APTA member profile information. Of these, contact names and email addresses were found for 305 small urban agencies (Table 4.1). Table 4.1 Number of Transit Agencies Surveyed
Targeted Surveys Sent
Surveys Successfully
Delivered
Survey Responses Submitted
-------------------------Number of transit agencies------------------------- Small Urban 394 305 NA NA Large Rural 270 245 NA NA Total 664 550 496 115 Since many rural systems are small operations that may not be considering alternative fuels and hybrids, there was a concern about getting a poor response rate from these agencies, as well as significant self-selection bias and coverage error. Therefore, the survey was limited to the largest 20% of section 5311 providers, measured in terms of vehicle miles of service as reported in the 2009 rural NTD. This resulted in 270 rural transit agencies being targeted. Contact information, which was developed previously for a survey by Ripplinger and Brandt-Sargent (2010), was available for 245 of these 270 agencies. Combined, the survey was sent to 550 transit providers. Many of the contacts were transit managers or others qualified to complete the survey, but some were officials not in the best position to answer the questions. Therefore, the survey invitation asked recipients to forward the survey to the appropriate individual if someone else was in a better position to complete it. The survey did not collect information about the individual completing the survey. The survey was administered online. Email invitations were sent to transit agencies with a link to the survey. The original email invitation was sent on March 29, 2011, and a reminder email was sent eight days later. The survey was kept open until the end of April. Of the 550 email invitations sent, 56 were returned undeliverable, possibly due to outdated contact information, which left 494 transit agencies that received the survey. A total of 115 responses were received, yielding a response rate of 23%.

14
The complete survey is shown in Appendix A. The survey was set up such that respondents who use a given alternative were given a set of questions regarding their experiences, and those not using the alternative were given different questions regarding future use and perceived benefits and deterrents.

15
5. AGENCY CHARACTERISTICS Survey results were received from transit agencies from 36 different states. Fifty-four of the responding agencies were from small urban areas, and 37 were rural transit operators (the remaining respondents did not identify their location). The locations of the responding agencies are shown in Figure 5.1. Additional data from the NTD were used to identify characteristics of responding agencies for those that provided their location or name of agency. NTD data were obtained for 90 of these agencies.
Figure 5.1 Locations of Transit Agencies Responding to Survey
The characteristics of these agencies are displayed in Table 5.1. These agencies provided an average of 1.1 million vehicle revenue miles, 64,000 vehicle revenue hours, and 913,000 trips in 2009. Median values for these agencies were 733,000 vehicle miles, 45,000 vehicle hours, and 367,000 trips. The median trips provided per vehicle mile were 0.43, while the median trips per vehicle hour and miles per hour were 8.5 and 16.1, respectively. As the table shows, there is some variation in these numbers between agencies.

16
Table 5.1 Operating Data for Agencies Responding to Survey
Vehicle Revenue
Miles
Vehicle Revenue
Hours Trips Trips
per Mile
Trips per
Hour
Miles per
Hour Average 1,109,606 63,756 913,275 0.8 19.8 29.7 Minimum 200,370 5,801 3,247 0.0 0.1 8.2 Maximum 7,432,868 355,337 10,126,515 4.8 - - Percentile
10% 434,862 14,448 32,943 0.1 1.2 10.7 25% 561,425 26,870 110,867 0.2 3.2 12.7 50% 732,980 44,979 366,935 0.4 8.5 16.1 75% 1,263,043 75,843 1,023,538 1.0 16.9 21.2 90% 2,031,247 119,168 2,440,214 2.2 30.5 50.6
Number of agencies 90 88 90 90 88 88 For the small urban systems, about two-thirds of the vehicle miles provided is for fixed-route service, while about one-third of vehicle miles for the rural systems is for fixed-route service. The small urban systems provided an average of 1.29 trips per mile while traveling 13.7 miles per hour, compared with rural systems that provided an average of 0.25 trips per mile at 28.0 miles per hours (Table 5.2). The rural agencies tend to travel at higher speeds and travel more miles per trip. These differences may influence an agency’s decision to use an alternative fuel or hybrid vehicle. The average small urban transit system in this sample serves an area with a population of just over 100,000. Similar data for rural systems were not available. Table 5.2 Operating Characteristics of Small Urban and Rural Providers
Trips per Mile Miles per hour
Small urban providers 1.29 13.7 Rural providers 0.25 28.0
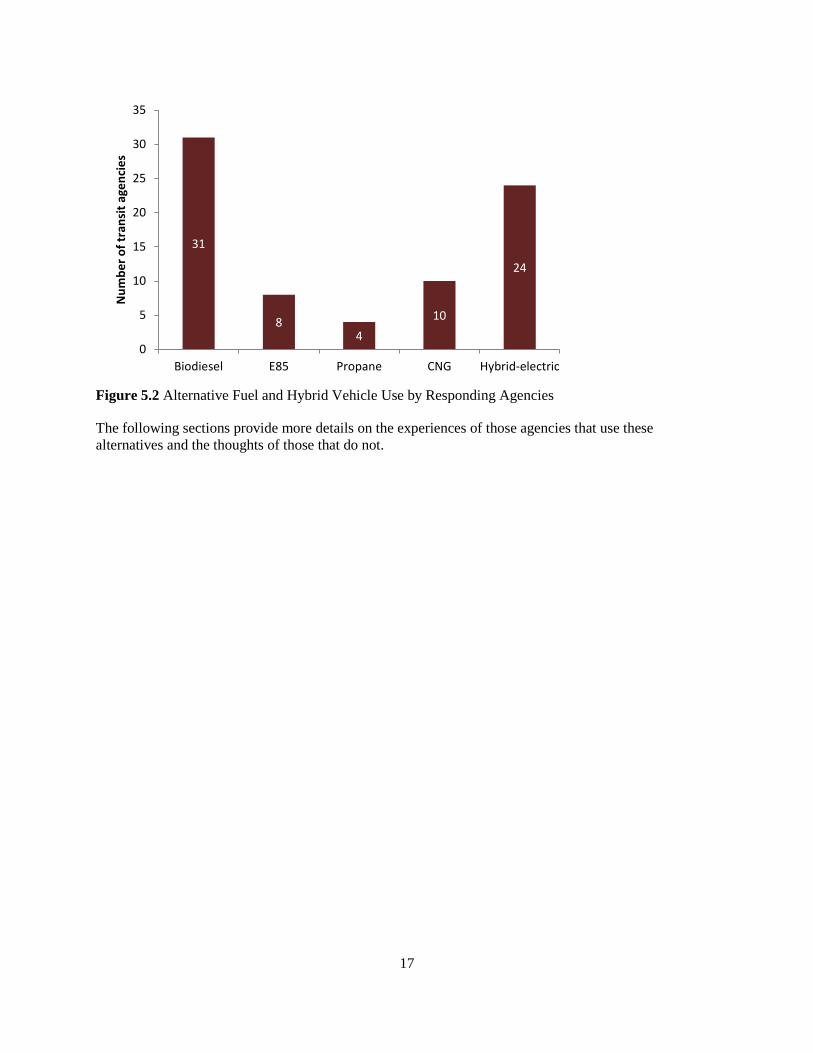
Biodiesel is the most commonly used alternative fuel among small urban and rural transit operators (Figure 5.2). Thirty-one of the responding agencies use biodiesel, while 10 use CNG, eight use E85, and four use propane. Twenty-four of the agencies own hybrid-electric vehicles. The locations of these transit agencies are shown in Figure 5.3.
17
Figure 5.2 Alternative Fuel and Hybrid Vehicle Use by Responding Agencies
The following sections provide more details on the experiences of those agencies that use these alternatives and the thoughts of those that do not.
31
8 4
10
24
0
5
10
15
20
25
30
35
Biodiesel E85 Propane CNG Hybrid-electric
Num
ber o
f tra
nsit
agen
cies

18
Figure 5.3 Locations of Responding Transit Agencies that use Alternative Fuels or Hybrids
(a) Biodiesel (b) E85
(c) Propane (d) CNG
(e) Hybrids
19
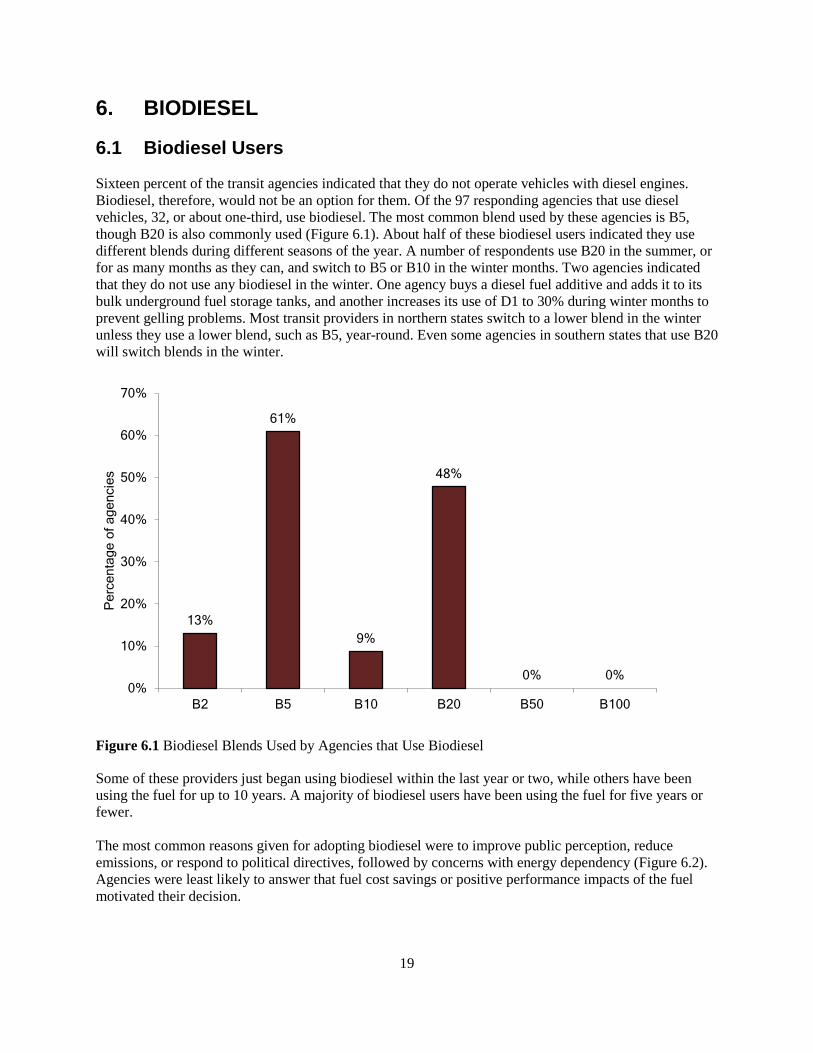
6. BIODIESEL 6.1 Biodiesel Users Sixteen percent of the transit agencies indicated that they do not operate vehicles with diesel engines. Biodiesel, therefore, would not be an option for them. Of the 97 responding agencies that use diesel vehicles, 32, or about one-third, use biodiesel. The most common blend used by these agencies is B5, though B20 is also commonly used (Figure 6.1). About half of these biodiesel users indicated they use different blends during different seasons of the year. A number of respondents use B20 in the summer, or for as many months as they can, and switch to B5 or B10 in the winter months. Two agencies indicated that they do not use any biodiesel in the winter. One agency buys a diesel fuel additive and adds it to its bulk underground fuel storage tanks, and another increases its use of D1 to 30% during winter months to prevent gelling problems. Most transit providers in northern states switch to a lower blend in the winter unless they use a lower blend, such as B5, year-round. Even some agencies in southern states that use B20 will switch blends in the winter.
Figure 6.1 Biodiesel Blends Used by Agencies that Use Biodiesel
Some of these providers just began using biodiesel within the last year or two, while others have been using the fuel for up to 10 years. A majority of biodiesel users have been using the fuel for five years or fewer. The most common reasons given for adopting biodiesel were to improve public perception, reduce emissions, or respond to political directives, followed by concerns with energy dependency (Figure 6.2). Agencies were least likely to answer that fuel cost savings or positive performance impacts of the fuel motivated their decision.
13%
61%
9%
48%
0% 0% 0%
10%
20%
30%
40%
50%
60%
70%
B2 B5 B10 B20 B50 B100
Per
cent
age
of a
genc
ies

20
Figure 6.2 Reasons for Adopting Biodiesel
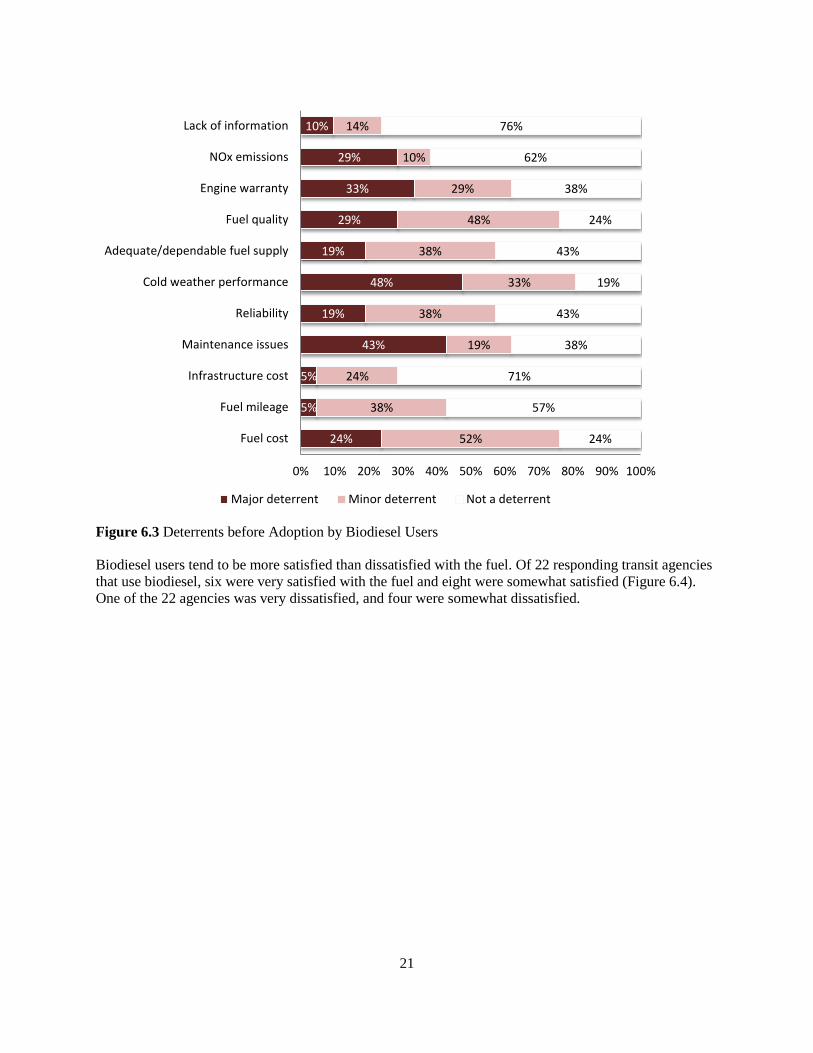
The biggest concern transit agencies had before adopting biodiesel was its cold weather performance, as nearly half of respondents mentioned this as a major deterrent (Figure 6.3). Nearly as many agencies answered that maintenance issues were a major concern. A number of respondents also indicated fuel cost, fuel quality, reliability, adequate and dependable fuel supply, and engine warranties as either major or minor deterrents. Agencies were least deterred by infrastructure costs and lack of information, as most did not consider these to be problems.
38%
29%
24%
41%
71%
14%
5%
57%
52%
52%
36%
29%
62%
38%
5%
19%
24%
23%
24%
57%
0% 20% 40% 60% 80% 100%
Reducing emissions
Energy dependency concerns
Desire to utilize local resources and products
Political directives
Improving public perception
Positive performance impacts of the fuel
Fuel cost savings
Major reason Minor reason Not a reason
21
Figure 6.3 Deterrents before Adoption by Biodiesel Users
Biodiesel users tend to be more satisfied than dissatisfied with the fuel. Of 22 responding transit agencies that use biodiesel, six were very satisfied with the fuel and eight were somewhat satisfied (Figure 6.4). One of the 22 agencies was very dissatisfied, and four were somewhat dissatisfied.
24%
5%
5%
43%
19%
48%
19%
29%
33%
29%
10%
52%
38%
24%
19%
38%
33%
38%
48%
29%
10%
14%
24%
57%
71%
38%
43%
19%
43%
24%
38%
62%
76%
0% 10% 20% 30% 40% 50% 60% 70% 80% 90% 100%
Fuel cost
Fuel mileage
Infrastructure cost
Maintenance issues
Reliability
Cold weather performance
Adequate/dependable fuel supply
Fuel quality
Engine warranty
NOx emissions
Lack of information
Major deterrent Minor deterrent Not a deterrent

22
Figure 6.4 Satisfaction with Biodiesel
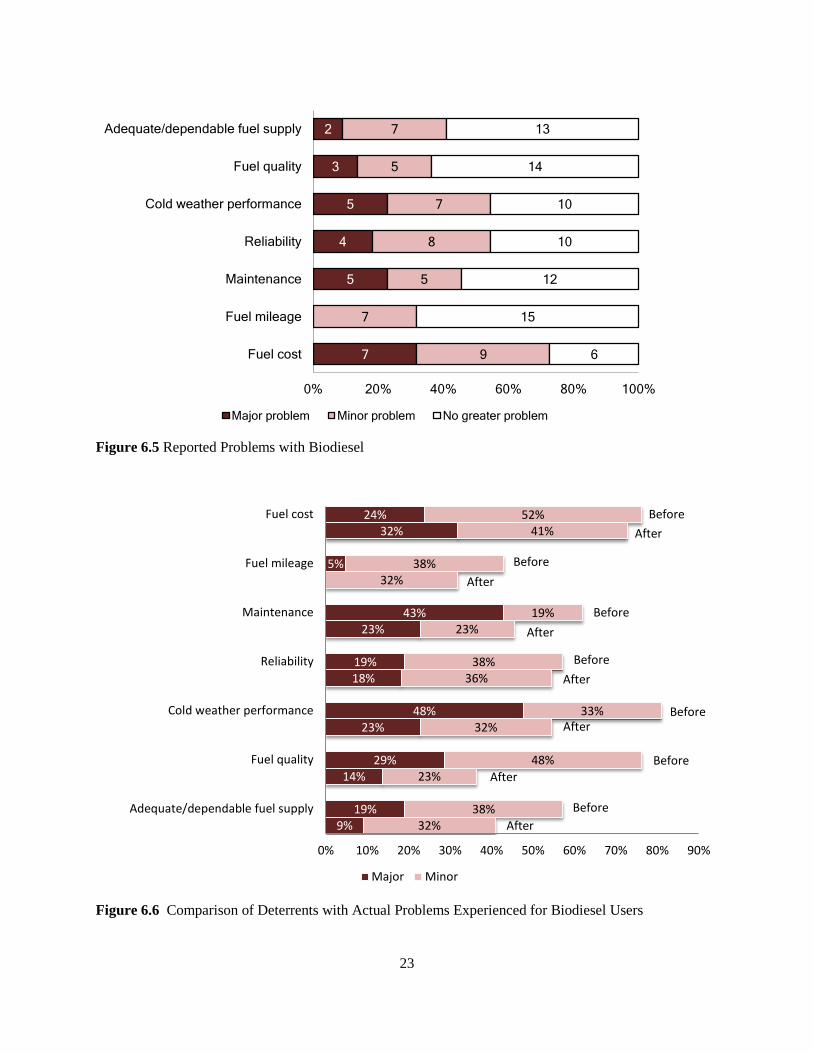
Even though fuel cost tended to be just a minor concern for agencies when deciding to adopt biodiesel, it has turned out to be the greatest problem reported. Agencies were asked to compare their experience with biodiesel to that with petroleum diesel and indicate if they have had any greater problems with biodiesel (Figure 6.5). Seven of 22 respondents indicated that the cost of biodiesel has been a major problem, and nine answered it is a minor problem. Maintenance issues and cold weather performance were both cited as major issues for five of the 22 agencies, and another seven indicated that cold weather performance is a minor problem. Reliability was considered a major problem by four of the 22 agencies, while fuel quality was cited by three respondents as being a major problem. None of the responding agencies mentioned fuel mileage as a major problem, and seven listed it as a minor problem, while the remaining 15 said it was no different than petroleum diesel.
Very dissatisfied
5%
Somewhat dissatisfied
18%
Neither satisfied nor dissatisfied
14%
Somewhat satisfied
36%
Very satisfied 27%
23
Figure 6.5 Reported Problems with Biodiesel
Figure 6.6 Comparison of Deterrents with Actual Problems Experienced for Biodiesel Users
7
5
4
5
3
2
9
7
5
8
7
5
7
6
15
12
10
10
14
13
0% 20% 40% 60% 80% 100%
Fuel cost
Fuel mileage
Maintenance
Reliability
Cold weather performance
Fuel quality
Adequate/dependable fuel supply
Major problem Minor problem No greater problem
24% 32%
5%
43% 23%
19% 18%
48% 23%
29% 14%
19% 9%
52% 41%
38% 32%
19% 23%
38% 36%
33% 32%
48% 23%
38% 32%
0% 10% 20% 30% 40% 50% 60% 70% 80% 90%
Fuel cost
Fuel mileage
Maintenance
Reliability
Cold weather performance
Fuel quality
Adequate/dependable fuel supply
Major Minor
Before After
After
After
After
After
After
After
Before
Before
Before
Before
Before
Before

24
Figure 6.6 compares responses from Figures 6.3 and 6.5, showing differences between what respondents perceived as deterrents before adoption to actual problems experienced afterwards. The figure shows that, in many cases, agencies were more likely to view an issue as being problematic before adoption than to actually experience the problem afterwards. This is especially observed regarding maintenance issues, cold weather performance, and fuel quality. For example, 48% of respondents viewed cold weather performance as a major deterrent, while 23% identified it as a major problem after adoption. As noted previously, fuel cost was the one issue agencies were more likely to find problematic than they expected. Regarding fuel economy, transit agencies were asked if they have noticed or documented any change in fuel mileage since beginning use of biodiesel. Three of 20 agencies indicated they had noticed decreased miles per gallon when using biodiesel. One of these agencies found fuel economy dropped 1.5 miles per gallon in its large buses, while another had documented a very slight decrease. Fourteen of the 20 respondents had not noted any change in fuel mileage, and another three had not measured if there was any difference. These agencies most commonly blend biodiesel at the terminal and have it “splash mixed” in a tanker delivery vehicle. Two blend biodiesel in their storage tanks, and two agencies blend at the point of fueling in the vehicle fuel tank, while one agency has it blended at the terminal and delivered by pipeline. Most of the responding agencies have not made any changes in their fuel storage system to accommodate biodiesel blends in cold weather. Three of 22 agencies indicated they have made such changes. Changes by those agencies included adding anti-gelling agents or external tank heaters on the fuel tank on the bus. One agency indicated that they purchase fuel off site during cold weather. Five of 22 transit agencies using biodiesel provided special biodiesel-related training to employees. Most of the agencies did not provide any training. As noted in TCRP Report 146, there are no unique training needs for drivers using B20, but they should be aware of possible changes in performance and fuel economy, and maintenance personnel should be knowledgeable on B20 fuel issues, including cold flow properties and associated solutions (Science Applications International Corporation 2011). Transit agencies were given the opportunity to provide any additional comments regarding their experience with biodiesel. One respondent said that their overall experience has been good, that public perception is very positive, and that fuel filter clogging has been an issue but has been addressed. Another indicated that their overall experience has been good. The respondent’s agency had experienced some minor gelling issues during very cold spells, but switching to lower blend during those periods proved beneficial. Other respondents mentioned clogged fuel filters, cold weather problems, and supply problems. One agency said that when it started using B40, it went through a lot of fuel filters because of the cleaning agents in the biodiesel, but once everything got cleaned it was no longer a problem. Another respondent, however, said they have now stopped using biodiesel because of clogged filters and what the product was doing to their engines. This respondent reported that in cold weather, buses would stop running and would have to be towed, and the filters had to be replaced frequently. One agency specifically commented on supply problems. It has not been able to get biodiesel for over one year as it does not have on-site tanks and the local fuel stations have not been able to supply biodiesel during this time. One respondent answered that they simply do not like using the fuel.

25
6.2 Biodiesel Non-Users Agencies that do not use biodiesel were asked if they currently have plans to adopt the alternative fuel within the next five years. Of 59 agencies that responded, eight (14%) indicated that they have such plans. Agencies not using biodiesel cited a number of concerns deterring them from using the fuel (Figure 6.7). The most significant deterrents included not having an adequate and dependable fuel supply, engine warranty concerns, fuel costs, infrastructure costs, and maintenance issues. Most of the issues listed in the survey were cited as being either a major or minor deterrent by a majority of respondents, and many were mentioned as being major deterrents by more than a third. In addition, some respondents also answered that they do not know if the issues cited would prevent them from using biodiesel, suggesting they have not thought about the issue or do not have access to information.
Figure 6.7 Deterrents for Agencies Not Using Biodiesel
25
10
30
28
14
14
17
38
24
9
18
11
15
6
10
18
17
16
5
12
11
13
7
16
12
10
9
9
8
7
7
11
15
13
16
9
9
14
14
14
7
13
21
11
0% 10% 20% 30% 40% 50% 60% 70% 80% 90% 100%
Fuel cost
Fuel mileage
Infrastructure cost
Maintenance issues
Reliability
Cold weather performance
Fuel quality
Adequate/dependable fuel supply
Engine warranty
NOx emissions
Lack of information
Major deterrent Minor deterrent Not a deterrent Don't know

26
These agencies were asked what they see as potential benefits from using biodiesel (Figure 6.8). Many answered that they do not know, indicating, again, that they have not thought about the issue or do not have adequate information. Agencies most commonly answered that reducing energy dependency is a benefit, as well as reducing emissions, improving public perceptions, and using local resources.
Figure 6.8 Potential Benefits of Biodiesel Identified by Agencies Not Using the Fuel
18
23
18
18
9
17
19
19
16
27
16
9
4
6
11
2
12
16
17
11
13
11
21
17
0% 10% 20% 30% 40% 50% 60% 70% 80% 90% 100%
Reducing emissions
Reducing energy dependency
Use of local resources and products
Improving public perception
Positive performance impacts of the fuel
Fuel cost savings
Major benefit Minor benefit Not a benefit Don't know

27
7. E85 7.1 E85 Users Thirty-one percent of responding agencies (31 of 101) use Flex Fuel Vehicles (FFVs). FFVs can operate on either gasoline or E85, and E85 can be used in only these types of vehicles. Eight agencies responding to the survey, or 25% of those with FFVs, use E85. Among providers that use E85, the extent to which the fuel is used varies. Two respondents use it infrequently (less than 25% of the time), another two use it about 25% to 50% of the time, while three use E85 always, or almost always. One of the E85 users has been using the fuel for 12 years, while the others all have been using it for five years or less. Three of the seven E85 users that answered the question have been using the fuel for a year or less, including one that just acquired their first two units. The major reasons given by these agencies for adopting E85 were a desire to utilize local resources and products, energy dependency concerns, and reducing emissions (most often cited as a minor reason) (Figure 7.1).
Figure 7.1 Reasons for Adopting E85
1
2
3
1
2
6
4
3
4
4
4
1
1
1
3
2
3
3
0% 10% 20% 30% 40% 50% 60% 70% 80% 90% 100%
Reducing emissions
Energy dependency concerns
Desire to utilize local resources and products
Political directives
Improving public perception
Positive performance impacts of the fuel
Fuel cost savings
Major reason Minor reason Not a reason

28
Adequate and dependable fuel supply was listed as a major concern, or deterrent, for four of the seven agencies when considering adoption of the fuel, and two other agencies considered it a minor deterrent (Figure 7.2). All seven of the agencies considered fuel quality as a major or minor deterrent, and all but one said fuel mileage was a major or minor deterrent. Agencies also had concerns with fuel costs, infrastructure costs, reliability, and maintenance. Lack of information was not a deterrent for most E85 users.
Figure 7.2 Deterrents Before Adoption by E85 Users
Only one of the seven agencies said it was dissatisfied with its use of E85, while a majority indicated ambivalence. Two of the respondents answered that they were very satisfied, four said they were neither satisfied nor dissatisfied, and one indicated that they were somewhat dissatisfied.
2
2
2
2
1
4
2
1
3
4
3
1
4
2
5
1
2
1
2
4
2
1
5
0% 10% 20% 30% 40% 50% 60% 70% 80% 90% 100%
Fuel cost
Fuel mileage
Infrastructure cost
Maintenance issues
Reliability
Adequate and dependable fuel supply
Fuel quality
Lack of information about E85
Major deterrent Minor deterrent Not a deterrent
29
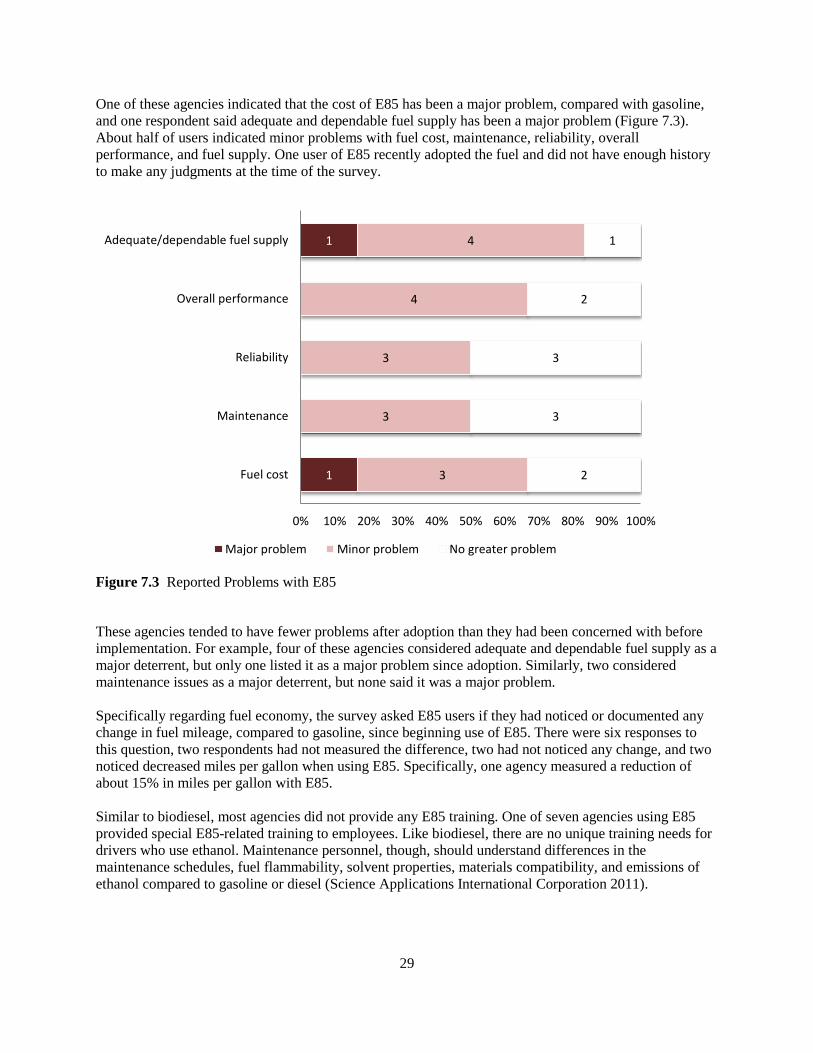
One of these agencies indicated that the cost of E85 has been a major problem, compared with gasoline, and one respondent said adequate and dependable fuel supply has been a major problem (Figure 7.3). About half of users indicated minor problems with fuel cost, maintenance, reliability, overall performance, and fuel supply. One user of E85 recently adopted the fuel and did not have enough history to make any judgments at the time of the survey.
Figure 7.3 Reported Problems with E85
These agencies tended to have fewer problems after adoption than they had been concerned with before implementation. For example, four of these agencies considered adequate and dependable fuel supply as a major deterrent, but only one listed it as a major problem since adoption. Similarly, two considered maintenance issues as a major deterrent, but none said it was a major problem. Specifically regarding fuel economy, the survey asked E85 users if they had noticed or documented any change in fuel mileage, compared to gasoline, since beginning use of E85. There were six responses to this question, two respondents had not measured the difference, two had not noticed any change, and two noticed decreased miles per gallon when using E85. Specifically, one agency measured a reduction of about 15% in miles per gallon with E85. Similar to biodiesel, most agencies did not provide any E85 training. One of seven agencies using E85 provided special E85-related training to employees. Like biodiesel, there are no unique training needs for drivers who use ethanol. Maintenance personnel, though, should understand differences in the maintenance schedules, fuel flammability, solvent properties, materials compatibility, and emissions of ethanol compared to gasoline or diesel (Science Applications International Corporation 2011).
1
1
3
3
3
4
4
2
3
3
2
1
0% 10% 20% 30% 40% 50% 60% 70% 80% 90% 100%
Fuel cost
Maintenance
Reliability
Overall performance
Adequate/dependable fuel supply
Major problem Minor problem No greater problem

30
Two of the respondents provided specific comments regarding their experience with E85. One said that they have had to blend down to E75 and lower in the winter and that availability and price have made using E85 disadvantageous at times. Another respondent expressed environmental concerns regarding the use of E85, alluding to studies suggesting the net energy balance of the fuel could be negative. This respondent is going to continue utilizing the fuel but may consider changes after more environmental studies are completed. As previously shown in Table 3.1, corn ethanol can reduce life-cycle emissions of greenhouse gas emissions, but the results are not as significant as those for other alternative fuels. Further, the estimated net energy balance and impact on emissions varies among studies based on modeling procedures and assumptions made. 7.2 E85 Non-Users Among those agencies that have FFVs but do not currently use E85, 25% (5 of 20) have plans to use E85 within the next five years. Non-users cited a number of deterrents that would prevent them from using E85 (Figure 7.4). Adequate and dependable fuel supply was listed as a major deterrent by half of the agencies responding. Infrastructure costs, fuel mileage, and a number of other concerns were commonly cited as deterrents. Although not listed as an option in the survey, two agencies mentioned environmental concerns with E85, including emissions of greenhouse gases and other pollutants and the amount of petroleum required to produce the fuel.
Figure 7.4 Deterrents for Agencies with Flex Fuel Vehicles that do not use E85
6
7
8
5
6
6
11
6
6
5
3
3
5
5
5
5
6
3
6
7
7
5
3
5
5
5
1
5
6
5
5
6
5
6
5
5
3
6
3
3
0% 10% 20% 30% 40% 50% 60% 70% 80% 90% 100%
Fuel cost
Fuel mileage
Infrastructure cost
Maintenance
Reliability
Overall performance
Adequate/dependable fuel supply
Fuel quality
Vehicle availability
Lack of information about E85
Major deterrent Minor deterrent Not a deterrent Don't know

31
Non-users most commonly cited reducing emissions and reducing energy dependency as benefits from using E85, and a number of respondents answered that improving public perception, using local resources and products, and fuel cost savings were minor benefits (Figure 7.5).
Figure 7.5 Benefits of E85 Identified by Non Users
6
6
3
3
3
4
7
7
8
11
4
7
3
4
6
3
7
4
6
5
5
5
8
7
0% 10% 20% 30% 40% 50% 60% 70% 80% 90% 100%
Reducing emissions
Reducing energy dependency
Use of local resources and products
Improving public perception
Positive performance impacts
Fuel cost savings
Major benefit Minor benefit Not a benefit Don't know

32

33
8. PROPANE 8.1 Propane Users Four transit agencies, out of 100 responding, operate vehicles with Liquified Petroleum Gas (LPG), commonly referred to as propane. Propane has been in use longer than other alternative fuels. One of these agencies has been using propane for 30 years, and another agency for 15 years. These transit providers were more likely to say that reducing emissions and the positive performance impacts of using propane were reasons for using propane (Figure 8.1).
Figure 8.1 Reasons for Adopting Propane Given by Agencies that Use the Fuel
2
1
1
1
2
1
1
1
2
1
2
3
1
2
2
3
3
1
1
1
0% 10% 20% 30% 40% 50% 60% 70% 80% 90% 100%
Reducing emissions
Energy dependency concerns
Desire to utilize local resources and products
Political directives
Improving public perception
Positive performance impacts of the fuel
Fuel cost savings
Maintenance cost savings
Major reason Minor reason Not a reason

34
Limited vehicle range and vehicle performance were both considered major deterrents by two of the four agencies that adopted the fuel (Figure 8.2). Adequate and dependable fuel supply, safety hazards, maintenance issues, and reliability were listed as major deterrents by one of the four agencies, and a number of other issues were considered as minor deterrents. One agency noted concerns with whether the buses would be too tall to fit in its existing maintenance facility.
Figure 8.2 Deterrents for Using Propane Considered by Agencies that Adopted the Fuel
1
1
2
1
1
2
2
1
2
2
1
1
1
1
2
1
2
3
2
2
4
2
2
2
2
2
2
2
3
0% 10% 20% 30% 40% 50% 60% 70% 80% 90%100%
High capital cost of the vehicles
Vehicle availability
Fuel cost
Development and implementation of new fuel…
Modifications to maintenance facility
Adequate and dependable fuel supply
Safety hazards
Limited vehicle range
Maintenance issues
Reliability
Lack of technical/mechanical expertise for…
Vehicle performance
Lack of information about propane vehicles
Major deterrent Minor deterrent Not a deterrent

35
Compared with using gasoline or diesel, two of the four agencies reported major problems with vehicle performance (Figure 8.3). Limited vehicle range, maintenance issues, and reliability were each listed as a major problem by one of the four agencies. Some minor problems were also reported with fuel cost, dependable and secure fuel supply, and lack of technical or mechanical expertise for repairs. None of the agencies reported any problem with safety hazards.
Figure 8.3 Problems Reported with Using Propane
Three of the four agencies fuel their propane vehicles on site. Likewise, three of the four provided special propane-related training to employees. One of these agencies specifically noted that they provides refueling training. TCRP Report 146 noted that since propane is stored under pressure, special training is required to avoid the safety hazards of the fuel (Science Applications International Corporation 2011). None of the four agencies expressed dissatisfaction, overall, with their use of propane vehicles. Three of the respondents were somewhat satisfied, and the other was neither satisfied nor dissatisfied.
1
1
1
2
2
1
1
1
1
2
3
4
2
3
2
3
2
0% 10% 20% 30% 40% 50% 60% 70% 80% 90% 100%
Fuel cost
Dependable and secure fuel supply
Safety hazards
Limited vehicle range
Maintenance issues
Reliability
Lack of technical/mechanical expertise for…
Vehicle performance
Major problem Minor problem No greater problem

36
8.2 Propane Non-Users Of the 86 responding agencies not using propane, three have plans to use propane vehicles within the next five years. Most agencies have no plans to use the fuel, and they cited a number of deterrents that would prevent them from doing so (Figure 8.4). Development and implementation of new fuel infrastructure and modifications to maintenance facilities were both listed as major deterrents by 72%-73% of respondents. Nearly two-thirds indicated that the high capital cost of the vehicles was a major deterrent, and 61% listed the lack of technical or mechanical expertise for repairs (or scarcity of repair locations) as a major deterrent. These transit agencies have a number of concerns regarding the use of propane vehicles. Two agencies that previously used propane commented on why they no longer use the fuel. One said it was not economical, and the other expressed dissatisfaction with propane vans it had operated for six years.
Figure 8.4 Deterrents from Adopting Propane by Agencies that do not use Propane
64%
42%
30%
73%
72%
49%
38%
43%
45%
33%
61%
23%
31%
15%
24%
14%
9%
10%
14%
25%
24%
19%
23%
14%
21%
19%
3%
15%
23%
5%
8%
18%
15%
9%
13%
16%
10%
20%
31%
18%
19%
33%
14%
10%
19%
23%
25%
24%
29%
15%
36%
19%
0% 10% 20% 30% 40% 50% 60% 70% 80% 90% 100%
High capital cost of the vehicles
Vehicle availability
Fuel cost
Development and implementation of new fuel…
Modifications to maintenance facility
Adequate and dependable fuel supply
Safety hazards
Limited vehicle range
Maintenance issues
Reliability
Lack of technical/mechanical expertise for…
Vehicle performance
Lack of information about propane vehicles
Major deterrent Minor deterrent Not a deterrent Don't know

37
The most commonly perceived benefits from propane vehicles were reducing emissions and energy dependency, as well as improving public perception and using local resources and products (Figure 8.5).
Figure 8.5 Perceived Benefits of Propane by Agencies that do not use Propane
38
35
22
23
19
20
7
12
16
19
24
11
12
13
5
8
16
7
14
14
19
25
21
23
25
35
33
39
0% 10% 20% 30% 40% 50% 60% 70% 80% 90% 100%
Reducing emissions
Reducing energy dependency
Use of local resources and products
Improving public perception
Positive performance impacts of the fuel
Fuel cost savings
Maintenance cost savings
Major benefit Minor benefit Not a benefit Don't know

38

39
9. NATURAL GAS 9.1 Natural Gas Users Ten of the agencies responding to the survey (out of 96) use compressed natural gas (CNG) while none use liquefied natural gas (LNG). All of these 10 agencies listed fuel cost savings and energy dependency concerns as reasons for adopting CNG, and all but one cited improving public perception, a desire to utilize local resources and products, and reducing emissions as reasons (Figure 9.1). Eight of the 10 said reducing emissions was a major reason for adoption. Agencies were least likely to cite positive performance impacts of the fuel as a reason.
Figure 9.1 Reasons Given for
8
4
3
3
6
5
1
6
5
2
3
4
5
1
1
4
1
5
0% 10% 20% 30% 40% 50% 60% 70% 80% 90% 100%
Reducing emissions
Energy dependency concerns
Desire to utilize local resources and products
Political directives
Improving public perception
Positive performance impacts of the fuel
Fuel cost savings
Major reason Minor reason Not a reason
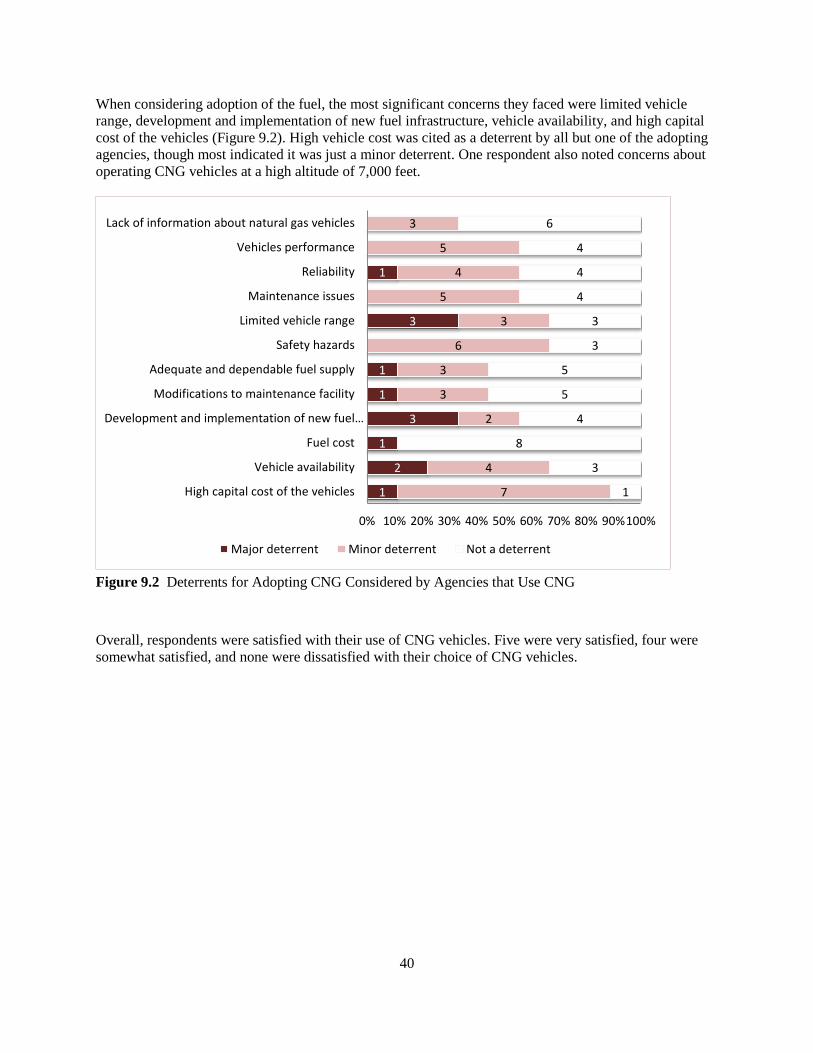
40
When considering adoption of the fuel, the most significant concerns they faced were limited vehicle range, development and implementation of new fuel infrastructure, vehicle availability, and high capital cost of the vehicles (Figure 9.2). High vehicle cost was cited as a deterrent by all but one of the adopting agencies, though most indicated it was just a minor deterrent. One respondent also noted concerns about operating CNG vehicles at a high altitude of 7,000 feet.
Figure 9.2 Deterrents for Adopting CNG Considered by Agencies that Use CNG
Overall, respondents were satisfied with their use of CNG vehicles. Five were very satisfied, four were somewhat satisfied, and none were dissatisfied with their choice of CNG vehicles.
1
2
1
3
1
1
3
1
7
4
2
3
3
6
3
5
4
5
3
1
3
8
4
5
5
3
3
4
4
4
6
0% 10% 20% 30% 40% 50% 60% 70% 80% 90%100%
High capital cost of the vehicles
Vehicle availability
Fuel cost
Development and implementation of new fuel…
Modifications to maintenance facility
Adequate and dependable fuel supply
Safety hazards
Limited vehicle range
Maintenance issues
Reliability
Vehicles performance
Lack of information about natural gas vehicles
Major deterrent Minor deterrent Not a deterrent
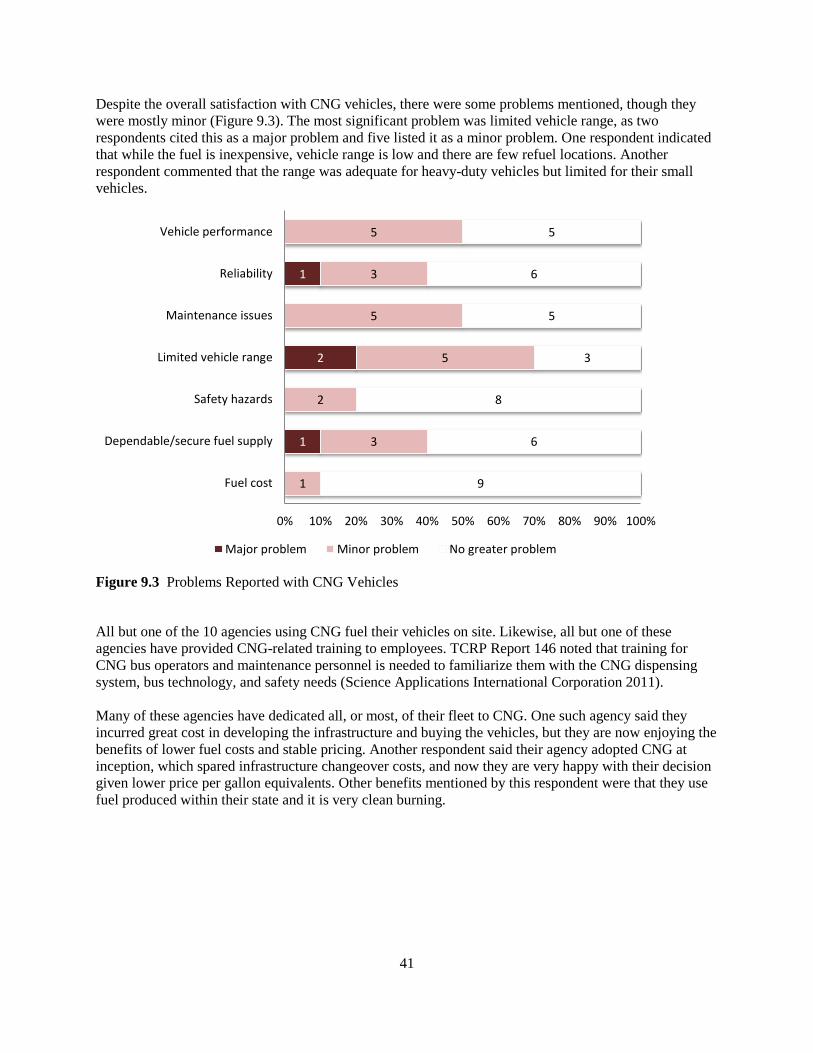
41
Despite the overall satisfaction with CNG vehicles, there were some problems mentioned, though they were mostly minor (Figure 9.3). The most significant problem was limited vehicle range, as two respondents cited this as a major problem and five listed it as a minor problem. One respondent indicated that while the fuel is inexpensive, vehicle range is low and there are few refuel locations. Another respondent commented that the range was adequate for heavy-duty vehicles but limited for their small vehicles.
Figure 9.3 Problems Reported with CNG Vehicles
All but one of the 10 agencies using CNG fuel their vehicles on site. Likewise, all but one of these agencies have provided CNG-related training to employees. TCRP Report 146 noted that training for CNG bus operators and maintenance personnel is needed to familiarize them with the CNG dispensing system, bus technology, and safety needs (Science Applications International Corporation 2011). Many of these agencies have dedicated all, or most, of their fleet to CNG. One such agency said they incurred great cost in developing the infrastructure and buying the vehicles, but they are now enjoying the benefits of lower fuel costs and stable pricing. Another respondent said their agency adopted CNG at inception, which spared infrastructure changeover costs, and now they are very happy with their decision given lower price per gallon equivalents. Other benefits mentioned by this respondent were that they use fuel produced within their state and it is very clean burning.
1
2
1
1
3
2
5
5
3
5
9
6
8
3
5
6
5
0% 10% 20% 30% 40% 50% 60% 70% 80% 90% 100%
Fuel cost
Dependable/secure fuel supply
Safety hazards
Limited vehicle range
Maintenance issues
Reliability
Vehicle performance
Major problem Minor problem No greater problem

42
9.2 Natural Gas Non-Users Six of 80 (7.5%) agencies that do not currently use CNG have plans to adopt CNG vehicles within the next five years. The major deterrents for those agencies not using natural gas included development and implementation of new fuel infrastructure, modifications to maintenance facilities, and high capital cost of the vehicles (Figure 9.4). These respondents also expressed concerns with a number of other issues, including maintenance, adequate and dependable fuel supply, limited vehicle range, safety hazards, and vehicle availability. Many respondents also indicated they do not know if these issues would be problems.
Figure 9.4 Deterrents for Adopting CNG by Agencies not Using CNG
47
28
21
60
58
37
29
28
37
20
20
19
12
16
10
2
5
9
14
23
12
19
19
17
3
15
21
2
4
13
14
8
8
12
14
23
16
19
26
12
12
18
20
19
21
27
25
17
0% 10% 20% 30% 40% 50% 60% 70% 80% 90% 100%
High capital cost of the vehicles
Vehicle availability
Fuel cost
Development and implementation of new fuel…
Modifications to maintenance facility
Adequate and dependable fuel supply
Safety hazards
Limited vehicle range
Maintenance issues
Reliability
Vehicle performance
Lack of information about natural gas vehicles
Major deterrent Minor deterrent Not a deterrent Don't know
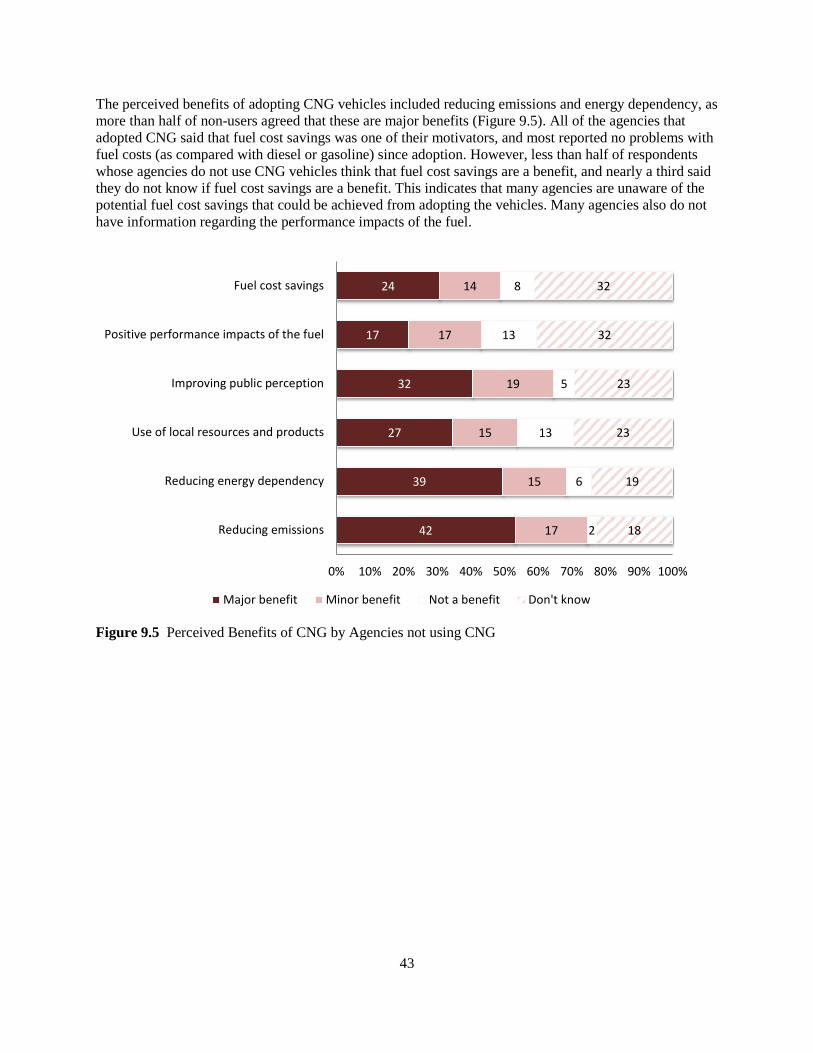
43
The perceived benefits of adopting CNG vehicles included reducing emissions and energy dependency, as more than half of non-users agreed that these are major benefits (Figure 9.5). All of the agencies that adopted CNG said that fuel cost savings was one of their motivators, and most reported no problems with fuel costs (as compared with diesel or gasoline) since adoption. However, less than half of respondents whose agencies do not use CNG vehicles think that fuel cost savings are a benefit, and nearly a third said they do not know if fuel cost savings are a benefit. This indicates that many agencies are unaware of the potential fuel cost savings that could be achieved from adopting the vehicles. Many agencies also do not have information regarding the performance impacts of the fuel.
Figure 9.5 Perceived Benefits of CNG by Agencies not using CNG
42
39
27
32
17
24
17
15
15
19
17
14
2
6
13
5
13
8
18
19
23
23
32
32
0% 10% 20% 30% 40% 50% 60% 70% 80% 90% 100%
Reducing emissions
Reducing energy dependency
Use of local resources and products
Improving public perception
Positive performance impacts of the fuel
Fuel cost savings
Major benefit Minor benefit Not a benefit Don't know

44

45
10. HYBRID-ELECTRIC VEHICLES 10.1 Hybrid Users Twenty-four of 96 respondents (25%) said their agencies operate hybrid-electric vehicles. Many of these agencies have just begun using hybrid buses within the last year or two. Fuel cost savings and emissions reductions were listed as reasons for adoption by all of these agencies, and almost all agencies also cited improving public perception and energy dependency concerns (Figure 10.1). Many also said that political directives were a reason for adoption.
Figure 10.1 Reasons Given for Adopting Hybrid-Electric Vehicles
16
11
10
16
19
8
10
9
6
5
1
4
1
0% 10% 20% 30% 40% 50% 60% 70% 80% 90% 100%
Reducing emissions
Energy dependency concerns
Political directives
Improving public perception
Fuel cost savings
Major reason Minor reason Not a reason

46
The main deterrent that these agencies faced before purchasing hybrid vehicles was the high capital cost of the vehicles (Figure 10.2). One respondent remarked that the availability of ARRA funds to offset the higher purchase price motivated their decision to adopt. Maintenance issues and the cost to replace the battery were also frequently mentioned as deterrents. Lack of information and vehicle availability were not commonly listed as problems.
Figure 10.2 Deterrents for Hybrid Vehicles Considered by Agencies that Use Hybrids
13
1
6
7
5
4
2
10
7
7
8
9
4
7
4
1
16
15
9
8
14
12
18
0% 10% 20% 30% 40% 50% 60% 70% 80% 90% 100%
High capital cost of the vehicle
Vehicle availability
Depot modification costs
Cost to replace battery
Maintenance issues
Reliability
Vehicle performance
Lack of information about hybrids
Major deterrent Minor deterrent Not a deterrent

47
Since adopting hybrid vehicles, most of these agencies have not experienced problems greater than what they have experienced with conventional vehicles, with some exceptions (Figure 10.3). Vehicle performance, reliability, and maintenance were each listed as major problems by three of the 24 respondents, and a few also mentioned these as minor problems, but a majority indicated no greater problems. One agency with two hybrid buses has had significant maintenance problems and difficulties with keeping both buses running at the same time, while another commented that the hybrids have actually been more dependable than its other vehicles. The high cost of battery replacement was mentioned as a problem by one respondent; and another agency said it has not been getting much cost savings with its hybrid vehicle.
Figure 10.3 Problems Reported with Hybrid-Electric Vehicles
3
3
3
4
2
6
17
19
15
0% 20% 40% 60% 80% 100%
Maintenance
Reliability
Vehicle performance
Major problem Minor problem No greater problem

48
Reported problems were not as great as the concerns reported before adoption (Figure 10.4).
Figure 10.4 Comparison of Concerns before Adopting and Reported Problems with
Hybrid-Electric Vehicles Twenty-one of the 24 agencies operating hybrids provided special hybrid-vehicle-related training to employees. One respondent commented that driver training and learning the vehicle parameters is a must to get the proper vehicle usage and increased mileage. TCRP Report 146 noted that maintenance workers must receive training on the technically complex equipment necessary for maintaining battery systems, and they must be properly trained to work with high-voltage electric drive systems to avoid potentially dangerous electric shocks (Science Applications International Corporation 2011). Specifically regarding fuel economy, 18 of 24 respondents have noticed an increase in miles per gallon, while five have not noted a change, and one agency just began using a hybrid vehicle and had not yet been able to measure the change. Those agencies with increased fuel mileage commonly reported a 10%-40% increase in miles per gallon, which is similar to that reported in previous studies. Cities Area Transit in Grand Forks, ND, provided some specific fuel economy numbers. Its two hybrid diesel buses averaged 5.7 and 5.9 miles per gallon in 2011, compared with 4.9 miles per gallon for their standard diesel buses. At a cost of $3.46 per gallon of diesel, these improvements yield an annual fuel cost savings of $5,428 per bus. Its hybrid diesel buses cost $553,000 each, compared with $389,000 for a similar standard diesel bus. Despite the annual cost savings, the vehicle cost difference of $136,120 will likely make the life-cycle costs more expensive for the hybrids. However, hybrids could still have an economic advantage to local agencies given that the federal government pays about 80% of the vehicle cost. For Cities Area Transit, the local cost share was 17%. Local capital costs were $27,880 per vehicle higher for hybrid buses. That cost difference could be paid for over the life span of the hybrid bus. Half of the 24 agencies were very satisfied with their use of hybrid vehicles, while four were very dissatisfied. Eighteen of these agencies plan to purchase additional hybrid vehicles within the next five years. One respondent specifically mentioned that they were converting their entire fleet. Overall, agencies with hybrids tended to be satisfied with their vehicles, but a few have experienced significant
29%
13%
22%
13%
17%
13%
38%
17%
17%
8%
30%
25%
0% 10% 20% 30% 40% 50% 60% 70%
Maintenance
Reliability
Vehicle performance
Major Minor
After
After
After
Before
Before
Before

49
problems with maintenance issues or have not realized enough fuel savings to justify the purchase. Two of the respondents who have experienced problems specifically said their dissatisfaction is with the manufacturer or the vendor and not the technology or the hybrid concept. One said they are likely to purchase hybrid vehicles again, but just not the make and model they currently have. The most significant concerns, therefore, seem to be the additional capital costs and whether they would ever achieve any savings. A number of respondents commented on the high vehicle costs and said the purchase of additional vehicles depends on the availability of additional funding. One respondent specifically reported that that the hybrid was a $47,000 option added to a $55,000 bus and that it will never pay for itself in added fuel mileage. One respondent also expressed concern with the safe maintenance and disposal of the batteries. 10.2 Hybrid Non-Users Of 62 responding agencies that do not operate a hybrid-electric vehicle, nine (15%) plan to purchase one within the next five years. The high capital cost of the vehicle and battery replacement costs were the most significant deterrents preventing these agencies from purchasing a hybrid (Figure 10.5). Some respondents in rural areas indicated that there would be no benefit in using a hybrid vehicle. One respondent noted that they provide longer trips, which would not take advantage of the hybrid’s strengths.
Figure 10.5 Deterrents for Adopting Hybrid Vehicles by Agencies that do not use Hybrids
53
30
32
45
30
27
28
22
8
17
12
8
14
15
13
13
2
11
13
1
6
7
11
20
5
8
9
14
16
16
14
11
0% 10% 20% 30% 40% 50% 60% 70% 80% 90% 100%
High capital cost of the vehicle
Vehicle availability
Depot modification costs
Costs to replace battery
Maintenance issues
Reliability concerns
Vehicle performance
Lack of information
Major deterrent Minor deterrent Not a deterrent Don't know
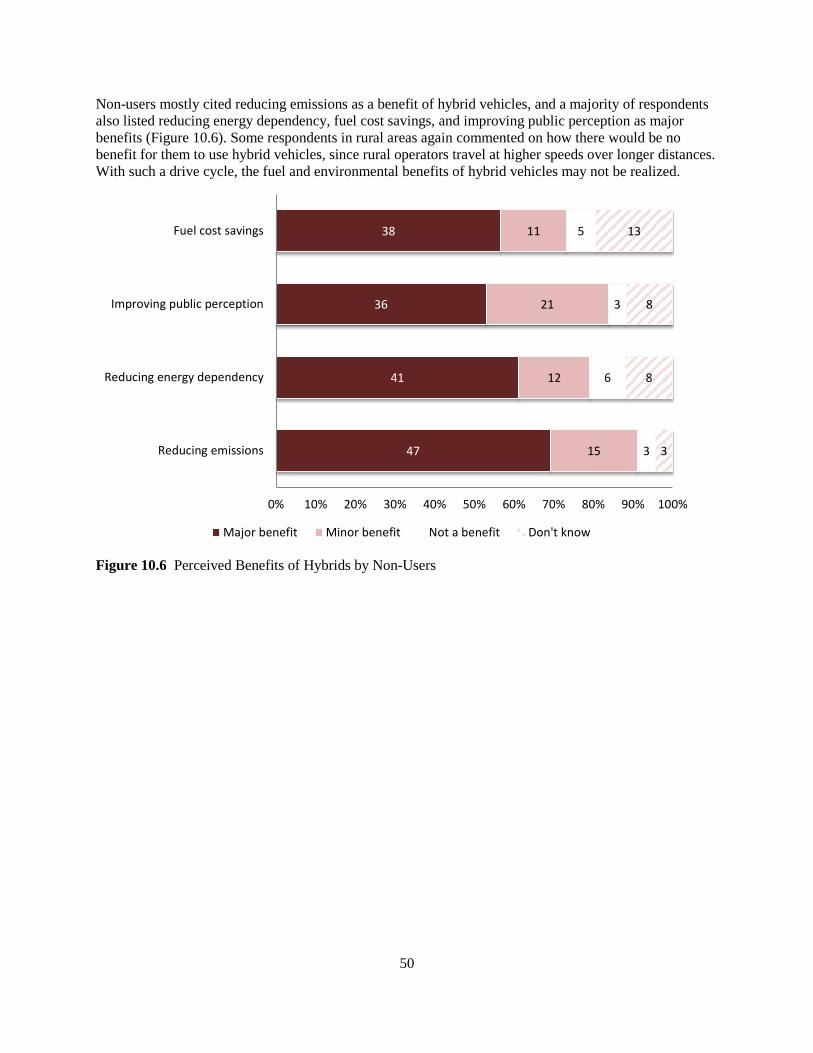
50
Non-users mostly cited reducing emissions as a benefit of hybrid vehicles, and a majority of respondents also listed reducing energy dependency, fuel cost savings, and improving public perception as major benefits (Figure 10.6). Some respondents in rural areas again commented on how there would be no benefit for them to use hybrid vehicles, since rural operators travel at higher speeds over longer distances. With such a drive cycle, the fuel and environmental benefits of hybrid vehicles may not be realized.
Figure 10.6 Perceived Benefits of Hybrids by Non-Users
47
41
36
38
15
12
21
11
3
6
3
5
3
8
8
13
0% 10% 20% 30% 40% 50% 60% 70% 80% 90% 100%
Reducing emissions
Reducing energy dependency
Improving public perception
Fuel cost savings
Major benefit Minor benefit Not a benefit Don't know

51
11. DIFFERENCES BETWEEN USERS AND NON-USERS 11.1 Agency Characteristics Table 11.1 compares the characteristics of agencies that use alternative fuels and hybrids and those that do not. Larger agencies and those operating in urban areas tend to be more likely to adopt alternatives than smaller, rural providers. Eighty-six percent of biodiesel and hybrid users from this sample are located in urban areas, and 78% of CNG users are urban. The table also shows that agencies using biodiesel or hybrid vehicles tend to be larger. For example, agencies using biodiesel provide 50% more vehicle miles of service and nearly four times as many trips as those that do not use biodiesel. Similar comparisons can be made between hybrid users and non-users. On the other hand, E85 and propane users are more likely to operate in rural areas, though the total number of agencies that use these fuels is small. Table 11.1 Agency Characteristics, Comparison between Alternative Fuel and Hybrid Users
and Non-users
Number of
Agencies %
Urban
% Miles Fixed Route
Vehicle Miles
Vehicle Hours Trips
Trips per
Mile
Trips per
Hour
Miles per
Hour
Number of
Vehicles -------thousands------- Biodiesel
Users 31 86% 75% 1,375 89 2,030 1.48 22.9 15.5 59
Non-users 66 57% 51% 911 52 570 0.63 11.1 17.7 42
E85
Users 8 50% 40% 889 62 1,370 1.54 22.0 14.2 50
Non-users* 24 62% 66% 1,113 60 1,159 1.04 19.5 18.7 42
Propane
Users 4 50% 84% 1,291 42 508 0.39 12.0 30.6 48
Non-users 96 60% 44% 1,101 65 932 0.85 14.4 17.0 45
CNG
Users 10 78% 83% 952 59 1,811 1.90 30.8 16.2 41
Non-users 86 57% 44% 1,127 64 814 0.72 12.6 17.5 46
Hybrid-electric
Users 24 86% 81% 1,423 97 1,957 1.37 20.2 14.7 56
Non-users 72 51% 40% 1,008 53 576 0.57 10.8 18.9 42 *Specifically referring to agencies with Flex Fuel Vehicles that do not use E85.
Another observation is that biodiesel, propane, CNG, and hybrid users tend to run mostly fixed-route systems with a smaller percentage of demand response. Agencies that primarily run demand response systems are less likely to use these alternatives. As some of the respondents noted, rural agencies are less likely to benefit from hybrid technologies since they provide longer trips at higher speeds with less stop-and-go travel. The characteristics of adopters reflect this argument. In addition to being mostly urban, fixed-route service, agencies with hybrid vehicles provide more trips per mile and per hour and travel fewer miles per hour than those transit providers without hybrid vehicles. Not all of the differences between users and non-users can be explained by agency characteristics, however. Differences in individual attitudes and beliefs regarding perceived benefits and deterrents could also explain some differences.

52
11.2 Perceived Benefits One possible explanation for why some agencies adopt alternative fuels or hybrid buses and others do not could be differences in perceived benefits. Some agencies, for example, may be more likely to view emission reductions or improved public perception as benefits and, therefore, could be more likely make a conversion. Figures B.1, B.2, B.3, and B.4 in Appendix B provide a graphical representation of these differences. In general, users tended to be more likely to identify benefits of using biodiesel, though non-users were just as likely to identify major benefits. One notable difference between biodiesel users and non-users was that 71% of users thought that improving public perception was a major benefit, compared with just 31% of non-users. This difference could help explain why some agencies were more likely to use biodiesel than others. Another notable difference was that non-users were much more likely to think that fuel cost savings was a major benefit. This finding coincides with previous results showing that biodiesel users were more likely after adoption to identify fuel costs as being a major problem than they were before adoption, and it suggests agencies considering biodiesel need to become more aware of its costs. E85 users also tended to be more likely to identify benefits, but they were often seen as minor benefits. One notable difference was that ethanol users were much more likely to view use of local resources and products as a benefit from using the fuel. Therefore, transit agencies located in areas where ethanol is produced could be more likely to use the fuel. This is supported by the fact that four of the eight transit agencies responding to the survey that use E85 are located in Iowa. For propane, there tended not to be many significant differences between users and non-users regarding perceived benefits. One exception was that propane users are more likely to view positive impacts of the fuel as a benefit. They were also more likely to identify fuel cost savings and maintenance cost savings as benefits, but many of respondents viewed these as minor benefits. Since there were just four agencies using propane that responded to the survey, it is difficult to draw too many conclusions. CNG users were more likely than non-users to view reducing emissions, improving public perception, and fuel cost savings as major benefits. Non-users were actually more likely to view positive performance impacts of the fuel as a major benefit. For hybrids, the most significant difference was that users were more likely to view improved public perception and fuel cost savings as benefits, suggesting that these were motivating factors for the purchase of hybrid-electric vehicles. 11.3 Deterrents In addition to differences in perceived benefits, differences in deterrents could explain why some agencies are more likely than others to use alternative fuels or hybrids. Figure B.5, B.6, and B.7 in Appendix B illustrate these differences. For biodiesel, the most significant differences regarded infrastructure costs and fuel supply. Fifty-three percent of non-users viewed infrastructure costs as a major deterrent to using biodiesel, compared with just 5% of users. This result suggests that either non-users believe infrastructure costs to be greater than they actually are or that those agencies that adopt biodiesel are less likely to require new investments in infrastructure to support the fuel. Two-thirds of non-users viewed the lack of an adequate and dependable fuel supply as a major deterrent, compared with 19% of biodiesel users. Fuel supply is a legitimate

53
deterrent for wide-scale adoption, and these findings suggest that those transit providers in areas where biodiesel is more readily available will be more likely to use the fuel. For E85, not many notable differences were found between users and non-users regarding the deterrents. One difference was that non-users were about twice as likely as users to view reliability as a deterrent. There were not enough users surveyed to make any conclusions regarding propane. However, it can be noted that while development and implementation of new fuel infrastructure, modifications to maintenance facilities, high capital cost of vehicles, and lack of technical or mechanical expertise for repairs were all identified as major deterrents for at least half of the non-users, none of the propane users viewed any of these issues as a major deterrent. For CNG, there were a number of differences between users and non-users. The most interesting findings were that non-users were significantly more likely than users to view high vehicle cost (60% vs. 11%), development and implementation of new fuel infrastructure (79% vs. 33%), modifications to maintenance facilities (73% vs. 11%), adequate and dependable fuel supply (48% vs. 11%), and maintenance issues (47% vs. 0%) to be major deterrents. Regarding hybrid vehicles, non-users were found to be consistently more likely to view an issue as a deterrent than were those agencies that have purchased hybrids. Results suggest that some issues such as vehicle availability, depot modification costs, concerns about reliability and vehicle performance, and battery replacement costs could explain some of the differences between those agencies that have purchased hybrids and those that have not.

54

55
12. DIFFERENCES BETWEEN FUELS 12.1 Reasons for Adoption
Table 12.1 compares responses given by users as reasons for adopting the fuel. Reducing emissions was commonly mentioned as a major reason for using hybrid or CNG vehicles. A number of agencies also mentioned emission reductions as a major reason for using biodiesel, but it was more often noted as a minor reason. Similarly, a greater percentage of hybrid users mentioned energy dependency concerns and improving public perception as major reasons for adoption than did biodiesel users. Fuel cost savings was also a major reason most hybrid users and half of CNG users adopted those vehicles, while fuel cost savings did not tend to be a motivating factors for biodiesel use. Table 12.1 Reasons for Adopting Alternative Fuels and Hybrids
Not a reason
Minor reason
Major reason
Response Count
Reducing emissions
Biodiesel 1 12 8 21
E85 0 6 1 7
Propane 1 1 2 4
Natural gas 1 1 8 10
Hybrid-electric vehicle 0 8 16 24
Energy dependency concerns
Biodiesel 4 11 6 21
E85 1 4 2 7
Propane 2 1 1 4
Natural gas 0 6 4 10
Hybrid-electric vehicle 1 10 11 22
Desire to utilize local resources and products
Biodiesel 5 11 5 21
E85 1 3 3 7
Propane 2 2 0 4
Natural gas 1 5 3 9
Hybrid-electric vehicle
Political directives
Biodiesel 5 8 9 22
E85 3 4 0 7
Propane 3 0 1 4
Natural gas 4 2 3 9
Hybrid-electric vehicle 4 9 10 23
Improving public perception
Biodiesel 0 6 5 21
E85 2 4 1 7
Propane 3 0 1 4
Natural gas 1 3 6 10
Hybrid-electric vehicle 1 6 16 23

56
Table 12.1 Reasons for Adopting Alternative Fuels and Hybrids (continued)
Not a reason
Minor reason
Major reason
Response Count
Positive performance impacts of the fuel
Biodiesel 5 13 3 21
E85 3 4 0 7
Propane 1 1 2 4
Natural gas 5 4 0 9
Hybrid-electric vehicle
Fuel cost savings
Biodiesel 12 8 1 21
E85 3 1 2 6
Propane 1 2 1 4
Natural gas 0 5 5 10
Hybrid-electric vehicle 0 5 19 24
12.2 Deterrents and Problems with Use For agencies that have not used alternative fuels or hybrids, deterrents differed for each alternative. The major findings are as follows:
• Fuel cost was found to most likely be a deterrent for biodiesel. Many agencies did not know if fuel cost would be a problem for the alternative fuels.
• Fuel mileage was often considered a major deterrent for E85, and some agencies also considered it a major deterrent for biodiesel.
• For agencies that did not use biodiesel, infrastructure cost was commonly mentioned as a major
deterrent.
• One of the most significant deterrents for adopting alternative fuels and hybrids was concern with maintenance issues. This was commonly mentioned as a major deterrent for all alternatives. Some agencies were also concerned about fuel quality for biodiesel.
• Lack of an adequate and dependable fuel supply was a major deterrent for all alternative fuels.
This was listed as a major deterrent for about half of E85, propane, and natural gas non-users and two-thirds of biodiesel non-users.
• Lack of information was considered a major deterrent for about one-fourth to one-third of
agencies, regardless of the alternative.
• Overall performance was most likely to be considered a deterrent for hybrid vehicles.
• Vehicle availability was a major deterrent for 45% of agencies for hybrids and 42% of agencies for propane vehicles. It was considered less of a deterrent for E85 and was not a deterrent for biodiesel use.
• Vehicle cost was the greatest deterrent for use of hybrids and also one of the most significant
deterrents for propane and natural gas use.

57
• Development and implementation of new fuel infrastructure and modifications to maintenance facilities were the greatest deterrents for use of propane and natural gas.
• Safety hazards and limited vehicle range are also considered major deterrents by a significant
number of agencies for adopting propane or natural gas. As discussed previously, the experiences of agencies that have adopted these alternatives can differ from the expectations or perceptions of non-users. For those agencies that use these alternative fuels or hybrids, fuel cost was most likely to be a problem for biodiesel or E85 and was only a minor problem or not a problem at all for propane, CNG, or hybrids. Maintenance issues were more likely to be a problem for biodiesel or propane. For all alternatives, though, 50% or more of the agencies experienced no maintenance problems, and many of the problems they have had were minor. The responses regarding reliability were similar, with the greatest problems noted for biodiesel and propane. It should be noted, though, that only four agencies that use propane responded to the survey, so it is difficult to make any conclusions regarding the fuel. Adequate and dependable fuel supply was most likely to be a problem for E85. Most of the fuel supply problems for E85 and other fuels were considered minor. 12.3 Satisfaction Table 12.2 compares the expressed satisfaction with each alternative by those agencies that use them. Table 12.2 Satisfaction Reported with Each Alternative Fuel and Hybrid
n Very
dissatisfied Somewhat dissatisfied
Neither satisfied nor dissatisfied
Somewhat satisfied
Very satisfied
Biodiesel 22 5% 18% 14% 36% 27% E85 7 0% 14% 57% 0% 29% Propane 4 0% 0% 25% 75% 0% CNG 9 0% 0% 0% 44% 56% Hybrid-electric 24 17% 8% 8% 17% 50%
For biodiesel users, the method in which the fuel is blended, the fuel storage system, and the provision of training appear to have little or no impact on whether users have been satisfied with their use of the fuel. Those that have used different blends during different seasons were more likely to be satisfied. Transit agencies most satisfied with E85 use the fuel more often. For example, of the three that use E85 more than 90% of the time, two were very satisfied with it. The most satisfied CNG users have been using the fuel longer, more than 10 years. All four of the respondents who were very dissatisfied with their agency’s experience with hybrids said they plan to purchase additional hybrid vehicles within the next five years. The two somewhat dissatisfied users do not plan to purchase additional hybrid vehicles, one of whom said the size of the vehicle in relation to its use within their fleet does not allow it to get useful returns in savings. It is used for longer routes and not heavy stop-and-go use.

58

59
13. DIFFERENCES BETWEEN URBAN AND RURAL TRANSIT PROVIDERS
Many of the responding agencies that use alternative fuels or hybrid vehicles are from urban areas. Rural transit providers may have different problems or challenges and may view the benefits differently. Therefore, the differences between the survey responses given by urban providers and those provided by rural agencies are analyzed in this section. Table 13.1 shows the number and percentage of survey respondents that use alternative fuels and hybrids, categorized by urban and rural. The table clearly illustrates that urban transit agencies are more likely to use alternative fuels or hybrid vehicles. For example, 38% of urban agencies surveyed use biodiesel, compared with 12% of rural transit providers. Similarly, 35% of urban respondents operate a hybrid vehicle, compared with 8% of rural respondents. One exception is E85. Urban and rural providers are about equally likely to own a flex fuel vehicle, but the rural respondents were found to be more likely to use E85 in those vehicles. Table 13.1 Use of Alternative Fuels and Hybrid Vehicles, by Urban and Rural
Number (Percentage)
Yes No
Urban
Biodiesel 18 (38%) 30 (63%)
Flex Fuel Vehicle 16 (30%) 38 (70%)
E85 in FFV 3 (19%) 13 (81%)
Propane 2 (4%) 52 (96%)
CNG 7 (13%) 47 (87%)
Hybrids 19 (35%) 35 (65%)
Rural
Biodiesel 3 (12%) 23 (88%)
Flex Fuel Vehicle 10 (27%) 27 (73%)
E85 in FFV 3 (27%) 8 (73%)
Propane 2 (5%) 35 (95%)
CNG 2 (5%) 35 (95%)
Hybrids 3 (8%) 34 (92%)
A comparison between urban and rural respondents of the overall satisfaction is shown in Table 13.2. There were too few rural respondents using alternative fuels or hybrids to notice any obvious differences. It appears, though, that the rural users are less likely to be very satisfied. For example, 11 of 19 urban respondents were very satisfied with their hybrid vehicles, but of the three rural users, none were very satisfied and two were somewhat dissatisfied. Similarly, five of six urban agencies were very satisfied with their CNG buses, but the two rural CNG users were somewhat satisfied. A greater number of responses from rural transit providers using alternative fuels and vehicles is necessary to better evaluate the use of these alternatives in rural areas.

60
Table 13.2 Satisfaction with Alternative Fuels and Hybrid Vehicles, by Urban and Rural
Very
dissatisfied Somewhat dissatisfied
Neither satisfied not dissatisfied
Somewhat satisfied
Very satisfied
Biodiesel
Urban 1 4 2 7 4
Rural 0 0 1 0 2
E85
Urban 0 1 0 0 2
Rural 0 0 3 0 0
Propane
Urban 0 0 1 1 0
Rural 0 0 0 2 0
CNG
Urban 0 0 0 1 5
Rural 0 0 0 2 0
Hybrids
Urban 4 0 2 2 11
Rural 0 2 0 1 0 Urban and rural transit providers face many of the same deterrents and have many of the same opinions on benefits and problems. Some differences exist, however. Adequate and dependable fuel supply was found to be a major deterrent for both urban and rural providers, but it is a greater issue for those transit agencies serving rural areas. For example, 75% of rural respondents indicated that adequate and dependable fuel supply was a major deterrent for using biodiesel, compared with 46% of urban respondents. Similar responses were obtained for E85 (70% of rural respondents and 53% of urban), propane (69% rural, 35% urban), and CNG (61% rural, 35% urban). In each case, rural respondents were also more likely to indicate that lack of information is a major deterrent. Limited vehicle range was also a greater issue for rural transit providers regarding propane and CNG. In general, rural respondents were more likely to report deterrents for all alternatives. Regarding benefits, urban respondents were consistently more likely to say that improving public perception is a major benefit. Rural respondents were generally more likely than their urban counterparts to identify benefits from using biodiesel and E85 but tended to be less likely to find benefits from using propane, CNG, or hybrids.

61
14. FACTORS AFFECTING BIODIESEL AND HYBRID ADOPTION AND SATISFACTION
The descriptive statistics presented in the previous sections provide some understanding of the current use of alternative fuels and hybrid vehicles by small urban and rural transit agencies. However, additional analysis can be conducted to estimate factors influencing adoption as well as success with those fuels. 14.1 Factors Affecting Adoption To investigate how agency characteristics or beliefs about benefits and deterrents have influenced adoption of biodiesel or hybrid vehicles, a binary logit model is used. The binary logit model is a type of discrete choice model that can be used to model an agency’s decision to adopt technology (Ripplinger and Brandt-Sargent 2010). We assume that transit agencies make the decision to adopt technology based on its impact on social welfare. Social welfare, W, is a function of consumer surplus (CS), which is affected by various factors, X, and the technology employed by the transit agency, τ, and the profits of the agency, π, which are affected by another set of factors, Z, and technology, τ, as shown by Equation 1.
Wi = CS(X,τ) + πi(Z,τ)
Using biodiesel or hybrid vehicles influences profitability by impacting costs paid for fuel, infrastructure, vehicles, etc. They also impact the social cost of operating transit vehicles by reducing negative environmental externalities, such as air pollution, and thereby affect social welfare. An agency’s perception about the benefits of an alternative fuel will influence how they perceive social welfare will be impacted by the use of that type of alternative fuel or vehicle. Two separate binary logit models were estimated for biodiesel and hybrid vehicle adoption. The dependent variable is a binary variable that indicates if the agency uses biodiesel or hybrid vehicles. Adoption of E85, propane, or CNG was not modeled because not enough users of these fuels responded to the survey, so there were not enough observations to develop a model. Explanatory variables include characteristics of the agency and opinions about benefits and deterrents. Agency characteristics that could influence adoption include the number of vehicles the agency owns, the number of vehicles miles of service they provide, the number of vehicle hours of service they provide, and whether they serve a rural area or a small urban area. It is expected that larger agencies, those with more vehicles and those providing more miles and hours of service, are more likely to use biodiesel or hybrid vehicles, and those in urban areas may also be more likely to adopt these alternatives. Larger agencies may be more likely to have the resources to consider and adopt these alternatives. This hypothesis is supported by the descriptive statistics. It is also hypothesized that urban agencies are more likely to use hybrid vehicles because the benefits of this technology are more advantageous in urban driving conditions. It is also hypothesized that those agencies that are more likely to identify benefits of biodiesel or hybrid adoption, such as emissions reductions or improved public perception, are more likely to choose those alternatives. Likewise, those that are more likely to identify deterrents, such as increased costs or inadequate supply, are hypothesized to be less likely to adopt. Dummy variables are included in the model equal to 1 if the respondent identifies the potential benefit as a major benefit and 0 otherwise. Similarly, dummy variables for deterrents equal 1 if they are listed as a major deterrent and 0 otherwise.
(1)

62
The results from the models were converted to odds ratios, which is a way of comparing whether the probability of adoption is the same for two groups of agencies. The odds of an event happening is equal to the probability of it happening divided by the probability of it not happening. An odds ratio is calculated by dividing the odds in group 1 by the odds in group 2. An odds ratio of 1 indicates the event is equally probable for the two groups, while an odds ratio greater (less) than 1 indicates the event is more (less) likely among the first group. The odds ratios from the binary logit models are shown in Table 14.1. If the odds ratio is greater than 1 for a group of agencies (e.g., urban agencies, those that indicated a major benefit or major deterrent), it indicates that the probability of adoption is greater. Agency size variables were measured as the number of vehicles the agency operates and the thousands of miles and hours of service provided. The odds ratio for these variables is the estimated change in the odds of adoption with a one unit increase in the variable. Table 14.1 Results from Binary Logit Models of Adoption
Biodiesel Hybrids
OR 95% CI OR 95% CI
Vehicles (number) 1.067*** 1.021-1.116 1.016 0.983-1.049 Vehicle miles (thousand) 1.001* 1.000-1.002 1.000 1.000-1.001 Vehicle hours (thousand) 0.959** 0.925-0.995 0.994 0.973-1.015 Urban 74.698** 1.367-999.9 8.420* 0.948-74.76 Perceived benefits
Emissions 32.043** 1.532-670.3 1.343 0.183-9.850
Energy dependancy 0.322 0.033-3.122 0.146* 0.018-1.165
Local resources 0.525 0.034-8.138
Public perception 33.154*** 3.080-356.9 4.890* 0.762-31.37
Cost savings 0.525 0.008-8.069 5.113* 0.728-35.92
Deterrents
Fuel cost 0.718 0.091-5.676
Infrastructure cost/Depot modification cost 0.119 0.004-3.436 0.090** 0.010-0.840
Fuel supply 0.061* 0.003-1.069
Lack of information 0.913 0.016-53.44
Fuel efficiency 0.775 0.020-30.43
Vehicle cost
0.635 0.149-2.712 n=86
Note: OR = odds ratio; CI = confidence interval. *p < .10 **p < .05 ***p < .01
Results show that agencies that operate more vehicles and provide more vehicle miles of service were more likely to use biodiesel. Conversely, those that provide more hours of service, everything else held constant, were less likely to use biodiesel. This indicates that after you control for whether the agency is urban or rural, the number of vehicles they own, and the number of miles of service provided, agencies were less likely to use biodiesel if that service is spread out over more hours. In other words, those agencies providing more miles of service per hour were more likely to use biodiesel. The impacts of vehicles, vehicle miles, and vehicles hours on hybrid use were not found to be statistically significant.

63
Urban agencies were substantially more likely to use biodiesel (odds ratio 74.70) and hybrids (odds ratio 8.42). In other words, the odds using biodiesel were 75 times greater and the odds of adopting hybrids were 8.4 times greater if the agency operates in an urban area, everything else held constant. Agencies that viewed emissions reductions as a major benefit of biodiesel were significantly more likely to use that fuel. Agencies that viewed reducing energy dependency as a major benefit of hybrid use were actually less likely to use hybrids, though the result was only marginally significant. In either case, the implication is that concerns about energy dependency do not motivate agencies to adopt either biodiesel or hybrids, even though some see biodiesel or hybrids as being beneficial in this regard. Agencies that consider improved public perception as a major benefit were significantly more likely to use biodiesel or hybrids. This result is especially significant for biodiesel. Those who view fuel cost savings as a major benefit for hybrids were significantly more likely to use those vehicles. Findings show that beliefs about the benefits of emissions reductions, improved public perception, and costs savings are the greatest motivating factors for adoption of biodiesel and hybrid vehicles. Regarding deterrents, two significant results were found. Those agencies that listed depot modification costs as a major deterrent for hybrid use were significantly less likely to adopt, and those that indicated that lack of adequate and dependable fuel supply is a major deterrent for biodiesel adoption were significantly less likely to use that fuel. While other deterrents exist, the model did not find significant differences between users and non-users regarding their perceptions of those deterrents. Perhaps more significant results would be found with a greater number of observations. These results indicated that concerns about infrastructure costs and fuel supply are most likely to influence the decision to adopt biodiesel or hybrids. 14.2 Factors Affecting Satisfaction with Biodiesel An ordered logit model was used to estimate satisfaction with biodiesel for those agencies that use it. Ordered logit models can be used when respondents answer a question along a scale. For this model, the dependent variable is the degree to which the agency is satisfied with its use of biodiesel, and it ranges from 1 to 5, with 1 being very dissatisfied and 5 being very satisfied. The explanatory variables include the size characteristics (vehicles, miles, hours), whether the agency operates in an urban or rural area, the number of years the agency has used the fuel, whether the agency provided any biodiesel-specific training, whether it changes the blend during colder months, and the percentage of the fleet that uses biodiesel. It is hypothesized that larger agencies may have more resources to successfully adopt the new fuel and that those agencies that have more experience using biodiesel, provided training to employees, change the blend during colder months, and operate a higher percentage of the fleet on biodiesel are more likely to have success with the fuel. Agencies that operate a higher percentage of their fleet with biodiesel are making a greater commitment to the fuel and therefore may be more successful. Many of the results were found to be statistically insignificant (Table 14.2). The limited data for biodiesel users (20 agencies) were inadequate to draw firm conclusions, but two statistically significant results were found. Agencies with a greater number of vehicles and those that operate a greater percentage of their fleet with biodiesel were more likely to have positive experiences with biodiesel. These results indicated that larger agencies and those that make a greater commitment to biodiesel are more likely to have success.

64
Table 14.2 Factors Affecting Satisfaction with Biodiesel Use, Results from Ordered Logit Model
OR 95% CI
Vehicles (number) 1.119** 1.022-1.225 Vehicle miles (thousand) 0.998 0.993-1.002 Vehicle hours (thousand) 0.983 0.942-1.027 Urban 0.059 0.001-13.54 Years of experience 0.662 0.365-1.202 Training 0.348 0.012-9.769 Change blend 6.000 0.508-70.85 Percentage of fleet 1.070** 1.015-1.128 n=20
Note: OR = odds ratio; CI = confidence interval. *p < .10 **p < .05 ***p < .01
This result does not mean that smaller agencies, or rural agencies, cannot or do not have success with biodiesel. Most of the agencies surveyed using biodiesel are from small urban areas. Only three are rural operators, and two of those three rural providers reported that they were very satisfied with their use of biodiesel. A number of factors can contribute to the success agencies have adopting new fuels or new technologies, and a lot can be learned from the smaller, rural systems that have had success with alternative fuels. Attempts were made to model satisfaction with hybrid vehicles, but no significant results were found, possibly due to limited data. Alternatively, it could be that those agencies dissatisfied with hybrid vehicles were largely unique cases that could not have been predicted by any agency characteristics or other factors. Similar models were not applied to other alternatives due to limited data.

65
15. SUMMARY AND CONCLUSIONS Previous research has identified advantages and disadvantages from using alternative fuels and hybrid buses. However, less is known about the factors that motivate agencies to adopt these alternatives or the degree to which different deterrents prevent adoption, especially among small urban and rural transit agencies. In this study, a survey was conducted of small urban and rural transit agencies. Objectives were to identify and describe the usage of alternative fuel and hybrid vehicles by small urban and rural transit agencies; identify the motivating factors for the adoption of alternative fuels and hybrids for these agencies; document the deterrents for adoption; describe the experience of transit agencies that have adopted alternative fuels or hybrid vehicles; determine how use varies by characteristics of transit agencies and beliefs about deterrents and benefits; and determine which factors explain the difference between those agencies with a satisfactory experience and those that have experienced difficulties. The survey focused on biodiesel, E85, propane, natural gas, and hybrid-electric vehicles. A total of 115 survey responses were received from transit agencies in 36 states. Biodiesel is the most commonly used alternative fuel among small urban and rural transit operators. Thirty-one of the responding agencies use biodiesel, while ten use CNG, eight use E85, and four use propane. Twenty-four of the agencies own hybrid-electric vehicles. Larger agencies and those operating in urban areas tend to be more likely to adopt alternatives than smaller, rural providers. Results from a logit model show that agencies that operate more vehicles and provide more vehicle miles of service are more likely to use biodiesel, and agencies in urban areas were found to be substantially more likely to use biodiesel or hybrids. Agency characteristics do not completely explain why some use alternative fuels or hybrids while others do not. It was found that beliefs about benefits and deterrents have some influence on adoption. In general, users tended to be more likely to identify benefits of using the alternative. One notable difference for biodiesel, CNG, and hybrid users was that they were more likely to think that improved public perception is a major benefit. Regarding deterrents, non-users were substantially more likely to view infrastructure costs and adequate fuel supply as deterrents for biodiesel; vehicle costs, development of new fuel infrastructure, modifications to maintenance facilities, adequate fuel supply, and maintenance issues as deterrents for CNG; and vehicle availability, depot modification costs, concerns about reliability, and battery replacement costs as deterrents for hybrids. Results from the logit model showed that agencies that view emissions reductions as a major benefit of biodiesel were significantly more likely to use that fuel, and agencies that consider improved public perception as a major benefit were significantly more likely to use biodiesel or hybrids. Findings suggest that beliefs about the benefits of emissions reductions, improved public perception, and costs savings are the greatest motivating factors for adoption of biodiesel and hybrid vehicles. Logit model results also indicate that concerns about infrastructure costs and fuel supply are most likely to influence the decision to adopt biodiesel or hybrids. Reducing emissions was commonly mentioned as a major reason for using hybrid or CNG vehicles. A number of agencies also mentioned emission reductions as a major reason for using biodiesel, but it was more often noted as a minor reason. Similarly, a greater percentage of hybrid users mentioned energy dependency concerns and improving public perception as major reasons for adoption than did biodiesel users. Fuel cost savings was also a major reason most hybrid users and half of CNG users adopted those vehicles, while fuel cost savings did not tend to be a motivating factor for biodiesel use.

66
In general, transit agencies tend to be satisfied with their use of alternative fuels or hybrid vehicles, though some have reported problems. Results from an ordered logit model analyzing satisfaction with biodiesel indicated that larger agencies and those that make a greater commitment to biodiesel were more likely to have success. Previous research suggests that providing training for employees is important for achieving success. The survey revealed that such training is fairly common for agencies adopting CNG, propane, or hybrid vehicles, but not for those using biodiesel or E85. The experiences of agencies that have adopted these alternatives can differ from the expectations or perceptions of non-users. For those agencies that use these alternative fuels or hybrids, fuel cost was most likely to be a problem for biodiesel or E85 and was only a minor problem or not a problem at all for propane, CNG, or hybrids. Maintenance issues were more likely to be a problem for biodiesel or propane. For all alternatives, though, 50% or more of agencies have experienced no maintenance problems, and many of the problems they have had were minor. The responses regarding reliability were similar, with the greatest problems for biodiesel and propane. Adequate and dependable fuel supply was most likely to be a problem for E85, but most of the fuel supply problems for E85 and other fuels were considered minor. The survey revealed a general satisfaction with use of alternative fuels and hybrid vehicles, though a number of problems were identified, and some respondents expressed dissatisfaction. Significant deterrents also exist for many of the agencies that have not adopted any of these alternatives. Use was much less common in rural areas, and these deterrents would have to be addressed before widespread adoption occurs.
67
REFERENCES Alternative Fuels Group of the Cleaner Vehicles Task Force. (2000). An Assessment of the Emissions
Performance of Alternative and Conventional Fuels. Department of Trade and Industry, United Kingdom.
American Coalition for Ethanol. (n.d.). Ethanol 101. Retrieved August 2011, from http://www.ethanol.org/index.php?id=34&parentid=8
American Coalition for Ethanol. (n.d.). Fuel Economy Study: Comparing Performance and Cost of Various Ethanol Blends and Standard Unleaded Gasoline. Sioux Falls, SD.
American Public Transportation Association. (2011). Public Transportation Vehicle Database.
Anderson, J. F., & T.A. King. (1999). Market Barriers to Natural Gas Vehicles and the Role of Clean Air Credits. Transportation Research Record: Journal of the Transportation Research Board, 1664, 81-89.
Barnitt, R., R.L. McCormick, & M. Lammert. (2008). St. Louis Metro Biodiesel (B20) Transit Bus Evaluation: 12-Month Final Report. Technical Report NREL/TP-540-43486, National Renewable Energy Laboratory.
Beer, T., T. Grant, D. Williams, & H. Watson. (2002). Fuel-Cycle Greenhouse Gas Emissions from Alternative Fuels in Australian Heavy Vehicles. Atmospheric Environment, 36, 753-763.
BIOBUS Project. (2003). Biodiesel Demonstration and Assessment with the Societe de Transport de Montreal (STM), Final Report.
Clark, N.N., F. Zhen, & W.S. Wayne. (2009). TCRP Report 132: Assessment of Hybrid-Electric Transit Bus Technology. Transit Cooperative Research Program. Washington, DC: Transportation Research Board of the National Academies.
Clean Cities. (2002). Alternative Fuels in Public Transit: A Match Made on the Road. Alternative Fuel Information Series, U.S. Department of Energy, Office of Energy Efficiency and Renewable Energy.
Davis, S.C., S.W. Diegel, & R.G. Boundy. (2011). Transportation Energy Data Book 30th Edition. Oak Ridge National Laboratory.
Eudy, L. (2002). Natural Gas in Transit Fleets: A Review of the Transit Experience. Golden, CO: National Renewable Energy Laboratory.
Federal Transit Administration. (2006). Alternative Fuels Study: A Report to Congress on Policy Options for Increasing the Use of Alternative Fuels in Transit Vehicles. U.S. Department of Transportation.
Federal Transit Administration. (2007). Transit Bus Life Cyle Cost and Year 2007 Emissions Estimation. U.S. Department of Transportation.

68
Humburg, D.S., T.J. Hansen, L.G. Schumacher, G.L. Mahapatra, G.L. Taylor, & B.T. Adams. (2006). Biodiesel Use and Experience Among State DOT Agencies. Applied Engineering in Agriculture, 22(2), 177-184.
National Biodiesel Board. (2012). Biodiesel Definitions. Retrieved March 2012, from http://www.biodiesel.org/resources/definitions/default.shtm
NC Transit Alternative Fuels Committee. (2008). NC Transit Alternative Fuels Committee Report.
Nylund, N.-O., K. Erkkila, M. Lappi, & M. Ikonen. (2004). Transit Bus Emission Study: Comparison of Emissions from Diesel and Natural Gas Buses. VTT Processes.
Peterson, D. & J. Mattson. (2008). Biodiesel Use in Fargo-Moorhead MAT Buses. Departmental Report No. 200, North Dakota State University, Upper Great Plains Transporation Institute.
Proc, K., R. Barnitt, R.R. Hayes, M. Ratcliff, R.L. McCormick, L. Ha, et al. (2006). 100,000-Mile Evaluation of Transit Buses Operated on Biodiesel Blends (B20). Presented at the Powertrain and Fluid Systems Conference and Exhibition, October 2006, Toronto, Canada.
Ripplinger, D. & B. Brandt-Sargent. (2010). Technology Adoption by Small Urban and Rural Transit Agencies. Departmental Report No. 226, North Dakota State University, Upper Great Plains Transporatation Insitute.
Schimek, P. (1998). Reducing Particulate Matter and Oxides of Nitrogen Emissions from Heavy-Duty Vehicles: The Urban Bus Case. Transportation Research Record: Journal of the Transportation Research Board, 1641, 39-47.
Schimek, P. (2001). Reducing Emissions from Transit Buses. Regional Science and Urban Economics, 31, 433-451.
Science Applications International Corporation. (2011). TCRP Report 146: Guidebook for Evaluating Fuel Choices for Post-2010 Transit Bus Procurements. Washington, DC: Transportation Research Board of the National Academies.
Texas Transportation Institute. (2007). Alternative Fuel Vehicles at Small Urban and Rural Public Transportation Systems in Texas. Sponsored by the Texas Department of Transportation. College Station, TX: The Texas A&M University.
U.S. Department of Energy. (2010, April 13). Alternative Fuels & Advanced Vehicles Data Center. Retrieved August 2011, from What is propane?: http://www.afdc.energy.gov/afdc/fuels/propane_what_is.html
U.S. Department of Energy. (2010, April 13). What is natural gas? Retrieved August 2011, from Alternative Fuels & Advanced Data Center: http://www.afdc.energy.gov/afdc/fuels/natural_gas_what_is.html
U.S. Department of Energy. (2011). Natural Gas. Retrieved August 16, 2011, from www.fueleconomy.gov: http://www.fueleconomy.gov/feg/bifueltech.shtml

69
U.S. Environmental Protection Agency. (2002). A Comprehensive Analysis of Biodiesel Impacts on Exhaust Emissions: Draft Technical Report. U.S. Environmental Protection Agency, Assessment and Standards Division, Office of Transportation and Air Quality.
U.S. Environmental Protection Agency. (2007). Emission Facts: Greenhouse Gas Impact of Expanded Renewable and Alternative Fuels Use. Office of Transportation and Air Quality.
U.S. Environmental Protection Agency. (2010, September 14). Transportation and Climate. Retrieved August 17, 2011, from http://www.epa.gov/otaq/climate/basicinfo.htm
Vikara, D. & B.A. Holmen. (2006). Ultrafine Particle Number Concentrations from Hybrid Urban Transit Buses. Transportation Research Record: Journal of the Transportation Research Board, 1987, 54-61.
Wang, M. (2008, March 18). Overview of GREET Model Development at Argonne. Sacramento, CA: Center for Transporation Research, Argonne National Laboratory. GREET User Workshop.
Werpy, M.R., A. Burnham, & K. Bertram. (2010). Propane Vehicles: Status, Challenges, and Opportunities. Argonne National Laboratory, Center for Transportation Research, Energy Systems Division.

70

71
APPENDIX A. ALTERNATIVE FUELS AND HYBRID VEHICLES SURVEY
*1. Does your agency operate vehicles with diesel engines?
□ Yes □ No Biodiesel
*1. Does your agency use biodiesel? □ Yes
□ No Experience with Biodiesel
1. What blend(s) of biodiesel does your agency use?
B2
B20
Other
B5 B50
B10 B100
Other (please specify)
2. Does your agency use different blends during different seasons of the year? If so, explain how.
□ Yes
□ No
If yes, explain: 3. Approximately how many years has your agency been using biodiesel?
72
4. Which of the following were reasons for your agency's adoption of biodiesel? Not a reason Minor reason Major reason
Reducing emissions □ □ □
Energy dependency concerns □ □ □
Desire to utilize local resources and products □ □ □
Political directives □ □ □
Improving public perception □ □ □
Positive performance impacts of the fuel □ □ □
Fuel cost savings □ □ □
Other (please specify) □ □ □
5. How much of a deterrent, or concern, was each of the following when considering adoption of biodiesel? Not a deterrent Minor deterrent Major deterrent
Fuel cost □ □ □
Fuel mileage □ □ □
Infrastructure cost □ □ □
Maintenance issues □ □ □
Reliability □ □ □
Cold weather performance □ □ □
Adequate and dependable fuel supply □ □ □
Fuel quality □ □ □
Engine warranty □ □ □
NOx emissions □ □ □
Lack of information about biodiesel □ □ □
Other (please specify) □ □ □
6. How satisfied is your agency with its use of biodiesel?
□Very dissatisfied □Somewhat dissatisfied
□Neither satisfied nor dissatisfied
□Somewhat satisfied
□Very satisfied

73
7. Compared to petroleum diesel, have you had greater problems with any of the following when using biodiesel? No greater problem Minor problem Major problem
Fuel cost □ □ □
Fuel mileage □ □ □
Maintenance □ □ □
Reliability □ □ □
Cold weather performance □ □ □
Fuel quality □ □ □
Adequate and dependable fuel supply □ □ □
Other (please specify) □ □ □
8. Specifically regarding fuel economy, have you noticed or documented any change in fuel mileage since beginning use of biodiesel?
□ Not measured
□ No change noted
□ Noticed decreased miles per gallon when using biodiesel
□ Noticed increased miles per gallon when using biodiesel
Identify the change in miles per gallon compared to use of petroleum:
9. How is your fuel blended?
□ Blended at terminal and delivered by pipeline □ Blended at terminal and "splash mixed" in a tanker delivery vehicle
□ Blended in your storage tanks
□ Blended at the point of fueling in the vehicle fuel tank □ Other
□ Don’t know
10. Have you made changes in your fuel storage system to accommodate biodiesel blends in cold weather? If yes, please explain.
□ Yes If yes, explain: □ No

74
11. Did you provide any special biodiesel-related training to employees?
□ Yes □ No
12. Please provide any additional comments you have regarding your agency's experience with biodiesel.
Future Biodiesel Use
1. Does your agency currently have plans to adopt biodiesel in the next 5 years?
□ Yes □ No
2. What deterrents, or concerns, would prevent your agency from adopting biodiesel?
Not a deterrent
Minor deterrent
Major deterrent
Don't know
Fuel cost
Fuel mileage
Infrastructure cost
Maintenance issues
Reliability
Cold weather performance
Fuel quality
Adequate and dependable fuel supply
Engine warranty
NOx emissions
Lack of information about biodiesel
Other (please specify)
□ □ □ □
□ □ □ □
□ □ □ □
□ □ □ □
□ □ □ □
□ □ □ □
□ □ □ □
□ □ □ □
□ □ □ □
□ □ □ □
□ □ □ □
□ □ □ □

75
3. What do you see as potential benefits from using biodiesel?
Not a benefit Minor benefit Major benefit Don't know
Reducing emissions □ □ □ □
Reducing energy dependency □ □ □ □
Use of local resources and products □ □ □ □
Improving public perception □ □ □ □
Positive performance impacts of the fuel □ □ □ □
Fuel cost savings □ □ □ □
Other (please specify) □ □ □ □
Flex Fuel Vehicles
*1. Does your agency operate any Flex Fuel Vehicles (those that can operate on either gasoline or E85)? □ Yes
□ No E85
*1. Does your agency utilize E85 in any of its Flex Fuel Vehicles?
□ Yes
□ No Experience with E85
1. How often is E85 used in your Flex Fuel Vehicles?
□ Infrequently (<25%)
□ Sometimes (25%-50%)
□ A majority of the time (51%-90%)
□ Always, or almost always (>90%)
2. Approximately how many years has your agency been using E85?
76
3. Which of the following were reasons for your agency's adoption of E85? Not a reason Minor reason Major reason
Reducing emissions □ □ □
Energy dependency concerns □ □ □
Desire to utilize local resources and products □ □ □
Political directives □ □ □
Improving public perception □ □ □
Positive performance impacts of the fuel □ □ □
Fuel cost savings □ □ □
Other (please specify) □ □ □
4. How much of a deterrent, or concern, were each of the following when considering adoption of E85? Not a deterrent Minor deterrent Major deterrent
Fuel cost □ □ □
Fuel mileage □ □ □
Infrastructure cost □ □ □
Maintenance issues □ □ □
Reliability □ □ □
Adequate and dependable fuel supply □ □ □
Fuel quality □ □ □
Lack of information about E85 □ □ □
Other (please specify) □ □ □
5. How satisfied is your agency with its use of E85?
□Very dissatisfied □Somewhat dissatisfied
□Neither satisfied nor dissatisfied
□Somewhat satisfied
□Very satisfied

77
6. Compared with gasoline, have you had greater problems with any of the following when using E85? No greater problem Minor problem Major problem
Fuel cost □ □ □
Maintenance □ □ □
Reliability □ □ □
Overall performance □ □ □
Adequate and dependable fuel supply □ □ □
Other (please specify) □ □ □
7. Specifically regarding fuel economy, have you noticed or documented any change in fuel mileage since beginning use of E85?
□ Not measured
□ No change noticed
□ Noticed decreased miles per gallon when using E85
□ Noticed increased miles per gallon when using E85
Identify the change in miles per gallon compared to use of gasoline:
8. Did you provide any special E85-related training to employees?
□ Yes
□ No
9. Please provide any additional comments you have regarding your agency's experience with E85.
Future E85 Use
1. Does your agency currently have plans to use E85 within the next 5 years?
□ Yes
□ No

78
2. What deterrents, or concerns, would prevent your agency from using E85?
Not a deterrent
Minor deterrent
Major deterrent
Don't know
Fuel cost
Fuel mileage
Infrastructure
cost k
Maintenance
Reliability
Overall performance
Adequate and dependable fuel supply
Fuel quality
Vehicle availability
Lack of information about E85
Other (please specify)
3. What do you see as potential benefits from using E85?
Not a benefit Minor benefit Major benefit Don't know
Reducing emissions □ □ □ □
Reducing energy dependency □ □ □ □
Use of local resources and products □ □ □ □
Improving public perception □ □ □ □
Positive performance impacts of the fuel □ □ □ □
Fuel cost savings □ □ □ □
Other (please specify) □ □ □ □ Propane
*1. Does your agency operate any vehicles with Liquified Petroleum Gas (LPG), commonly referred to as
propane?
□ Yes
□ No
Experience with Propane
1. Approximately how many years has your agency been using LPG (propane)?
□ □ □ □
□ □ □ □
□ □ □ □
□ □ □ □
□ □ □ □
□ □ □ □
□ □ □ □
□ □ □ □
□ □ □ □
□ □ □ □
□ □ □ □
□ □ □ □

79
2. Which of the following were reasons for your agency's adoption of LPG (propane)? Not a reason Minor reason Major reason
Reducing emissions □ □ □
Energy dependency concerns □ □ □
Desire to utilize local resources and products □ □ □
Political directives □ □ □
Improving public perception □ □ □
Positive performance impacts of the fuel □ □ □
Fuel cost savings □ □ □
Maintenance cost savings □ □ □
Other (please specify) □ □ □
3. How much of a deterrent, or concern, were each of the following when considering adoption of LPG (propane) vehicles?
Not a deterrent Minor deterrent Major deterrent
High capital cost of the vehicles
Vehicle availability
Fuel cost
Development and implementation of new fuel infrastructure
Modifications to maintenance facility
Adequate and dependable fuel supply
Safety hazards
Limited vehicle range
Maintenance issues
Reliability
Lack of technical/mechanical expertise for repairs (or scarcity of repair locations)
Vehicle performance
Lack of information about propane vehicles
Other (please specify)
□ □ □
□ □ □
□ □ □
□ □ □
□ □ □
□ □ □
□ □ □
□ □ □
□ □ □
□ □ □
□ □ □
□ □ □
□ □ □
□ □ □

80
4. Compared to diesel or gasoline, have you had any greater problems with any of the following when using LPG (propane)?
No greater problem Minor problem Major problem
Fuel cost
Dependable and secure fuel supply
Safety hazards
Limited vehicle range
Maintenance issues
Reliability
Lack of technical/mechanical expertise for repairs (or scarcity of repair locations)
Vehicle performance
Other (please specify)
5. Does your agency fuel its LPG (propane) vehicles on site or off site?
□ On site
□ Off site
6. How satisfied is your agency with its use of LPG (propane) vehicles?
□Very dissatisfied □Somewhat dissatisfied
□Neither satisfied nor dissatisfied
□Somewhat satisfied
□Very satisfied
7. Did you provide any special propane-related training to employees?
□ Yes
□ No
8. Please provide any additional comments you have regarding use of LPG vehicles.
Future Propane Use
1. Does your agency currently have plans to use LPG (propane) vehicles within the next 5 years?
□ Yes
□ No
□ □ □
□ □ □
□ □ □
□ □ □
□ □ □
□ □ □
□ □ □
□ □ □
□ □ □

81
2. What deterrents, or concerns, would prevent your agency from adopting LPG (propane) vehicles?
Not a deterrent
Minor deterrent
Major deterrent
Don't know
High capital cost of the vehicles
Vehicle availability
Fuel cost
Development and implementation of new fuel infrastructure
Modifications to maintenance facility
Adequate and dependable fuel supply
Safety hazards
Limited vehicle range
Maintenance issues
Reliability
Lack of technical/mechanical expertise for repairs (or scarcity of repair locations)
Vehicle performance
Lack of information about propane vehicles
Other (please specify)
3. What do you see as the potential benefits from using LPG (propane) vehicles?
Not a benefit Minor benefit Major benefit Don't know
Reducing emissions □ □ □ □
Reducing energy dependency □ □ □ □
Use of local resources and products □ □ □ □
Improving public perception □ □ □ □
Positive performance impacts of the fuel □ □ □ □
Fuel cost savings □ □ □ □
Maintenance cost savings □ □ □ □
Other (please specify)
□ □ □ □
□ □ □ □
□ □ □ □
□ □ □ □
□ □ □ □
□ □ □ □
□ □ □ □
□ □ □ □
□ □ □ □
□ □ □ □
□ □ □ □
□ □ □ □
□ □ □ □
□ □ □ □

82
*1. Does your agency operate any vehicles with Compressed Natural Gas (CNG) or Liquefied Natural Gas
(LNG)?
□ Compressed Natural Gas (CNG)
□ Liquefied Natural Gas (LNG)
□ Both CNG and LNG
□ Neither CNG nor LNG Experience with Natural Gas
1. Approximately how many years has your agency been using CNG or LNG?
2. Which of the following were reasons for your agencies adoption of CNG or LNG? Not a reason Minor reason Major reason
Reducing emissions □ □ □
Energy dependency concerns □ □ □
Desire to utilize local resources and products □ □ □
Political directives □ □ □
Improving public perception □ □ □
Positive performance impacts of the fuel □ □ □
Fuel cost savings □ □ □
Other (please specify) □ □ □
Gas

83
3. Which of the following were deterrents, or concerns, when considering adoption of natural gas vehicles? Not a deterrent Minor deterrent Major deterrent
High capital cost of the vehicles □ □ □
Vehicle availability □ □ □
Fuel cost □ □ □
Development and implementation of new fuel infrastructure □ □ □
Modifications to maintenance facility □ □ □
Adequate and dependable fuel supply □ □ □
Safety hazards □ □ □
Limited vehicle range □ □ □
Maintenance issues □ □ □
Reliability □ □ □
Vehicles performance □ □ □
Lack of information about natural gas vehicles □ □ □
Other (please specify) □ □ □
4. How satisfied is your agency with its use of CNG or LNG?
□Very dissatisfied □Somewhat dissatisfied
□Neither satisfied nor dissatisfied
□Somewhat satisfied
□Very satisfied
5. Compared to diesel or gasoline, have you had any greater problem with any of the following when using CNG or LNG? No greater problem Minor problem Major problem
Fuel cost □ □ □
Dependable and secure fuel supply □ □ □
Safety hazards □ □ □
Limited vehicle range □ □ □
Maintenance issues □ □ □
Reliability □ □ □
Vehicle performance □ □ □
Other (please specify) □ □ □
6. Did you provide any special CNG- or LNG-related training to employees?
□ Yes □ No

84
7. Does your agency fuel its natural gas vehicles on site or off site?
□ On site
□ Off site
8. Please provide any additional comments you have regarding your agency's experience with natural gas vehicles.
Future Natural Gas Use
1. Does your agency currently have plans to use CNG or LNG vehicles within the next 5 years?
□ Yes
□ No
2. What deterrents, or concerns, would prevent your agency from adopting natural gas vehicles?
Not a deterrent
Minor deterrent
Major deterrent
Don't know
High capital cost of the vehicles
Vehicle availability
Fuel cost
Development and implementation of new fuel infrastructure
Modifications to maintenance facility
Adequate and dependable fuel supply
Safety hazards
Limited vehicle range
Maintenance issues
Reliability
Vehicle performance
Lack of information about natural gas vehicles
Other (please specify)
□ □ □ □
□ □ □ □
□ □ □ □
□ □ □ □
□ □ □ □
□ □ □ □
□ □ □ □
□ □ □ □
□ □ □ □
□ □ □ □
□ □ □ □
□ □ □ □
□ □ □ □

85
3. What do you see as potential benefits from using natural gas vehicles?
Not a benefit Minor benefit Major benefit Don't know
Reducing emissions □ □ □ □
Reducing energy dependency □ □ □ □
Use of local resources and products □ □ □ □
Improving public perception □ □ □ □
Positive performance impacts of the fuel □ □ □ □
Fuel cost savings □ □ □ □
Other (please specify) □ □ □ □
Hybrids
*1. Does your agency operate any hybrid-electric vehicles?
□ Yes
□ No Experience with Hybrids
1. Approximately how many years has your agency been operating a hybrid vehicle?
2. Which of the following were reasons for your agency's adoption of a hybrid vehicle(s)? Not a reason Minor reason Major reason
Reducing emissions □ □ □
Energy dependency concerns □ □ □
Political directives □ □ □
Improving public perception □ □ □
Fuel cost savings □ □ □
Other (please specify) □ □ □
86
3. How much of a deterrent were each of the following when considering adoption of hybrids? Not a deterrent Minor deterrent Major deterrent
High capital cost of the vehicle □ □ □
Vehicle availability □ □ □
Depot modification costs □ □ □
Cost to replace battery □ □ □
Maintenance issues □ □ □
Reliability □ □ □
Vehicle performance □ □ □
Lack of information about hybrids □ □ □
Other (please specify) □ □ □
4. Since adopting hybrid vehicles, has your agency had any greater problem with any of the following (compared to using conventional vehicles)? No greater problem Minor problem Major problem
Maintenance □ □ □
Reliability □ □ □
Vehicle performance □ □ □
Other (please specify) □ □ □
5. Did you provide any special hybrid-vehicle-related training to employees?
□ Yes
□ No
6. Has your agency noticed or documented any change in fuel economy since beginning use of the hybrid vehicle(s)?
□ Not measured
□ No change noted
□ Noticed increase in miles per gallon
Identify the change in miles per gallon compared to conventional vehicle:
7. How satisfied is your agency with its use of its hybrid vehicle(s)?
□Very dissatisfied □Somewhat dissatisfied
□Neither satisfied nor dissatisfied
□Somewhat satisfied
□Very satisfied

87
8. Does your agency plan to purchase additional hybrid vehicle(s) within the next 5 years?
□ Yes
□ No
9. Please provide any additional comments you have regarding hybrid-electric vehicles.
Future Hybrid Use
1. Does your agency currently have plans to purchase a hybrid-electric vehicle within the next 5 years?
□ Yes
□ No
2. What deterrents, or concerns, would prevent your agency from purchasing a hybrid vehicle?
Not a deterrent
Minor deterrent
Major deterrent
Don't know
High capital cost of the vehicle
Vehicle availability
Depot modification costs
Costs to replace battery
Maintenance issues
Reliability concerns
Vehicle performance
Lack of information about hybrids
Other (please specify)
3. What do you see as potential benefits of using hybrid vehicles?
Not a benefit Minor benefit Major benefit Don't know
Reducing emissions □ □ □ □
Reducing energy dependency □ □ □ □
Improving public perception □ □ □ □
Fuel cost savings □ □ □ □
Other (please specify) □ □ □ □
□ □ □ □
□ □ □ □
□ □ □ □
□ □ □ □
□ □ □ □
□ □ □ □
□ □ □ □
□ □ □ □
□ □ □ □

88
Finally, please provide the name and location of your agency and some information about your fleet
1. Agency Name
2. City, State
3. Please indicate the total number of vans, cutaways, and buses in your fleet, the number of hybrids, and the number operating on each fuel type.
Vans Cutaways Buses
Total number of vehicles
Hybrid-electric vehicles
Petroleum diesel (no biodiesel) vehicles
Biodiesel blend vehicles
Gasoline vehicles
E85 vehicles
Propane vehicles
CNG vehicles
LNG vehicles
Other vehicles

89

90
APPENDIX B. DIFFERENCES BETWEEN USERS AND NON- USERS REGARDING PERCEIVED BENEFITS AND DETERRENTS
• Figure B.1 Comparison of Perceived Biodiesel Benefits between Users and Non-Users
38% 31%
29% 39%
24% 31%
71% 31%
14% 16%
5% 29%
57% 33%
52% 32%
52% 28%
29% 47%
62% 28%
38% 15%
0% 10% 20% 30% 40% 50% 60% 70% 80% 90% 100%
Reducing emissions
Reducing energy dependency
Use of local resources
Improving public perception
Positive performance impacts
Fuel cost savings
Major benefit Minor benefit
User
User
User
User
User
User
Non-User
Non-User
Non-User
Non-User
Non-User
Non-User

91
Figure B.2 Comparison of Perceived E85 Benefits between Users and Non-Users
Figure B.3 Comparison of Perceived CNG Benefits between Users and Non-Users
14% 27%
29% 27%
43% 14%
14% 14%
14%
33% 18%
86% 32%
57% 32%
43% 36%
57% 50%
57% 18%
17% 32%
0% 10% 20% 30% 40% 50% 60% 70% 80% 90% 100%
Reducing emissions
Reducing energy dependency
Use of local resources and products
Improving public perception
Positive performance impacts
Fuel cost savings
Major benefit Minor benefit
User
User
User
User
User
User
Non-User
Non-User
Non-User
Non-User
Non-User
Non-User
80% 53%
40% 49%
33% 35%
60% 41%
22%
50% 31%
10% 22%
60% 19%
56% 19%
30% 24%
44% 22%
50% 18%
0% 10% 20% 30% 40% 50% 60% 70% 80% 90% 100%
Reducing emissions
Reducing energy dependency
Use of local resources and products
Improving public perception
Positive performance impacts of the fuel
Fuel cost savings
Major benefit Minor benefit
User
User
User
User
User
User
Non-User
Non-User
Non-User
Non-User
Non-User
Non-User

92
Figure B.4 Comparison of Perceived Hybrid Benefits between Users and Non-Users
67%
69%
50%
61%
70%
53%
79%
57%
33%
22%
45%
18%
26%
31%
21%
16%
0% 20% 40% 60% 80% 100%
Reducing emissions
Reducing energy dependency
Improving public perception
Fuel cost savings
Major benefit Minor benefit
Non-User
Non-User
Non-User
Non-User
User
User
User
User

93
Figure B.5 Comparison of Biodiesel Deterrents between Users and Non-Users
24% 45%
5% 18%
5% 53%
43% 49%
19% 25%
48% 26%
19% 67%
29% 31%
33% 43%
29% 17%
10% 32%
52% 20%
38% 26%
24% 11%
19% 18%
38% 33%
33% 31%
38% 9%
48% 29%
29% 21%
10% 21%
14% 23%
0% 10% 20% 30% 40% 50% 60% 70% 80% 90%
Fuel cost
Fuel mileage
Infrastructure cost
Maintenance issues
Reliability
Cold weather performance
Adequate/dependable fuel supply
Fuel quality
Engine warranty
NOx emissions
Lack of information
Major deterrent Minor deterrent
User
Non-User
Non-User
User
User
User
User
User
User
User
User
User
User
Non-User
Non-User
Non-User
Non-User
Non-User
Non-User
Non-User
Non-User
Non-User

94
Figure B.6 Comparison of CNG Deterrents between Users and Non-Users
11% 60%
22% 36%
11% 27%
33% 79%
11% 73%
11% 48%
38%
33% 36%
47%
11% 26%
26%
25%
78% 15%
44% 21%
13%
22% 3%
33% 6%
33% 12%
67% 18%
33% 29%
56% 15%
44% 24%
56% 24%
33% 22%
0% 10% 20% 30% 40% 50% 60% 70% 80% 90% 100%
High capital cost of the vehicles
Vehicle availability
Fuel cost
Development and implementation of new fuel…
Modifications to maintenance facility
Adequate and dependable fuel supply
Safety hazards
Limited vehicle range
Maintenance issues
Reliability
Vehicle performance
Lack of information about natural gas vehicles
Major deterrent Minor deterrent
User
User
User
User
User
User
User
User
User
User
User
User
Non-User
Non-User
Non-User
Non-User
Non-User
Non-User
Non-User
Non-User
Non-User
Non-User
Non-User
Non-User

95
Figure B.7 Comparison of Hybrid Deterrents between Users and Non-Users
54% 78%
45%
4% 48%
26% 66%
29% 45%
22% 42%
17% 42%
8% 33%
42% 12%
30% 26%
30% 18%
35% 12%
38% 21%
17% 23%
30% 20%
17% 20%
0% 10% 20% 30% 40% 50% 60% 70% 80% 90% 100%
High capital cost of the vehicle
Vehicle availability
Depot modification costs
Costs to replace battery
Maintenance issues
Reliability concerns
Vehicle performance
Lack of information
Major deterrent Minor deterrent
User
User
User
User
User
User
User
User
Non-User
Non-User
Non-User
Non-User
Non-User
Non-User
Non-User
Non-User