use of chemical markers to identify sources of fecal...
TRANSCRIPT
Chemical Markers - 304
ABSTRACT - The Santa Ana River and adjacentwetlands have been identified as potential sourcesof fecal indicator bacteria (FIB) to the surf zone atHuntington Beach, California, but it remained unclearwhether sewage or non-sewage related contamina-tion was the main concern. To address this issue,we collected and analyzed 54 water samples fromthree locations in the intertidal zone near the mouthof the Santa Ana River, California, for a suite of 10fecal steroids and caffeine. The data were used toidentify possible sources of FIB within the lowerSanta Ana River watershed. The sampling timeswere chosen to assess the influence of daily andfortnightly tidal cycles. Steroid ratios were differentfrom those found in raw sewage or the effluentplume from a local wastewater treatment plant, andwere more influenced by the spring/neap tidal cyclethan by the daily tides, or by station location.Multivariate statistical analysis showed that the con-centrations of FIB were better correlated with choles-terol (CHOE) than with the typical sewage sterols.Conversely, coprostanol (COP) was found to corre-late most strongly with turbidity, suggesting that itstemmed from tidal resuspension of bottom sedi-ments. Moreover, the relative abundances of certainsteroids suggested a diagenetic rather than a bio-genic source for the COP content of the samples.The results implied that sewage was not a significantsource of fecal steroids, and therefore perhaps FIBto the study area. Instead, birds may be one possi-ble source of the intermittently high levels of FIBobserved in the Santa Ana River and the nearby surfzone.
INTRODUCTIONPublic beaches are an important economic,
recreational, and cultural resource for southernCalifornia. In an effort to protect beach-goers fromwaterborne disease, state regulations require thatwater quality be monitored routinely at public beach-es with 50,000 or more annual visitors (Assembly1997-1998). Beach water quality monitoring pro-grams are required to collect samples and measurethree types of FIB - total coliforms (TC), fecal col-iforms (i.e., E. coli, or EC), and the enterococcusgroup (ENT). The State of California has set uni-form contact water quality standards for the threeFIB. If the concentration of any FIB in a sampleexceeds the respective standard, the local health offi-cer is required to post warnings, or close the beachto swimmers if a sewage spill is suspected.
Huntington State Beach and city beaches inCalifornia have been particularly affected by the newregulations. There have been a total of 684 healthadvisories posted at Huntington State Beach and citybeaches between July 1999 and April 2002, 84% ofwhich were due to ENT exceeding the contact waterquality standards (Grant et al. 2002). HuntingtonState Beach even received national attention in thesummer of 1999, when a large section of the beachwas closed to the public (Boehm et al. 2002) due topersistently high levels of all three FIB groups. Inresponse, the Orange County Sanitation District(OCSD; Fountain Valley, CA) conducted a compre-hensive survey and inspection of the local sewageinfrastructure, but no significant sewage leaks wereidentified (Grant et al. 2001). The lack of an obvi-ous sewage source spawned a number of studies toidentify possible mechanisms for sewage outfallplume transport to the coastal zone (Boehm et al.
Use of chemical markers to identifysources of fecal indicator bacteria inthe lower Santa Ana River
James A. Noblet1, Diana L. Young, Eddy Y. Zeng* and Semsi Ensari2
*Present address: Guangzhou Institute of Geochemistry, Chinese Academy of Science, P.O. Box 1131, Guangzhou 510640, China1California State University-San Bernardino, 5500 University Parkway, San Bernardino CA 92407-23972Henry Samueli School of Engineering, University of California, Irvine, CA 92691

2002), gain an understanding of the temporal vari-ability of surfzone FIB concentrations (Boehm et al.2002), and identify other possible sources of fecalcontamination (Grant et al. 2001). In the latterstudy, Grant et al. (2001) did find compelling evi-dence that a local constructed wetland, TalbertMarsh, was a net source of ENT to the surfzone.Moreover, the study identified birds and urban runoffas the most likely sources of FIB, particularly ENT,to the marsh, which in turn acted as a reservoir andsecondary source of ENT to the local surf zone.
The results of the study by Grant et al. (2001)prompted a similar but expanded follow-up study onthe sources and dynamics of fecal indicators in thelower Santa Ana River watershed . As one compo-nent of the larger follow-up study, the objective ofthe research described herein was to use selectedchemical markers for identifying possible sources ofFIB in the lower Santa Ana River watershed, andthus potentially to nearby areas of HuntingtonBeach. Caffeine (CAF) and a suite of fecal steroids,including CHOE (5-cholesten-3β-ol), COP (5β-cholestan-3β-ol), epicoprostanol (eCOP, 5β-cholestan-3β-ol), cholestanol (CHOA, 5α-cholestan-3β-ol), α-cholestanone (aONE, 5α-cholestan-3-one),β-cholestanone (bONE, 5β-cholestan-3-one ),campesterol (CAM, 24-methyl-5-cholesten-3β-ol), β-sitosterol (βSIT, 24-ethyl-5-cholesten-3β-ol), stig-masterol (STIG, 24-ethyl-5,22-cholestadiene-3β-ol),and stigmastanol (STAN, 24-ethyl-5α-cholestan-3β-ol) were selected for investigation. These com-pounds (particularly COP) have been recognized andused as chemical markers of sewage contaminationfor decades (Tabak et al. 1971, Sheldon and Hites1978, Hatcher and McGillivary 1979, Walker et al.1982, Takada and Eganhouse 1998, Maldonado et al.2000, Seigener and Chen 2002). CAF, thought to bea unique marker for sewage effluent (Standley et al.2000, Simpson et al. 2002), is highly water solubleand present primarily in the dissolved phase of aque-ous samples. In contrast, fecal steroids are largehydrophobic molecules that bind readily to suspend-ed particles and sediments, and are thus suitable forsource tracking in solid samples.
The present study focused on the use of steroidratios, instead of individual steroid concentrations, toelucidate source information, because several previ-ous studies have shown the utility of measuring asuite of C27 - C29 sterols, stanols, and stanones for
source tracking of fecal contamination (Venkatesanand Santiago 1989, Grimalt et al. 1990, Leeming et
al. 1996, Standley et al. 2000). Use of individualsteroids in source tracking may lead to erroneousconclusions because fecal steroids are not necessarilyof anthropogenic origin. These compounds also areproduced in the digestive tract of many higher ani-mals, including birds, and both land and marinemammals (Venkatesan et al. 1986, Venkatesan andSantiago 1989, Leeming et al. 1996, Standley et al.2000). In addition, COP and other 5a and 5b stanolscan be produced by diagenetic processes in anoxicsediments (Grimalt et al. 1990). Finally, to facilitatethe interpretation of fecal steroid data, turbidity,chlorophyll, total suspended solids, TC, EC, andENT were also measured concurrently with theselected chemical markers.
METHODSSample Collection
Three locations in the Santa Ana River (SAR)estuary were sampled during June and July of 2001.One station was located just below and west of thePacific Coast Highway bridge (W2), and the twoother stations were located at the entrance of twoisolated sloughs, a lower slough (W4) and an upperslough (W5) that are subject to tidal fluxes of seawa-ter (Figure 1). Six sampling excursions were con-ducted within the time frame encompassing twospring-neap tidal transitions. During each excursion,three samples were collected from each station atdifferent tidal stages, i.e., near the end of the floodtide, the beginning of the ebb, and the base of theebb or slack period (Figure 2). Overall, 54 ~18 Lsamples were collected by a field crew using multi-ple grabs with a stainless steel bucket and pouredinto pre-cleaned five gallon glass bottles. All glassbottles were cleaned just prior to sampling using alaboratory glassware detergent, washed with ~4 Mnitric acid, and rinsed with ultra-pure water and ana-lytical grade methanol. One bottle was filled withultra-pure water in the laboratory, and carried alongwith the field crew during sampling as a field blank.Samples were returned to the laboratory and storedat 4°C until filtered.
Sample ExtractionAll the SAR samples were filtered within 24 h of
collection with acid washed and combusted 142 mmdiameter (0.7 µm pore size) pure glass TCLP filters,using a nitrogen (chromatographic grade) pressurizedfiltration system. Filtrates were collected in 4 L
Chemical Markers - 305

Chemical Markers - 306
amber glass bottles and stored at 4°C until extracted.Only 4 L of each filtrate sample (five gallons) wereretained, and the remaining filtrate was discarded.Filtrate samples were extracted and analyzed as soonas possible, but always within 24 h after filtration.In contrast, filters containing suspended solids wereplaced in individual glass jars withTeflon®-lined closures, and storedfrozen (-20°C) for up to one year untilanalyzed. Thus, the filtrate sampleswere analyzed in the order they werereceived from the field, whereas thefilters were pulled from the freezer inno particular order for analysis. Thismode of processing had the effect ofrandomizing the order in which thesuspended solid samples were ana-lyzed, and thus presumably mitigatingany temporal bias in the analyticalresults.
Each filtrate sample (4 L) wasextracted using 90 mm Empore C18
solid-phase extraction (SPE) disks, fol-lowing the procedure of Standley et al.(2000). Loaded filters were dried inindividual glass desiccators afterCapangpangan et al. (1996), weighed,
and extracted using supercritical fluid extraction(SFE). The suspended solids concentration wascalculated from the filter mass difference and thesample volume. The SFE extractor consisted ofa 10 mL stainless steel extraction cartridge, lay-ered from the bottom with a glass fiber filter,about 2 mm of granular copper (20-30 mesh),and the dried filter containing suspended parti-cles. The extraction was performed using anSFX-220 Supercritical Fluid Extraction System(ISCO, Lincoln, NE) with heated restrictors.Just prior to extraction, samples were spikedwith 5 mL of a 1.0 ppm recovery surrogate solu-tion (androstanol, 5α-androstan-3β-ol) and 300mL of acetone as a polarity modifier. Sampleswere subject to a 10-min static extraction, fol-lowed by a 30 mL dynamic extraction, at 80°Cand 365 atm, with the restrictors at 100°C, andmethylene chloride solvent collection.
Instrumental AnalysisThe SPE and SFE extracts were spiked with
cholesterol-d6 (Cambridge Isotope Laboratories,
Andover, MA) as an internal standard, taken todryness under a nitrogen stream. The residue
was then derivatized for 10 min at 70°C in 0.1 mL ofN-methyl-N-trimethylsilyltrifluoroacetamide with 1% trimethylchlorosilane (MSTFA +1 % TMCS,Pierce, Rockford, IL). The derivatized extracts wereimmediately analyzed for caffeine (dissolved phaseonly) and steroids on a Varian 3800 gas chromato-
Figure 2. Sampling intervals relative to the daily and fortnightly tidalcycles. The dates of the full moon ( ) and the new moon ( ) are soindicated. Samples were collected from all three stations, W2 (SantaAna River), W4 (lower slough), and W5 (upper slough) at each interval.
Figure 1. Map of field area near the mouth of the SantaAna River, California, indicating the locations of chemicalmarker sampling stations.

graph with a Saturn 2000 ion trap mass spectrometer(Varian Inc., Walnut Creek, CA). Chromatographicseparation was provided by a 60 m Χ 0.32 mm i.d.(0.25 µm film thickness) DB-XLB column (J&WScientific, Folsom, CA), temperature-programmedfrom 60°C (held for 0.5 min) to 320°C (held for 15min) at a rate of 20°C /min. Ultra-high-purity heli-um was used as carrier gas at a constant flow of 1.3mL/min. Split/splitless injection was programmed asfollows: 1:50 for 0.01 min; off for 5 min; and 1:50afterwards. The mass spectrometer was operated atthe electron ionization mode with 50 µamps of emis-sion current, and spectra were scanned from 50 to500 m/z at an ionization storage level of 35 m/z andan ionization time factor of 100%.
Analytical PerformancePreliminary experiments were conducted to eval-
uate the analytical methods. CAF and steroid stan-dards were spiked into 4 L samples of ultrapurewater at 25 ng/L, and extracted with SPE disks usingthe procedure described above. The recoveries forCAF ranged from 72% – 120% (n = 6) with an aver-age recovery of 97 ± 17%. The average recovery forthe entire suite of steroids (n = 6) was 108 ± 11%.The performance for actual sample analysis wasmonitored by using a recovery surrogate, androstanol(5α-androstan-3β-ol). Recoveries of androstanolfrom the dissolved phase sample analyses, includingfield blanks and duplicates (n = 63), ranged from64.3 – 139 % with a mean recovery of 91 ± 13%.
During the interim period between analysis ofthe dissolved and particulate phase samples, experi-ments were conducted to determine the optimumconditions for SFE of the particle-laden filters. SFEperformance was optimized using both a spiked inertmaterial, reagent grade Celite 545-AW (Supelco Inc.,Bellefonte, PA), and also a reference sediment,IAEA-408, which had certified concentrations for sixof the sterol target analytes (IAEA, Vienna, Austria).Again, SFE recoveries in the actual sample analyseswere monitored using androstanol as a recovery sur-rogate. Recoveries for all the SFE filter extractions(n = 68) ranged from 44 – 152%, with a mean of 89± 24%. Because this study focused primarily onsteroid ratios, none of the data presented herein wereadjusted for recoveries.
The lowest concentration calibration stan-dard for all analyses was 0.1 mg/L, which corre-sponds to a minimum quantitation limit (MQL) of~2.5 ng/L for the dissolved phase samples. Thereporting limit for the particle phase was dependent
on the sample mass, which varied significantly.However, for the average suspended solids samplemass of 320 mg, the corresponding MQL would be~30 ng/g.
Analysis of Potential Source SamplesSamples of both untreated raw sewage and treat-
ed wastewater were obtained from the OCSD thatdischarges treated wastewater via a sewage outfall tothe coastal ocean off Huntington Beach, CA. In-situtreated effluent samples were collected from the out-fall plume using a CTD-Rosette Sampler (Sea BirdElectronics, Bellevue, WA). The raw sewage wasdiluted 1:10 with deionized water and the treatedeffluent was analyzed as received, both of whichwere stored at 4 °C and analyzed within 24 h ofreceipt. In addition, samples of fresh (i.e., still wet)bird feces was collected from the field area, com-bined into a single composite sample, and keptfrozen until analyzed. For analysis, a small aliquotof thawed bird feces (~22 mg) was dissolved in 1 Lof distilled water. All samples were processed bySPE and analyzed as described above.
Microbiological and Water Quality AnalysesSamples were collected hourly at each sampling
station by the University of California-Irvine (UCI)field crews and transported to the UCI laboratorywithin 6 h. Samples (~20 mL) were immediatelyanalyzed for TC, EC, and ENT using the Colilert®and Enterolert™ defined substrate tests (IDEXXLaboratories, Westbrook, ME). For turbidity, 60 mLsamples were analyzed using a DRT-15CE PortableTurbidimeter (HF Scientific, Toronto, Canada).Stations W4 and W5 were also outfitted with waterquality sondes, YSI Model 6900XL, that estimatedchlorophyll concentration from in-situ measurementsof fluorescence (YSI, Inc., Yellow Springs, OH).
Data EvaluationThree types of data analysis were used to evalu-
ate the chemical marker data. First, steroid ratios,such as the percentage of COP (COP/Σsteroids), thesum of COP and eCOP relative to total steroids((COP+eCOP)/Σsteroids), and the ratios of the 5b to5a epimers for the stanols and stanones, i.e.,COP/(COP+CHOA) and bONE/(aONE+bONE)were calculated. Because COP has been identifiedas a major component of fecal steroids in sewagecontaminated samples, values of COP/Σsteroids and(COP+eCOP)/Σsteroids may be proportional to theextent of sewage contamination. In addition,
Chemical Markers - 307

Grimalt et al. (1990) found that plottingCOP/(COP+CHOA) against bONE/(aONE+bONE)provided a unique method for distinguishing betweensewage and non-sewage derived pollution in com-plex environmental systems. They found that stanoland stanone ratios greater than 0.7 implied an in vivoproduction of COP, and thus were indicative ofsewage pollution.
Second, selected individual and grouped chemi-cal marker ratios and concentrations were comparedgraphically with the contemporaneous FIB data.Finally, multivariate statistical methods were used inorder to quantify the relationships between the chem-ical marker and FIB data. The data analyses includ-ed cluster analysis and Pearson product moment cor-relation analysis performed using MINITAB Release13.32 (Minitab, State College, PA). Pearson correla-tion values were calculated for the relationshipbetween two different sums of steroids and the FIB.
RESULTSDistribution of Chemical Markers
The target chemical marker compounds werewidely distributed in the samples analyzed, with allbut eCOP detected in either the particulate or dis-solved phase of at least 42 out of 54 SAR samples(Table 1). CHOE was the most ubiquitous and abun-dant of the steroids, the only analyte detected in allthe samples from both the particulate and dissolvedphases, and its concentrations were substantiallyhigher than all other analytes. CHOA, bSIT, STIG,and STAN were also detectable in almost all thesamples (from either particulate or dissolved phase).Conversely, CAF was detected only in the dissolvedphase, and eCOP was detected only in the particulatephase. Note that CAM was added as a target ana-lyte for the particulate phase.
The distribution data in Table 1 allowed us tocalculate the ratios of analyte concentrations in theparticulate (Cp) to the dissolved phase (Cw) over a
range of suspended solid concentrations from 19 to71 mg/L. The log-transformed ratios of Cp/Cw for all
appropriate steroids were fairly invariant, as indicat-ed by the small standard deviations and 95% confi-dence intervals relative to the mean values (Table 2).These results were used to evaluate the quality andvariability of the data.
Steroid RatiosThe average COP/åsteroids values in suspected
sources and SAR samples exhibited several interest-ing features (Figure 3). First, both the particulateand dissolved phase samples had COP/Σsteroidsratios that were markedly lower than either rawsewage or treated effluent samples from the OCSD.Second, the average COP/Σsteroids ratio in the par-ticulate samples was comparable to that of seagullfeces and slightly lower than that of duck fecesreported in the literature (Leeming et al. 1996).Finally, all the field samples had higher relative COPcontents than the bird fecal sample collected at thefield area.
Ratios of (COP+eCOP)/Σsteroids and suspendedsolids in all SAR samples were plotted as a functionof date, station, and diurnal tidal cycle (Figure 4).The highest (COP+eCOP)/Σsteroids ratios occurredtoward the end of the ebb tides (i.e., slack).Moreover, there was no apparent correlation betweenthe (COP+eCOP)/Σsteroids ratios and concentrationsof suspended solids.
The 5β/(5α +5β) ratios for the SAR samples(both the particulate and dissolved phases) and sus-pected sources were calculated and plotted as stanolsand stanones (Figure 5A). Suspected sources inves-tigated included OCSD raw sewage and treatedeffluent, offshore OCSD outfall plume (Station 2205,35 m depth), and SAR bird feces. Ratios for sam-ples collected from the offshore OCSD outfall plumewere identical to those for raw sewage. All of thesewage related samples were found to plot in theupper right corner of the graph (i.e., > 0.7 for boththe stanol and stanone ratios). This result is inagreement with several other studies that have usedthese parameters for source identification, whichfound that sewage samples typically are very nearunity for both ratios (Grimalt et al. 1990). In con-trast, the SAR samples are spread across the bottomof the graph, and covering the full range of possiblevalues from 0 to 1. All SAR samples were below0.7 for the stanol ratio, and all but eight sampleswere below 0.7 for the stanone ratio. The bird fecalsample collected from the SAR field area plottedvery near the origin, and thus the local birds areclearly differentiated from the sewage sources offecal contamination.
The ratios for the particulate phase of the SARsamples in Figure 5A were expanded to explore thepossible reasons for the range of stanone ratiosobserved. The data do not exhibit any type of pat-tern related to the station location (Figure 5B) or
Chemical Markers - 308

Chemical Markers - 309
diurnal tidal stage (Figure 5C), but do show a patternrelated to the lunar tidal cycle (Figure 5D). Thestanone ratio was generally higher during the neaptides and decreased during the spring tide. However,the pattern broke down on the second spring tide ofthe study period (Figure 5D), which raises concernsas to whether the previously observed pattern wasindicative of an actual environmental process.
Comparison of Fecal Indicator Bacterial andChemical Marker Data
A comparison of the FIB data with severalchemical marker ratios and concentrations was per-
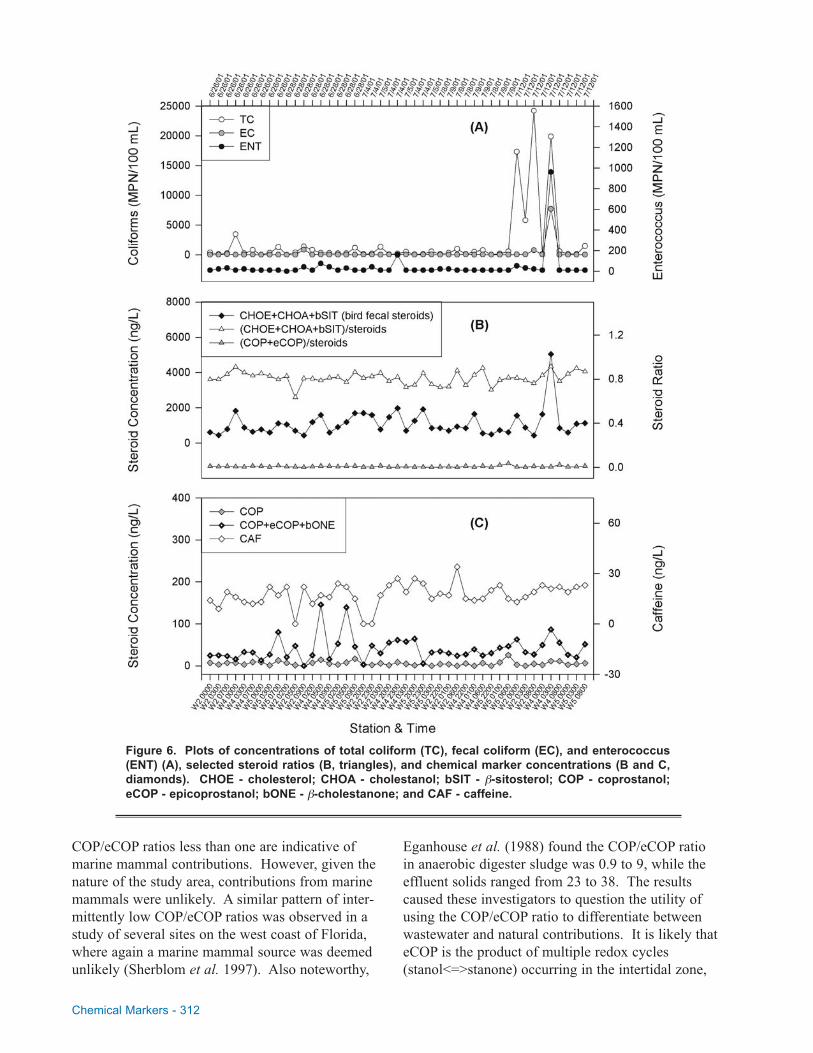
formed (Figure 6). Over the timeframe ofthe study, there was only a single samplinginterval when there was a large spike in allthree FIB (Figure 6A). Of all the possiblechemical marker parameters, only the sumof the most abundant sterols in bird feces,primarily CHOE, showed a comparablespike in the data (Figure 6B).Interestingly, the concentrations of COPand CAF, presumably more traceable tosewage contamination than the othermarker compounds, did not exhibit anycomparable spike (Figure 6C). Therewere three large spikes in the TC towardthe end of the study period (Figure 6A),the second of which was coincidental witha large spike in the turbidity data (notshown). However, the turbidity data werefound to more significantly correlated with
sewage steroid data than the FIB data, as identifiedby the cluster analysis presented below.
It is noteworthy that the most probable number(MPN) of colony forming units (CFU) per 100 mLof sample for TC, EC, and ENT were mostly belowthe single sample (10,000, 400, and 104 CFU,respectively) and 30-d geometric mean (1000, 200,or 35 CFU, respectively) water quality standards(Grant et al. 2001) over the duration of the study.There was only one instance where all three indica-tors were above their respective standards simultane-ously (station W4, 0300 h, 7/12/01).
Table 1. Distribution of the target chemical marker compounds in 54 Santa Ana River samples analyzed.
Table 2. Quantitative evaluation of the partitioning behavior ofselected steroid compounds, as characterized by log (Cp/Cw)with Cp and Cw being the concentrations in the particulate anddissolved phases, respectively.
α
β
β
αββ
Σ
µ µ

Chemical Markers - 310
Figure 4. Ratios of sum of coprostanol andepicoprostanol to total steroids, (COP+eCOP)/Σsteroids, and suspended solids (> 0.7 µm) dataplotted as a function of date, station, and diurnaltidal stage.
Statistical AnalysesThe dendrograms produced by the cluster analy-
ses show the degree of similarity among the parame-ters included in the analysis (Figure 7). In general,all of the parameters exhibited a high degree of simi-larity (>67%). Even so, higher levels of similarityamong certain groups of parameters are readilyapparent. For example, COP, eCOP, and bONE, areclosely clustered (Figure 7, top), consistent with theperception that these steroids are sewage derived.Perhaps the most interesting result of this analysis isthe observation that the FIB data do not cluster withthe sewage steroids (i.e., COP, eCOP, and bONE).Rather, the FIB group most closely with CHOE, andthen with the plant sterols bSIT and STIG (Figure 7,bottom). Other interesting results were that COPpaired with turbidity (Figure 7, bottom), and thatCAF was on an isolated branch of the dendrogram,and did not pair with any of the other parameters(Figure 7, top).
Based on the results of the cluster analyses andthe steroid composition of potential sources, twogroupings of steroids were selected as additionalparameters for the statistical analysis. One group ofsewage related steroids, COP+eCOP+bONE (sum1),and another group of bird fecal steroids,CHOE+CHOA+ bSIT (sum2). The bird steroidswere the three most abundant steroids measured inthe bird feces sample. These two sums were evaluat-ed relative to the FIB data (log transformed prior toanalysis) using Pearson Product Moment CorrelationAnalysis. There were significantly moderate correla-tions between log EC (r = 0.536, p < 0.001), logENT (r = 0.637, with p < 0.001) and sum2. A some-what lower correlation was found between log ENT(r = 0.398, p < 0.01) and sum1. Considering the cor-relation between log TC and log EC (r = 0.553, p <0.001), the strengths of these correlations are notnegligible. Interestingly, COP did not generate anysignificant correlations with the FIB data.
DISCUSSIONSource Assessment for Fecal Steroids
The ratios of the 5β/(5α +5β)) stanols andstanones clearly showed that the SAR samples didnot have the steroid profile typical of raw sewage,treated effluent or the OCSD outfall plume (Figure5A). These ratios are effective in differentiatingbetween potential sources because they provideinformation about the relative contributions of two
Figure 3. Ratios of coprostanol/total steroids(COP/Σsteroids) in suspected sources and fieldsamples. Those sources marked with an asterisk(*) are from the literature. Error bars are the 95%confidence intervals (n = 54).

Chemical Markers - 311
different production pathways for the 5α and 5βstanols. The stanols are produced in vivo by trans-formation of CHOE to a cholestenone, and then to5α or 5β cholestanone, followed by reduction toCOP or CHOA (Grimalt et al. 1990, Takada andEganhouse 1998). In contrast, in-situ formation ofstanols in anaerobic sediments occurs by directreduction of the 5-6 double bond of CHOE. Sincethe 5α epimer is thermodynamically more stable, itsformation is favored by the by in-situ reduction. In
humans and some marine mammals, forma-tion of the 5β epimer is highly favored(Venkatesan and Santiago 1989). Hence,the ability to distinguish between sources isa function of the ability to determine therelative contributions from in-vivo and in-situ production of the fecal steroids.However, it has been shown that CHOA canbe produced biogenically by a number ofaerobic organisms, such as phytoplankton,zooplankton, and macrophytes (Grimalt etal. 1990). Therefore, in areas of high pro-ductivity, the utility of the stanol ratio maybe reduced. Since the equivalent stanoneratio would not be affected by the biogenicproduction of the 5α stanol, Grimalt et al.(1990) suggested that it be used as a com-plimentary parameter for distinguishingsewage pollution from other sources offecal steroids.
The low stanol ratios for the SAR sam-ples (Figure 5) implied an in-situ origin forthe fecal steroids detected in this study.However, the significant variability in thestanone ratio may suggest at least some invivo contribution to the fecal steroid pool.Another possibility is that low levels of dia-genetically produced coprostanol couldbecome suspended during vigorous tidalflows, and then oxidized under aerobic con-ditions back to the stanone. Laboratoryincubation experiments using radiolabeledcompounds have demonstrated that inter-conversion of stanols and stanones doesoccur (Grimalt et al. 1990). In addition, theavailable fate data on COP in natural waterssuggests that its half-life is less than 10 dunder aerobic conditions (Takada andEganhouse 1998). The fact that COP,eCOP, and bONE correlate with turbidity(Figure 6, bottom) also supports the idea of
an in-situ diagenetic source for these steroids.Another aspect of the data is the relatively high
levels of eCOP that occurred intermittently over theduration of the study (Table 1). COP/eCOP ratiosderived from Table 1 varied from 0.88 to infinity(i.e., eCOP = 0). The measured levels of eCOP weresurprising since it is known to be only a trace com-ponent of sewage steroids, and was not observed inany significant amount in any of the potentialsources. Venkatesan and Santiago (1989) found that
Figure 5. Ratios of 5β/(5α + 5β) stanols versus stanones in sam-ples from the Santa Ana River and selected potential fecalsources (A), where ratios above 0.7 on one or both axes are typ-ical for sewage sources (dashed lines), and in particulate sam-ples from the Santa Ana River, plotted by sampling station (B),diurnal tidal cycle (C), and lunar tidal cycle (D).
Chemical Markers - 312
COP/eCOP ratios less than one are indicative ofmarine mammal contributions. However, given thenature of the study area, contributions from marinemammals were unlikely. A similar pattern of inter-mittently low COP/eCOP ratios was observed in astudy of several sites on the west coast of Florida,where again a marine mammal source was deemedunlikely (Sherblom et al. 1997). Also noteworthy,
Eganhouse et al. (1988) found the COP/eCOP ratioin anaerobic digester sludge was 0.9 to 9, while theeffluent solids ranged from 23 to 38. The resultscaused these investigators to question the utility ofusing the COP/eCOP ratio to differentiate betweenwastewater and natural contributions. It is likely thateCOP is the product of multiple redox cycles(stanol<=>stanone) occurring in the intertidal zone,
Figure 6. Plots of concentrations of total coliform (TC), fecal coliform (EC), and enterococcus(ENT) (A), selected steroid ratios (B, triangles), and chemical marker concentrations (B and C,diamonds). CHOE - cholesterol; CHOA - cholestanol; bSIT - β-sitosterol; COP - coprostanol;eCOP - epicoprostanol; bONE - β-cholestanone; and CAF - caffeine.

which is also consistent with our hypothesis on theformation of bONE. However, very little is knownabout the stability and reactions of these compoundsunder various redox conditions, and further experi-mental work would be necessary to verify thishypothesis.
Additional Evidence for Non-Sewage Sources ofFecal Steroids
Several additional pieces of evidence are presentin the fecal steroid data that support the hypothesisthat the fecal steroids in the study area are primarilyof non-sewage origin. First, there is the agreementof the chemical marker data obtained in this studywith previous studies in similar environmental set-tings. For example, Venkatesan and Kaplan (1990)found that in Santa Monica Bay, California, COPcomprised 50-80% of the total steroids near sewageoutfalls, but dropped to about 3% at stations distantfrom the source. Also, Phillips et al. (1997) con-ducted a study in 1994 which measured fecal
steroids in sediments at two locations in the SantaAna River and one location in Talbert Marsh. Thatstudy found sediment COP concentrations of 67 to380 ng/g, which are comparable to our data for thesuspended solids phase, which ranged from belowdetection to 487 ng/g (Table 1). These data suggestthat the local sediments may be the source of thesuspended solids, and that the COP content of thesediments has not changed significantly since 1994.
Additional evidence can be drawn from an esti-mate of the equilibrium state of the system can bemade using the steroid partitioning data (Table 2).Since the organic carbon content of the particulatephase was not determined, a nominal value of 1%was assumed for this assessment. Takada andEganhouse (1998) estimated the log octanol-waterpartition coefficient (log Kow) for COP to be 6.5 to
7.5 from the water solubility of CHOE. Assumingthat the organic carbon-normalized partition coeffi-cient (Koc) is approximated by Koc = 0.41 Kow
(Mackay et al. 1992), then the log (Cp/Cw) for the
steroids would be about 4.11 to 5.11 at equilibrium.This is in general agreement with the measured aver-age values from this study, which ranged from 4.04(±0.39) to 5.30 (±0.37) (Table 2). These resultsimply that the system appears to be at approximateequilibrium between the dissolved and particulatephases, which suggests that the suspended solids andthe associated fecal steroids detected in this studymay have been derived from tidal scouring andresuspension of local bottom sediments rather thanfrom an offshore source.
Among the parameters examined, only thesummed concentration of the three most abundantsterols found in the bird feces collected at the fieldarea was found to coincide with the single high FIBevent (Figure 6B). The simultaneous sharp increasein bird fecal steroid and FIB concentrations is con-sistent with a previously reported hypothesis thatbirds may be a possible source of FIB to the water-shed (Grant et al. 2001).
It should be noted that birds are not the onlypossible source of the FIB based on the fecal steroiddata. Interestingly, dogs have fecal steroid composi-tion very similar to that of birds (Leeming et al.1997). In order to distinguish between these poten-tial FIB sources, Leeming et al. (1997) used the ratioof fecal coliforms to Clostridium perfringens. Thefeces from birds and humans have virtually no C.perfringens spores (<0.01%), whereas domestic pets(dogs and cats) contain nearly equal amounts of both
Chemical Markers - 313
Figure 7. Dendrograms produced from cluster analy-sis of total steroid concentration data (top), and sameanalysis with the addition of total coliform (TC), fecalcoliform (EC), enterococcus (ENT), chlorophyll(Chloroph), and turbidity (Turb) data (bottom).

C. perfringens and fecal coliforms. Thus, this addi-tional analysis could potentially be used in futurestudies to distinguish between FIB contributed bybirds and domestic pets.
LITERATURE CITEDAssembly, C.S. 1997-1998. AB 411, Chapter 765,California State Assembly Bill 411: Beach Sanitation andPosting.
Boehm, A.B., S.B. Grant, J.H. Kim, S.L. Mowbray, C.D.McGee, C.D. Clark, D.M. Foley and D.E. Wellman. 2002.Decadal and shorter period variability of surf zone waterquality at Huntington Beach, California. EnvironmentalScience and Technology 36: 3885-3892.
Boehm, A.B., B.F. Sanders and C.D. Winant. 2002. Cross-shelf transport at Huntington Beach. Implications for thefate of sewage discharged though an offshore ocena out-fall. Environmental Science and Technology 36: 1899-1906.
Capangpangan, M.B., J.A. Noblet and I.H.M. Suffet.1996. Evaluation of selected filters for collection and sub-sequent supercritical fluid extraction of suspended solidsfor trace organic analysis. Journal of Chromatography A273: 279-290.
Eganhouse, R.P., D.P. Olaguer, B.R. Gould and C.S.Phinney. 1988. Use of molecular markers for the detectionof municipal sewage sludge at sea. Marine EnvironmentalResearch 25: 1-22.
Grant, S.B., B.F. Sanders, A.B. Boehm, F. Arega, S.Ensari, R. Mrse, H.-Y. Kang, R. Reeves, J.H. Kim, J.Redman, S. Jiang, W. Chu, S. Choi, C. Clark, L. Litz, M.Sutula, J. Noblet, M. Sobsey and C. McGee. 2002.Coastal runoff impact study phase II: Sources anddynamics of fecal indicators in the lower Santa Ana Riverwatershed. University of California, Irvine, California.Irvine, CA.
Grant, S.B., B.F. Sanders, A.B. Boehm, J.A. Redman, J.H.Kim, R.D. Mrse, A.K. Chu, M. Gouldin, C.D. McGee,N.A. Gardiner, B.H. Jones, J. Svejkovsky, G.V. Leipzigand A. Brown. 2001. Generation of enterococci bacteria ina coastal saltwater marsh and its impact on surf zonewater quality. Environmental Science and Technology 35:2407-2416.
Grimalt, J.O., P. Fernandez, J.M. Bayona and J. Albaiges.1990. Assessment of fecal sterols and ketones as indica-tors of urban sewage inputs to coastal waters.Environmental Science and Technology 24: 357-363.
Grimalt, J.O., P. Fernandez, J.M. Bayona and J. Albaiges.1990. Assessment of fecal sterols and ketones as indica-tors of urban sewage inputs to coastal waters.Environmental Science and Technology 24: 357-363.
Hatcher, P.G. and P.A. McGillivary. 1979. Sewage con-tamination in the New York Bight. Coprostanol as an indi-cator. Environmental Science and Technology 13: 1225-1229.
Leeming, R., A. Ball, N. Ashbolt and P. Nichols. 1996.Using faecal sterols from humans and animals to distin-guish faecal pollution in receiving waters. Water Research30: 2893-2900.
Leeming, R., V. Latham, M. Rayner and P. Nichols. 1997.Detecting and distinguishing sources of sewage pollutionin Australian inland and coastal waters and sediments. pp.306-319 in: R.P. Eaganhouse (ed.), Molecular Markers inEnvironmental Geochemistry. American ChemicalSociety, Washington, D.C.
Mackay, D., W.Y. Shiu and K.C. Ma. 1992. IllustratedHandbook of Physical-Chemical Properties andEnvironmental Fate for Organic Chemicals. Volume II.Polynuclear Aromatic Hydrocarbons, PolychlorinatedDioxins, and Dibenzofurans. Lewis Publishers. Chelsea.
Maldonado, C., M.I. Venkatesan, C.R. Phillips and J.M.Bayona. 2000. Distribution of trialkylamines andcoprostanol in San Pedro shelf sedimentsadjacent to asewage outfall. Marine Pollution Bulletin 40: 680-687.
Phillips, C.R., M.I. Venkatesan and R. Bowen. 1997.Interpretations of contaminant sources to San Pedro shelfsediments using molecular markers and principal compo-nents analysis. pp. 242-260 in: R.P. Eaganhouse (ed.),Molecular Markers in Environmental Geochemistry.American Chemical Society, Washington, D.C.
Seigener, R. and R.F. Chen. 2002. Caffeine in BostonHarbor seawater. Marine Pollution Bulletin 44: 383-387.
Sheldon, L.S. and R.A. Hites. 1978. Organic compoundsin the Delaware River. Environmental Science andTechnology 12: 1188-1194.
Sherblom, P.M., M.S. Henry and D. Kelly. 1997.Questions remain in the use of coprostanoland epico-prostanol as domestic waste markers: Examples fromcoastal Florida. pp. 320-331 in: R.P. Eaganhouse (ed.),Molecular Markers in Environmental Chemistry.American Chemical Society, Washington, D.C.
Simpson, J.M., B. Martineau, W.E. Jones and R.I. Mackie.2002. Characterization of fecal bacteria populations in
Chemical Markers - 314

canines: Effects of age breed and dietary fiber. MicrobialEcology 44: 186-197.
Standley, L.J., L.A. Kaplan and D. Smith. 2000.Molecular tracers of organic matter sources to surfacewater resources. Environmental Science and Technology34: 3124-3130.
Tabak, H.H., R.N. Bloomhuff and R.L. Bunch. 1971.Coprostanol: A positive tracerof faecal pollution. pp. 296-307 in: E.D. Murray (ed.), Developments in Industrialmicrobiology, Vol. 13. Society of Industrial Microbiology,Washington D.C.
Takada, H. and R.P. Eganhouse. 1998. Molecular markersof anthropogenic waste. pp. 2883-2940 in: R.A. Meyers(ed.), Encyclopedia of Environmental Analysis andRemediation. John Wiley & Sons, Inc. New York, NY,USA.
Venkatesan, M.I. and I.R. Kaplan. 1990. Sedimentarycoprostanol as an index of sewage addition in SantaMonica Basin, Southern California. EnvironmentalScience and Technology 24: 208-214.
Venkatesan, M.I., E. Ruth and I.R. Kaplan. 1986.Coprostanols in Antarctic marine sediments: A biomarkerfor marine mammals and not human pollution. MarinePollution Bulletin 17: 554-557.
Venkatesan, M.I. and C.A. Santiago. 1989. Sterols inocean sediments: novel tracers to examine habitats ofcetaceans, pinnipeds, penguins and humans. MarineBiology 102: 431-437.
Walker, R.W., C.K. Wun and W. Litsky. 1982.Coprostanol as an indicator of fecal pollution. CRCCritical Reviews in Environmental Control 12: 91-112.
ACKNOWLEDGEMENTSThe authors are grateful to Professor S.B. Grant for
providing the original impetus for this work. Also, wethank D. Tsukada for help in processing the samples, andA. Bolkhovitinov for GC/MS analyses. Lastly, we arevery grateful to all the UCI students who performed thesample collection.
Chemical Markers - 315