use of coal combustion products in mine-filling applications
TRANSCRIPT

USE OF COAL COMBUSTION PRODUCTS IN MINE-FILLING APPLICATIONS: A REVIEW OF AVAILABLE LITERATURE AND CASE STUDIES DOE Award No: 99-CBRC Final Report (November 1999 – March 2005)
Prepared by:
Ishwar P. Murarka
Ish Inc. 804 Salem Woods Drive, Suite 201B
Raleigh, NC 27615-3313
Jim Erickson
GeoTrans Inc. 363 Centennial Parkway
Louisville, CO 80027
October 2006
DISCLAIMER This report was prepared as an account of work sponsored by an Agency of the United States Government. Neither the United States Government nor an agency thereof, nor any of their employees, makes any warranty, express or implied, or assumes any legal liability or responsibility for the accuracy, completeness, or usefulness of any information, apparatus, product, or process disclosed, or represents that its use would not infringe privately owned rights. Reference herein to any specific commercial product, process, or service by trade name, trademark, manufacturer, or otherwise does not necessarily constitute or imply its endorsement recommendation, or favoring by the United States Government or any agency thereof. The views and opinions of authors expressed herein do not necessarily state or reflect those of the United States Government or any agency thereof. ACKNOWLEDGEMENT The authors are grateful for funding for this technical report preparation provided by the following organizations: DOE-CBRC Public Service Company of Colorado American Coal Ash Association (ACAA) McDonald Farms Utility Solid Waste Activities Group (USWAG) Ish Inc. Geo Trans Inc.

i
TABLE OF CONTENTS EXECUTIVE SUMMARY ........................................................................................................... iii 1.0 INTRODUCTION................................................................................................................. 1 1.1 Scope of the Research.................................................................................................. 2 1.2 Report Contents ........................................................................................................... 2 2.0 PHYSICAL AND CHEMICAL COMPOSITION OF CCPs ............................................... 2 2.1 Physical Characteristics ............................................................................................... 2 2.2 Chemical Composition and Leaching Characteristics................................................. 3 2.3 Physical and Hydraulic Characteristics of Mine Spoils .............................................. 3 2.4 Premined Area Water Quality ..................................................................................... 4 2.5 Water Quality in Mined Areas..................................................................................... 4 2.6 CCP Mine Placement Sites.......................................................................................... 4 3.0 GEOCHEMISTRY OF COAL MINE DRAINAGE AND INTERACTIONS WITH CCPs ............................................................................................ 5 3.1 Coal Mine Drainage..................................................................................................... 5 3.2 INTERACTIONS BETWEEN CCPs AND COAL MINE DRAINAGE ................... 5 4.0 CCPs IN COAL MINES ....................................................................................................... 6 4.1 Wyodak Mine (WY) .................................................................................................... 7 4.1.1 Background...................................................................................................... 7 4.1.2 Local Geology ................................................................................................. 7 4.1.3 Local Hydrogeology and Hydrology ............................................................... 8 4.1.4 Ash-Leaching Characteristics.......................................................................... 8 4.1.5 Groundwater Quality ....................................................................................... 9 4.2 Keenesburg Mine (CO).............................................................................................. 11 4.2.1 Local Geology ............................................................................................... 11 4.2.2 Local Hydrology............................................................................................ 12 4.2.3 Ash Chemical Characteristics........................................................................ 12 4.2.4 Groundwater Quality ..................................................................................... 12 4.3 Trapper Mine (CO) .................................................................................................... 13 4.3.1 Hydrogeology ................................................................................................ 14 4.3.2 Ash Chemical Characteristics........................................................................ 15 4.3.3 Groundwater Quality ..................................................................................... 16 4.4 Savage Mine (MT)..................................................................................................... 17 4.4.1 Local Geology ............................................................................................... 18 4.4.2 Local Hydrogeology ...................................................................................... 18 4.4.3 Ash Leaching Characteristics ........................................................................ 19 4.4.4 Groundwater Quality ..................................................................................... 19
Continued . . .

ii
TABLE OF CONTENTS (continued) 4.5 Storm Strip Mine (WV) ............................................................................................. 21 4.6 Universal Mine (IN) .................................................................................................. 22 4.6.1 Hydrogeology ................................................................................................ 23 4.6.2 Chemical Composition of Coal Ash and Leachates ...................................... 23 4.6.3 Water Quality-Monitoring Program .............................................................. 24 4.6.4 Groundwater Quality Results ........................................................................ 25 4.6.5 Surface Water Quality ................................................................................... 27 4.6.6 Summary and Conclusions ............................................................................ 28 4.7 Midwestern Abandoned Mine (IN) ........................................................................... 29 4.8 The Arnold Willis “City” Underground Coal Mine (IN) .......................................... 30 4.9 Harwick Mine Complex (PA).................................................................................... 31 4.9.1 Introduction.................................................................................................... 31 4.9.2 History of Ash Injection in Mine................................................................... 31 4.9.3 Ash Sluicing and Water Pumping of Operations........................................... 31 4.9.4 Coal Ash Characteristics................................................................................ 32 4.9.5 Mine Effluent Characteristics ........................................................................ 32 4.10 Clinton County (PA).................................................................................................. 32 4.11 Big Gorilla Pit (PA) ................................................................................................... 33 4.11.1 Introduction.................................................................................................... 33 4.11.2 Mining and Reclamation................................................................................ 33 4.11.3 Regional Acid Mine Drainage Chemistry ..................................................... 34 4.11.4 Ash Placement and Characterization ............................................................. 34 4.11.5 Chemical Evolution of the Big Gorilla Mine Lake ....................................... 35 4.11.6 Groundwater-Monitoring Well Chemistry .................................................... 37 4.11.7 Conclusions.................................................................................................... 38 4.12 Red Oak Mine (OK) .................................................................................................. 38 4.13 Winding Ridge Demonstration Project at Frazee Mine (MD)................................... 39 4.13.1 Introduction.................................................................................................... 39 4.13.2 Characteristics of Frazee Mine ...................................................................... 39 4.13.3 Geology and Hydrogeology........................................................................... 39 4.13.4 CCP Grout Mix.............................................................................................. 40 4.13.5 Grout Injection............................................................................................... 40 4.13.6 Pre- and Postinjection Monitoring................................................................. 40 4.13.7 Conclusion ..................................................................................................... 41 5.0 REFERENCES.................................................................................................................... 41
iii
USE OF COAL COMBUSTION PRODUCTS IN MINE FILLING APPLICATIONS: A REVIEW OF AVAILABLE LITERATURE AND CASE STUDIES
EXECUTIVE SUMMARY
Background Surface and underground mining combine to produce over 800 million tons of coal annually, and the vast majority of this coal is burned in utility boilers to generate electricity. Combustion of coal in the utility boilers produces coal combustion residues or products (CCPs) in the form of fly ash, bottom ash, boiler slag, and flue gas desulfurization (FGD) sludge. In the year 2003, U.S. electric utilities produced approximately 122 million tons of CCPs. Coal fly ash constituted about 70 million tons, the bottom ash/boiler slag accounted for about another 20 million tons, and the remaining 30.8 million tons was FGD material. Approximately 62% of the CCPs generated are land disposed. About 38% of the fly ash generated was used within cement/concrete/grout, structural fill, waste stabilization/solidification, mining applications, and road base/subbase, accounting for most of the fly ash volume utilized. About 45% of bottom ash was used mostly in structural fills, road base, snow and ice control, mining application, and cement/raw feed for clinkers. About 96% of the boiler slag was utilized mostly for blasting grit and roofing granules. About 70% gypsum was used mostly for wallboard production. FGD material generated by wet scrubbers was utilized only about 2.75% and dry scrubber-generated FGD material accounted for about 13.5% use.
Use of CCPs in Mines CCPs possess several physical and chemical properties/characteristics that are beneficial both from environmental and economic standpoints. Mine reclamation represents a potential beneficial use of CCPs that has been receiving increased attention in recent years. Coal mining operations have produced both open pits and deep underground cavities that can be filled by CCPs. Placement of CCPs into deep mines can provide structural support to abate subsidence, and placement of CCPs in surface mines or other open pits can aid in restoring mined land to beneficial use. The use of CCPs as mine backfill may provide the additional potential benefit of limiting impacts of acid mine drainage (AMD). Many CCPs are alkaline materials that can neutralize acidic groundwater and/or inhibit production of acid. Placement of CCPs also may reduce the permeability of mine strata and divert water away from acid-generating materials. Although CCPs possess several beneficial physical and chemical properties, there are concerns from regulators and environmental groups regarding potential for release of toxic chemicals in the leachates from the CCPs. Therefore, scientifically sound information is needed so that environmental concerns can be adequately and reliably identified and addressed.
CBRC and Cofunders Ish Inc. and GeoTrans, Inc., were selected by the Combustion Byproducts Research Consortium (CBRC) to conduct research that will compile and synthesize information from several case studies involving CCP usage for mine applications for dissemination to inform regulators,
iv
environmental interest groups, and the generators of CCPs about the benefits and impacts of CCP use for mine filling. CBRC provided funding for this research project, with additional cofunding by the Public Service Co. of Colorado, McDonald Farms, American Coal Ash Association, Utility Solid Waste Activities Group, GeoTrans, Inc., and Ish Inc.
Report Content and Results of Literature Search This report contains information gleaned from literature on chemical and physical characteristics of CCPs produced in the United States along with some information on mine spoil material. This report also contains background information on coal mines and a brief discussion of the geochemistry of coal mines particularly to describe the formation of AMD. A summary of available data on water quality characteristics of mined areas is presented. A brief description of the geochemical interactions between the AMD water and CCPs is also presented in this report. A summary list is presented of mine sites where CCPs are being utilized for filling the mined land and/or for abating AMD conditions. Beneficial use of CCPs for coal mine reclamation occurs in varying degrees across the United States. Injection of CCPs into deep mines has been performed to provide structural support for subsidence abatement, and placement of CCPs in surface mines has been utilized to reclaim mined land to original grade and to mitigate AMD. Such practices have been employed at both active and abandoned coal mines. Several surface and deep mines in the midwestern and western United States that have utilized CCPs for reclamation are identified in this report. These mines include the Keenesburg and Trapper Mines (CO); Wyodak, Glen Rock, and Rock Springs Mines (WY); Midwestern Abandoned Mine and Arnold Willis City Mine (IN); Big Gorilla Pit (PA); Winding Ridge Frazee Mine (MD); Savage Mine (MT); and Universal Mine (IN). Active mining operations continue to occur at the Trapper, Wyodak, and Savage Mines. Types of CCPs placed at these mines include fly ash, bottom ash, and FGD materials. Thirteen mines were selected based on availability of site-specific data required to perform a reasonable evaluation of the benefits and impacts of CCP placement on groundwater quality. Tables and graphs are included, when available, to illustrate important aspects of each case study. These case studies represent a large range of CCP uses from filling of mine pits to using CCP grout mix to minimizing/eliminating acid mine drainage. A brief summary of each case study follows:
1. Placement of fly ash, bottom ash, and scrubber ash in mined areas at Wyodak Mine began in 1978. Approximately 5,000,000 yd3 of ash has been placed in 13 separate pits. Results indicate that the average groundwater quality throughout the Wyodak site compares favorably with the Wyoming Department of Environmental Quality (DEQ) Class III (livestock use) standard. Mean concentrations for all of the measured constituents in wells are at or below Class III standards.

v
2. Reclamation at the Keenesburg site is being performed using fly ash and bottom ash derived primarily from combustion of Keenesburg coal. Ash was placed at least 5 feet above the premining groundwater table, and reclamation includes placement of a vegetative final cover consisting of at least 5 feet of compacted overburden and 3 feet of topsoil material. Upon comparison of water quality in upgradient versus downgradient wells and for sampling events prior to ash placement (1978–1986) relative to sampling events following ash placement (1988–2000), there is little evidence indicating that elevated levels of regulated constituents in site groundwater are a direct result of leaching from the ash.
3. Trapper Mine is a surface coal mine located approximately 6 miles south of Craig,
Colorado. Trapper Mine began operation in 1977 and produces up to 2.8 million tons of coal annually. Deposition of CCPs in the mined out areas of A Pit began in 1984. Trapper Mine has managed approximately 390,000 tons of CCPs per year since 1984 with total disposal quantities approaching 7 million tons to date. Current ash placement practices involve deposition of sufficient overburden material into the pit bottom such that the ash is placed above the expected postmining groundwater table. Overburden materials are placed above the ash and revegetated as part of the final reclamation plan. Comparison of the historic groundwater concentration data with Colorado standards indicates little or no evidence of groundwater impacts associated with most of the analyzed constituents.
4. Savage Mine has been in operation since 1958 as a surface lignite mine and currently
produces 250,000 tons of lignite annually. Savage Mine began utilizing fly ash and bottom ash as backfill in 1987. The annual volume of ash received by the Savage Mine is variable and dependent upon the amount of coal burned by Holly Sugar in relation to the quantity of sugar beets processed. The estimated cumulative volume of ash placed between 1987 and 2000 is approximately 130,000 cubic yards.
5. The Mount Storm case study is about placement of coal ash in an active coal strip
mine. The downgradient groundwater-monitoring data reveal no evidence of contamination over the 10-year period of operation. Coal ash (both bottom ash and fly ash) is being placed at a rate of about 800,000 tons annually in an active strip mine near an electric power plant in West Virginia. The strip mine provides coal for the power plant and is located on the plant property. Ash placement began in 1987. No ash has been placed below the water table because the groundwater table is deeper than the mine floor.
6. In 1988, PSI Energy, Inc. (now Cinergy Corporation) acquired a portion of the
Universal Mine site containing the final cut pit for the express purpose of coal ash deposition and surface mine reclamation. Indiana Department of Natural Resources (DNR) issued a permit to PSI Energy to dispose of fly ash/bottom ash from its nearby Wabash River Station to fill and reclaim the mine pit. Between April 1989 and the end of October 2001, Cinergy placed approximately 1.6 million tons of coal ash from a nearby power plant to completely fill the open pit. The monitoring data to date indicate that the alkaline coal ash leachate has been effective in improving AMD water
vi
quality that was present at the site. The coal ash leachate neutralized the acidic pH, increased alkalinity, essentially eliminated acidity, and significantly decreased manganese, iron, and sulfate concentrations. There were no indications of any other trace metal migration via the mine seep. However, the coal ash leachate did significantly increase boron concentrations in the mine seep water.
7. The Midwestern Abandoned Mine is a case study where a state agency elected to
place CCPs with a Poz-O-Tec (a mixture of FGD sludge, fly ash, and quicklime) cap, which resulted in reduced infiltration and improvement in water quality by neutralization. The Midwestern Abandoned Mine consists of approximately 550 acres of previously mined land, which in some instances intersects with abandoned deep mining of the same coal seam. Based on the monitoring results, Branam et al. (1999) it was concluded that using CCPs to reclaim the Midwestern Abandoned Mine has resulted in the reduction of AMD leaving the site. This response is ascribed to the reduction in vertical recharge of oxygenated water by the fixated scrubber sludge cap and the neutralization provided by the alkaline CCPs.
8. The Arnold Willis City Underground Coal Mine in Indiana is an example in which
fixated scrubber sludge (FSS) has been successfully injected into an abandoned underground coal Mine for stabilization by filling mine voids. Groundwater-monitoring data indicated that trace metals and sulfide remained unaffected by the placement of FSS. An FSS grout consisting of a mixture of FGD scrubber sludge, fly ash, lime, and water was developed for injection into the abandoned deep mine to abate surface subsidence and reduce acid mine drainage. A total of 12,502 m3 of FSS was injected over an 8-week period, resulting in filling of about 5 acres of the mine.
9. The Harwick Mine Complex includes the Monarch, Old Harwick and Cornell Mines
covering approximately 7000 acres. This coal mine is a deep mine and was operated from about 1932 through 1970. The mine disposal operation consists of a wet ash-handling system to pump 10% solids slurry for a distance of approximately 8000 ft to two operating injection boreholes at the Harwick Mine Complex. Approximately 3 to 4 million gallons per day of the slurry is conveyed. Approximately 150,000 tons of coal ash is injected annually into the mine along with millions of gallons of water. The water quality data from samples of the mine water indicate no adverse effect on the water in the Harwick Mine Complex.
10. The Clinton County, Pennsylvania, Mine provides an example of the placement of
fluidized-bed combustor (FBC) ash in a closed surface coal mine resulting in beneficial effects on water quality because of the favorable geochemistry that occurs. The alkaline FBC ash neutralizes the acidic AMD waters, resulting in precipitous decreases in arsenic, cadmium, and aluminum concentrations as a result of lower solubility and precipitation of solids. Results indicate that the injection of grout caused a temporary increase in pH from about 2.3 to about 9 as the alkaline FBC ash neutralized the acidic AMD waters. However, within a short time the pH again became acidic, with sulfate and aluminum returning to the pregrouting concentrations, although arsenic and cadmium remained at much lower levels.
vii
11. In eastern Pennsylvania, there are several preact stripping pits in the middle of an anthracite coal basin where active strip and deep mining for coal was practiced since the 1800s. The strip mined pit known as Big Gorilla was one such location. The Pennsylvania Department of Environmental Protection’s Regional Mining office in conjunction with the Wilkes-Barre Regional office issued a demonstration permit for the placement of cogeneration-derived dry fly and bottom ash into standing water in the Big Gorilla Pit. Ash deposition has taken place since August 1997. Over 3 million tons of ash was used to completely fill the pit which contained an acid mine water pool. The Big Gorilla water has maintained a consistently high pH value in response to the placement of ash. Iron, manganese, magnesium, aluminum, and zinc all have decreased significantly. One long-term effect of ash placement in the former Big Gorilla Mine pool will be the prevention of acidic water production through the surface mine pool.
12. The Red Oak Coal Mine was operated from 1907 to 1925 utilizing the room-and-pillar
extraction method. The mine which covers approximately 46.5 acres contains water pools or reservoirs of AMD. The University of Oklahoma and the Oklahoma Conservation Commission injected 418 tons of FBC ash in 15 hours into this acidic (pH 4.3) flooded mine to chemically alter the mine water.
13. The Maryland Department of Natural Resources Power Plant Research Program and
the Maryland Department of Environment Bureau of Mines launched a joint effort with private industry to demonstrate large-volume beneficial uses of CCPs to create flowable grouts for placement in abandoned, underground coal mines to reduce acid formation. In April 1995, this multiyear project initiative started with the Winding Ridge Demonstration project involving injection of a 100% CCP grout into the Frazee Mine, located near Friendsville, Garrett County, MD. The Winding Ridge Demonstration project at the Frazee Mine has shown that CCP grout mixture can be beneficially used for abandoned underground coal mines to reduce acid formation as well to fill mine voids with a high-strength, low-permeability material that would control mine subsidence. The placement of the CCP grout appears to have not caused an unacceptable water quality impact either.
Conclusions
This literature review report on the use of CCPs in mine-filling activities provides a readily available resource for regulators, the general public, environmental interest groups, and potential users of CCPs by synthesizing technical information on a range of case studies. Each case study is different in several details and provides the readers insights into the use of CCPs from benefits and limitations standpoints. The technical information can be used to determine and decide on environmentally compatible uses of CCPs in surface and underground coal mines.
1
USE OF COAL COMBUSTION PRODUCTS IN MINE FILLING APPLICATIONS A REVIEW OF AVAILABLE LITERATURE AND CASE STUDIES
1.0 INTRODUCTION Coal is a widely distributed fossil fuel across the United States. Surface and underground mining combine to produce over 800 million tons of coal annually, and the vast majority of this coal is burned in utility boilers to generate electricity. Combustion of coal in the utility boilers produces coal combustion residues or products (CCPs) in the form of fly ash, bottom ash, boiler slag, and flue gas desulfurization (FGD) sludge. In the year 2003, U.S. electric utilities produced approximately 122 million tons of CCPs. Coal fly ash constituted about 70 million tons, the bottom ash/boiler slag accounted for about another 20 million tons, and the remaining 30.8 million tons was FGD material (American Coal Ash Association [ACAA], 2004). Approximately 62% of the CCPs generated are land disposed. About 38% of the fly ash generated was used in cement/concrete/grout, structural fill, waste stabilization/solidification, mining applications, and road base/subbase, accounting for most of the fly ash volume utilized. About 45% of bottom ash was used mostly in structural fills, road-base, snow and ice control, mining application, and cement/raw feed for clinkers. About 96% of the boiler slag was utilized mostly for blasting grit and roofing granules. About 70% gypsum was used mostly for wallboard production. FGD material generated by wet scrubbers was utilized only about 2.75% and dry scrubber-generated FGD material accounted for about 13.5% use. The CCPs possess several physical and chemical properties/characteristics that are beneficial both from environmental and economic standpoints. For example, fly ash has been used in the manufacture of portland cement, as a cement substitute in concrete, and as a stabilizing agent in road bases and subbases because of its wide availability and pozzolanic nature. Compacted fly ash also is considered a good candidate for structural fill on compressible ground since it is strong and durable but lighter than conventional fill materials. Gray et al. (1991) investigated the use of fly ash in slurry wall backfill mixtures and observed that these mixtures can exhibit high sorptive capacity for nonpolar organic pollutants. In addition, other researchers have investigated the potential use of CCPs in waste containment liners and have shown that it is possible to achieve hydraulic conductivity values below 10-7 cm/s using compacted fly ash alone or in conjunction with sand and/or bentonite (Gray et al., 1991). Mine reclamation represents another potential beneficial use of CCPs that is receiving increasing attention in recent years. Coal-mining operations have produced both open pits and deep underground cavities that can be filled by CCPs. In addition, non-coal-mining operations (e.g., limestone, clay, sand and gravel) result in the creation of open pits. Placement of CCPs into deep mines can provide structural support to abate subsidence, and placement of CCPs in surface mines or other open pits can aid in restoring mined land to beneficial use. Use of CCPs as mine backfill may provide the additional potential benefit of limiting impacts of acid mine drainage (AMD). Many CCPs are alkaline materials that can neutralize acidic groundwater and/or inhibit production of acid. Placement of CCPs also may reduce the permeability of mine strata and divert water away from acid-generating materials (Kim and Cardone, 1997).
2
1.1 Scope of the Research Mine reclamation has been identified as a long-term, large-volume beneficial use market for CCPs. Nonetheless, the use of CCPs in mine reclamation currently is performed on a limited basis relative to the overall quantity of CCPs generated each year. Only 0.68 million tons of fly ash, 1.2 million tons of bottom ash and about 0.39 million tons of FGD materials were used in mining applications in year 2003 (ACAA, 2004). Although CCPs possess several beneficial physical and chemical properties, there are concerns from regulators and environmental groups regarding potential for release of toxic chemicals in the leachates from the CCPs. Therefore, scientifically sound information is needed so that environmental concerns can be adequately and reliably identified and addressed. Ish Inc. and GeoTrans, Inc., were selected by the Combustion Byproducts Research Consortium (CBRC) to conduct research that will compile and synthesize information from several case studies involving CCP usage for mine application for dissemination to inform regulators, environmental interest groups, and the generators of CCPs about the benefits and impacts of CCP uses for minefilling. CBRC provided funding for this research project, with additional cofunding by the Public Service Co. of Colorado, McDonald Farms, ACAA, the Utility Solid Waste Activities Group, GeoTrans, Inc., and Ish Inc.
1.2 Report Contents This report contains compilation, synthesis, and limited evaluation of the available information from a number of mine sites where CCPs have been or are being used to fill the mined lands. This report contains a brief summary of physical and chemical composition of CCPs produced in the United States along with some information on mine spoil material. This information is presented in Section 2. Section 2 also contains a summary list of mine sites where CCPs are being utilized for filling the mined land and/or for abating AMD conditions. Section 3 contains a brief discussion of geochemistry in coal mines particularly to describe the formation of acid mine drainage. A brief description of the geochemical interactions between the AMD water and CCPs is also presented in this section. Section 4 contains summaries of case studies for which environmental monitoring information was obtained from the operators/owners of the sites. In Section 5, conclusions and recommendations are presented. 2.0 PHYSICAL AND CHEMICAL COMPOSITION OF CCPS
2.1 Physical Characteristics CCPs include fly ash, bottom ash, FGD materials, and boiler slag. These different types of CCPs represent approximately 58%, 15%, 25%, and 1.5%, respectively, of the total CCPs produced in the United States in 2000 (ACAA, 2004). The smaller ash particles contained in flue gas are referred to as fly ash and are collected by air pollution control equipment such as electrostatic precipitators. The fly ash consists primarily of particles between 5 and 100 µm in size. Fly ash comprises spherical, glassy particles comparable in size to silt and/or fine sand. Larger particles that fall to the bottom of the boiler result in the production of bottom ash or
3
boiler slag. Bottom ash is a coarser-grained material, with particle sizes comparable to sands and gravels. Boiler slag and bottom ash consist of particles ranging from 100 µm to 10 mm. FGD materials are generated when some of the sulfur in the flue gas is removed. Wet FGD systems generate waste with a particle size range of 0.001 to 0.05 mm, whereas the dry systems produce waste with particle size in the 0.002- to 0.074-mm range. FGD gypsum is also produced at some of the power plants from sulfur removal activities. The physical properties of CCPs have been well characterized. Fly ash particle morphology has been extensively investigated by scanning electron microscopy with four general categories describing most particles: 1) cenospheres, 2) plerospheres, 3) spherical particles with crystals, and 4) irregularly shaped solid particles. The fly ash exhibits light to dark colors. The bottom ash and boiler slag are black or gray in color. Reported specific gravity for most coal fly ash and bottom ash falls between 2.2 and 2.6, and the bulk density ranges between the values of 80 and 90 lb/ft3. Crushed boiler slag has been reported to have high hydraulic conductivity (permeability) equivalent to that of fine gravel. Bottom ash permeability ranges from 10-3 to 10-1 cm/sec. Fly ash material exhibits permeability typically in the range of 10-6 to 10-4 cm/sec that is similar to that for silty–clay soils.
2.2 Chemical Composition and Leaching Characteristics Numerous studies have been completed to provide data on the chemical composition of CCPs. Oxides of silicon, iron, aluminum, and calcium account for about 95% of the weight of the bottom ash, fly ash, and boiler slag. Magnesium, potassium, and sodium are also present in the ash. The FGD sludge is composed mostly of calcium and sulfur when limestone/lime is used to scrub the flue gas. All CCPs also contain trace amounts of many metals. A comprehensive elemental characterization study of samples of fly ash, bottom ash, and FGD sludge was completed by the Electric Power Research Institute (EPRI) in 1987. Table 2.1 provides the summary of the chemical concentration data from the EPRI study. This study did not contain data on Boron in CCPs. The presence of boron in CCPs, however, is well documented. Western coal fly ash and FGD sludge are typically alkaline and possess acid neutralization properties which make them useful materials for abating acid mine drainage and for filling mined land for reclamation. Additional available chemical characteristic data and information on alkaline CCPs and their use in minefilling are included in the individual case study summaries later in this report.
2.3 Physical and Hydraulic Characteristics of Mine Spoils Both underground and surface mines generate mine spoils of varying physical and chemical composition. In the surface mine setting, the mine pits are reclaimed by the replacement of the spill material as well as in permitted cases by CCPs. The mine spoil material is composed of excavated overburden sandstone, clays, and shale as well as coal remnants. The mine spoil material can contain pyritic material and/or high-sulfur reject material. The mine spoil is a heterogeneous and anisotropic material leading to the presence of variable hydraulic conductivity. Aljoe and Hawkins (1994) reported that increasing percentages of sandstone and
4
decreasing percentages of shale in mine spoil appear to yield higher-hydraulic-conductivity values. This may be due to the presence of larger-sized rock fragments in the sandstone-rich spoil zones than shale-rich zones. Shales break into smaller fragments and readily weather to create silt and clay particles which yield lower hydraulic conductivities. Aljoe and Hawkins (1994) also reported that hydraulic conductivity of the mine spoils may increase with spoil age. They observed that reclaimed mine spoil 30 months or less old had a significantly lower median hydraulic conductivity than reclaimed mine spoil that was over 30 months old. Rehm et al. (1980) reported that spoil permeability decreases with age. Their results are from the northern Great Plains region, compared to the Aljoe and Hawkins (1994) results from eastern coal fields. Hydraulic conductivity for surface mine spoils exhibits a broad range of values. A summary table (Table 2.2) prepared by Hawkins (2002) captures the available hydraulic conductivity data for surface mine spoils.
2.4 Premined Area Water Quality Groundwater and surface water quality data for premined areas are sparsely available. Strippable coal and lignite deposits are prevalent in the Denver and Laramie Formations in the Denver Basin. Kirkham and O’Leary (1980) reported water quality data collected from monitoring wells in Watkins (Adams/Araphahoe County), Bijou Creek (Elbert County), Keenesburg (Weld County), and Matheson (Elbert County) areas. These chemical analysis results are shown in Table 2.3. Brady et al. (1996) and Hawkins et al. (1996) have given a summary of shallow groundwater quality in unmined regions of the northern Appalachian Plateau. Examination of these premined area groundwater quality results indicates the presence of low to quite high concentrations of sulfate, sodium, iron, manganese, and total dissolved solids (TDS) in groundwater with a significant amount of alkalinity and neutral to alkaline pH.
2.5 Water Quality in Mined Areas Numerous studies have been carried out around the United States to characterize water quality from surface and subsurface mined areas. Much of the water quality data deals with coal mine drainage. Coal mine drainage can be either acidic or alkaline. AMD is typically elevated in SO4, Fe, Mn, Al, and a few other elements.
2.6 CCP Mine Placement Sites A survey questionnaire was developed and sent out to solicit information on CCP mine placement sites. Follow-up phone calls and individual contacts were made to identify over 100 mine sites where CCPs have been or are being placed in the previously mined areas. As a result, Table 2.4 has been developed to list the mine sites where CCPs were or are being used to fill the mined areas. Most of the identified sites are either surface or underground coal mines. Environmental monitoring data were obtained for a subset of these sites and are summarized to the extent possible in this report.

5
3.0 GEOCHEMISTRY OF COAL MINE DRAINAGE AND INTERACTIONS WITH CCPs
3.1 Coal Mine Drainage
Coal mines represent an environmental setting where the mining of coal generates coal refuse and exposes pyritic material present in the coal. Coal mine drainage results when rainwater and drainage water undergo chemical reactions with the coal refuse, pyrites, and overburden material. AMD occurs by the oxidation of pyrite to release dissolved Fe2+, SO4
2-, and H-, followed by further oxidation of Fe2+to Fe3+, generating more H+. The oxidized Fe2+ precipitates as iron hydroxide solid giving rise to the orange–yellow color in the areas where the precipitates are deposited. Coal mine drainage can be acidic or alkaline, typically with relatively high concentrations of sulfate, iron, manganese, and aluminum. The pH of the coal mine drainage water commonly is either in the range of 3 to 4.5 s.u. or 6 to 7 s.u. (standard unit). Obviously, more abundant pyrite material in the overburden correlates to a more acidic pH of the coal mine drainage. The major source of acidity is, therefore, due to the oxidation of pyrite that gets exposed to humid air and/or aerated water when mining activities break rocks and move the overburden material. AMD water contains elevated levels of dissolved SO4, Fe, Al, and Mn, is typically low in pH, and may have elevated concentrations of arsenic, copper, nickel, and zinc (U.S. Bureau of Mines, 1994; Caruccio et al., 1994, Evangelou, 1995). Caruccio and Geidell (1978) reported that pyrite can range in grain size between 400 µm and 5 mm. Oxidation of pyrite is a complex set of reactions involving both abiotic geochemical and biotic microbial reactions (Figure 3.1). At low pH (<4.5), pyrite is oxidized by Fe3+ much faster than by oxygen. Neutral or alkaline mine drainage has alkalinity that equals or exceeds acidity because of the neutralization reactions with carbonate minerals such as calcite and dolomite. The alkalinity imparted by the dissolution of carbonate minerals promotes the removal of Fe, Al, and other dissolved metals while neutralizing the acidity. The neutral or alkaline mine drainage water still contains elevated amounts of sulfate. Table 3-1 shows median postmining water quality data for several mine sites in Pennsylvania to illustrate the acidic and alkaline coal mine drainage water quality.
3.2 Interactions Between CCPs and Coal Mine Drainage If acidic CCPs are placed in coal mines with AMD, then the low pH and acidity in the AMD water could increase leaching or release of some metals in the CCPs. When alkaline CCPs are placed in coal mines with AMD, then the AMD is neutralized by the CCPs. The primary base cations in CCPs that provide alkalinity are calcium and magnesium. The dissolution of the base cations from CCPs results in neutralization and increase in pH of the AMD, which in turn decreases the concentrations of other heavy metals in the AMD.

6
The most obvious effect of alkaline CCPs on AMD is the reduction of iron. As soon as the pH of the neutralized AMD water is about 6.5 and higher, iron solubility decreases and iron oxide or iron hydroxide precipitates are formed as red or orange flocculants. The formation of iron hydroxide further helps in the coprecipitation/adsorption of metals such as As, Ni, Cd, and Cr. However, most of the sulfate found in the AMD water is likely to remain in solution, although some precipitation of sulfate may occur when enough calcium or barium is present to precipitate gypsum or barite. The net effect of placing alkaline CCPs in abandoned coal mines is expected to be beneficial in most situations. The pH of the water is likely to increase, and concentrations of most metals in the AMD are expected to decrease. 4.0 CCPs IN COAL MINES Beneficial use of CCPs for coal mine reclamation occurs in varying degrees across the United States. Injection of CCPs into deep mines has been performed to provide structural support for subsidence abatement, and placement of CCPs in surface mines has been utilized to reclaim mined land to original grade and to mitigate AMD. Such practices have been employed at both active and abandoned coal mines. Several surface and deep mines in the midwestern and western United States that have utilized CCPs for reclamation are identified in Table 2.4. These mines include Keenesburg and Trapper Mines (CO), Wyodak Mine (WY), Savage Mine (MT), Midwestern Abandoned Mine and Arnold Willis City Mine (IN); Big Gorilla Pit (PA); Winding Ridge Frazee Mine (MD); and Universal Mine (IN). Active mining operations continue to occur at Trapper, Wyodak, and Savage Mines. Types of CCPs placed at these mines include fly ash, bottom ash, and FGD materials. Several case studies to assess the advantages and disadvantages associated with beneficial use of CCPs in mine reclamation are presented in this section of the report. These mines were selected based on availability of site-specific data required to perform a reasonable evaluation of the benefits and impacts of CCP placement on groundwater quality. Tables and graphs are included, when available, to illustrate important aspects of each case study. Following is the list of case studies included in this report:
1. Wyodak Mine, WY 2. Keenesburg Mine, CO 3. Trapper Mine, CO 4. Savage Mine, MT 5. Storm Strip Mine, WV 6. Universal Mine, IN 7. Midwestern Abandoned Mine, IN
8. Arnold Willis City Mine, IN 9. Harwick Mine Complex, PA 10. Clinton County, PA 11. Big Gorilla Pit, PA 12. Red Oak Mine, OK 13. Winding Ridge Frazee Mine, MD

7
4.1 Wyodak Mine (WY)
4.1.1 Background The Wyodak Mine is an active, above-ground coal mine located approximately 5 miles east of Gillette, Wyoming. Approximately 69 million tons of coal was mined at Wyodak between 1922 and 1990, and the estimated remaining minable quantity of coal within the permit boundary exceeds 100 million tons. The total permitted area of the mine is 5811 acres. The Wyodak coal seam is classified as subbituminous and ranges between 20 and 100 feet in thickness. The overburden thickness above the coal seam ranges from 20 to 200 feet, with thin overburden (i.e., 20–100 ft) in the southern area of the site and thicker overburden (i.e., 100–200 ft) in the northern area of the site. Placement of fly ash, bottom ash, and scrubber ash in mined areas at Wyodak Mine began in 1978 and is expected to continue through 2009. The ash is received from three nearby power plants, i.e., Neil Simpson I, Neil Simpson II, and Wyodak. Annual quantities of each ash type generated at the three power plants are listed in Table 4.1. Bottom ash currently is slurried to an on-site disposal pond that is dredged periodically to remove material for use as mine backfill. Fly ash from the Neil Simpson I power plant is mixed with bottom ash and either slurried to the disposal pond or placed directly in the pits. The commingled fly/bottom ash also may be intermixed with spoil material prior to backfilling. Scrubber ash (i.e., mixed fly ash and FGD sludge) is obtained from the Wyodak and Neil Simpson II power plants and is placed directly as pit backfill. Upon completion of ash placement, backfilled mine areas are covered with soil and revegetated. Approximately 5,000,000 yd3 of ash has been placed in 13 separate pits listed in Table 4.2. Active ash placement operations are ongoing in Area 4 (1998–2009) near the center of the site at an annual placement rate of nearly 250,000 yd3. Ash-filling operations began at the base of each mined-out pit. As indicated in Table 4.2, pits filled from 1980 to 1982 in Area 2 represent “unencapsulated” cells in which no soil liner was constructed at the base of the cells prior to ash placement. In the southern area of the site, pits filled with ash prior to 1980 (Area 1) and after 1983 (Area 3) were lined with compacted clay materials selected from appropriate overburden, interburden, and/or underburden soils. Clay liners with a maximum hydraulic conductivity of 5 × 10⁻⁷ cm/s were required for these mines as a result of a relatively thin layer of overburden (i.e., less than 20 feet) between the mined-out pit floors and the groundwater table. The unlined pits (Area 2) and the lined pit filled in 1983 (Area 3) are located beneath the floodplain of Donkey Creek.
4.1.2 Local Geology The Wyodak site is located within the Powder River Basin. The Eocene Wasatch Formation comprises the overburden at the site ranging from 10 to 200 feet in thickness and consisting primarily of fine-grained clays and siltstones with discontinuous cross-bedded sandstone and scoria beds. The scoria beds were formed from baked and fused shale and clay in the Wasatch. The Wyodak coal seam forms outcrops in the eastern side of the permit region and

8
generally comprises the uppermost Paleocene Fort Union Formation unit. Approximately 400 feet of interbedded claystone, siltstones, and shale underlies the coal. The coal and underlying sedimentary units form outcrops in the eastern portion of the site.
4.1.3 Local Hydrogeology and Hydrology The shallow hydrologic system in the Powder River Basin primarily comprises five permeable units: 1) lenticular sands in the Fort Union Formation, 2) the Wyodak coal seam, 3) lenticular sands in the Wasatch Formation, 4) scoria beds in the Wasatch formation, and 5) Quaternary alluvium. Each of these water-bearing units produces water at the site. The most significant source of shallow groundwater within the Fort Union Formation at the site is a sandstone unit that is less than 100 feet thick and occurs 360 to 380 feet beneath the Wyodak coal seam. Interbedded claystones, siltstones, and shale are located between the coal seam and sandstone unit. The Wasatch Formation is saturated in the mine permit area, although it is not considered to be a significant source of groundwater because of its relatively low permeability. Secondary permeability created by fracturing has produced yields for some domestic and stock wells. However, groundwater from the coal beds on-site typically is not suitable for domestic use. Surface water hydrology within the mine permit boundary is controlled by Donkey Creek, which is located in the southern portion of the permit region and has a drainage area of about 77 square miles upgradient of the permit area. Donkey Creek flows to the east and is a tributary of the Belle Fourche River.
4.1.4 Ash-Leaching Characteristics Laboratory tests on fly ash and bottom ash samples were performed on several occasions over the past two decades in support of reclamation activities at the Wyodak Mine. In 1983, a laboratory column leaching study was performed on crushed Wyodak bottom ash and overburden material (i.e., mine spoils). The test was performed first by permeating site groundwater through a column of overburden material and analyzing the effluent for the constituents listed in Table 4.3 to establish representative postmining water quality conditions in the absence of CCP placement. The effluent from the overburden column then was passed through a column of crushed bottom ash and analyzed for the same chemical constituents. The results provided in Table 4.3 indicate that effluent from the overburden meets Wyoming Class III livestock use standards for all constituents, but exceeds Class I domestic use standards for TDS, Mn, NH3, and SO4. Permeation through the bottom ash resulted in an increase in some of the regulated constituents, including pH, TDS, B, Cl, Cr, Cu, NO2/NO3, and SO4. Effluent from the bottom ash meets Class III standards for all constituents with exceedances occurring for B (6.97 mg/L relative to 5.0 mg/L) and SO4 (3060 mg/L relative to 3000 mg/L). Concentrations of several constituents decreased upon permeation through the ash. For example, Mn exceeded the Class I domestic use standard (0.13 mg/L relative to 0.05 mg/L) in effluent from the overburden column but was not detected in the effluent after exposure to the ash.

9
Additional laboratory leaching analyses of Wyodak bottom ash and scrubber ash were conducted in 1997 and 1998, respectively, using a sequential batch extraction procedure in which ash samples were mixed with site groundwater at an ash-to-water ratio of approximately 1:20 (i.e., 100 g ash:2000 mL groundwater) (Aqua Terra 1997, 1998). This ash-to-water ratio in the batch test is not representative of expected field leaching conditions as compared to the ash-to-water ratio in a column test. However, the batch method of testing is considered to yield more conservative leaching results than column testing, since more of the ash surface area is exposed to the groundwater. The results of the Wyodak ash batch leaching tests, summarized in Table 4.4, indicate that pH values tend to be elevated relative to the groundwater prior to testing. The results further indicate that maximum postextraction concentrations of all constituents in the bottom ash test, except for Mn and NH3, are below current Wyoming Class III livestock-watering standards. Concentrations of both Mn and NH3 in the groundwater also exceeded the Class III limits prior to ash exposure. As observed in the column test, the concentration of Mn in the groundwater decreased from 1.29 mg/L before ash exposure to 0.07 mg/L after ash exposure, a value that is only slightly higher than the Class III standard of 0.05 mg/L. The postextraction groundwater in the scrubber ash test was above Class III standards for pH, Cr, F, Fe, Mn, and NH3. However, concentrations of Fe, Mn, and NH3 in the groundwater exceeded Class III standards prior to ash exposure. In both tests, postextraction concentrations exceed Class I domestic use standards for TDS, B, Mn, NH3, and SO4. Of these constituents, only B was below the Class I standard in the groundwater prior to ash exposure.
4.1.5 Groundwater Quality Groundwater quality at the site is present within alluvium, upper and lower coal, Wasatch, scoria, Fort Union Formation, and sandstone (beneath the coal) units. Groundwater quality from the coal is classified as calcium sulfate-type water with significant bicarbonate and magnesium content. Groundwater derived from the coal is used for livestock purposes and is considered to be of better quality in the northern and eastern portions of the site where the coal seam is not split. Groundwater derived from scoria at the site is magnesium–sodium sulfate-type water, and alluvial groundwater is magnesium–sodium–calcium–sulfate-type water. Monitoring wells are distributed within the different units both inside and outside of the permit boundary and also within or near ash-filled pits. Well LF-5 is located in close proximity to unlined pits in Area 2, and Well M-11 is located within the lined pit in Area 3 that received ash in 1998 and 1999. Well M-9 is located in Area 4, which comprises the largest unlined pit and is scheduled for ash placement until 2009. It is unclear which portions of Area 4 have already received ash. Wells M-1, M-1A, M-2, M-3, M-4, M-5A, and M-8 are located in an unmined region within the permit boundary to the north of Area 4. This area may be filled with ash in the future. Wells M-6, M-6A, M-16, M-17, M-18, M-19, M-22, M-23, and M-29 are located along the southern perimeter of the site outside of the mine permit boundary. Results of groundwater quality analyses for samples collected from several of the Wyodak mine area monitoring wells are available for the period 1981 to 1999. Metal analyses also were

10
performed on a more limited basis from 1977 to 1981. These results are utilized herein as a basis for evaluating the groundwater quality at the Wyodak site. Groundwater quality information prior to mining operations is not available. A summary of groundwater quality for regulated analytes in Wyoming is presented in Table 4.5 for selected wells. Wells were selected on the basis of data availability and well proximity to ash-filled pits in order to provide a representative cross section of groundwater quality across the site (e.g., mined versus unmined regions, upgradient versus downgradient locations). Local groundwater gradients appear to follow local topographic trends northward across the site. Monitoring Wells M-1A and M-5A were selected to represent the northern unmined area downgradient of ash backfill areas. Monitoring Well M-12 is located upgradient of ash deposition activities in the southern portion of the site. Off-site monitoring Wells M-17 and M-22 are located upgradient of mining and ash backfill areas. Monitoring Well LF-5 is located adjacent to unlined ash fill in Area 2. Although numerous wells are located within Areas 1, 2, and 3, limited analytical data are available for these wells. Historical maximum and mean value analyte concentrations in groundwater samples from the selected wells are provided in Table 4.5. The Table 4.5 results indicate that the average groundwater quality throughout the Wyodak site compares favorably with the Wyoming Department of Environmental Quality (DEQ) Class III (livestock use) standard. Mean concentrations for all of the measured constituents in wells are at or below Class III standards. The only possible exception is mercury (Hg). Unfortunately, no valid conclusions can be made regarding whether or not mean Hg concentrations exceed the Class III standard of 0.00005 mg/L, since the reported detection limit for Hg in most of the sampling events was 0.001 mg/L. However, maximum Hg concentrations (i.e., maximum of all samples shown in Table 4.5 – Wyodak Mine groundwater quality summary for selected monitoring wells analyzed over time for a particular well) in excess of the Class III standard were observed in all of the selected wells, including the off-site, upgradient wells (M-17 and M-22). These results indicate that elevated Hg levels may be present in upgradient groundwater for this area. The results in Table 4.5 also illustrate that periodically elevated concentrations of some constituents were observed in wells located near the southern ash-filled pits. For example, the maximum concentrations of TDS and chromium (Cr) measured in Well LF-5 from 1987 through 1999 exceed current Wyoming DEQ Class III standards. Concentrations of As, Cl, Mn, and SO4 do not exceed Class III standards but appear to be elevated in Well LF-5 relative to the other wells. Well LF-5 is located in the backfill near the unlined ash-filled pits. Elevated maximum concentrations of Cr and B were observed from 1977 to 1981 in Well M-12, located upgradient of the ash-filled pits in the southern portion of the site. However, these elevated Cr and B concentrations likely are not due to ash placement, since pits closest to M-12 were not filled until 1985 or later. Also, historically high Cr concentrations in off-site, upgradient Well M-17 indicate that elevated Cr may be naturally occurring in this area. Temporal groundwater quality trends observed in Wells M-1A, M-5A, LF-5, M-17, and M-22 from approximately 1981 to 1999 for B, SO4, Mn, and TDS shown in Figures 4.1–4.4. The results indicate that SO4, Mn, and TDS concentrations tend to be elevated in Well LF-5, the

11
nearest well to the unlined pits in the southern portion of the site, relative to the upgradient and downgradient wells. However, LF-5 concentrations in excess of the Wyoming Class III standards were observed only for TDS. Also, lower values of these constituents in downgradient Wells M-1A and M-5A indicate that ash placement has not resulted in significant impacts to regional groundwater quality within the permit boundary to date.
4.2 Keenesburg Mine (CO) The Keenesburg Mine is located approximately 7 miles north of Keenesburg, Colorado, in Weld County, Sections 25, 26, 35, and 36 of Township 3 North, Range 64 West. The permit area was recently extended to include Sections 2, 11, and 14, Township 2 North, Range 64 West, in 2000 (Correspondence dated 10-30-00 from Byron Walker of the State of Colorado DNR to Colorado Department of Health HMWMD). Coors Energy Company operated coal extraction at the Keenesburg Mine between 1980 and 1988. Approximately 1000 tons was mined from the site daily (Correspondence dated 11-14-86 from John Althouse of Coors Energy Co. to Weld County Commissioners). Reclamation at the Keenesburg site is being performed using fly ash and bottom ash derived primarily from Keenesburg coal and generated by the Coors Brewery in Golden, Colorado. Ash placement operations began at the Site A pit that is configured in an east–west direction approximately within the mining boundary established in 1985. Ash also was deposited in the north and south ends of B pit after completion of mining operations in 1988. As of 1993, approximately 172,000 tons of ash had been placed in A and B pits at a rate of nearly 30,000 tons/yr. Additional ash placement sites were also utilized between 1987 and 1989. Ash was placed at least 5 feet above the premining groundwater table, and reclamation plans also include placement of a vegetative final cover consisting of at least 5 feet of compacted overburden and 3 feet of topsoil material.
4.2.1 Local Geology The Keenesburg Mine is located within the Denver structural basin. Documented geologic units at the site include the following, in descending stratigraphic order: quaternary deposits, the Laramie Formation, the Fox Hills Sandstone, and the Pierre Shale. The total thickness of these sedimentary units at the site is estimated at 10,000 feet (Doty and Associates, 1998). Quaternary deposits include Ennis Draw alluvium and dune sand. The Laramie Formation is considered the uppermost bedrock unit at the site and is comprised of yellow–brown and gray to blue–gray, soft, carbonaceous shale and clay–shale interbedded with sand and shaley sand. The lower portion of the Laramie contains thick, continuous coal seams. The Fox Hills Sandstone consists of calcareous marine sandstone with dark gray to black sandy shale and some massive white sandstone. The thickness of the Fox Hills Sandstone reportedly ranges between 60 and 300 feet (Doty and Associates, 1998). Pierre Shale is considered the deepest water-bearing unit of interest at this site. This unit comprises fossiliferous marine shale, silt, and clayey sandstone and is estimated to be over 8000 feet thick.

12
4.2.2 Local Hydrology The major aquifer at the Keenesburg site is the Laramie–Fox Hills Aquifer, with sandstone at the base of the Laramie and the upper portion of the underlying Fox Hills Sandstone. Groundwater flow across the site prior to mining was to the northeast at a prevailing hydraulic gradient of 0.002. Recharge to aquifers within the Denver Basin primarily occurs via outcrop infiltration, while shale deposits in the upper Laramie Formation largely prohibit deep vertical recharge. The estimated average hydraulic conductivity for the Laramie–Fox Hills Aquifer is 0.05 feet/day, with a transmissivity of 8 ft2/day (Doty and Associates, 1998). The average hydraulic gradient across the site is 0.002 ft/ft, resulting in an average groundwater flow velocity of about 0.2 ft/yr (assuming 15% porosity). Sedimentary units that are considered to be of hydraulic significance at the site include the sand and alluvial deposits, overburden, coal, and clayey backfill material (mine spoils) (Doty and Associates, 1998). The sand deposits above the shale are unsaturated and have an estimated hydraulic conductivity of 1.0 × 10⁻³ cm/s. The Quaternary alluvium is saturated at the site with an estimated hydraulic conductivity of 10-4 cm/s. The water-bearing silty claystones and sandstones above the coal deposit in the upper Laramie Formation appear to be hydraulically connected to the alluvium. Coal deposits at the site are saturated, and the estimated geometric mean hydraulic conductivity of the coal is 9 × 10⁻⁵ cm/s. The hydraulic conductivity of the spoil material was not available.
4.2.3 Ash Chemical Characteristics Chemical analyses were performed on fly ash and bottom ash samples prior to disposal at the Keenesburg Mine. For example, the results of a 1989 extraction analysis on saturated fly ash and bottom ash pastes with an ash-to-water ratio of approximately 1 g to 0.42 g are shown in Table 4.6 (Hazen Research Inc., 1989). The results indicate that the ash samples contain appreciable amounts of alkali/alkaline-earth metals (Ca, Na, K, Mg), sulfate (SO4), and trace metals (e.g., B, Cr, Cu, Fe, Pb, Mo, Se, Zn). The fly ash appears to contain greater amounts of many of the analyzed constituents, most notably As, B, Cd, Cr, Mo, Se, and SO4. The toxicity characteristic leaching procedure (TCLP) tests performed on fly ash and bottom ash samples indicate that the leached concentrations of the Resource Conservation and Recovery Act (RCRA) metals (Ag, As, Ba, Cd, Cr, Hg, Pb, and Se) would classify these ashes to be a nonhazardous solid waste as shown in Table 4.7 (Hazen Research Inc., 1991).
4.2.4 Groundwater Quality Groundwater quality data were collected at the Keenesburg site since the late 1970s, primarily for monitoring Wells AMW-1, AMW-2, DH-96, DH-122, DH-133, DH-172, FPW, and SMW-2. Wells FPW, DH-96, DH-122, DH-133, and DH-172 were completed in the Ennis Draw alluvial aquifer. Wells SMW-2 and AMW-2 were completed in the reclaimed spoil, and Well AMW-1 was completed in undisturbed overburden. Assuming a prevailing northeastern groundwater flow direction, monitoring Wells DH-122 and DH-133 are located upgradient (south to southwest) of ash placement areas, whereas monitoring Wells AMW-1, AMW-2, FPW, DH-96, and SMW-2 are located downgradient (north to northeast) of ash placement areas.

13
Historic maximum and mean groundwater concentrations measured in monitoring wells prior to ash placement (i.e., 1978–1986) and after ash placement (i.e., 1988–2000) are compared to drinking water and agricultural standards from the Colorado Department of Public Health and Environment (CDPHE) Regulation No. 41 “Basic Standards for Groundwater” in Table 4.8. Regulated analytes for which site data are available include As, Ba, Cl, Fe, Mn, NO3, Se, SO4, and TDS. The results in Table 4.8 indicate that, on average, concentrations of these analytes historically have exceeded the regulatory standards in at least one of the site wells. Ba is the only analyte that has consistently remained below Colorado Groundwater Protection Standards both prior to and after the placement of ash. However, upon comparison of water quality in upgradient versus downgradient wells and for sampling events prior to ash placement (1978–1986) relative to sampling events following ash placement (1988–2000), there is little evidence indicating that elevated levels of regulated constituents in site groundwater are a direct result of leaching from the ash. For example, elevated arsenic concentration (0.11 mg/L) was observed in both upgradient Well DH-122 and downgradient Well DH-96. Elevated concentrations of Fe, Mn, NO3, and SO4 also have been measured in upgradient Well DH-122. The results in Table 4.8 also indicate that average concentrations of Cl, Fe, SO4, and TDS in downgradient Well SMW-2 for the years prior to ash placement are similar to, if not higher than, concentrations of these constituents measured in the years following ash placement. Thus the results for SMW-2 likely represent impacts to groundwater quality as a result of mining activities rather than placement of ash, which also may be responsible for the elevated concentrations of SO4 and TDS measured in Wells AMW-1 (downgradient of B pit) and AMW-2 (downgradient of A pit) after 1988. Unfortunately, chemical analysis data prior to ash placement are not available for Wells AMW-1 and AMW-2. Based upon the above analyses, the groundwater quality at the Keenesburg Mine does not appear to be impacted by placement of CCPs. Moreover, Coors Energy Company was chosen as the 1999 Small Operation Reclamation Award winner as a result of reclamation efforts at the Keenesburg Mine. Currently, the mine is operating under a reclamation-only permit.
4.3 Trapper Mine (CO) The Trapper Mine is a surface coal mine located on the north slope of the Williams Fork Mountains, approximately 6 miles south of Craig, Colorado. The Trapper Mine began operation in 1977 and produces up to 2.8 million tons of coal annually. A majority of this coal is utilized by the Craig Generating Station, an electric power plant located near the mine. Surface-mining operations were initiated in the Ashmore Pit (A Pit) in June of 1977. The Queen Anne, the first of three draglines to be put into service at Trapper during the late 1970s, began uncovering two coal seams in the westernmost portion of A Pit. The upper coal seam averaged from 4 to 6 feet in thickness and was typically encountered at overburden depths ranging from approximately 30 to 110 feet. The underlying coal seam varied from 5 to 9 feet in thickness and was separated from the upper seam by approximately 30 feet of overburden. Mining depths for the lower seam ranged from 50 to approximately 160 feet.
14
Deposition of CCPs in the mined out areas of A Pit began in 1984 with the first ash placement sites located in the Johnson drainage just east of the No Name watershed divide and the No Name drainage. CCP placement at these sites occurred from 1984 through 1986. Additional ash placement sites were subsequently developed just north of the original disposal sites in the Johnson drainage and along the eastern flank of the Johnson drainage. These locations served as ash deposition sites during 1987 and 1988. Ash deposition further south along the eastern flank of the Johnson Gulch drainage began in 1989, progressed to the top of the Johnson drainage in 1993, and followed the mine workings into the East Pyeatt portion of A Pit beginning in 1994 and continuing until today. The Trapper Mine has managed approximately 390,000 tons of CCPs per year since 1984, with total disposal quantities approaching 7 million tons to date (personal communication with Karl Koehler, Trapper Mining Inc., 2001). Current ash placement practices involve deposition of sufficient overburden material into the pit bottom such that the ash is placed above the expected postmining groundwater table. Overburden materials are placed above the ash and revegetated as part of the final reclamation plan.
4.3.1 Hydrogeology The geology in the vicinity of the Trapper Mine is dominated by the Williams Fork formation that represents the upper portion of the Mesa Verde Group in northwestern Colorado. The Williams Fork Formation is divided into a lower unit, Twenty Mile Sandstone (middle unit), and an upper unit. The Trapper Mine is located on an outcrop of this upper unit, which extends to a depth of approximately 850 feet in the vicinity of the Trapper Mine. Coal seams at the Trapper Mine are located within the upper 20 to 160 feet of the Upper Williams Fork Formation. The Upper Williams Fork unit primarily consists of siltstones and shale and essentially acts as an aquitard to the Twenty Mile sandstone unit that represents the most productive aquifer in the area. Coal seams and sandstone units within the Upper William Fork Formation also may serve as aquifers for perched groundwater. The alluvial aquifer above the Upper Williams Fork Formation is associated with the Yampa River floodplain to the north and west of the mine site and has an estimated permeability of 67 to 670 ft/day (Radian Corporation, 1991). Based on groundwater levels measured in site monitoring wells in November 2000 (Trapper Mining Inc., 2001), the average groundwater flow direction is north to northwest across the site. Groundwater recharge in the area occurs via direct infiltration, primarily from snowmelt. The rate of groundwater recharge is relatively low as a result of the climate, which is characterized by a lack of abundant precipitation and a high evaporation rate. Based on the results of a groundwater recharge study, recharge to shallow groundwater (assuming 4 feet of overburden) is estimated to be about 0.6 inches per year (Radian Corporation, 1991). Thus groundwater impacts resulting from infiltration through CCPs placed above the groundwater table are expected to be minor.

15
4.3.2 Ash Chemical Characteristics Coal combustion products produced at the Craig Generating Station include fly ash, bottom ash, and scrubber sludge materials from combustion of bituminous coal in the boilers. Results of chemical analysis on composite samples of Craig Station fly ash and bottom ash are shown in Table 4.9 (Radian Corporation, 1991). These results illustrate that both the fly ash and bottom ash contain appreciable levels of several constituents, including Al, Ba, Ca, Fe, Mg, P, K, Si, Na, Sr, S, and Ti. Lesser amounts of other trace metals also were detected, including Ag, As, B, Cd, Cr, Cu, Mn, Mo, Ni, Pb, V, and Zn. Analyses such as those given in Table 4.9 typically are performed by digestion of the ash samples in a strong acid solution (e.g., pH <2) and often are not representative of the expected leaching behavior of the ash, since many of the ash constituents may not be mobilized by leaching fluids that more closely approximate expected field conditions. For example, results of batch extraction tests with acetic acid (pH ~5.0) and distilled water are provided in Table 4.10. Although the results indicate that the fly ash and bottom ash tend to release measurable amounts of SO4 and several trace metals (Ag, Al, B, Ba, Cr, Fe, Mn, Mo, Ni, V, Zn), comparison of constituent levels with current groundwater quality standards in Table 4.10 reveals that the fly ash tends to release elevated concentrations of only Al, B, Ba, and Cr based on distilled water extraction. No elevated concentrations were leached from the bottom ash. The alkaline nature of the ash materials is evident by final values of pH in the distilled water extraction tests that exceeded the acceptable pH range based on current standards (i.e., 6.5–8.5). Results of the RCRA extraction test indicate that the weak acid leaching tends to mobilize greater quantities of certain constituents from the fly ash. In particular, the concentration of SO4 increased from <3 mg/L in the distilled water extraction to 90 mg/L in the RCRA extraction. In order to better assess the potential impact of fly ash placement on groundwater quality, column leaching tests were conducted on fly ash and overburden materials. Column tests typically are more appropriate than batch tests for assessing potential groundwater impacts, since column tests are conducted at an ash-to-water ratio that is more representative of field conditions than the ash-to-water ratio employed in batch leaching tests. In this study, tests were conducted by passing deionized water through separate columns of Craig Station fly ash and unweathered overburden material. In addition, a third column test was conducted by passing deionized water through a fly ash column and subsequently passing the fly ash column effluent through an overburden column. The testing program provided the means to evaluate the individual leaching characteristics of the fly ash and overburden materials and to investigate the ability of the overburden to attenuate the migration of contaminants from the fly ash. Effluent levels of pH, SO4, Al, Ba, B, Cr, Mn, and V measured during the three column leaching tests are illustrated versus cumulative effluent volume in Figures 4.5–4.12. The results indicate that effluent from the fly ash exhibited consistently higher pH and higher concentrations of Al, B, Ba, and Cr than effluent from the overburden. Effluent concentrations of pH, Ba, and Cr from the fly ash column exceeded Colorado State drinking water standards throughout the test, whereas effluent levels of these constituents from the overburden material column essentially were below (or within) the standards throughout the test duration. The test results also indicate that subsequent passage of the fly ash effluent through the overburden resulted in

16
reductions in pH, Ba, and Cr to below drinking water standards. The overburden also appears to attenuate Al, but exhibits little ability to attenuate B released from the fly ash. Colorado drinking water standards currently do not exist for either Al or B, although regulated agricultural use limits of 5.0 mg/L and 0.75 mg/L, respectively, have been established. Based on these limits, placement of overburden in mined pits prior to placement of fly ash may not reduce the leaching of B from the ash. The test results also indicate that concentrations of SO4, Mn, and V were as high or higher in effluent from the overburden material column relative to the fly ash. The tendency for these constituents to be released from the overburden is illustrated further by the similar leaching trends exhibited in the overburden column test and the test in which the water is passed through the fly ash prior to passage through the overburden. Of these three constituents, SO4 is the most difficult to assess in terms of groundwater impacts related to ash placement, since initial SO4 leached from the fly ash and the overburden material are similar. The results in Figure 4.6 show that SO4 levels may be expected to decline over time to levels below the Colorado drinking water standard (250 mg/L). However, leached concentrations of SO4 in the early time were higher than the standard. In addition, SO4 may be released in greater concentrations from the bottom ash based on the batch test data (see Table 4.10), as well as from the scrubber ash that tends to contain more sulfur than both fly ash and bottom ash (Radian Corporation, 1991).
4.3.3 Groundwater Quality Groundwater quality monitoring has been performed at the Trapper Mine since 1982 but primarily since 1984, after ash deposition operations were initiated. Historic groundwater quality data are evaluated based on eight groundwater-monitoring wells identified as GD2, GD3, GF4, GF5, GF6, GF7, GF11, and GMP1. Wells GD2, GD3, GF6, and GF11 are upgradient of ash areas, whereas Wells GF4, GF5, GF7, and GMP1 are downgradient of ash disposal. Samples have been collected since 1982 in Wells GD2, GF4, and GF6. Sampling efforts were initiated in the remaining wells between 1984 and 1990. Groundwater samples were analyzed for Al, As, B, Ba, Cd, Cl, Cr, Fe, Mn, Mo, NH3, NO2+NO3, Pb, pH, SO4, and TDS. Historic maximum and mean concentrations of these constituents in each of the eight wells are listed along with the respective Colorado groundwater quality standards in Table 4.11. Comparison of the historic groundwater concentration data with Colorado standards in Table 4.11 indicate little or no evidence of groundwater impacts associated with most of the analyzed constituents, including Al, As, B, Cd, Cl, Cr, NO2 + NO3, and Pb. Historic mean concentrations of iron (Fe) also are not elevated in any of the wells, although elevated individual values have been observed periodically in groundwater Wells GD2, GD3, GF4, GF5, and GF7. None of the historic Fe concentrations measured in any of the wells exceed the agricultural use standard (5.0 mg/L). Of all the constituents monitored at the Trapper Mine, Mn, SO4, and pH have consistently been observed at levels in excess of drinking water standards in Colorado. For example, pH values in excess of the upper limit established by Colorado drinking water standards (i.e., 8.5) historically have been measured in several of the wells, most notably in downgradient Wells GF4 and GF5. Historic maximum and mean values of pH are 9.3 and 8.86, respectively, in Well GF4,

17
and 9.15 and 8.06, respectively, in Well GF5. Elevated pH values in GF4 and GF5 may represent a groundwater impact related to ash placement, considering the locations of these wells relative to ash areas and the tendency for leachate from the fly ash to exhibit pH values between 10 and 12 (See Figure 4.6). Excessive mean historic concentrations of Mn have been observed in upgradient Wells GD2, GD3, and GF11 and in downgradient Wells GF4 and GF7. The presence of elevated Mn in both upgradient and downgradient wells suggests that Mn levels reflect the overall postmining groundwater quality at the site and not an impact attributable to ash areas. This observation also is supported by the column leaching test results for Mn in Figure 4.7 that show the tendency for Mn to be mobilized from the mine spoil rather than from fly ash. Elevated mean historic concentrations of SO4 are evident in upgradient Wells GD3 and GF11 and in downgradient Well GF7. Historically high SO4 levels in both upgradient and downgradient wells indicate that elevated SO4 is characteristic of the overall postmining groundwater quality at the site. However, the historic mean SO4 concentration in downgradient Well GF7 (1,581 mg/L) is considerably higher than the historic mean SO4 concentrations in upgradient Wells GD3 and GF11 (435 mg/L and 569 mg/L, respectively). Given that the ash represents a significant source of sulfur (see Table 4.9) and mobilization of SO4 from ash samples has been observed in leaching studies (see Table 4.10 and Figure 4.6), the higher concentration of SO4 in Well GF7 may be due, in part, to ash disposal operations. However, the column test results also show that significant SO4 may be mobilized from the mine spoil.
4.4 Savage Mine (MT) Knife River Corporation’s Savage Mine is located approximately 20 miles southwest of Sidney, Montana, and about 4 miles northwest of Savage, Montana, close to the North Dakota border. The Savage Mine has been in operation since 1958 as a surface lignite mine, and it currently produces 250,000 tons of lignite annually. The mine primarily serves the Imperial Holly Sugar Corporation plant in Sidney, Montana. The Savage Mine began utilizing fly and bottom ash generated by Holly Sugar as backfill in 1987. The annual volume of ash received by the Savage Mine is variable and dependent upon the amount of coal burned by Holly Sugar in relation to the quantity of sugar beets processed. The ash disposal permit does not allow annual ash disposition in the mine to exceed approximately 10,000 cubic yards (about 16,500 tons). The estimated cumulative volume of ash placed between 1987 and 2000 is approximately 130,000 cubic yards. In order to achieve the maximum dilution of ash with spoils, the ash is distributed over as much pit length as possible. The typical annual pit length requirement is 700 feet for storage and disposal activities. Ash placement at the Savage Mine is performed in accordance with the following procedures:
• Ash placement occurs above the saturated zone of the anticipated postmine groundwater table. This level is achieved by placing 25 to 30 feet of ash-free spoils material at the pit bottom prior to ash placement.
• The dragline distributes the ash over the length of the pit.

18
• The dragline alternates buckets of ash with as many buckets of spoil material as possible to achieve maximum mixing and homogeneous dilution.
• Ash disposal will be kept to a minimum depth of 8 feet below the final postmine
surface.
4.4.1 Local Geology The regional geology surrounding the Savage Mine is characterized by broad gravel-capped uplands between wide troughlike valleys. At least five terrace gravel deposits have been identified in proximity to the Savage Mine and are attributed to river deposits that were transported into the eastern portion of Montana from mountains in the western and central parts of the state. The permit area of the Savage Mine is located on the east-central portion of a remnant terrace from the Yellowstone River known as Breezy Flat. Surficial sediments in the vicinity of the Savage Mine are derived from the Tongue River Member of the Fort Union Formation primarily comprising light yellow to gray, massive to cross-bedded sand and light gray, silty clay. These unconsolidated deposits ranging from about 30 to 60 feet thick form approximately one-half of the total overburden thickness at the site. The lower portions of the site overburden comprise mostly gravel and sand. The Tongue River Member also contains several thick and laterally continuous lignite beds and limestone. Lignite from the Tongue River Member is removed during mining operations. The lignite ranges in thickness from 15 to 25 feet.
4.4.2 Local Hydrogeology Groundwater is derived primarily from sands and gravels that cap terraces in areas around the Savage Mine and serves both livestock and domestic needs. Typical shallow aquifer yields are on the order of 5 to 20 gallons per minute (gpm). Groundwater is considered to be of good quality, with sandstone aquifers producing groundwater with softer and more mineralized characteristics as compared to the lignite aquifers. The permit area is recharged by direct infiltration during snowmelt and rainfall events and by lateral underflow from adjacent unmined areas. Transmissivities calculated from pumping test data collected from Wells OB-1 and OB-2 are from 0.13 to16 ft2/day. The limited transmissivity of the Pust coal has been attributed to a limited recharge area, highly variable topographic relief of the coal bed, and limited fracturing in the coal. The stratigraphy of the Fort Union Formation and the overlying sediments at the Savage Mine and adjacent regions dictate local groundwater flow patterns. Potential water-bearing units disturbed by mining operations include the surficial sand and gravel and the Pust coal. Postmining protocol involves replacing these units with a saturated zone at the base of the spoils. The surficial sand and gravel at the site do not serve as an aquifer because of the lack of adequate recharge area, thickness, and rainfall. The unmined coal in the western part of the site is thought to form a continuous aquifer with the base of the mined-out spoil. The prevailing groundwater flow direction at the site is to the south/southeast.

19
Groundwater elevations in wells completed in the Pust Coal upgradient of the mine operations have remained relatively stable since 1986. Groundwater levels in Wells 261 and 284 generally have fluctuated less than 1 foot over the period of record. Groundwater levels in Wells OB-1 and OB-2 located immediately west of the mine activities have been influenced by mine-dewatering operations and have declined approximately 3 to 6 feet, respectively, over a 7-year period. Groundwater elevation declines of approximately 2 to 3 feet have been observed over the past 8 years in wells screened in mine spoils. Once mine operations cease, groundwater levels are anticipated to rise as a result of discontinuation of groundwater-dewatering operations. It is also expected that the spoils will not serve as a dependable source of water supply under postmining conditions.
4.4.3 Ash-Leaching Characteristics Batch-type laboratory leaching analyses on Savage coal ash are performed annually prior to placement in the surface pits. The tests are performed by mixing ash samples with water at an ash-to-water ratio of 1:1 (by weight). The test results from 1987 to 2000 and corresponding water quality standards for a range of constituents are summarized in Table 4.12. The results indicate that pH values of the leachate tend to be elevated relative to water, which is beneficial for limiting the generation of acidic leachate from the spoils. Also the average and maximum leached concentrations of most constituents, most notably As, Cr, and Pb, are below current water quality standards. On average, federal and/or state standards are exceeded for Cl, NO2+NO3, and SO4, while elevated individual values for pH and Cd have been measured. Boron (B) is present in the leachate samples. However, federal or Montana water quality standards are not established for B.
4.4.4 Groundwater Quality Approximately 36 wells have been identified both outside and within the mine permit boundary. All of these wells except 003, 262, OB-1, and OB-2 have temporal groundwater quality information, predominantly metals analysis. Wells 108, 108A, and 109 are no longer in service because mining operations required the removal of these wells. Wells located upgradient of the site include ETZEL NORTH, LANGE NORTH, LANGE SOUTH, 261, 262, 263, and 284. Wells located downgradient of the ash backfill areas include Wells 002, 003, 005, 286, 289, 290, 291, and ETZEL SOUTH. General groundwater quality has been characterized in a report for ash placement in the mine. Pust coal groundwater is considered to be of very high quality for eastern Montana and ranges from slightly basic to slightly acidic (i.e., <6.4 to 7.7). The groundwater also is classified as calcium, magnesium bicarbonate type water. Sulfate levels in groundwater for spoils tend to be elevated in proportion to bicarbonate. Groundwater in contact with spoils is more acidic, with a pH range of 6.3 to 7.0 in comparison to the groundwater contained in coal aquifer. Groundwater metals analyses have been conducted on an annual basis for monitoring wells both upgradient and downgradient of ash placement. Analyses have been conducted since 1979 for TDS, SO4, Cl, NO3, Ca, Mg, Na, Fe, and Mn, while trace metal analyses (i.e., As, B, Cd, Cr, Pb, Ni) have been performed for post-ash placement conditions since 1986. Trace metals were

20
not analyzed prior to ash placement. However, because trace metal analysis was performed in laboratory leaching studies on the ash (see Table 4.12), qualitative assessments can be made regarding ash constituent contribution to groundwater quality.
4.4.4.1 Trace Metals Historical groundwater concentrations (maximum and mean) of As, B, Cd, Cr, Pb, and Ni for monitoring Wells 001, 106, 261, 263, 284, 286, 289, 290, and 291 from 1986 to 2000 are compared to Montana groundwater quality standards in Table 4.13. The results indicate that, on average, trace metal concentrations are below current Montana State maximum contaminant levels (MCLs) in all of these wells, with the exception of arsenic in Well 291. The historic mean concentration of arsenic in Well 291 (0.20 mg/L) is an order of magnitude higher than the current MCL (0.02 mg/L). The MCL for arsenic also has been exceeded on occasion in Well 290. Well 290 is approximately 700 feet downgradient (east) of Pit 3, and Well 291 is located immediately downgradient (east) of Pit 4. However, it is unclear whether the elevated arsenic levels in these wells are due to release of arsenic from the ash. Historic ash-leaching test results given in Table 4.12 indicate that the amounts of arsenic mobilized from the ash are not sufficient to account for the elevated arsenic concentrations in Wells 290 and 291, particularly considering that the ash is mixed with mine spoils during placement. Although no chemical analyses of the spoils are available for this study, the spoil material itself may contain arsenic that could be released into site groundwater. Historic arsenic concentrations in Wells 286, 289, 290, and 291 versus time are plotted in Figure 4.13. Well 290 demonstrated slight arsenic exceedances of the Montana MCL in September 1995 (0.021 mg/L) and in October 2000 (0.023 mg/L), whereas elevated levels of arsenic has been observed in Well 291 for nearly all of the sampling events since 1986. Overall, arsenic levels in Wells 290 and 291 have fluctuated over time but generally have increased since ash placement. Surprisingly, arsenic levels in downgradient Wells 286 and 289 historically have remained below the Montana MCL, even though these wells also are located within 500 feet of the pits. The results in Table 4.13 also indicate that concentrations exceeding the Montana MCL were observed periodically for Cd and Pb in nearly all of the selected wells, including upgradient wells. Thus elevated Cd and Pb concentrations in downgradient wells likely are not due to leaching and migration of these constituents from the ash. However, no conclusions can be made regarding the impacts of ash placement on groundwater quality since the reported detection limit (i.e., 0.01 mg/L) for Cd in most of the historic analyses is higher than the current Montana MCL (i.e., 0.005 mg/L). Elevated nickel was observed during a single sampling event in upgradient Well 284 and in downgradient Well 106. Chromium has not been detected in any of the wells since 1986.
4.4.4.2 Other Constituents Analyses of SO4, Cl, NO3, Ca, Mg, Na, Fe (total and dissolved), and dissolved Mn were performed for most of the monitoring wells. Other analyses on groundwater from these wells included pH, temperature, electrical conductivity, and TDS. Consistently elevated historical
21
concentrations of TDS, SO4, and Fe have been observed in both upgradient and downgradient wells. The state of Montana has not established MCLs for these constituents. Maximum and mean historical concentrations of TDS and sulfate measured in selected wells prior to and after ash placement in the mined pits are compared with the federal secondary MCLs in Table 4.14. The majority of monitoring well data shown in Table 4.14 indicates that TDS and/or SO4 levels are consistently above the secondary MCL before and after ash placement. Elevated concentrations of TDS and SO4 also are evident in both upgradient and downgradient wells relative to the ash-filled pits. These results indicate that the high-TDS and SO4 concentrations are not due solely to the release of constituents from the ash but are indicative of postmining groundwater quality that is commonly encountered at other coal mine sites. However, increases in TDS and/or SO4 levels have been observed in certain downgradient wells since ash placement operations began in 1986, most notably in Wells 286 and 291 along the western edge of Pit 4. Iron (Fe) was detected at levels above the national secondary MCL of 0.3 mg/L for monitoring Wells 001, 105, 106, 110, and 111 prior to ash placement. Although measured Fe concentrations in the years following ash placement are not available in many of the wells, Fe concentrations in downgradient Well 001 decreased from an average of 1.32 mg/L prior to ash placement to 0.17 mg/L after ash placement. Overall, no obvious groundwater impacts due to release of Fe from the ash are evident at the site based on the available data.
4.5 Storm Strip Mine (WV) This case study involves placement of coal ash in an active coal strip mine. The downgradient groundwater-monitoring data reveals no evidence of contamination over the 10-year period of operation. Coal ash (both bottom ash and fly ash) is being placed at a rate of about 800,000 tons annually in an active strip mine near an electric power plant in West Virginia. The strip mine provides coal for the power plant and is located on the plant property. Ash placement began in 1987. No ash has been placed below the water table because the groundwater table is deeper than the mine floor. Monitoring Well MW1 is located deep underneath the land surface and is regarded as an upgradient well. No strip mining of coal has taken place near this well, which is screened in rock and coal about 130 ft below the ground surface. GWM2 is located upgradient of the ash fill area, and Wells MW6 and MW7 are located downgradient of the ash fill area. GMW2 is screened 40 ft below ground surface also in rock and coal. MW6 and MW7 wells are screened 25 ft and 60 ft, respectively, below ground surface. Groundwater quality-monitoring data from the four wells have been collected since 1987 for several metals, pH, alkalinity, conductivity, and sulfate. The Solid Waste Division of the state of West Virginia has issued a permit for a landfill involving the placement of coal ash in the strip mine. Summary statistics of the monitoring results for eleven chemical parameters for aluminum, iron, pH, sulfate, and arsenic data trends or changes in these water quality parameters which may be associated with the ash placement in the coal strip mine. Aluminum concentrations in Wells MW1 and MW7 were below detection limits. Well MW6 shows aluminum below detection

22
limits with occasional measured concentrations between 0.2 and 0.6 mg/L. Only Well GMW2 showed aluminum concentrations above detection limits that range between 0.1 and 0.8 mg/L. There is no time trend indicated for aluminum. These aluminum data indicate that the upgradient well is the only well that contains a measurable amount of dissolved aluminum. All other monitoring wells are unaffected for aluminum, demonstrating no effects from the placement of coal ash. Iron shows considerable variability and is measured above detection limit in upgradient Wells GMW2 and MW1. Well GMW2 appears to show an increasing trend. Both downgradient Wells MW6 and MW7 show low iron concentrations, averaging about 0.35 mg/L compared to an average concentration of about 7 mg/L for Well MW1 and an average concentration of 5.8 mg/L for Well GMW2. The time-series graph for iron in Well GMW2 indicates an increasing trend over the monitoring period of more than 10 years. The pH in this well also appeared to be decreasing, which may be related to the increasing iron concentrations. The pH at Well MW1 is nearly constant at around 7 for the entire monitoring period. There is relatively more variability in pH measured at MW6 and MW7, with averages of 6.25 and 7.70, respectively. All these monitoring data show that placement of ash in the strip mine has not affected pH in the downgradient groundwater. Sulfate concentrations in the four monitoring wells show four different behaviors. Background Well GMW2 has an average sulfate concentration of about 12 mg/L, with a range from about 4.5 to 18.5 mg/L. There is no time trend indicated by the monitoring data. Sulfate in MW1, an upgradient well, shows an average concentration of about 225 mg/L, with a range from 7.5 to 483 mg/L. It appears that there was an increase in sulfate concentration for a period of time, followed by a decrease. Sulfate at MW6 is also low in the range of 3 to 18 mg/L. However, the sulfate concentrations show a decreasing trend over the more than 10 years of monitoring. Monitoring Well MW7 has consistently shown measured sulfate concentrations to be near 5 mg/L. However, there are four values out of 47 observations that are in the range of 55 to 200 mg/L. Arsenic data show that it is not above detection limits in all four wells. Arsenic concentrations above detection limits were observed only twice in over 160 measurements.
4.6 Universal Mine (IN) The Universal coal Mine site is located about 5 miles north-northwest of Terre Haute, Indiana in Vigo County. The site is adjacent to the eastern boundary of the eastern region, Interior Province coalfields of Illinois and southwestern Indiana. These mine fields have typically produced medium-to-high-volatility bituminous coals of Pennsylvanian and Permian geologic age. The south embankment of the Universal site ridge was augur-mined during the 1940s and 1950s. Peabody Mining Company began and completed highwall mining operations at the Universal site along a north–south line in the mid-1980s, creating a final cut pit which was approximately 1920 feet long, 325 feet wide, and about 90 feet deep. In 1988, PSI Energy, Inc. (now Cinergy Corporation), acquired a portion of the Universal Mine site containing the final cut pit for the express purpose of coal ash deposition and surface
23
mine reclamation. Indiana DNR issued a permit to PSI Energy to dispose of fly ash/bottom ash from its nearby Wabash River Station to fill and reclaim the mine pit. The permit allowed for approximately 1.448 million cubic yards of CCPs to be disposed of with ash deposit thickness ranging from 30 to 75 feet. Between April 1989 and the end of October 2001, Cinergy placed approximately 1.6 million tons of coal ash from a nearby power plant to completely fill the open pit. Table 4.15 shows the annual tonnage of coal ash and coal gasification slag placed in the mine pit at the Universal site during the 13.5 years of mine-filling operation. Cinergy has been conducting quarterly monitoring of groundwater and surface water at the Universal ash fill site since early 1988. The coal ash was hauled by triaxle road-going trucks and placed dry in the mine pit. The coal ash was deposited in the mine pit until the height of the filled area corresponded to the approximate original topographic contour. A 5-foot noncompacted soil cap and vegetation are being established as a final cover. The reclaimed mine pit land is to be maintained as a wildlife refuge.
4.6.1 Hydrogeology The geology of the premined consolidated strata consisted of a thin layer of fine clay overlain by an 18-inch-thick coal seam that was overlain by shaley limestone, shale, and a thick deposit of loess. The exposed high wall at the Universal site showed a mantle of about 12 to 16 feet of pre-Wisconsin till and Wisconsin loess over the bedrock. The Universal site area is part of an upland landscape north of Coal Creek and west of the Wabash River. The upland rises about 100 feet above the Coal Creek flood plain and was well dissected before surface mining altered the topography. The water level elevation data from the groundwater-monitoring wells at the Universal site indicate that the groundwater from the unmined east side of the ash fill area is flowing to the west into the ash that has resulted in approximately 30 ft of saturated zone in the reclaimed mine pit. The groundwater then flows in a radial manner to the west, north, and south. This groundwater flow field implies that monitoring Well MW-4 is the upgradient well and that all other wells are hydraulically downgradient of the placed coal ash.
4.6.2 Chemical Composition of Coal Ash and Leachates Between May 1988 and December 2001, 25 samples of coal ash were collected and analyzed for total chemical concentrations and for 18-hour and 30-day leachate concentrations. Table 4.16 provides a statistical summary given by mean, median, maximum, and minimum values based on the measured concentrations for the bulk ash samples. Table 4.19 provides a statistical summary for the 18-hour and 30-day leaching tests completed on the same ash samples. Table 4.18 contains a statistical summary of field leachate composition data based on 17 samples collected and analyzed from leachate monitoring Well MW-8 installed in 1997. The coal ash deposited at the Universal site contains aluminum, iron, potassium, calcium, magnesium, sulfate, sodium, and boron at average concentrations of greater than 240 mg/kg. Manganese, zinc, barium, arsenic, vanadium, nickel, chloride, lead, chromium, copper, and

24
fluoride are present in the average concentration range of 18 to 128 mg/kg. Molybdenum, selenium, cadmium, silver, and mercury are found to range from nondetect to an average of about 5 mg/kg. The coal ash is alkaline, with an average pH above 9.0 has a net neutralization capacity of about 17.6T/1000T, and contains about 5.8% total organic carbon. The laboratory-generated leachates as well as the field leachate data show that all leachates contain sulfate as the most abundant constituent released from the coal ash. Aluminum, boron, sodium, and calcium were the next most abundant constituents in the laboratory-generated leachates. The field leachates, however, showed that calcium, sodium, chloride, boron, and potassium were the next most leached constituents (Table 4.18). The laboratory-generated leachates contained no silver, mercury, nickel, or lead. The field leachates contained no dissolved cadmium, chromium, copper, iron, lead, mercury, nickel, selenium, silver, or zinc. Field and laboratory leachates also showed arsenic, with some variability in concentration. Time-series plots for pH, sulfate, boron, and arsenic in leachate monitoring Well MW-8 are given in Figures 4.14 through 4.17. These plots show that ash leachate has a pH of over 9 throughout the monitoring period of 1997–2001, with no measurable acidity. The sulfate concentration in the ash leachate appears to be holding at about 1700 mg/L, and boron is present at a concentration of about 45 mg/L. The field leachate data indicate that ash leachate at the Universal site is highly alkaline and contains about 200 to 300 mg/L each of chloride and sodium. However, both sodium and chloride concentrations in the leachate show a rapid decrease over the monitoring period, indicating a near depletion of these constituents in the fly ash. MW-8 monitoring data show an initial increase in arsenic concentration in the ash leachate followed by a steady concentration ranging between 180 and 250 µg/L.
4.6.3 Water Quality-Monitoring Program Both groundwater and surface water are monitored on a quarterly basis for the compliance-monitoring program by Cinergy. The Universal site originally installed four groundwater-monitoring wells (i.e., MW-1, MW-2, MW-3, and MW-4) in May 1988, approximately 1 year before the placement of coal ash began in April 1989. MW-4 is an upgradient well installed in the undisturbed bedrock formation and has been monitored for water level and water quality since May 1988 on a quarterly basis. Monitoring Well MW-1 was installed to the northeast side of the ash fill and had a long screen covering both the bedrock and the overlying spoil material. The MW-1 well was replaced in December 2000 by two new wells designated as MW-1BR and MW-1UR. Monitoring Well MW-2 was installed at the edge of the mine fill to the west presumably in the downgradient direction of the groundwater flow. This monitoring well was replaced by a new Well MW-2A in 1997 which was properly screened in the mine spoil material to the west and downgradient of the ash fill. Original Well MW-3 was installed to the south of the ash fill area, approximately 30 ft downgradient in the mine spoil material. This well was replaced by MW-3R in December 2000. In 1997, additional compliance Wells MW-5, MW-6, and MW-7 were installed in the mine spoil material downgradient of the ash fill. In 1997, MW-8 was installed in the ash fill to monitor chemical composition of the ash leachate. Therefore, the longest series of groundwater-monitoring data is available from monitoring Wells MW-1, MW-3, and MW-4, with a somewhat
25
shorter time-series of monitoring data from Wells MW-2, MW-2A, MW-5, MW-6, MW-7, and MW-8. Replacement Wells MW-1BR, MW-1UR, and MW-3R are relatively new and have the shortest set of time-series data. As part of the compliance-monitoring effort, Cinergy has also been sampling and analyzing surface water samples from an old mine seep location since 1988. Cinergy has since then added five more surface water quality-monitoring locations to its compliance-monitoring program. These sampling locations are designated as North Pond, Ash Pit-Water Pond, Plug Seep, and two locations in the Coal Creek. In this summary paper, we will only present and discuss the mine-seep water quality data to depict the benefits and impacts of coal ash placement on surface water at the Universal site. Table 4.19 provides a list of parameters that have been measured in the water quality samples collected in the groundwater- and surface water-monitoring program at the Universal site.
4.6.4 Groundwater Quality Results Groundwater quality-monitoring data from Wells MW-1, MW-2, MW-2A, MW-3, MW-4, MW-5, MW-6, and MW-7 were evaluated for time trends and changes in concentrations that may be related to the placement of ash. It was determined that aluminum, cadmium, chromium, copper, mercury, nickel, and silver concentrations in groundwater in these wells during the period 1988 through 2001 were at or below analytical detection limits. Therefore, no further discussion of these constituents is included in this report. The data analysis also indicated that sulfate concentrations in groundwater at Wells MW-2, MW-2A, MW-3, MW-5, MW-6, and MW-7 are significantly higher than those found at MW-1 and MW-4. Boron concentrations in monitoring Wells MW-1, MW-2, MW-2A, MW-3, MW-5, and MW-6 are significantly higher than those found in groundwater at Wells MW-4 and MW-7. The groundwater pH in most wells is near neutral, with a narrow range of 6.8 to 7.2. However, MW-3 groundwater has the lowest average pH, at about 6.4. The nearly 13 years of quarterly groundwater-monitoring data also show that the waters are alkaline, with notable concentrations of chloride, magnesium, and sodium. The groundwater at the site also contains several mg/L of total organic carbon. The groundwater quality-monitoring data also show no significant differences in concentrations of barium, cadmium, chromium, copper, fluoride, lead, mercury, nickel, selenium, silver, and zinc. Sulfate is present at low levels in monitoring Wells MW-4 and MW-1, but is found at concentrations between 500 to 2,000 mg/L in Wells MW-2, MW-2A, MW-3, MW-5, MW-6, and MW-7. MW-3 contains higher levels of iron, manganese, and boron. Boron concentrations are also higher in groundwater at MW-1, MW-2, MW-2A, MW-5, and MW-6 compared to those found in Wells MW-4 and MW-7. The pH in groundwater wells at the site generally falls in the range of 6.8 to 7.2 except for MW-3, which showed a slightly more acidic pH of about 6.4. Since MW-3 and MW-4 wells data contain water quality measurements both before and during ash placement from 1988 through the end of 2001, we focused on presenting and discussing those data in this report. The quarterly monitoring data for pH, acidity, alkalinity,
26
manganese, iron, sulfate, chloride, boron, and arsenic are presented in Figures 4.18 through Figures 4.26 as time-series plots. There are several observations that can be extracted from these time-series plots. The pH time-series plot (Figure 4.17) indicates that throughout the 13.5 years of monitoring, pH in groundwater at downgradient Well MW-3 is somewhat acidic compared to the near-neutral pH in upgradient Well MW-4. Groundwater in Well MW-3 contains about 200 mg/L of acidity, whereas MW-4 contains essentially no acidity (Figure 4.18). Both MW-3 and MW-4 groundwater contains over 350 mg/L alkalinity with MW-3 groundwater being more alkaline than MW-4 from the 1988 through 1998 time period. Both MW-3 and MW-4 have alkalinity of about 450 mg/L between 1998 through 2001 (Figure 4.20). Figure 4.21 shows the time-series plot of manganese concentrations. The upgradient well shows no measurable amounts of manganese for the entire monitoring period, whereas MW-3 has shown manganese being present in several mg/L concentrations. There appears to be a decrease in manganese concentrations in MW-3 groundwater over the 13-year monitoring period. These monitoring results indicate that dissolved manganese was present at about 5 mg/L level in groundwater downgradient of the ash fill area before the ash was placed and, therefore, the observed manganese concentrations in MW-3 are not associated with the placement of ash in the mine pit. Figure 4.22 shows the time-series plot of dissolved iron in groundwater at monitoring Wells MW-3 and MW-4. Upgradient Well MW-4 shows an absence of dissolved iron in the groundwater, whereas downgradient Well MW-3 shows an average of about 20 mg/L iron. Dissolved iron at this elevated concentration was present in Well MW-3 before ash placement. The monitoring data lead us to recognize that groundwater in downgradient Well MW-3 contains elevated dissolved iron concentrations that are not associated with the placement of coal ash in the Universal mine pit. Figure 4.23 shows the time-series plot of sulfate in groundwater at Wells MW-3 and MW-4. The upgradient groundwater measured in MW-4 in an undisturbed geological setting has an average concentration of about 53 mg/L of sulfate, whereas the groundwater in downgradient Well MW-3 screened in the mine spoil material has sulfate concentrations of around 1500 mg/L. It is noted that sulfate was present at these elevated concentrations at MW-3 in water samples collected before ash placement and that subsequent to ash placement the sulfate levels has not increased in the period from 1989 through 2001. This time-series behavior leads us to conclude that even though sulfate is an ash leachate constituent, it has not impacted the downgradient groundwater at MW-3 at the Universal site. Figure 4.24 shows the time-series plot of measured chloride concentrations in groundwater at MW-3 and MW-4. The average chloride concentration in upgradient Well MW-4 is about 11 mg/L, and downgradient Well MW-3 contains about 18 mg/L. Chloride in groundwater at these two wells is pretty low and requires no further discussion. Figure 4.5 shows the time-series plot for boron concentrations in groundwater at Wells MW-3 and MW-4. This plot indicates that background Well MW-4 contains an average concentration of about 0.4 mg/L of boron. The boron concentrations in groundwater at MW-3 do show an increase after early 1990 lasting through 1997 before showing a decrease during 1998

27
through 2001. The average boron concentration in groundwater at MW-3 is about 2.1 mg/L. Boron is a known leachate constituent associated with coal ash. The field-scale leachate-monitoring data show that boron is present in the ash leachate at the site in over 40-mg/L concentrations. Therefore, it is inferred that the elevated boron concentrations in groundwater at MW-3 may be a result of ash leachate migration even though there is an approximate 20-fold decrease in concentration between the source and downgradient monitoring Well MW-3. Figure 4.26 shows the time-series plot for dissolved arsenic in monitoring Wells MW-3 and MW-4. The average dissolved arsenic concentration in upgradient Well MW-4 is 5 µg/L, with over 95% of the data showing below-detection-limit values. The measured arsenic in MW-3 shows an increase during the monitoring period 1989 through 1996 and then a large variability in concentrations measured during 1997 through 2001. The maximum measured concentration of arsenic in MW-3 was 35 µg/L, with about 43% of the data showing below-detection-limit values. The ash leachate data from MW-8 and data from the laboratory leaching tests showed arsenic concentrations to range from about 200 to 300 µg/L. Further research at the Universal site is now evaluating the release and migration of arsenic in groundwater to accurately describe the fate of leached arsenic from coal ash.
4.6.5 Surface Water Quality AMD was present at the Universal site. AMD was caused by the oxidation of pyrites because of coal-mining operations. An old mine seep is present to the southeast of the ash-filled mine pit. The mine seep water flows through a surface channel into Coal Creek, located at least 1500 feet further south of the mine seep area. This old mine seep water has been sampled quarterly and analyzed for chemical parameters listed in Table 4.18. We have prepared time-series plots for pH, acidity, alkalinity, manganese, iron, sulfate, chloride, and boron measured in the old mine seep water from May 1988 through the end of 2001. Figure 4.27 is the plot of pH which shows that prior to coal ash placement, the mine seep water was highly acidic (i.e., pH < 3.5) which has been completely neutralized to pH 7 by the coal ash deposit in the mine pit. The neutralization of the acidic pH is consistent with the alkaline chemical characteristic of the coal ash. Figure 4.28 shows the time-series plot for measured acidity in the mine seep water. The AMD water contained a large amount of acidity before coal ash placement in the mine pit. Within 1 year of ash deposition, the acidity in the mine seep water was nearly eliminated, again because of the acid neutralization capacity of the coal ash placed in the Universal Mine pit. Figure 4.29 is a time-series plot of measured alkalinity in the mine seep water. This plot shows the absence of alkalinity during 1988 to 1990, followed by a gradual increase in alkalinity through the end of 2001. Therefore, the coal ash not only neutralized acidity and increased the pH of the groundwater feeding the mine seep, it has also generated additional alkalinity to provide further improvements to water quality. Figures 4.30 and 4.31 are the time-series plots of measured concentrations of manganese and iron, respectively, in the mine seep water. Before the coal was placed in the mine pit, the

28
mine seep, an AMD water, was quite high in dissolved iron (over 100 mg/L) and manganese (over 7 mg/L). But within a year of ash placement, both iron and manganese concentrations decreased significantly. The long-term monitoring further indicates that dissolved iron has continued to decrease and has essentially reached to a nondetect level, with manganese also showing a gradual decrease to a concentration of below 2 mg/L in 2001. These decreases are due to the neutralization of acidity and increase in pH achieved by the alkaline ash. Increases in pH and alkalinity have precipitated the dissolved iron and manganese. It is also possible that the lack of oxygen may have stopped the generation of AMD through oxidation of pyrites. Figure 4.32 is a time-series plot of sulfate concentrations measured in the mine seep water. This plot shows a notable decrease in sulfate concentrations as a function of time. The sulfate levels of over 2000 mg/L in 1988 are now reduced to about 1500 mg/L in 2001. The initially high sulfate concentrations most likely were a result of pyrite oxidation which produced sulfate, iron, and acidic pH waters with low levels of calcium and other base cations in the water. The alkaline coal ash provided large amounts of calcium as well as alkalinity through the leachate. This ash leachate mixed with AMD waters and resulted in the precipitation of iron hydroxide(s) as well as gypsum, thereby creating the modified water quality of the mine seep that is now low in iron and sulfate compared to the original AMD waters. Therefore, even though sulfate is a coal ash as well as mine spoil-derived constituent, in this case there is no distinguishable impact of sulfate on the water quality in the mine seep. Figure 4.33 shows a time-series plot of chloride measured in the mine seep water. This plot shows a slowly increasing trend in chloride concentrations, but the chloride levels were still less than about 100 mg/L in 2001. Figure 4.34 shows a time-series plot of boron concentrations in the mine seep water samples monitored since May 1989. For the first 2 years of monitoring, boron concentrations in the mine seep water were less than 1 mg/L. Beginning in May 1991, the boron concentrations increased steadily, with the highest concentration of about 5 mg/L recorded in 2001. This time-series behavior and the documentation that coal ash leachate at this site contains over 45 mg/L of boron led to the conclusion that boron contained in the ash leachate has resulted in the elevated boron concentration in the mine seep water samples.
4.6.6 Summary and Conclusions This paper provides a limited summary of monitoring results on water quality at a coal ash-filled surface coal mine pit in Indiana. The over 13.5 years of quarterly water quality-monitoring data and the more recent extended spatial monitoring data provide insights on coal ash leachates and water quality changes when coal ash has filled and reclaimed a final cut mine pit at the Universal site. The monitoring data to date indicate that the alkaline coal ash leachate has been effective in improving AMD water quality present at the site. The coal ash leachate neutralized the acidic pH, increased alkalinity, essentially eliminated acidity, and significantly decreased manganese, iron, and sulfate concentrations. There were no indications of any other trace metal migration via the mine seep. However, the coal ash leachate did significantly increase boron concentrations in the mine seep water.
29
The groundwater quality data similarly show that coal ash leachate has not resulted in the leaching and migration of most of the trace metals contained in ash. Boron, arsenic, and sulfate are leached from the coal ash in different amounts. However, because of the presence of sulfate in groundwater in the spoil material, it is not feasible to discern the migration of sulfate contained in the coal ash leachate from the sulfate contributed by the mine spoil material. Trace metals such as barium, chromium, cadmium, copper, lead, mercury, nickel, selenium, and silver all show no signs of leaching or impacting the groundwater and surface water quality around the site. The laboratory and field leachates do show leaching of arsenic from the coal ash, but over the nearly 13-year period of monitoring it appears that arsenic has not migrated and impacted downgradient groundwater or surface water quality. The continuing monitoring and the supplemental research at the Universal site will provide a better understanding of the benefits and impacts from the use of coal ash for mine filling in the next few years.
4.7 Midwestern Abandoned Mine (IN) This case study is an example where a state agency elected to place CCPs with a Poz-O-Tec (a mixture of FGD sludge, fly ash, and quicklime) cap, which resulted in reduced infiltration and improvement in water quality by neutralization. The Midwestern Abandoned Mine consists of approximately 550 acres of previously mined land, which in some instances intersects with abandoned deep mining of the same coal seam. The Midwestern site is located within a 6000-acre Mill Creek Abandoned Mine Land Area which was partially reclaimed in the early 1980s as part of Indiana’s Abandoned Mine Land Program. Deposits of pyritic coarse- and fine-grained refuse were surrounded by high walls associated with final cut pits; ponded water and seepage from an abandoned underground mine further characterized the site. The Indiana Department of Natural Resources Division of Reclamation (IDNR DOR) conducted extensive evaluations including review of laboratory test results and a review of state and federal regulations to decide that CCPs could be utilized for the reclamation of abandoned mined land (AML). The reclamation project consisted of placing and compacting of CCPs and then covering with Poz-O-Tec. The technical specifications required the water to be removed from the highwall pits to facilitate proper placement of the ash into these areas. In actuality, the pits would not drain because of an interconnection to flooded underground mines and the existing groundwater table. To solve this problem, ponded ash was placed along the perimeters of the pits near the areas where the opening to the underground mines were located. This placement of the coal ash through the pit water was compacted enough to seal off the underground connection to prevent further migration of groundwater into the pits. The placement of ponded ash into these pits raised the pH of the pit water and the metals precipitated out of solution. This allowed the IDNR to pump out the pits without the use of a water treatment system before discharge, and the alkalinity in the ash replaced the need for calcium hydroxide addition for pH adjustment. Since completion of the reclamation, the groundwater has returned to the normal water level and the ash fill areas are below the water table. The Indiana Geological Survey has conducted a monitoring program covering 1 year prereclamation baseline water quality monitoring and more than 1 year of postreclamation

30
monitoring. The objectives of the monitoring are to 1) determine the effectiveness of acid mine drainage abatement and 2) monitor the leaching of solutes from CCPs. Water samples from wells screened at different depths and several surface water discharge points have been analyzed for a number of chemical parameters. Figure 4.8.6 shows the location of these monitoring points for both the prereclamation and the postreclamation conditions. Olyphant et al. (1997) provided a summary of prereclamation water quality data for a selected set of monitoring locations. Branam et al. (1999) provided a summary of postreclamation water quality data for a selected set of monitoring wells and chemical parameters. Based on the monitoring results, Branam et al. (1999) concluded that using CCPs to reclaim the Midwestern Abandoned Mine has resulted in the reduction of AMD leaving the site. The authors ascribe this response to the reduction in vertical recharge of oxygenated water by the fixated scrubber sludge cap and the neutralization provided by the alkaline CCPs.
4.8 The Arnold Willis “City” Underground Coal Mine (IN) This case study is an example in which fixated scrubber sludge (FSS) has been successfully injected into an abandoned underground coal mine for stabilization by filling voids. Groundwater-monitoring data indicated that trace metals and sulfide remained unaffected by the placement of FSS. Coal was mined from the Arnold Willis “City” mine from the late 1940s to early 1950s. The depth to the voids in this underground mine varied from 32 to 64 ft, and the void thickness varied from 2 to 7 ft. Borings into the mine encountered both flooded and dry mine conditions. An FSS grout consisting of a mixture of FGD scrubber sludge, fly ash, lime, and water was developed for injection in the abandoned deep mine to abate surface subsidence and reduce acid mine drainage. A total of 12,502 m3 of FSS was injected over an 8-week period, resulting in filling of about 5 acres of the mine. Monitoring data show that the FSS material generally achieved unconfined compressive strengths of 100 psi or higher. Water quality monitoring was conducted over a period of 18 months. The first 6 months of monitoring was completed prior to FSS injection, and the following 12 months of monitoring occurred after the grout was in place. Figure 32 shows the locations of the monitoring points and Tables 4-8-1 through 4-8-16 provide the groundwater quality analytical data for the various locations and chemical parameters measured. The investigators reported that heavy metals in the water samples were relatively unaffected by the FSS injection. These metals include arsenic, cadmium, chromium, lead, selenium, aluminum, barium, and sulfide. The investigators also reported that acidity and pH did not appear to have changed as a result of the placement of FSS. However, sodium, potassium, calcium, boron, chloride, and magnesium showed some increases attributable to the FSS. Changes in sulfate, total dissolved solids, and specific conductance were also observed.

31
4.9 Harwick Mine Complex (PA)
4.9.1 Introduction The Harwick Mine Complex includes the Monarch, Old Harwick, and Cornell Mines, covering approximately 7000 acres. This coal mine is a deep mine and was operated from about 1932 through June 1970. The elevation of the mine varies from about 740 to 565 ft msl, with depth to coal ranging from 20 ft and 700 ft below ground surface. After coal-mining activities ceased, the mine workings were allowed to fill with water and are currently flooded. Water level in the mine is maintained by dewatering at the Monarch Mine Dewatering Station located at the Monarch Shaft. The entire mining perimeter is surrounded by a barrier of unmined coal isolating the Harwick Mine from the neighboring mines. Approximately 8 to 12 million gallons per day of mine water is pumped out, treated, and discharged to the nearby Little Deer Creek under an National Pollutant Discharge Elimination System (NPDES) permit. The Monarch shaft is located under the lowest portion of the mine; therefore, all Harwick Mine water flows to this shaft. Coal mining was carried out by room-and-pillar or other conventional methods with varying rates of coal extraction. In some areas, caving occurred soon after mining. In other areas, substantial voids remain within the mine.
4.9.2 History of Ash Injection in Mine Since 1970, Duquesne Light Company sluiced fly ash from its Cheswick Power Station into the abandoned Harwick Mine, which is located adjacent to the power station. Prior to the Cheswick Power Station, in July 1967, fly ash from the Colfax Station was injected as a slurry with river water to a worked out area of the Harwick Mine as an experiment, and the fly ash particles were allowed to settle. Then the water was pumped from the mine, treated, and discharged. The water treatment method employed neutralization, aeration, and clarification. The clear water was discharged to a nearby river under a mine drainage permit issued by the Pennsylvania State Sanitary Water Board. This pilot deep mine disposal operation lasted for almost 3 years and provided the basis for the sluicing of the fly ash from the Cheswick Power Station, which is the successor plant to the Colfax Station. It was noted that the use of fly ash in preventing mine subsidence was a benefit that could be derived from such an operation.
4.9.3 Ash Sluicing and Water Pumping Operations The mine disposal operation consists of a wet ash-handling system at the Cheswick Power Station which includes two 5000+-gpm pumps connected in series and approximately 8000 ft of slurry pipeline to two operating injection boreholes at the mine. The fly ash generated at the power station is mixed with water from ash handling operations, other intermittent low-volume wastewaters generated in the vicinity of the ash-handling operations, and additional sluicing water. The combined slurry (approximately 10% solids) is conveyed by the pipeline to an injection borehole into the Harwick Mine Complex. Approximately 3 to 4 million gallons per day of the slurry are conveyed.

32
Since 1970, a number of boreholes have been used as injection points until refusal. Additional locations for future boreholes have been identified, with a program for development and testing prior to use. Approximately 150,000 tons of coal ash is injected annually into the mine along with millions of gallons of water.
4.9.4 Coal Ash Characteristics Bulk and leachate chemical analyses of the coal ash from the Cheswick Power Station were conducted on samples collected in 1990. These results are shown in Table 4.20. These results indicate that the ash is neutral in pH and contains very low levels of leachable constituents. Even sulfate in the leachate is very low.
4.9.5 Mine Effluent Characteristics The utility company pumps out about 8 to 10 million gallons of water daily and treats it before discharge to the nearby river. Samples of the mine water have been collected and analyzed both before and after water treatment. Table 4.21 provides the chemical composition data from the Monarch Mine for a sample collected and analyzed in 1973. These results indicate that the mine water before treatment is slightly acidic, high in total dissolved solids, and contains over 100 mg/L of iron, over 2000 mg/L of sulfate, about 100 mg/L of chloride, and nearly 1000 mg/L of sodium. The water treatment results in an increase of pH to about 7.5 and a reduction of iron to below 2 mg/L, with no other changes in the concentrations of other dissolved constituents.
4.10 Clinton County (PA) This case study provides an example of the placement of fluidized-bed combustor (FBC) ash in a closed-surface coal mine resulting in beneficial effects on water quality because of the favorable geochemistry that occurs. The alkaline FBC ash neutralizes the acidic AMD waters, resulting in precipitous decreases in arsenic, cadmium, and aluminum concentrations due to lower solubility and precipitation of solids. Between 1974 and 1977, a 37-acre surface coal mine was mined and reclaimed. The upper split of coal was mined, leaving thick underclay as a pavement. Soon after the closure of the mine, acidic discharges were noted, averaging about 35 gpm and affecting water quality in the nearby streams. Schueck et al., (1996) conducted extensive studies of the site, locating piles of pyritic materials, buried refuse, and pit cleanings in the closed and reclaimed mine. A decision was made to use FBC ash, chosen for its pozzolanic properties, as a low-viscosity grout for pressure injection to encapsulate the pyritic material with a cementitious coating. Forty-two monitoring wells were installed on and adjacent to the site. In addition, a surface discharge point was monitored for water quality. Water quality monitoring was conducted from 1990 to 1995. The grouting with the FBC ash was carried out in 1992 and 1993. The water quality data from the pregrouting period show poor water quality, characterized by pH of less than 2.5, high total dissolved solids, high sulfate, high iron, high aluminum, high manganese, and

33
low calcium. Cadmium, copper, and chromium were also present in the water. Table 4.10.1 contains a summary of the monitoring results as presented by Schueck et al. (1996) to show that generally the water quality at the monitoring wells improved following the grouting by the FBC ash. These results indicated limited neutralization of the AMD, but more importantly, there are no indications that the groundwater quality is adversely affected by leaching of the FBC ash under highly acidic conditions. A monitoring well (L25) was monitored to evaluate the chemical changes that occurred as a result of the FBC ash injection into the acidic environment created by the oxidation of pyrites in the mine. The results indicated that the injection of grout caused a temporary increase in pH from about 2.3 to about 9 as the alkaline FBC ash neutralized the acidic AMD waters. The pH increase resulted in precipitous decreases in arsenic, cadmium, and aluminum concentrations, reflecting lower solubility and precipitation to solid-phase compounds. However, within a short time, the pH again became acidic, with sulfate and aluminum returning to the pregrouting concentrations, although arsenic and cadmium remained at much lower levels.
4.11 Big Gorilla Pit (PA)
4.11.1 Introduction In eastern Pennsylvania, there are several preact strip mine pits in the middle of the anthracite coal basin where active strip and deep mining for coal was practiced since the 1800s. The Silverbrook Basin contained two abandoned strip-mined pits. They are locally known as the “Big Gorilla” and the “Little Gorilla.” The Big Gorilla had an estimated volume of approximately 120 million gallons when the water level was at 1570 feet msl but can fluctuate by about +20 feet. It was approximately 1400 feet long, 400 feet wide, and about 90 feet deep before ash placement began. Big Gorilla pit was significantly affected by AMD. The Big Gorilla demonstration project involved dry-to-wet ash placement into standing mine water. The objectives of this demonstration project were 1) to show that large-scale placement of ash into mine water is possible with minimal turbidity generation, 2) to develop the methodology for large-scale ash placement, and 3) to demonstrate that ash in contact with mine water will not result in adverse environmental releases. Cogeneration ash, from the Northeastern Power Company (NEPCO) that produces electricity by burning culm as fuel, was first placed in contact with the surface mine pool in August 1997, which was then entirely filled by 2004. Over 3 million tons of ash was placed from two platforms to fill the Big Gorilla mine pool. Samples were collected and analyzed for water quality parameters from the standing water in Big Gorilla pit in 1993. Table 4.23 shows the water quality-monitoring data for before and after the placement of coal ash in Big Gorilla (Loop et al., 1999).
4.11.2 Mining and Reclamation The major coal beds in this region include Buck Mountain vein and Mammoth vein within the Llewellyn Formation. The Llewellyn also contains an abundance of pyrite and siderite minerals. The Silverbrook syncline is divided by the Centralia thrust fault, which surfaces at the

34
southern bank of the Big Gorilla mine pool. At this location, the Buck Mountain vein was deep mined at the turn of the 19th century. In the Silverbrook Basin, surface mining of the Mammoth vein ceased before World War II. Currently, NEPCO burns culm from this location and other nearby sites. In late 1940s, the basins created by mining the Mammoth vein were filled with coal silt. This silt was later reclaimed, and the present-day Big Gorilla occupies the No. 1 Basin. In 1994, clean fill was put into the western end of the Big Gorilla pit in order to build a terrace above the maximum high water level to prepare for dry land disposal of fly ash in accordance with existing permits and Department of Environmental Protection (DEP) regulations at that time. Filling the entire pit with clean fill was cost-prohibitive, whereas using fly and bottom ash from on-site avoided purchase and transportation cost in addition to having beneficial alkaline properties.
4.11.3 Regional Acid Mine Drainage Chemistry Mine discharge quality data have been collected since the 1940s in all four fields of the anthracite basin (Felegy et al., 1948; Ash et al., 1951). The Silverbrook Basin contributes to the Little Schuylkill River, and together with the other streams in the Little Schuylkill River Basin, is one of the most significant sources of sulfate in the southern field. When the Little Schuylkill River was sampled below Tamaqua, the pH was 5.4 and the sulfate concentration was 240 mg/L (Growitz et al., 1985). The water discharged from the 13 outflow sites contributing to the river was 18 cfs, approximately 23% of the flow at the sampled site below Tamaqua. Acidity values in 1975 (Growitz et al., 1985) and 1991 (Wood, 1996) were determined in the field on an ambient-temperature sample to the end points of both pH 7.0 and 8.3, and the values for the Silverbroook mine outflow increased from 80 to 234 mg/L CaCO3 and from 90 to 252 mg/L CaCO3, respectively (Wood, 1996). Thirty-eight samples of iron and sulfate concentrations between 1970 and 1993 were reported by Wood (1996). While the average concentration of iron in the Silverbrook discharge shows no apparent trend, the sulfate values have been decreasing, most notably in the 1970–1972 period and 1975, where the mean concentration decreased by over 100 mg/L.
4.11.4 Ash Placement and Characterization Ash was first deposited into the Big Gorilla mine pool in August of 1997. Fly ash from one silo and bottom ash from another were loaded into trucks in 45-ton loads and sprayed with water to prevent dust. They were then taken to the Big Gorilla mine pool ash platform and piled on the bank. Bulldozers were used to push the ash piles into the water from the lower platform, with the exception of the winter months, when ash was only placed from the edge of the upper platform. However, toward the end of the project, no distinction was made, as both platforms were found to be safe during the winter. When ash was pushed into the water, turbidity boils could be seen approximately 300 feet from the ash face. This indicated that at least the fine portion of the ash was flowing outward from the face, in a manner similar to that of a turbidity current. When
35
postplacement ash samples were taken from the bottom of the Big Gorilla, only fine material was recovered. In NEPCO’s case, ash is the by-product of burning culm and limestone to produce electricity. Approximately 1700 tons of culm and 60 tons of limestone are burned daily. Ash from the NEPCO cogeneration facility is reddish brown when wet and pinkish grey when dry. A greater variety of colors are observable in the bottom ash when compared to the fly ash. Fly ash particle sizes can be described as very fine, with a diameter in the 62–88-µm range. Bottom ash particles range from approximately 100 µm to 1 cm in diameter and are angular. Both the bottom and fly ash were subjected to testing by total digestion and analysis, in addition to leaching tests by the U.S. Environmental Protection Agency (EPA) Method 1311, TCLP, and later the synthetic precipitation leaching procedure (SPLP), EPA Method 1312. Table 4.24 provides an average of the results from 10 years of testing the fly and bottom ash from NEPCO.
4.11.5 Chemical Evolution of the Big Gorilla Mine Lake On July 9, 1998, the entire mine pool was both horizontally and vertically homogeneous, with a pH of approximately 11.1. Four samples were collected for aqueous analysis from the Big Gorilla mine pool prior to ash placement. A surface sample was collected in June 1993, and three variable-depth samples were collected in July 1993. While the surface samples from June and July have very similar chemistry, there is very distinct stratification with depth. Conductivity, total dissolved solids, turbidity, and acidity all increased with depth. Aluminum, sulfate, iron, manganese, calcium, and magnesium concentrations all increased with depth as well. The pH values from the samples taken at depth were measured in the laboratory and showed no consistent variation. When quarterly sampling results of the Silverbrook outflow from 1993 and 1994 are compared to the preash-placement chemistry of the Big Gorilla mine pool, the Silverbrook outflow had a higher pH, in addition to higher values for acidity, iron, manganese, sodium, chloride, calcium, magnesium, and total dissolved solids. Since October 1997, over 25,000 tons of fly and bottom ash had been placed in the Big Gorilla mine pool, and the mine pool water became alkaline. The water increased in alkalinity with increased ash input. Before the first winter, there was not a significant amount of alkalinity present, and values remained below 50 mg/L CaCO3 until June 1998. After June, there was a consistent increase in alkalinity, averaging 80 mg/L CaCO3 per month for the next 5 months. This trend ended when ash placement ceased for the winter. At that point, there was a decrease in alkalinity that was not reversed until ash placement resumed in July 1999. In early 1999, 2000, 2001 and 2002, alkalinity dropped dramatically, following significant suspensions in ash placement, indicating that the buffering capacity of the water was strongly tied to ash placement. Between March 2000 and May 2002 the Big Gorilla mine pool water did not fall below a pH value of 11.0. Based on the June through November 1998 data, which were taken during ash placement, an average of 1.24% of the calcium in the ash is available. A large reservoir of excess CaO is present in the ash.

36
High sulfate concentrations are one of the key features of AMD impacted streams. Total sulfate concentrations in the Big Gorilla mine pool in November 1998 were approximately 147 mg/L. Initially, the Big Gorilla mine pool water had sulfate concentrations ranging from 55 to 79 mg/L. Since July 1998, sulfate concentrations have risen in response to ash input. The sulfate concentration in the Big Gorilla has been as high as 1021 mg/L, measured in August 2001. In four months, however, it had decreased to 800 mg/L, and within the year, it was less than 600 mg/L. The pre-ash-placement Big Gorilla mine pool had an average iron concentration of 0.70 mg/L. Since ash placement began in 1997, total iron concentrations have dropped, often to below 0.2 mg/L. Iron concentrations respond to ash input in the Big Gorilla. Lower-iron aqueous concentrations are most likely due to the high pH, which causes the precipitation of iron. Pre-ash-placement concentrations of manganese in the Big Gorilla ranged from 0.71 mg/L to 0.97 mg/L. With two apparently anomalous exceptions, manganese concentrations in the mine pool have been below 0.1 mg/L since October 1997 and have often been less than the 10-µg/L detection limit. The highest value given by Becher (1991) for arsenic in the Llewellyn and Pottsville Formations is 0.005 mg/L. No values for background concentrations of selenium were given by Becher (1991), and all measurements of selenium for the pre-ash-placement mine pool were less than the detection limit of 0.002 mg/L. The maximum concentration for these elements was 0.101 mg/L for Se and 0.022 mg/L for As between August 1997 and May 2002 in the Big Gorilla mine pool. Maximum concentrations of cadmium and nickel measured by Becher (1991) in groundwater of the Llewellyn and Pottsville Formations were 0.002 mg/L and 0.440 mg/L, respectively. No values were given for mercury. There was no detectable change in cadmium, mercury, or nickel concentrations in the Big Gorilla mine pool between August 1997 and June 2000. The values during that period were comparable to those measured for the pre-ash-placement mine pool. The highest concentrations measured in the Big Gorilla mine pool for cadmium, mercury, and nickel were 0.018 mg/L, 0.003 mg/L, and 0.284 mg/L, respectively. Chromium concentrations measured in the Llewellyn and Pottsville Formations by Becher (1991) were no higher than 0.02 mg/L; samples from the pre-ash-placement Big Gorilla had chromium concentrations no higher than 0.05 mg/L. Chromium concentrations in the post-ash-placement Big Gorilla mine pool were never above 0.260 mg/L. Of the four analyses taken in 1993, the highest lead concentration was 0.002 mg/L. The highest post-ash-placement concentration of lead of 0.0274 mg/L in the Big Gorilla was measured in August 1999. The highest concentration of copper measured in groundwater of the Llewellyn and Pottsville Formations was 0.047 mg/L (Becher, 1991). The highest value for copper in the pre-ash-placement Big Gorilla mine pool was 0.030 mg/L. The maximum concentration of copper detected in the Big Gorilla after ash placement is 0.132 mg/L.

37
4.11.6 Groundwater Monitoring Well Chemistry Five monitoring wells and three test borings on and near the NEPCO property have been sampled for water quality. Wells 1 and 2 are to the east of the Big Gorilla mine pool. Well 3 is within 100 feet of the southern boundary of the mine lake. Well 9 is to the west of the Big Gorilla and is associated with a Superfund site that is between Route 309 and the NEPCO property. Well 4, installed in July 2001, was to intersect the Buck Mountain vein. Table 4.25 presents average concentrations of a number of chemicals measured in the five monitoring wells. These results show that each well has a distinct chemical signature. Only eight groundwater samples were collected from Well 1, but the iron concentration is significantly higher than that found in Well 2. Well 2 has higher concentrations of sodium and chloride than does Well 1. Both Wells 1 and 2 have much lower concentrations of sulfate and aluminum compared to Wells 4 and 9. Wells 4 and 9 are more heavily impacted by AMD than Wells 1 and 2. Well 4 intersects the Buck Mountain seam, and Well 9 is downgradient of surface culm piles and coal refuse. The largest change in water quality in Well 3 occurred between mid-1999 and mid-2000. The pH value increased from 4 to 4.5–5. Sulfate and calcium concentrations dropped from about 125 to 50 mg/L and from 30 mg/L to 10 mg/L, respectively. With a change in pH, iron and aluminum concentrations dropped significantly. From the beginning of ash input to the Big Gorilla surface mine pool, the concentrations of acidity were being reduced. In January 2000, acidity was less than 10, while the alkalinity concentration in Well 3 was 4.8 mg/L CaCO3. For the next 14 months, acidity was below 15 mg/L CaCO3, and alkalinity was 2.0 mg/L CaCO3 or above. During this time, iron and aluminum concentrations remained consistently low. After May 2001, despite continuing ash placement in the Big Gorilla mine pool, acidity began to rise, and alkalinity remained low. However, in April 2003 acidity again decreased and alkalinity increased slightly. The obvious source of alkalinity in groundwater in Well 3 is the Big Gorilla surface mine pool. At times, the alkalinity levels in the Big Gorilla have been over 600 mg/L CaCO3. However, iron concentrations in groundwater in Well 3 were initially below 0.5 mg/L, but rose to a maximum of 6.6 mg/L with the additional input of Big Gorilla water. After November 1999, iron concentrations generally remained low (<0.5 m/L). Just as iron and alkalinity values were increasing in Well 3, sulfate and calcium concentrations began decreasing. Two test borings were drilled into the lower ash platform, and one boring was drilled into the culm. PVC pipe was placed in each hole so that water samples could be collected. The water samples from the borings in the ash platform are very similar in chemistry to the Big Gorilla. All of the borings in the ash platform have consistently high pH and calcium values. It appears that the CaO component of the ash has raised the pH values.

38
4.11.7 Conclusions The Big Gorilla mine pool project involved placement of ash to fill the mine pit containing the large amounts of AMD water. Over 3 million tons of fly ash has been beneficially used on the former acidic surface mine pool, which will no longer present a potential environmental hazard to nearby residents. In addition, abandoned culm piles are removed from local communities, resulting in a further decrease in acid mine drainage production. While the Silverbrook outflow chemistry has changed since 1989, most likely in response to land reclamation in the basin. To date, the change in the chemistry of the Silverbrook has not been in the form of increasing heavy metal content or other toxic chemicals. The Big Gorilla water has maintained a consistently high pH value (11 to 12) in response to the placement of ash. Alkalinity varied with ash deposition. A small amount of the calcium oxide (<2%) derived from the limestone added in the fluidized-bed reactor appears to have been controlling the pH in the Big Gorilla mine pool. Iron, manganese, magnesium, aluminum, and zinc have all decreased significantly since ash placement began. Based on the chemistry of Well 3, it appears that there were only low levels of drainage from and/or flow to the Big Gorilla. Once the area above the mine pool is returned to the approximate premining grade, very little water will flow through the ash plug in the former Big Gorilla mine pool, Thus, one long-term effect of ash placement in the former Big Gorilla mine pool will be the prevention of acidic water production through the surface mine pool and interconnected passages.
4.12 Red Oak Mine (OK) This case study illustrates the use of CCPs for in situ chemical treatment to ameliorate the adverse impacts associated with AMD. The introduced alkalinity from the CCPs neutralized the acidity in mine pool waters, leading to an increase in pH, which in turn caused the precipitation of metals as hydroxides and carbonates within the mine, thereby improving water quality. The Red Oak Mine was operated from 1907 to 1925 utilizing the room-and-pillar extraction method. The mine, which covers approximately 46.5 acres, contains water pools or reservoirs of AMD. The University of Oklahoma and the Oklahoma Conservation Commission injected 418 tons of FBC ash in 15 hours into this acidic (pH 4.3) flooded mine to chemically alter the mine water. Table 4.26 provides a summary of the chemical characteristics of the seep water from the mine pool. Several chemical parameters were monitored for a 1-year postinjection period as well as during injection. Canty and Everett (1999) reported that there were three phases in the treatment of AMD water by the alkaline material. In Phase I, neutralization of existing acidity resulted in an increase in pH from 4.4 to 12.2 in 15 hours. Alkalinity (as CaCO3) increased from 0 to 950 mg/L, and precipitation of metals occurred. In Phase 2, carbonate alkalinity formed and reached a minimum of 50 mg/L for about 3 weeks and then increased to about 100 mg/L for the following several months. The pH declined (Figure 4.35) to below 7, and concentrations of Fe,

39
Mn, and Al increased (Figure 4.36). Phase 3 represents a near-equilibrium condition where pH and alkalinity have leveled off at approximately 6.3 and 150 mg/L as CaCO3, respectively. A comparison of the AMD water preinjection and about 12 months after CCP injection shows that Fe decreased from 200 to 120 mg/L, Mn decreased from 7 to 4.8 mg/L, Al decreased from 6 to 2.3 mg/L, and pH increased from 4.4 to 6.3. The injection of 418 tons of CCPs has introduced a finite amount of alkalinity to the mine pool, which has resulted in an increase in pH and a decrease in the concentration of metals. However, the finite amount of added alkalinity will be depleted as the neutralization of newly produced AMD continues, and the mine water will most likely return to preinjection conditions. This is expected to occur slowly over several years. Further studies will quantify the longevity of the treatment. Trace metals (arsenic, barium, cadmium, chromium, copper, lead, molybdenum, nickel, selenium, and zinc) were measured in seep water before and after CCP injection. These data indicate that trace metal concentrations were either less than preinjection levels or remained the same after CCP injection.
4.13 Winding Ridge Demonstration Project at Frazee Mine (MD)
4.13.1 Introduction The Maryland Department of Natural Resources Power Plant Research Program and the Maryland Department of Environment Bureau of Mines have launched a joint effort with private industry to demonstrate large-volume beneficial uses of CCPs to create flowable grouts for placement of abandoned, underground coal mines to reduce acid formation. In April 1995, this multiyear project initiative started with the Winding Ridge Demonstration project involving injection of a 100% CCP grout into the Frazee Mine, located near Friendsville, Garrett County, Maryland.
4.13.2 Characteristics of Frazee Mine The Frazee Mine is located in the Appalachian Plateau region and is overlain by about 100 ft of shale and sandstone overburden. The mine was a small mine that was used to extract coal from the Upper Freeport coal seam and was operated from 1930s through 1960. Frazee Mine is an abandoned 10-acre underground coal mine consisting of two main tunnels connected by various crosscuts (Figure 4.37). AMD occurs through one mine opening at a steady rate of about 5 gpm. Total mine voids were initially estimated to about 3900 cubic yards.
4.13.3 Geology and Hydrogeology The bedrock above the mine is sandstone and shale with thickness of about 100 feet. The bedrock below the mine consists of shale with occasional coal seams. The mine floor consists of a dense, dry, weathered shale and clay of low permeability.
40
Water-level data obtained from the boreholes show that the mine contains submerged and dry conditions. The upper tunnel appears to be essentially dry and the mine pool is present in the lower tunnel, generally at an elevation of about 2160 ft msl.
4.13.4 CCP Grout Mix The grout mixture used for the Frazee Mine project was about 60% FBC material from Morgantown Energy Associates Power Plant mixed with 20% FGD material and 20% Class F fly ash both from Mt. Storm Power Plant of Virginia Power Company. The median particle size of the FBC material was 42.3 µm and 15 µm for the Class F fly ash. The FGD showed some variation with the average particle size as 7.7 µm. The FBC material contained about 5% free lime. The Atterberg tests were used to determine that the liquid limit and plastic limit for the fly ash were 29.3% and 27.1%, respectively. The FBC and FGD by-products were nonplastic. The chemical composition data of the grout admixtures based on x-ray fluorescence (XRF) analysis are presented in Table 4.27. The x-ray diffraction (XRD) analysis showed that calcium minerals were present in the FBC dominated by hannebachite, gypsum, anhydrite, and calcium oxide, with some quartz. The FGD material did not contain any free lime (CaO) and the calcium was primarily calcite, anhydrite, and hannebachite. The grout mix was also tested by TCLP to obtain potential leaching characteristics of the mixture. The TCLP test results showed that the grout mixture was not a characteristic hazardous material. Arsenic and barium were found to leach at levels of 0.13 and 0.11 mg/L, respectively. The remaining six TCLP metals were not detected in the TCLP leachate.
4.13.5 Grout Injection CCP grout was injected in Frazee Mine from October 3, 1996, through November 7, 1996. Approximately 5600 cubic yards of CCPs were injected. Altogether 3800 tons of FBC material and 1200 tons of FGD material and Class Fly ash were utilized for the grout mixed. Mine water was pumped and used in mixing the grout. A portable mixing plant was utilized to mix the grout and was pumped to the injection boreholes through steel pipes. Grout mixing required about 6 to 12 minutes for each 5 cubic yard batch and average injection rate was about 220 cubic yards for a 10-hour work day.
4.13.6 Pre- and Post-Injection Monitoring The preinjection water quality was typical of AMD quality water. The pH values ranged from 2.5 to 3.45 sulfate concentrations ranged from 80 to 1800 mg/L, TDS ranged from 160 to 2900 mg/L, total acidity ranged form 50 to 2400 g/L, and total iron concentrations ranged upwards of 200 to 300 mg/L. Postinjection monitoring has been performed for water quality since 1996 to 2004. Robin Guynn of ERM, Inc., has kindly provided the summary tables and time-series plots for the L-2 seep location showing both the pre- and the post-injection measurements for calcium (Figure 4.38), iron (Figure 4.39), magnesium (Figure 4.40), potassium (Figure 4.41), sodium

41
(Figure 4.42), bromide (Figure 4.43), chloride (Figure 4.44), sulfate (Figure 4.45), aluminum (Figure 4.46), manganese (Figure 4.47), zinc (Figure 4.48), cobalt (Figure 4.49), copper (Figure 4.50), cadmium (Figure 4.51), nickel (Figure 4.52), total acidy (Figure 4.53), pH (Figure 4.54), flow rate (4.55), and TDS (Figure 4.56). Table 4.27 shows the average concentrations of the chemical constituents measured in L-2 seep during the preinjection period from January 1995 through September 1996 as well as for the post injection period from October 1998 through December 2004. In addition, grout cores have been collected on a periodic basis from the Frazee Mine. Visual inspection and physical testing results indicate that the grout is in very good shape without evidence of in situ weathering. The unconfirmed compressive strength ranged from 560 to 1417 psi. The hydraulic conductivity of the cores ranged from 10-8 cm/sec to 10-6 cm/sec. Overall, the water quality-monitoring results, presented in Table 4.27 and the time-series plots presented in Figures 4.38 through 4.56, show no significant increases in AMD-related parameters since the CCP grout was placed in the Frazee Mine.
4.13.7 Conclusion The Winding Ridge demonstration project at the Frazee Mine has shown that CCP grout mixture can be beneficially used for an abandoned underground coal mine to reduce acid formation as well to fill mine voids with a high-strength, low-permeability material that would control mine subsidence. The placement of the CCP grout appears to have not caused an unacceptable water quality impact either. 5.0 REFERENCES Section 1.0 American Coal Ash Association 2004. Coal Combustion product (CCP) Production and Use. Section 2.0 Electric Power Research Institute 1987. Chemical Characterization of Fossil Fuel Combustion Wastes. Report No. EA-5321, Palo Alto, CA. Section 4.1.4 Aqua Terra, 1997. www.aquaterra.com Bicknell, B.R., J.C. Imhoff, J.L. Kittle Jr., A.S. Donigian, Jr. and R.C. Johanson. 1997.
Hydrological Simulation Program -- FORTRAN, User's Manual for Version 11. Section 4.2

42
Althouse, John. Coors Energy Co. to Weld County Commissioners. Personal Communication, 1986, November 14.
Doty and Associates, 1998. www.dotyeng.com Walker, Byron. State of Colorado DNR to Colorado Dept of Health HMWMD. Personal
Communication, 2000, October 30

43
Section 4.4.3 Hazen Research Inc., 1989 and 1991. www.hazenusa.com Section 4.3 Personal Communications, 2001. Koehler, Karl. Trapper Mining Inc. Section 4.5 Personal Communication, 1999. Wes Sprouse, Virginia Power Company. Section 4.7 Branam,T.; Ennis, M.; Smith, R. 1999. Water-Quality Monitoring at an Abandoned Mine Land
Reclamation Site Amended With Fly Ash and Fixated Scrubber Sludge. In Proceedings, 13th International Symposium On Use and Management of Coal Combustion Products (CCPs),EPRI Report TR-111829.
Olyphant, G.; Harper, D.; Branam, T. 1997. Hydrologic and Chemical Effects of Reclaiming A
Refuse Deposit with Ash Fill and a Cap of Fixated Scrubber Sludge. Report From The Indiana Geological Survey Covering the Period Feb 1, 95 to Jan 31, 96.
Section 4.8 Fluid Placement of Fixated Scrubber Sludge in Abandoned Deep Mines to Abate Surface
Subsidence and Reduce Acid Mine Drainage. EPRI Report TR-107053, November 1996. Section 4.10 Schueck, J.; DiMatteo, M.; Scheetz, B.; Silsbee, M. 1996. Water Quality Improvements
Resulting From FBC Ash Grouting of Buried Piles of Pyritic Materials on a Surface Coal Mine. Proceedings, American Society for Surface Mining and Reclamation
Section 4.11.3 Ash, S.H.; Doherty, R.E.; Miller, P.S.; Romischer, W.M.; Smith, J.D. 1951 Core drilling at shaft
sites of proposed mine-water drainage tunnel: antharacite region of Pennsylvania Bureau of Mines, Washington, DC (USA) May 01.
Felegy, E.W.; Johnson, L.H.; Westfield, J. 1948 Acid Mine Water in the Anthracite Region of
Pennsylvania - US, GPO

44
Growitz, D.J., Reed, L.A., and Beard, M.M. 1985 Reconnaissance of mine drainage in the coal fields of eastern Pennsylvania Water Resources Investigations Report 83-4274. pa.water.usgs.gov
Wood, C.R 1996Water quality of large discharges from mines in the anthracite region of eastern Pennsylvania Water Resources Investigations Report 95-4243 - pa.water.usgs.gov
Section 4.11.5 Becher, Albert E. 1991 Groundwater resources in and near the anthracite basins of Schuylkill
and adjacent counties, Pennsylvania Water Resource Report Harrisburg. 1973, 1991 Pennsylvania Bureau of Topographic and Geologic Survey : Harrisburg, PA, United States
Loop, C.M., et al. 1999. Geochemistry of Acid Mine Waters in an Eastern Anthracite Strip Mine.
Tailings and Mine Waste 199 © 1999 Balkema, Rotterdam, PP543-550 Proceedings of the Sixth International Conference
Section 4.12 Canty, G.A.; Everett, J.W. 1999. An In Situ Remediation Method for Abandoned Underground
Coal Mines Using Coal Combustion Products. Proceedings, 13th International Symposium on Use and Management of Coal Combustion Products. EPRI Report TR-111829-V3

APPENDIX A
TABLES

A-1
Table 2.1 Summary of Total Concentrations of Selected Elements in Fly Ash, Bottom Ash, and FGD Sludge (from EPRI 1987)
Concentration (mg/kg solid) Fly Ash (39 samples) Bottom Ash (40 samples) FGD Sludge (11 samples)
Element NDa Mean Range NDa Mean Range NDa Mean Range
Al 39 113,000 46,000–152,000 40 101,000 30,500–145,000 10 30,300 8400–73,000 As 39 156.2 7.7–1,385 34 7.6 <5–36.5 8 25.2 <5–53.1 Ba 39 1880 251–10,850 40 1565 150–9360 10 370 <25–2280 Ca 39 62,000 7400–223,000 40 52,000 2200–241,000 11 274,000 110,000–345,000 Cd 2 11.7 6.4–16.9 0 < 5 <5 0 < 5 <5 Cl 7 477 180–1190 8 712 <150–2630 9 2514 <150–8970 Cr 29 247.3 37–651 38 585 <40–4710 8 72.7 <40–168 Cu 39 185 44.6–1452 40 78.2 27.3–146 11 31.8 8.0–121 Fe 39 76,000 25,000–177,000 40 105,000 20,200–201,000 11 64,000 1300–138,000 K 39 14,300 3000–25,300 40 12,000 2600–24,000 11 1900 3700–17,000
Mg 39 11,800 1600–41,800 40 9700 2500–46,000 11 7200 600–17,800 Mn 39 357 44–1332 40 426 56–1940 11 138 37.3–312 Mo 36 43.6 7.1–236 36 14.4 2.8–443 8 12.2 <4.0–52.6 Na 39 9087 1300–62,500 40 6188 814–41,300 11 3817 200–16,500 Ni 39 141 22.8–353 39 216 <10–1,067 11 40.4 <5–145 P 24 3070 1100–10,340 19 1470 <500–4630 10 4271 <1000–5900
Pb 39 170.6 21.1–2120 38 46.7 4.6–843 10 29.2 <4–181 S 39 12,643 1300–64,400 40 7422 460–74,000 11 152,000 39,400–228,000
Sb 7 42.5 11–131 0 <10 <10 1 15.5 15.5 Se 30 14.0 5.5–46.9 10 4.1 <1.5–9.96 8 35.8 <2–162 Si 39 209,000 89,500–275,000 40 222,000 51,000–312,000 5 66,000 <500–170,000 Sn 18 43.6 7.9–56.4 24 28.2 <9–90.2 6 29.9 <10–50.5 Sr 39 1331 204–6,820 38 992 182 – 6,440 11 608 70.8–2990 Ti 39 6644 1310–10,100 40 5936 1,540 – 11,300 10 1,599 120–5050 U 13 18.7 11.1–30.4 16 11.9 <5 – 25.9 1 16.2 16.2 V 35 271.5 <95–652 30 176 <50 – 275 3 156 <50–261 Zn 39 449.2 27–2880 40 127 3.8 - 515 11 99.7 7.7–612
* ND represents the number of measured values above the detection limit for a given element.

A-2
Table 2.2. Ranges of Hydraulic Conductivity in Surface Mine Spoils (Hawkins, 2002) Geographic Area Hydraulic Conductivity (M/A) Western Pennsylvania 4.2 × 159 to 7.6 × 10⁻² Northern West Virginia 9.5 × 10⁻⁸ to 2.7 × 10⁻⁴ Eastern Ohio 5.4 × 10⁻⁸ to 1.9 × 10⁻⁵ Western Kentucky and Southern Illinois 2.4 × 10⁻⁵ to 4.1 × 10⁻⁵ Western North Dakota 2.9 × 10⁻⁵ to 4.6 × 10⁻⁵ Northern Great Plains 8.0 × 10⁻⁷ Wyoming 1.9 × 10⁻⁶ to 2.1 × 10⁻⁴ Edmonton, Alberta 1.5 × 10⁻⁶
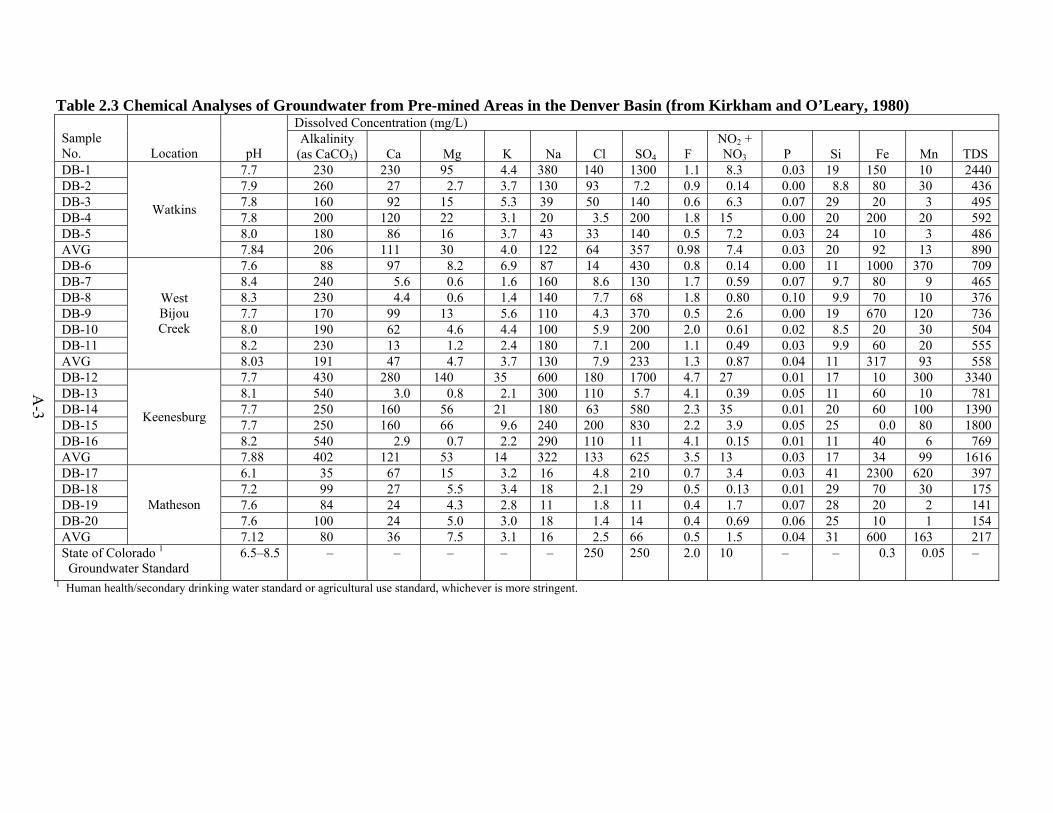
A-3
Table 2.3 Chemical Analyses of Groundwater from Pre-mined Areas in the Denver Basin (from Kirkham and O’Leary, 1980) Dissolved Concentration (mg/L)
Sample No.
Location
pH
Alkalinity (as CaCO3)
Ca
Mg
K
Na
Cl
SO4
F
NO2 + NO3
P
Si
Fe
Mn
TDS
DB-1 7.7 230 230 95 4.4 380 140 1300 1.1 8.3 0.03 19 150 10 2440 DB-2 7.9 260 27 2.7 3.7 130 93 7.2 0.9 0.14 0.00 8.8 80 30 436 DB-3 7.8 160 92 15 5.3 39 50 140 0.6 6.3 0.07 29 20 3 495 DB-4 7.8 200 120 22 3.1 20 3.5 200 1.8 15 0.00 20 200 20 592 DB-5 8.0 180 86 16 3.7 43 33 140 0.5 7.2 0.03 24 10 3 486 AVG
Watkins
7.84 206 111 30 4.0 122 64 357 0.98 7.4 0.03 20 92 13 890 DB-6 7.6 88 97 8.2 6.9 87 14 430 0.8 0.14 0.00 11 1000 370 709 DB-7 8.4 240 5.6 0.6 1.6 160 8.6 130 1.7 0.59 0.07 9.7 80 9 465 DB-8 8.3 230 4.4 0.6 1.4 140 7.7 68 1.8 0.80 0.10 9.9 70 10 376 DB-9 7.7 170 99 13 5.6 110 4.3 370 0.5 2.6 0.00 19 670 120 736 DB-10 8.0 190 62 4.6 4.4 100 5.9 200 2.0 0.61 0.02 8.5 20 30 504 DB-11 8.2 230 13 1.2 2.4 180 7.1 200 1.1 0.49 0.03 9.9 60 20 555 AVG
West Bijou Creek
8.03 191 47 4.7 3.7 130 7.9 233 1.3 0.87 0.04 11 317 93 558 DB-12 7.7 430 280 140 35 600 180 1700 4.7 27 0.01 17 10 300 3340 DB-13 8.1 540 3.0 0.8 2.1 300 110 5.7 4.1 0.39 0.05 11 60 10 781 DB-14 7.7 250 160 56 21 180 63 580 2.3 35 0.01 20 60 100 1390 DB-15 7.7 250 160 66 9.6 240 200 830 2.2 3.9 0.05 25 0.0 80 1800 DB-16 8.2 540 2.9 0.7 2.2 290 110 11 4.1 0.15 0.01 11 40 6 769 AVG
Keenesburg
7.88 402 121 53 14 322 133 625 3.5 13 0.03 17 34 99 1616 DB-17 6.1 35 67 15 3.2 16 4.8 210 0.7 3.4 0.03 41 2300 620 397 DB-18 7.2 99 27 5.5 3.4 18 2.1 29 0.5 0.13 0.01 29 70 30 175 DB-19 7.6 84 24 4.3 2.8 11 1.8 11 0.4 1.7 0.07 28 20 2 141 DB-20 7.6 100 24 5.0 3.0 18 1.4 14 0.4 0.69 0.06 25 10 1 154 AVG
Matheson
7.12 80 36 7.5 3.1 16 2.5 66 0.5 1.5 0.04 31 600 163 217 State of Colorado 1
Groundwater Standard 6.5–8.5 – – – – – 250 250 2.0 10 – – 0.3 0.05 –
1 Human health/secondary drinking water standard or agricultural use standard, whichever is more stringent.
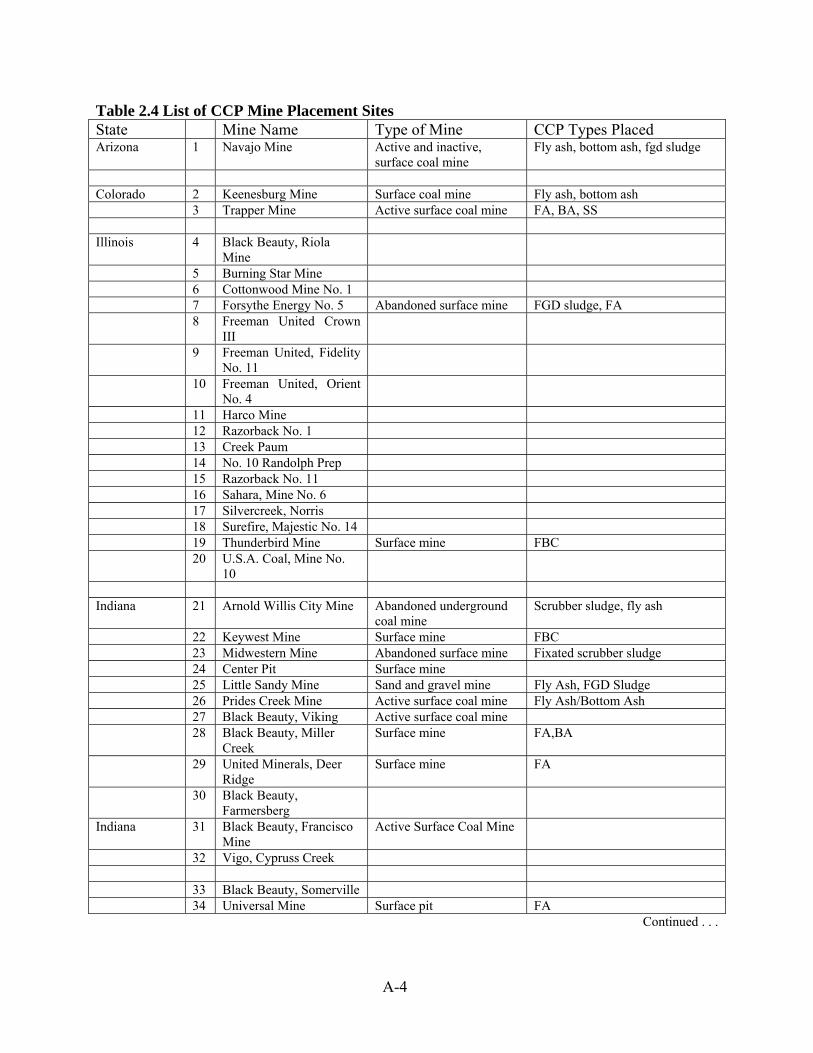
A-4
Table 2.4 List of CCP Mine Placement Sites State Mine Name Type of Mine CCP Types Placed Arizona 1 Navajo Mine Active and inactive,
surface coal mine Fly ash, bottom ash, fgd sludge
Colorado 2 Keenesburg Mine Surface coal mine Fly ash, bottom ash 3 Trapper Mine Active surface coal mine FA, BA, SS Illinois 4 Black Beauty, Riola
Mine
5 Burning Star Mine 6 Cottonwood Mine No. 1 7 Forsythe Energy No. 5 Abandoned surface mine FGD sludge, FA 8 Freeman United Crown
III
9 Freeman United, Fidelity No. 11
10 Freeman United, Orient No. 4
11 Harco Mine 12 Razorback No. 1 13 Creek Paum 14 No. 10 Randolph Prep 15 Razorback No. 11 16 Sahara, Mine No. 6 17 Silvercreek, Norris 18 Surefire, Majestic No. 14 19 Thunderbird Mine Surface mine FBC 20 U.S.A. Coal, Mine No.
10
Indiana 21 Arnold Willis City Mine Abandoned underground
coal mine Scrubber sludge, fly ash
22 Keywest Mine Surface mine FBC 23 Midwestern Mine Abandoned surface mine Fixated scrubber sludge 24 Center Pit Surface mine 25 Little Sandy Mine Sand and gravel mine Fly Ash, FGD Sludge 26 Prides Creek Mine Active surface coal mine Fly Ash/Bottom Ash 27 Black Beauty, Viking Active surface coal mine 28 Black Beauty, Miller
Creek Surface mine FA,BA
29 United Minerals, Deer Ridge
Surface mine FA
30 Black Beauty, Farmersberg
Indiana 31 Black Beauty, Francisco Mine
Active Surface Coal Mine
32 Vigo, Cypruss Creek 33 Black Beauty, Somerville 34 Universal Mine Surface pit FA
Continued . . .

A-5
Table 2.4 List of CCP Mine Placement Sites (continued) Mine Name Type of Mine CCP Types Placed Kentucky 35 Starfire Mining 36 Bluediamond 37 Buckhorn 38 Floyed County Coal FBC ash Maryland 39 Mettiki Coal 40 Patriot Mining 41 Frazee Mine, Winding
Ridge Abandoned underground coal
Fly ash, FBC ash, FGD sludge
42 Kempton Mine Underground coal 43 BBSS Mine Surface Sand and gravel
quarry Fly ash
44 Rossville Mine Surface clay Fly ash Ohio 45 Miller Mining, Bucks 46 Miller Mining,, Auburn 47 Painesville 48 Mead 49 Clayton 50 Milton 51 Washington 52 Roberts-Dawson
53 54
Broken Aro Fleming Mine
Underground Surface
FGD sludge FBC
Oklahoma 55 Georges Colliers 56 MIMHF, Inc. 57 Red Oak Mine Abandoned Underground
Coal Mine FBC ash
Pennsylvania 58 Big Gorilla Pit Surface FBC 59 Alden Mine Surface FBC 60 Knickerbocker Pit Surface FBC 61 McCloskey Site Surface FBC 62 Abel Dreshman Surface FBC 63 Wildwood Surface FBC 64 Clinton County Surface FBC 65 Centralia Surface Coal Mine Fly ash 66 Morris Ridge Surface Coal Mine Stabilized ash 67 Pine Hill Inactive Coal Mine FA, BA, mill rejects 68 Rock Run Inactive Coal Mine FA, BA, mill rejects 69
70
Zullinger Quarry Harwick Mine
Abandoned Limestone quarry Underground
Fly ash Fly ash
71 72 73 74
Bognanni Mine Wheelabrator Mine Mckay Coal Mine Panther Creek Partners
Surface Surface Surface Surface
FBC, FA FBC FBC FBC
Texas 75 Monticello Winfield Mine
Lignite surface Fly ash
76 San Miguel Mine FA, BA Continued . . .

A-6
Table 2.4 List of CCP Mine Placement Sites (continued) Mine Name Type of Mine CCP Types Placed 77 Big Brown Mine Active Lignite Surface Bottom ash Washington 78 Centralia Strip BA, FA West Virginia 79 Fairfax Underground FBC 80 Omega Mine Surface FBC, FA 81 Pierce Surface FA 82 Mt. Storm Active coal FA, BA, mill rejects 83 Long Ridge Underground FBC Wyoming 84 Wyodak Mine Active surface coal FA, BA, SS 85 Jim Bridger 86 Kemmerer Mine 87 Black Thunder 88 Arch Minerals Michigan 89 Sibley Quarry Surface limestone Fly ash Missouri 90 Lafarge Sugar Creek Fly ash 91 Foster Mine 92 Tiger Mine Montana 93 Savage Mine Surface lignite FA, BA New Mexico 94 San Juan Mine 95 Navaho North Dakota 96 Abby 97 Beulah 98 Buechler 99 Burlington 100 Center Surface FGD sludge, FA 101 Falkirk 102 Freedom 103 Lehigh Road 104 Parshall 105 Scenic East 106 Wilton Underground Fly ash

A-7
Table 3.1. Post-mining Water Quality Data for Several Pennsylvania Mines
Mine Site pH
Net Alkalinity,
mg/L Fe,
mg/L Mn,
mg/L SO4, mg/L
Al, mg/L
A 3.2 −185 25 23 1434 N/A B 5.6 6 0 0 <43 C 7.6 382 5 5 744 D 2.9 −814 51 29 981 E 3.1 −361 52 31 432 F 7.4 237 0 1 32 Well 6 3.4 −1,140 120 NA* 4600 Discharge 3.3 −380 48 N/A 2300
Clinton County
2.3 2.5
N/A N/A
876 747
39.2 48.1
3477 2958
256 236
* Not available.
Table 4.1. Average Annual Ash Quantities Generated by Wyodak, Neil Simpson I, and Neil Simpson II Power Plants
Generated Quantity of CCPs, tons/yr CCP Type Neil Simpson I Neil Simpson II Wyodak Fly Ash 7665 – – Bottom Ash 2555 7280 38,325 Scrubber Ash – 26,880 148,190
Table 4.2. Summary of Ash-Filled Pits at Wyodak Mine Area No.
Year(s) of Ash Placement
Ash Type
Compacted Liner
1 1978–1979 Fly ash Yes 2 1980 Fly ash No 2 1981 Fly ash No 2 1982 Fly ash No 3 1983 Bottom ash Yes 3 1983 Fly ash Yes 3 1984 Fly ash Yes 3 1985–1987 Fly/scrubber ash Yes 3 1988–1989 Scrubber ash Yes 3 1990–1991 Scrubber ash Yes 3 1992–1995 Scrubber/bottom ash Yes 3 1995–1998 Scrubber/bottom ash Yes 4 1998–2009 Scrubber/bottom ash No
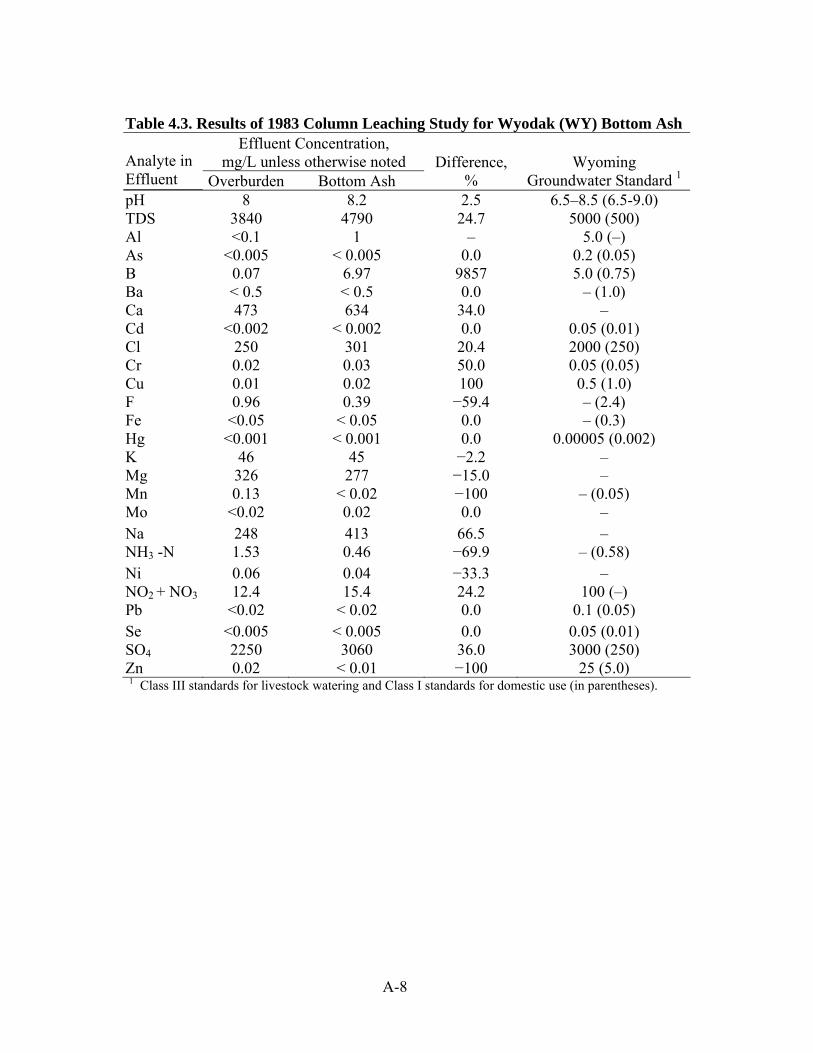
A-8
Table 4.3. Results of 1983 Column Leaching Study for Wyodak (WY) Bottom Ash
Effluent Concentration, mg/L unless otherwise noted
Analyte in Effluent Overburden Bottom Ash
Difference,
% Wyoming
Groundwater Standard 1 pH 8 8.2 2.5 6.5–8.5 (6.5-9.0) TDS 3840 4790 24.7 5000 (500) Al <0.1 1 – 5.0 (–) As <0.005 < 0.005 0.0 0.2 (0.05) B 0.07 6.97 9857 5.0 (0.75) Ba < 0.5 < 0.5 0.0 – (1.0) Ca 473 634 34.0 – Cd <0.002 < 0.002 0.0 0.05 (0.01) Cl 250 301 20.4 2000 (250) Cr 0.02 0.03 50.0 0.05 (0.05) Cu 0.01 0.02 100 0.5 (1.0) F 0.96 0.39 −59.4 – (2.4) Fe <0.05 < 0.05 0.0 – (0.3) Hg <0.001 < 0.001 0.0 0.00005 (0.002) K 46 45 −2.2 – Mg 326 277 −15.0 – Mn 0.13 < 0.02 −100 – (0.05) Mo <0.02 0.02 0.0 – Na 248 413 66.5 – NH3 -N 1.53 0.46 −69.9 – (0.58) Ni 0.06 0.04 −33.3 – NO2 + NO3 12.4 15.4 24.2 100 (–) Pb <0.02 < 0.02 0.0 0.1 (0.05) Se <0.005 < 0.005 0.0 0.05 (0.01) SO4 2250 3060 36.0 3000 (250) Zn 0.02 < 0.01 −100 25 (5.0)
1 Class III standards for livestock watering and Class I standards for domestic use (in parentheses).

A-9
Table 4.4. Batch Test Results from 1997–1998 on Wyodak Bottom and Scrubber Ash Groundwater Concentration 1, mg/L unless otherwise noted
Bottom Ash Test Scrubber Ash Test Analyte Preeextraction Postextraction Preextraction Postextraction
Wyoming Groundwater
Standard 2 pH (s.u.) 7.3 8.0 7.25 10.48 6.5–8.5 (6.5–9.0)TDS 3220 3280 3285 3497 5000 (500) Al 0.79 1.93 0 3.88 5.0 (–) As 0 0.006 0 0.008 0.2 (0.05) B 0.37 1.7 0.31 2.69 5.0 (0.75) Ba 0 0 0 0.25 – (1.0) Ca 321 279 347 483 – Cd 0 0 0 0 0.05 (0.01) Cl 127 119 160 208 2000 (250) CO3 0 0 0 54.5 Cr 0 0 0 0.25 0.05 (0.05) Cu 0 0 0 0 0.5 (1.0) F 0.37 0.22 0.15 3.15 – (2.4) Fe 0 0 1.74 0.42 – (0.3) HCO3 1120 905 1098 873 Hg 0 0 0 0 0.00005 (0.002) K 14.4 16.9 17.5 34.7 – Mg 234 257 221 270 – Mn 1.29 0.07 1.21 0.24 – (0.05) Mo 0 0 0 0.12 – Na 413 399 463 493 – NH3-N 1.42 1.41 2.03 2.75 – (0.58) Ni 0.01 0.02 0.01 0.03 – NO2+NO3 0 0.09 0 1.48 100 (–) Pb 0 0 0 0 0.1 (0.05) Se 0 0.005 0 0.027 0.05 (0.01) SO4 1560 1760 1538 2082 3000 (250) Zn 0 0 0 0 25 (5.0) 1 Post-extraction value represents the maximum concentrations in 3 to 10 sequential extractions with fresh
groundwater. 2 Class III standards for livestock watering and Class I standards for domestic use (in parentheses).

A-10
Table 4.5. Groundwater Quality Data for Regulated Analytes in Selected Wells
Groundwater Concentration, mg/L unless otherwise noted2 M-1A
(1987–1999) LF-5
(1990–1999) M-5A
(1984–1999) M-12
(1977–1981) M-17
(1977–1999) M-22
(1981–1999) Analyte
Wyoming Groundwater
Standard 1 Max Mean Max Mean Max Mean Max Mean Max Mean Max Mean pH (s.u.) 6.5–8.5 8.1 7.11 7.8 6.7 7.8 7.22 7.8 7.51 8.2 7.51 8.1 7.57 TDS 5000 2954 2403 5468 4831 4220 2558 2520 2520 2200 1781 842 759 Al 5.0 0.1 0.08 0.3 0.07 2.1 0.152 0.5 0.25 0.3 0.1 0.4 0.098 As 0.2 <0.005 <0.005 0.009 <0.005 <0.005 <0.005 <0.005 <0.005 <0.01 <0.005 <0.005 <0.005 B 5.0 0.21 0.09 0.42 0.29 0.31 0.098 6.90 3.49 0.5 0.212 0.22 0.092 Ba – 0.5 0.36 0.25 0.27 0.5 0.40 0.5 0.5 0.5 0.43 0.9 0.513 Cd 0.05 0.003 0.002 0.003 0.0016 0.006 0.0017 0.03 0.01 0.03 0.0039 0.003 0.0017 Cl 2000 57.28 14.64 224.04 149.8 16.81 10.29 12 4.98 69.16 9.34 29.87 16.83 Cr 0.05 0.02 0.014 0.1 0.014 0.04 0.016 0.1 0.073 1.0 0.05 0.03 0.02 Cu 0.5 0.01 0.03 0.06 0.008 0.02 0.0082 0.01 0.027 0.06 0.012 0.05 0.0095 F – 0.81 0.454 0.57 0.336 3.77 0.508 0.37 0.37 0.5 0.33 1.6 0.93 Fe – 2.47 0.228 0.83 0.2 2.06 0.233 22.6 5.865 2.75 0.412 1.11 0.171 Hg 3 0.00005 0.002 <0.001 <0.001 <0.001 0.002 <0.001 <0.001 <0.001 0.002 <0.001 <0.001 <0.001 Mn – 1.57 0.56 2.41 1.52 0.21 0.111 0.37 0.257 0.19 0.107 0.04 0.018 NH3 – 3.07 0.81 1.86 0.82 10.42 3.12 2.54 2.54 11.86 3.86 3.47 1.67 NO2+NO3 100 2.42 0.347 0.89 0.121 4.35 0.26 2.8 1.01 4.1 0.68 0.35 0.0475 Pb 0.1 0.02 0.014 0.01 0.011 0.02 0.016 0.02 0.03 0.02 0.017 0.02 0.0165 Se 0.05 0.005 0.0035 0.0025 0.0027 0.005 0.0039 0.005 0.005 0.01 0.0044 0.005 0.004 SO4 3000 1427 1255 2930 2501 2543 1318 1510 1279 912 794 15 1.51 Zn 25 0.41 0.066 0.47 0.05 0.34 0.039 0.2 0.143 0.55 0.141 0.07 0.012
1 Values represent Wyoming Class III livestock use standards. 2 Values in boldface exceed Class III standards. 3 The reported detection limit for Hg (0.001 mg/L) is higher than the current Class III standard (0.00005 mg/L).

A-11
Table 4.6. Paste Extract Analysis of Fly Ash and Bottom Ash Samples Prior to Disposal at Keenesburg Mine (CO) (Hazen Research Inc., 1989)1 Analyte Units Bottom Ash Fly Ash pH s.u. 11 9.42 Electrical Conductivity mS/cm 2650 11,900 Arsenic mg/L <0.01 0.13 Calcium mg/L 579 494 Cadmium mg/L <0.001 0.008 Chromium mg/L 0.02 0.17 Copper mg/L 0.01 0.09 Iron mg/L 0.04 0.11 Mercury mg/L <0.0001 <0.0001 Potassium mg/L 44.1 89.3 Magnesium mg/L 0.6 73.2 Manganese mg/L <0.01 0.02 Molybdenum mg/L 0.99 13.3 Sodium mg/L 260 4410 Nitrate mg/L 1.39 1.31 Lead mg/L 0.17 0.12 Selenium mg/L 0.031 2.42 Sulfate mg/L 1950 10,500 Zinc mg/L 0.03 0.05
1 Pastes prepared using 0.42 g H2O/1 g ash.
Table 4.7. Results of Two Toxicity Characteristic Leaching Procedure Tests on Keenesburg Fly Ash and Bottom Ash Aamples (Hazen Research Inc., 1991)
January 1991 December 1991 EPA Limit
Analyte Units Fly Ash Bottom Ash Fly Ash Bottom Ash Silver mg/L <0.05 <0.05 <0.05 <0.05 5.0 Arsenic mg/L <0.01 <0.01 <0.05 <0.01 5.0 Barium mg/L 1.6 <0.1 2.4 <0.1 100 Cadmium mg/L 0.02 <0.01 <0.01 <0.01 1.0 Chromium mg/L <0.05 <0.05 <0.05 <0.05 5.0 Mercury mg/L <0.0001 <0.0001 <0.0001 <0.0001 0.2 Lead mg/L <0.1 <0.1 <0.3 <0.1 5.0 Selenium mg/L 0.29 0.03 0.08 0.16 1.0 Final pH s.u. 5.02 4.74 5.70 5.64 –
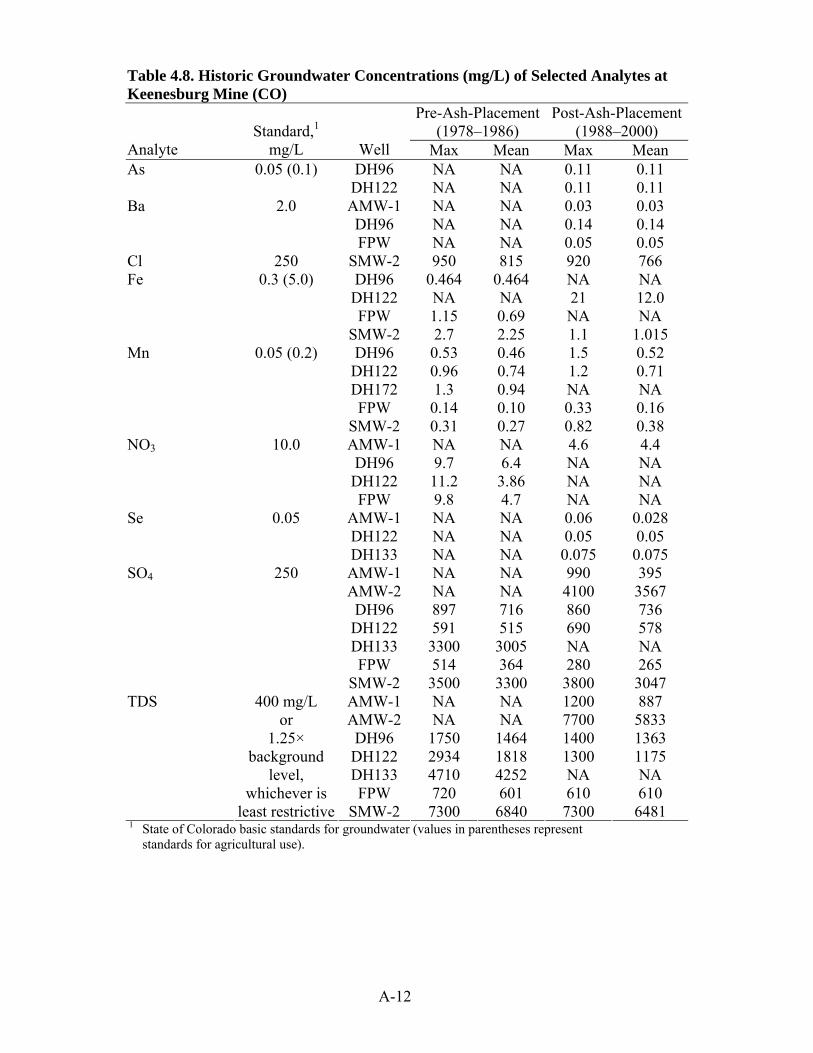
A-12
Table 4.8. Historic Groundwater Concentrations (mg/L) of Selected Analytes at Keenesburg Mine (CO)
Pre-Ash-Placement (1978–1986)
Post-Ash-Placement (1988–2000)
Analyte
Standard,1
mg/L
Well Max Mean Max Mean DH96 NA NA 0.11 0.11 As 0.05 (0.1) DH122 NA NA 0.11 0.11 AMW-1 NA NA 0.03 0.03 DH96 NA NA 0.14 0.14
Ba 2.0
FPW NA NA 0.05 0.05 Cl 250 SMW-2 950 815 920 766
DH96 0.464 0.464 NA NA DH122 NA NA 21 12.0 FPW 1.15 0.69 NA NA
Fe 0.3 (5.0)
SMW-2 2.7 2.25 1.1 1.015 DH96 0.53 0.46 1.5 0.52 DH122 0.96 0.74 1.2 0.71 DH172 1.3 0.94 NA NA FPW 0.14 0.10 0.33 0.16
Mn 0.05 (0.2)
SMW-2 0.31 0.27 0.82 0.38 AMW-1 NA NA 4.6 4.4 DH96 9.7 6.4 NA NA DH122 11.2 3.86 NA NA
NO3 10.0
FPW 9.8 4.7 NA NA AMW-1 NA NA 0.06 0.028 DH122 NA NA 0.05 0.05
Se 0.05
DH133 NA NA 0.075 0.075 AMW-1 NA NA 990 395 AMW-2 NA NA 4100 3567 DH96 897 716 860 736 DH122 591 515 690 578 DH133 3300 3005 NA NA FPW 514 364 280 265
SO4 250
SMW-2 3500 3300 3800 3047 AMW-1 NA NA 1200 887 AMW-2 NA NA 7700 5833 DH96 1750 1464 1400 1363 DH122 2934 1818 1300 1175 DH133 4710 4252 NA NA FPW 720 601 610 610
TDS 400 mg/L or
1.25× background
level, whichever is
least restrictive SMW-2 7300 6840 7300 6481 1 State of Colorado basic standards for groundwater (values in parentheses represent standards for agricultural use).

A-13
Table 4.9. Chemical analysis of Craig fly ash and bottom ash (Radian Corporation, 1991)
Concentration, mg/kg Analyte Fly Ash Bottom Ash Aluminum 123,000 110,000 Arsenic 4.0 4.2 Barium 6700 5800 Boron 30 12 Cadmium 19 17 Calcium 65,000 63,000 Chlorine 0.0017 – Chromium 81 57 Cobalt 30 22 Copper 69 40 Iron 37,000 44,000 Lead 42 16 Magnesium 15,700 13,000 Manganese 300 360 Mercury 0.02 0.02 Molybdenum 47 36 Nickel 54 36 Phosphorous 1900 2052 Potassium 9400 7800 Selenium 0.56 0.56 Silicon 250,000 285,000 Silver 6.9 4.7 Sodium 2400 2200 Strontium 2500 2400 Sulfur 1400 1800 Titanium 5500 5200 Vanadium 380 290 Zinc 170 96

A-14
Table 4.10. Results of Batch Leaching Tests on Trapper Mine (CO) Fly Ash and Bottom Ash (Radian Corporation, 1991)
Analyte Units
Fly Ash RCRA
Extraction1
Fly Ash DI Water
Extraction2
Bottom Ash DI Water
Extraction2
Groundwater Quality
Standards3 pH s.u. – 11.4 8.6 6.5-8.5 Ag mg/L 0.014 0.014 0.008 0.05 Al mg/L 0.1 92 1.4 (5.0) As mg/L <0.005 <0.005 <0.005 0.05 (0.1) B mg/L 12 42 0.55 (0.75) Ba mg/L 1.6 12 1.6 2.0 Cd mg/L <0.005 < 0.005 <0.005 0.005 (0.01) Cl mg/L <1 <1 12 250 Cr mg/L 0.025 0.18 0.015 0.1 (0.1) Cu mg/L 0.027 0.005 <0.005 1.0 (0.2) Fe mg/L 0.017 0.032 0.01 5.0 (0.3) Hg mg/L <0.002 0.002 <0.002 0.002 (0.01) Mn mg/L 0.2 0.036 0.036 0.05 (0.2) Mo mg/L 0.12 0.48 0.04 – Ni mg/L 0.02 0.06 0.02 0.1 (0.2) Pb mg/L <0.002 <0.002 <0.002 0.05 (0.1) Se mg/L <0.002 <0.002 <0.002 0.05 (0.02) SO4 mg/L 80 <3 190 250 V mg/L 0.41 0.038 0.056 (0.1) Zn mg/L 0.09 0.01 0.01 5.0 (2.0) 1 RCRA extraction performed with acetic acid buffer solution (pH ~ 5.0). 2 DI water extraction performed with distilled water. 3 Drinking water standards from Colorado “Basic Standards for Groundwater” (Regulation No. 41, effective March 2, 1999); values in parentheses represent standards for agricultural use.

A-15
Table 4.11. Historic groundwater quality summary for Trapper Mine
Analyte Concentrations, mg/L unless otherwise noted Well GF6 (1982–2000) Well GF7 (1987–2000) Well GF11 (1988–2000) Well GMP1 (1990–2000)
Analyte Standard2 Max Mean NS ND Max Mean NS ND Max Mean NS ND Max Mean NS NDAl (5.0) 0.37 0.026 42 34 0.13 0.01 45 39 <0.05 <0.05 22 22 0.25 0.02 34 27As 0.05 (0.1) 0.034 0.0065 19 3 0.004 <0.001 15 13 0.002 <0.001 13 10 0.004 <0.001 11 8B (0.75) 0.24 0.12 45 3 0.3 0.22 45 0 0.19 0.13 22 0 0.36 0.24 34 0Ba 2.0 0.42 0.11 45 7 0.3 0.046 45 0 0.2 0.067 22 0 0.23 0.12 34 0Cd 0.005 <0.003 < 0.003 20 20 <0.003 <0.003 16 16 0.02 <0.003 14 13 <0.003 <0.003 12 12Cl 250 81 17.5 19 0 67 40.3 15 0 25 118.5 13 0 35 23.8 11 0Cr 0.1 0.01 < 0.001 42 40 <0.01 < 0.01 44 44 0.01 <0.01 21 18 <0.01 <0.01 33 33Fe 0.3 (5.0) 0.1 0.009 27 21 0.31 0.076 17 6 0.95 0.24 14 4 0.25 0.05 12 4Mn 0.05 0.06 0.016 44 17 0.76 0.41 45 4 1.35 0.58 22 0 0.17 0.027 34 13Mo – 0.03 < 0.01 44 42 0.09 <0.01 45 44 <0.05 <0.05 22 22 <0.05 <0.05 33 33NH3 – 1.83 0.9 19 1 6.6 3.82 15 0 2.12 0.79 13 0 0.85 0.63 11 0NO3+NO2 10.0 (100) 0.34 0.063 8 4 2.13 0.31 7 5 1.23 0.19 8 5 0.61 0.17 7 3Pb 0.05 (0.1) 0.02 < 0.02 19 18 0.06 <0.02 15 12 0.04 <0.02 14 12 <0.05 <0.05 11 11pH (s.u.) 6.5 - 8.5 8.6 7.67 32 0 8.5 7.58 31 0 8.44 7.01 31 0 8.7 7.94 27 0SO4 250 284 120 45 0 2840 1898 45 0 1090 569 22 0 873 194 34 0TDS 1.25 ×
Background 980 740 42 0 4758 3390 25 0 2320 1581 39 0 1650 945 17 0
Continued . . .1 NS = total number of sampling events; ND = number of nondetect measurements. 2 Colorado drinking water standards (agricultural use standards in parentheses).

A-16
Table 4.11. Historic Groundwater Quality Summary for Trapper Mine (data from Trapper Mining, Inc.) (continued) Analyte Concentration, mg/L unless otherwise noted
Well GD2 (1982–2000) Well GD3 (1988–2000) Well GF4 (1982–2000) Well GF5 (1984–2000) Analyte
Standard2 Max Mean NS ND Max Mean NS ND Max Mean NS ND Max Mean NS ND Al (5.0) 0.07 <0.05 42 40 2.1 0.10 22 20 2.1 0.10 60 39 1.01 0.04 53 44 As 0.05 (0.1) 0.002 <0.001 19 15 0.003 < 0.001 13 10 0.003 <0.001 19 14 0.002 <0.001 17 13 B (0.75) 0.74 0.19 44 0 0.23 0.17 22 0 0.23 0.17 62 1 0.47 0.35 54 0 Ba 2.0 0.3 0.09 45 7 0.22 0.07 22 0 0.22 0.07 64 7 0.68 0.27 53 2 Cd 0.005 <0.003 <0.003 20 20 0.005 <0.003 14 13 0.005 <0.003 21 20 0.005 <0.003 18 17 Cl 250 15 11.7 19 0 26 22.6 13 0 26 22.6 19 0 21 11.2 17 0 Cr 0.1 0.01 <0.004 44 43 0.04 <0.004 21 18 0.04 <0.004 60 57 0.01 <0.004 52 49 Fe 0.3 (5.0) 4.7 0.24 30 8 0.94 0.25 14 3 0.94 0.25 29 7 0.46 0.053 25 8 Mn 0.05 0.14 0.082 45 0 0.6 0.25 22 0 0.6 0.25 64 57 0.08 0.017 53 8 Mo – 0.2 <0.05 43 40 <0.05 <0.05 21 21 <0.05 <0.05 62 58 < 0.01 <0.01 52 52 NH3 – 4.1 1.7 19 0 7 1.35 13 0 7 1.35 19 0 3.59 2.85 17 1 NO3+NO2 10.0 (100) 0.03 0.004 7 6 0.9 0.2 7 4 0.48 0.11 7 3 3.69 0.53 7 4 Pb 0.05 (0.1) 0.06 <0.02 19 17 <0.05 <0.05 13 13 0.02 <0.02 19 18 <0.05 <0.05 17 17 pH (s.u.) 6.5 - 8.5 8.74 7.25 22 0 8.4 7.02 22 0 9.3 8.86 32 0 9.15 8.06 32 0 SO4 250 210 99.7 45 0 564 435 22 0 250 122 64 0 251 186 53 0 TDS 1.25 x background 900 793 31 0 1640 1325 28 0 1030 848 31 0 1300 1156 28 0 1 NS = total number of sampling events; ND = number of nondetect measurements. 2 Colorado drinking water standards (agricultural use standards in parentheses).
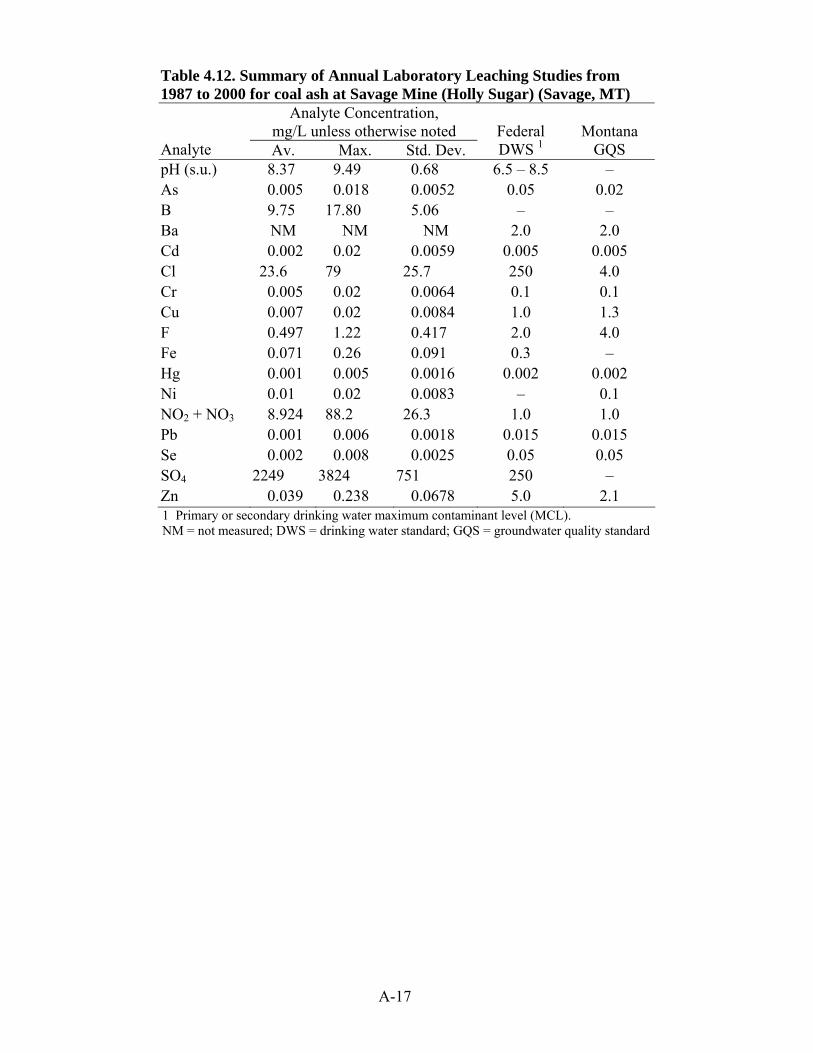
A-17
Table 4.12. Summary of Annual Laboratory Leaching Studies from 1987 to 2000 for coal ash at Savage Mine (Holly Sugar) (Savage, MT)
Analyte Concentration, mg/L unless otherwise noted
Analyte Av. Max. Std. Dev.
Federal DWS 1
Montana
GQS pH (s.u.) 8.37 9.49 0.68 6.5 – 8.5 – As 0.005 0.018 0.0052 0.05 0.02 B 9.75 17.80 5.06 – – Ba NM NM NM 2.0 2.0 Cd 0.002 0.02 0.0059 0.005 0.005 Cl 23.6 79 25.7 250 4.0 Cr 0.005 0.02 0.0064 0.1 0.1 Cu 0.007 0.02 0.0084 1.0 1.3 F 0.497 1.22 0.417 2.0 4.0 Fe 0.071 0.26 0.091 0.3 – Hg 0.001 0.005 0.0016 0.002 0.002 Ni 0.01 0.02 0.0083 – 0.1 NO2 + NO3 8.924 88.2 26.3 1.0 1.0 Pb 0.001 0.006 0.0018 0.015 0.015 Se 0.002 0.008 0.0025 0.05 0.05 SO4 2249 3824 751 250 – Zn 0.039 0.238 0.0678 5.0 2.1
1 Primary or secondary drinking water maximum contaminant level (MCL). NM = not measured; DWS = drinking water standard; GQS = groundwater quality standard

A-18
Table 4.13. Historic Maximum and Mean Concentrations of Trace Metals in Selected Wells at Savage Mine (MT)1 Well 001
(1986–2000) Well 106
(1987–2000) Well 261
(1987–2000) Well 263
(1987–2000) Well 284
(1987–1997) Well 286
(1986–2000) Well 289
(1990–2000) Well 290
(1986–2000) Well 291
(1986–2000) Analyte
Montana MCL
(mg/L)
Detection Limit
(mg/L) Max Mean Max Mean Max Mean Max Mean Max Mean Max Mean Max Mean Max Mean Max Mean As 0.02 0.002 0.002 0.0001 0.004 0.002 0.004 0.001 0.008 0.0013 ND ND 0.006 0.0004 0.006 0.0024 0.035 0.016 0.29 0.20 B – 0.1 0.64 0.090 0.72 0.532 0.54 0.36 0.54 0.36 0.58 0.38 0.76 0.59 0.25 0.12 0.59 0.43 0.87 0.68 Cd 0.005 0.011 0.01 0.0013 0.01 0.0014 0.013 0.0017 0.01 0.0010 0.01 0.0007 0.01 0.0007 0.01 0.001 0.01 0.0014 0.01 0.0017 Cr 0.1 0.05 ND ND ND ND ND ND ND ND ND ND ND ND ND ND ND ND ND ND Pb 0.015 0.002 0.027 0.0032 0.017 0.0046 0.017 0.0019 0.017 0.0028 0.004 0.001 0.007 0.001 0.016 0.0019 0.03 0.0032 0.027 0.0038
Ni 0.1 0.04 ND ND 0.21 0.021 ND ND ND ND 0.4 0.050 ND ND ND ND 0.1 0.0071 0.09 0.012 1 Nondetect readings were assigned a value of zero for evaluation of historic mean concentrations. 2 Reported detection limit for Cd exceeds current Montana MCL.

A-19
Table 4.14. Savage Mine
Federal Secondary MCLs Max. Min. Downgraders Upgraders
TDS (500 mg/L) 1156* 1156* 1430 1093 263 SO4 (250 mg/L) 320* 320* 438 380 TDS (500 mg/L) 578* 578* 1130 747 284 SO4 (250 mg/L) 226* 226* 320 192 TDS (500 mg/L) 650* 650* 1330 897 286 SO4 (250 mg/L) 321.1* 321.1* 541 290 TDS (500 mg/L) 1140 890 NA NA 289 SO4 (250 mg/L) 430 304.6 NA NA TDS (500 mg/L) 1085* 1085* 1770 1235 290 SO4 (250 mg/L) 468* 468* 745 398 TDS (500 mg/L) 1611* 1611* 2550 2155 291 SO4 (250 mg/L) 798.9* 798.9* 1340 1093
* Asterisk indicates that the reported value is based on analysis of a single groundwater sample prior to ash placement.
Table 4.15. Annual Tonnage Deposited in the Universal Mine Pit Year Coal Ash Coal Gasification Slag 1989 270,364 0 1990 254,806 0 1991 0 0 1992 320,000 0 1993 0 0 1994 0 0 1995 75,194 0 1996 114,740 0 1997 95,387 0 1998 117,742 23,301 1999 54,368 14,113 2000 152,571 0 2001 151,335 0 Total Amount $1,607,507 37,414
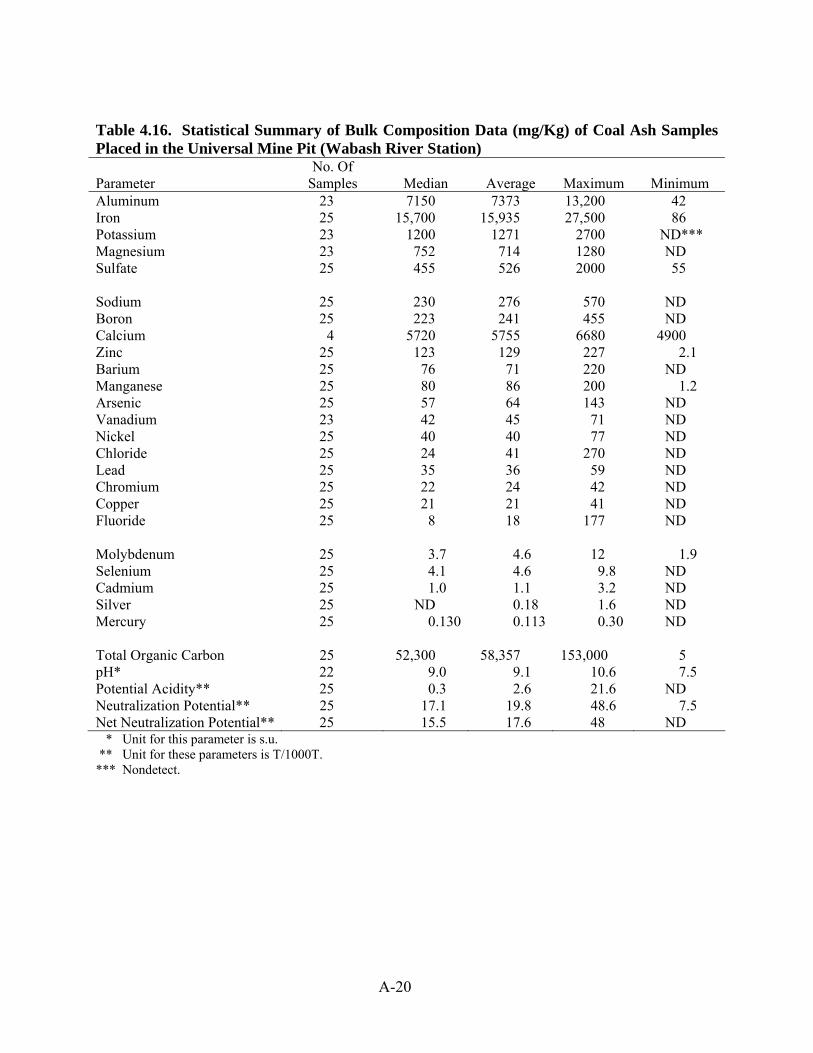
A-20
Table 4.16. Statistical Summary of Bulk Composition Data (mg/Kg) of Coal Ash Samples Placed in the Universal Mine Pit (Wabash River Station)
Parameter No. Of
Samples Median Average Maximum Minimum Aluminum 23 7150 7373 13,200 42 Iron 25 15,700 15,935 27,500 86 Potassium 23 1200 1271 2700 ND*** Magnesium 23 752 714 1280 ND Sulfate 25 455 526 2000 55
Sodium 25 230 276 570 ND Boron 25 223 241 455 ND Calcium 4 5720 5755 6680 4900 Zinc 25 123 129 227 2.1 Barium 25 76 71 220 ND Manganese 25 80 86 200 1.2 Arsenic 25 57 64 143 ND Vanadium 23 42 45 71 ND Nickel 25 40 40 77 ND Chloride 25 24 41 270 ND Lead 25 35 36 59 ND Chromium 25 22 24 42 ND Copper 25 21 21 41 ND Fluoride 25 8 18 177 ND
Molybdenum 25 3.7 4.6 12 1.9 Selenium 25 4.1 4.6 9.8 ND Cadmium 25 1.0 1.1 3.2 ND Silver 25 ND 0.18 1.6 ND Mercury 25 0.130 0.113 0.30 ND
Total Organic Carbon 25 52,300 58,357 153,000 5 pH* 22 9.0 9.1 10.6 7.5 Potential Acidity** 25 0.3 2.6 21.6 ND Neutralization Potential** 25 17.1 19.8 48.6 7.5 Net Neutralization Potential** 25 15.5 17.6 48 ND * Unit for this parameter is s.u. ** Unit for these parameters is T/1000T. *** Nondetect.
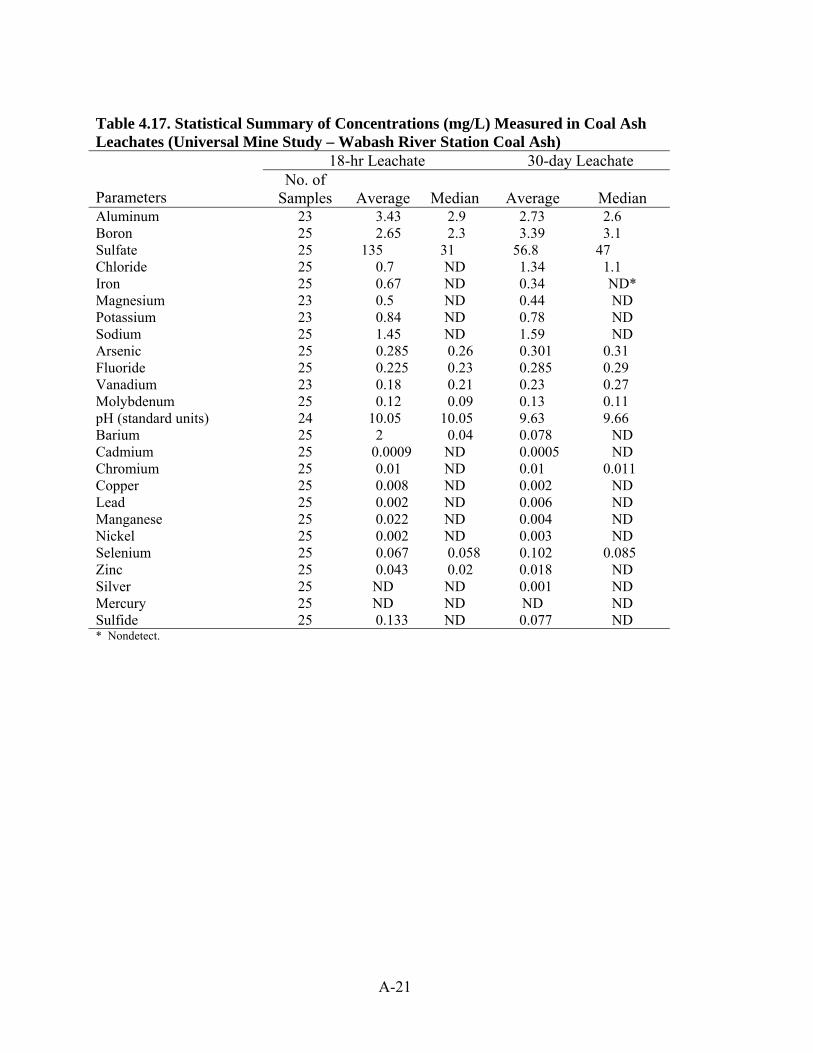
A-21
Table 4.17. Statistical Summary of Concentrations (mg/L) Measured in Coal Ash Leachates (Universal Mine Study – Wabash River Station Coal Ash)
18-hr Leachate 30-day Leachate
Parameters No. of
Samples Average Median Average Median Aluminum 23 3.43 2.9 2.73 2.6 Boron 25 2.65 2.3 3.39 3.1 Sulfate 25 135 31 56.8 47 Chloride 25 0.7 ND 1.34 1.1 Iron 25 0.67 ND 0.34 ND* Magnesium 23 0.5 ND 0.44 ND Potassium 23 0.84 ND 0.78 ND Sodium 25 1.45 ND 1.59 ND Arsenic 25 0.285 0.26 0.301 0.31 Fluoride 25 0.225 0.23 0.285 0.29 Vanadium 23 0.18 0.21 0.23 0.27 Molybdenum 25 0.12 0.09 0.13 0.11 pH (standard units) 24 10.05 10.05 9.63 9.66 Barium 25 2 0.04 0.078 ND Cadmium 25 0.0009 ND 0.0005 ND Chromium 25 0.01 ND 0.01 0.011 Copper 25 0.008 ND 0.002 ND Lead 25 0.002 ND 0.006 ND Manganese 25 0.022 ND 0.004 ND Nickel 25 0.002 ND 0.003 ND Selenium 25 0.067 0.058 0.102 0.085 Zinc 25 0.043 0.02 0.018 ND Silver 25 ND ND 0.001 ND Mercury 25 ND ND ND ND Sulfide 25 0.133 ND 0.077 ND * Nondetect.

A-22
Table 4.18. Summary Statistics for Measured Concentrations (mg/L) in MW-8 Leachate Water
Parameter No. Of
Samples Mean Median Minimum Maximum Alkalinity 17 276.2 220 120 530 Boron 17 44.2 46 ND* 56 Chloride 17 284.4 91 21 700 Sodium 17 190 120 ND 430 Sulfate 17 1847 1700 1400 3800 Total Organic Carbon 17 15.4 1.9 ND 110 Magnesium 17 6.6 6.9 ND 8.1 Molybdenum 17 1.7 1.6 0.96 2.3 Aluminum 15 0.38 0.44 ND 0.49 Arsenic 17 0.205 0.208 0.13 0.26 Sulfide 17 0.21 ND 3.4 ND Barium 17 0.053 0.036 ND 0.35 Fluoride 17 0.007 ND ND 0.12 Manganese 17 0.012 0.012 ND 0.023 Acidity 17 ND ND ND 0.0004 Cadmium 17 ND ND ND ND Chromium 17 ND ND ND ND Iron 17 ND ND ND ND Lead 17 ND ND ND ND Mercury 17 ND ND ND ND Selenium 17 ND ND ND 0.006 Silver 17 ND ND ND ND Zinc 17 ND ND ND ND pH (standard units) 17 8.96 9.2 9.5 6.9 * Nondetect.

A-23
Table 4.19. List of Water Quality Parameters Monitored at the Universal Site Acidity Mercury Alkalinity Molybdenum Aluminum Nickel Arsenic ORP Boron Potassium Cadmium Selenium Calcium Silver Chloride Sodium Chromium Specific conductivity Copper Sulfate Fluoride Sulfide Hardness Temperature Iron TDS Lead TSS Magnesium TOC Manganese Zinc
pH
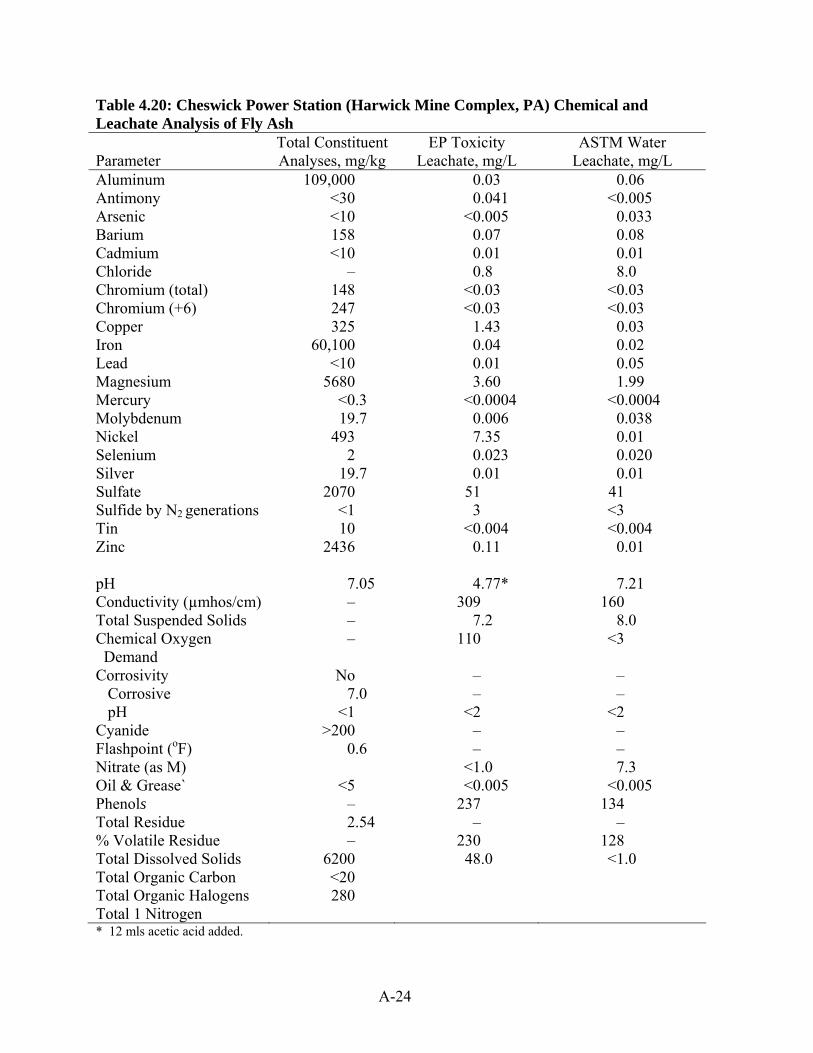
A-24
Table 4.20: Cheswick Power Station (Harwick Mine Complex, PA) Chemical and Leachate Analysis of Fly Ash
Parameter Total Constituent Analyses, mg/kg
EP Toxicity Leachate, mg/L
ASTM Water Leachate, mg/L
Aluminum Antimony Arsenic Barium Cadmium Chloride Chromium (total) Chromium (+6) Copper Iron Lead Magnesium Mercury Molybdenum Nickel Selenium Silver Sulfate Sulfide by N2 generations Tin Zinc pH Conductivity (µmhos/cm) Total Suspended Solids Chemical Oxygen Demand Corrosivity Corrosive pH Cyanide Flashpoint (oF) Nitrate (as M) Oil & Grease` Phenols Total Residue % Volatile Residue Total Dissolved Solids Total Organic Carbon Total Organic Halogens Total 1 Nitrogen
109,000 <30 <10 158 <10
– 148 247 325
60,100 <10
5680 <0.3 19.7
493 2
19.7 2070
<1 10
2436
7.05 – – –
No 7.0
<1 >200
0.6
<5 – 2.54 –
6200 <20 280
0.03 0.041
<0.005 0.07 0.01 0.8
<0.03 <0.03
1.43 0.04 0.01 3.60
<0.0004 0.006 7.35 0.023 0.01
51 3
<0.004 0.11
4.77* 309
7.2 110
– –
<2 – –
<1.0 <0.005
237 –
230 48.0
0.06 <0.005
0.033 0.08 0.01 8.0
<0.03 <0.03
0.03 0.02 0.05 1.99
<0.0004 0.038 0.01 0.020 0.01
41 <3 <0.004
0.01
7.21 160
8.0 <3
– –
<2 – – 7.3
<0.005 134
– 128 <1.0
* 12 mls acetic acid added.
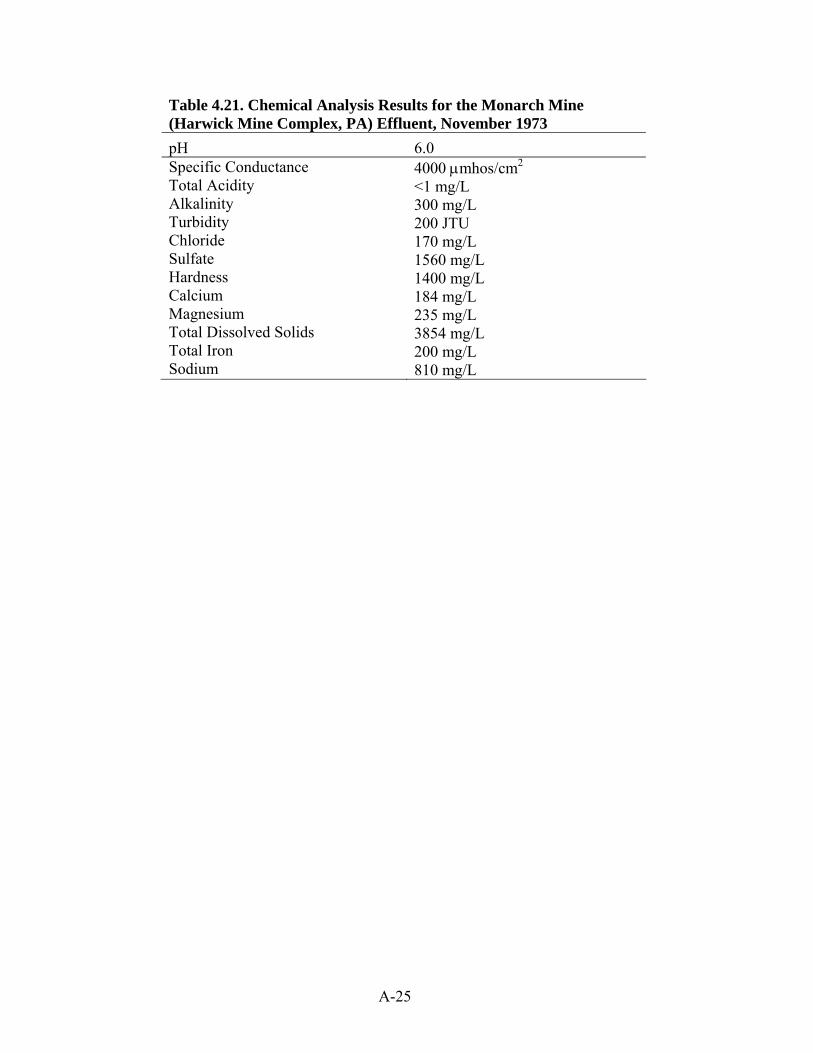
A-25
Table 4.21. Chemical Analysis Results for the Monarch Mine (Harwick Mine Complex, PA) Effluent, November 1973 pH 6.0 Specific Conductance Total Acidity Alkalinity Turbidity Chloride Sulfate Hardness Calcium Magnesium Total Dissolved Solids Total Iron Sodium
4000 µmhos/cm2 <1 mg/L 300 mg/L 200 JTU 170 mg/L 1560 mg/L 1400 mg/L 184 mg/L 235 mg/L 3854 mg/L 200 mg/L 810 mg/L

A-26
Table 4.22. Pre-and Post-Grouting Mean Concentrations of Mine Drainage Constituents for Wells Located in Discharge Plumes at the Clinton County, PA Site (Schuck et. al. 1996) Monitoring Well FF62
Condition Lab, pH
TDS, mg/L
SO4, mg/L
Acid,mg/L
Fe Tot, mg/L
Fe,+3,mg/L
Al, mg/L
Mn, mg/L
Cd, µg/L
Cu, µg/L
Cr, µg/L
Ca, µg/L
Pregrout 2.3 7970 3477 4088 876 737 256 39.2 83.6 806 221 58.1 Postgrout 2.5 5780 3110 2879 527 373 173 24.7 29.3 813 168 61.4 Monitoring Well S80D
Condition Lab, pH
TDS, mg/L
SO4, mg/L
Acid,mg/L
Fe, Tot, mg/L
Fe, +3, mg/L
Al, mg/L
Mn, mg/L
Cd, µg/L
Cu, µg/L
Cr, µg/L
Ca, µg/L
Pregrout 2.4 9951 3500 5096 937 749 394 45.5 108.5 154.2 394 66.4 Postgrout 2.7 7222 3483 3230 530 254 282 32.4 24.9 771 232 58.7 Monitoring Well W70
Condition Lab, pH
TDS, mg/L
SO4, mg/L
Acid,mg/L
Fe, Tot, mg/L
Fe, +3, mg/L
Al, mg/L
Mn, mg/L
Cd, µg/L
Cu, µg/L
Cr, µg/L
Ca, µg/L
Pregrout 2.6 9689 3695 4611 735 606 397 49.4 60.2 985 221 81.9 Postgrout 3.0 4795 3327 2348 268 185 180 21.8 17.3 635 156 56.3 Monitoring Well V36
Condition Lab, pH
TDS, mg/L
SO4, mg/L
Acid,mg/L
Fe, Tot, mg/L
Fe, +3, mg/L
Al, mg/L
Mn, mg/L
Cd, µg/L
Cu, µg/L
Cr, µg/L
Ca, µg/L
Pregrout 2.7 6777 3568 3624 570 396 316 63.7 57.3 526 104 83.1 Postgrout 3.1 5330 3111 2351 380 263 212 33.8 21.6 689 149 71.9

A-27
Table 4.23. Water Quality Data for Before Placement of Ash in the Big Gorilla Pit and after Placement of Ash in the Big Gorilla. Silverbrook Outflow Water Quality Data are also shown.
Analyte Big Gorilla
1993 Big Gorilla
1998 Silverbrook
1998 pH 3.2 11.4 4.3 Conductivity, µmhos/cm 210 1273 443 Alkalinity, mg/L CaCO3 <1 172 6.2 Acidity mg/L 37.8 <1 78 Turbidity, NTU 0.24 1.6 <1 Dissolved Solids, mg/L 98 311 268 Chloride, mg/L 6 3 9 Sulfate, mg/L 59 369 193 Aluminum, mg/L 4.2 1.32 6.81 Arsenic, mg/L <0.001 <0.004 <0.004 Barium, mg/L <0.1 0.0013 0.028 Cadmium, mg/L 0.0007 <0.01 <0.01 Calcium, mg/L 3.95 195 27 Chromium, mg/L <0.001 0.051 <0.05 Copper, mg/L 0.02 0.012 0.023 Iron, mg/L 0.4 <0.02 17.7 Lead, mg/L 0.001 <0.001 <0.001 Magnesium, mg/L 4.5 0.193 9.6 Manganese, mg/L 0.72 <0.01 1.64 Mercury, mg/L <0.0002 0.0014 <0.001 Nickel, mg/L <0.04 <0.05 0.091 Nitrogen, mg/L <0.5 0.09 <0.04 Potassium, mg/L) 1 10.4 1.84 Selenium, mg/L <0.002 <0.007 <0.007 Silica, mg/L N/A 19.11 15.96 Sodium, mg/L 1.15 9.87 9.85 Zinc, mg/L 0.2 <0.01 0.295 NA Not available.

A-28
Table 4.24. Average of Values Above Detection from Analyses Performed on NEPCO Fly and Bottom Ash for Module 25 Regulations from 1992–2002 (maximum allowable leachate concentration values provided for comparison)
Bulk Analysis, mg/Kg
Leachate Analysis, mg/L*
Parameter Name Fly Ash Bottom
Ash Fly Ash Bottom
Ash
Max. Leachate
Conc., mg/L pH, s.u. 10.67 11.47 Sulfate 4901 3073 440 169 2500 Aluminum 26,440 13,993 2.53 2.77 5 Antimony 2.24 LF 0.05 0.01 0.15 Arsenic 17.79 3.55 LF LF 1.25 Barium 211 116 0.16 0.21 50 Boron 44.07 8.49 0.30 0.37 31.5 Cadmium 1.22 0.68 LD LD 0.13 Chromium 27.25 11.49 0.09 LF 2.5 Cobalt 3.62 1.11 LF LF Copper 28.13 8.18 0.09 0.07 32.5 Iron 8713 4399 0.14 0.24 7.5 Lead 29.99 12.17 LF LF 1.25 Manganese 161.04 2672.65 0.20 0.21 1.25 Mercury 0.64 LF LF LF 0.05 Molybdenum 9.28 3.29 0.13 0.02 4.38 Nickel 11.75 5.08 LF LF 2.5 Potassium 6737 4400 9.88 7.75 Selenium 14.38 5.47 0.17 0.03 1 Silver 3.56 LF LF LF Zinc 18.96 9.78 0.18 0.26 125 Nitrate-N 1.27 2.92 Chloride 15.75 54.67 2500 Sodium 10.73 6.14 Total Organic Carbon
LF 2.11
Acid Neutralizing Potential
847,400 1,258,625
LD = always less than detection. LF = less than 5 measurements above detection (of 22). *Leachate analyses were performed by TCLP before January 1995, and SPLP thereafter.

A-29
Table 4.25. Average of Concentrations of Groundwater Samples from Wells Sampled Four times a Year on or Near the NEPCO Property
Well 1 Well 2 Well3 Well 4 Well 9 Location 5/89–2/91 12/90–11/02 9/96–11/02 12/01–11/02 9/96–11/02 No. of samples 8 58 40 4 39 pH 4.30 5.04 4.30 3.75 3.7 Conductivity 89.13 68.88 249.28 528.25 455 Alkalinity 1.20 8.16 3.30 Hot Acidity 37.56 47.79 47.49 114.95 147.1 Iron, T 3.77 0.60 1.74 18.22 0.6 Manganese, T 0.33 0.43 0.85 8.69 1.7 Sulfate, T 33.50 30.81 82.82 191.75 182.7 Chloride 0.95 1.89 2.26 6.6 Sodium 0.25 4.66 9.38 4.47 16 Dis. Solids 75.25 69.40 161.54 438 368.6 Sus. Solids 2.86 7.15 9.48 5.33 29.2 Nitrate N 1.49 0.07 0.2 Silica, T 7.38 10.26 28.61 57.7 Aluminum, T 0.66 0.45 2.65 10.09 18 Barium, T 0.03 0.03 Calcium, T 6.26 20.65 32.03 18.8 Magnesium, T 2.70 3.79 5.84 14.23 8.9 Zinc, T 0.12 0.33 0.31 0.68 0.4 Potassium, T 1.68 1.84 2.34 3.9 All concentrations reported in mg/L except for conductivity (µS/cm), turbidity (ntu), and pH (s.u.). T indicates total concentrations in the water samples.

A-30
Table 4.26. Average Values for Chemical and Physical Characteristics of the Acid Mine Drainage from the Red Oak Mine Site Parameter Concentration, mg/L Aluminum 6 Calcium 63 Iron 200 Magnesium 42 Manganese 7 pH 4.3 Acidity (as CaCO3) 475

A-31
Table 4.27. XRF Data for the Materials Used in Grout Admixtures Constituents, % FBC By-Product Class F Flyash FGD Material Quick Lime K2O 1.6 2.4 0.2 None MgO 2.3 1.1 0.67 1.5 Fe2O3 6.2 5.6 0.56 0.35 Al2O3 11.5 28.5 2.6 0.5 SiO3 12.3 0.59 47.1 0.04 SiO2 24.7 52.4 3.4 1.5 CaO 24.8 1.6 35.4 97.5

APPENDIX B
FIGURES
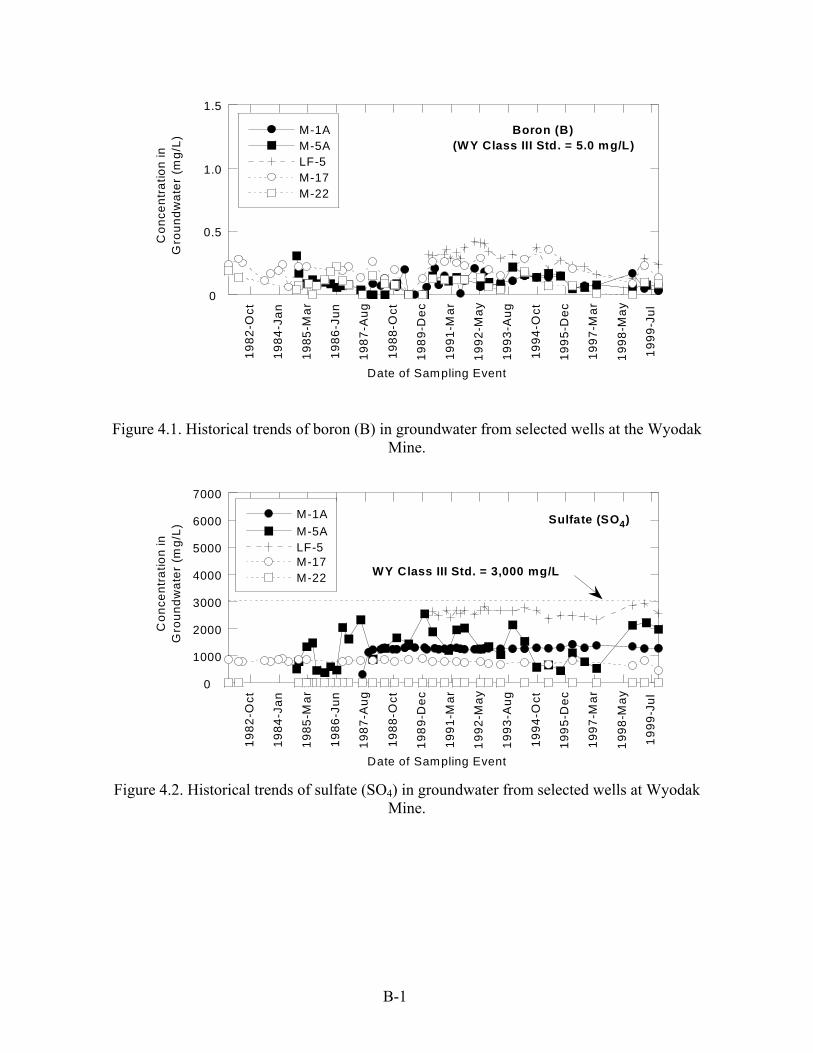
B-1
0
0.5
1.0
1.5
1982
-Oct
1984
-Jan
1985
-Mar
1986
-Jun
1987
-Aug
1988
-Oct
1989
-Dec
1991
-Mar
1992
-May
1993
-Aug
1994
-Oct
1995
-Dec
1997
-Mar
1998
-May
1999
-Jul
Boron (B)(WY Class III Std. = 5.0 mg/L)
M-1A
LF-5M-5A
M-17M-22
Con
cent
ratio
n in
Gro
undw
ater
(m
g/L)
Date of Sampling Event
Figure 4.1. Historical trends of boron (B) in groundwater from selected wells at the Wyodak Mine.
0
1000
2000
3000
4000
5000
6000
7000
1982
-Oct
1984
-Jan
1985
-Mar
1986
-Jun
1987
-Aug
1988
-Oct
1989
-Dec
1991
-Mar
1992
-May
1993
-Aug
1994
-Oct
1995
-Dec
1997
-Mar
1998
-May
1999
-Jul
Sulfate (SO4)M-1A
LF-5M-5A
M-17M-22
Con
cent
ratio
n in
Gro
undw
ater
(m
g/L)
Date of Sampling Event
WY Class III Std. = 3,000 mg/L
Figure 4.2. Historical trends of sulfate (SO4) in groundwater from selected wells at Wyodak
Mine.
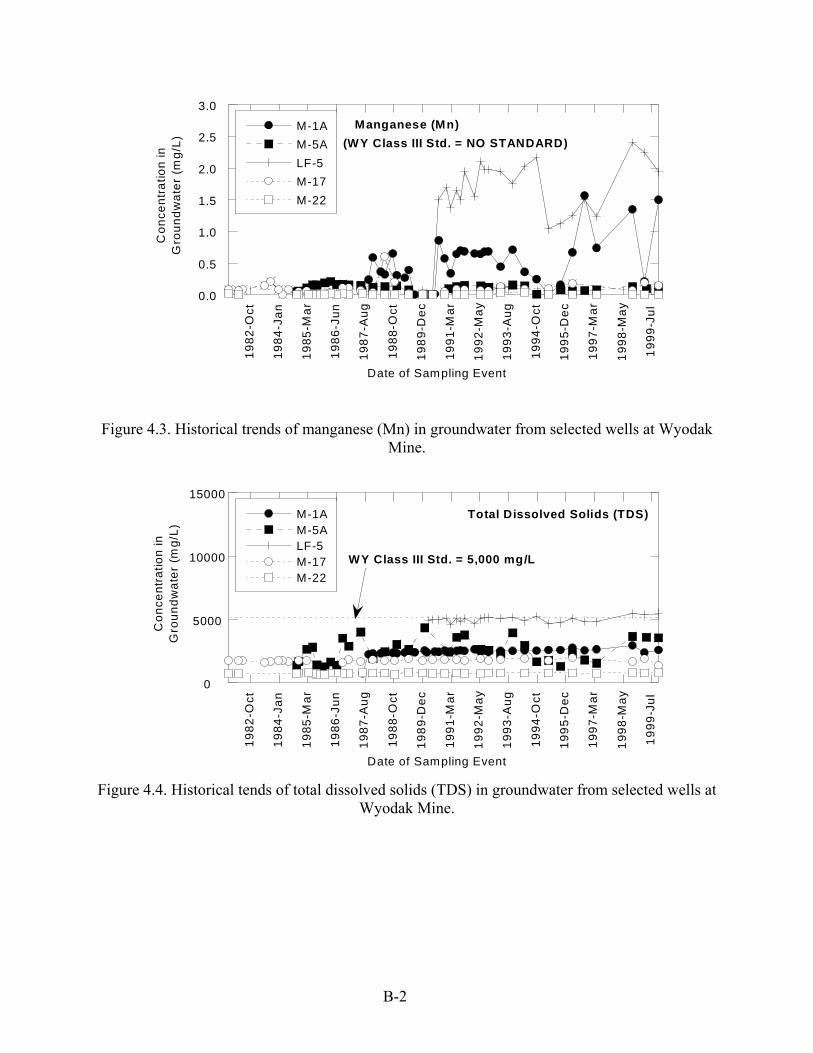
B-2
0.0
0.5
1.0
1.5
2.0
2.5
3.0
1982
-Oct
1984
-Jan
1985
-Mar
1986
-Jun
1987
-Aug
1988
-Oct
1989
-Dec
1991
-Mar
1992
-May
1993
-Aug
1994
-Oct
1995
-Dec
1997
-Mar
1998
-May
1999
-Jul
Manganese (Mn)M-1AM-5ALF-5M-17M-22
Con
cent
ratio
n in
Gro
undw
ater
(m
g/L)
Date of Sampling Event
(WY Class III Std. = NO STANDARD)
Figure 4.3. Historical trends of manganese (Mn) in groundwater from selected wells at Wyodak Mine.
0
5000
10000
15000
1982
-Oct
1984
-Jan
1985
-Mar
1986
-Jun
1987
-Aug
1988
-Oct
1989
-Dec
1991
-Mar
1992
-May
1993
-Aug
1994
-Oct
1995
-Dec
1997
-Mar
1998
-May
1999
-Jul
Total Dissolved Solids (TDS)M-1AM-5ALF-5M-17M-22
Con
cent
ratio
n in
Gro
undw
ater
(m
g/L)
Date of Sampling Event
WY Class III Std. = 5,000 mg/L
Figure 4.4. Historical tends of total dissolved solids (TDS) in groundwater from selected wells at
Wyodak Mine.

B-3
2
4
6
8
10
12
14
0 2000 4000 6000 8000 10000
FAOVBFA over OVB
Effl
uent
pH
E ffluent Volume (m L)
CDW S = 6.5 - 8.5
Figure 4.5
0
500
1000
1500
2000
0 2000 4000 6000 8000 10000
FAOVBFA over OVB
Effl
uent
SO
4 C
once
ntra
tion
(mg/
L)
Effluent Volume (m L)
CDW S = 250 mg/L
Figure 4.6. Effluent levels of pH SO4, Al, and Ba measured in Trapper Mine (CO) column leaching study (FA = fly ash, OVB = overburden, CDWS = Colorado drinking
water standard).

B-4
0
50
100
150
200
0 2000 4000 6000 8000 10000
FAOVBFA over OVB
Effl
uent
Al C
once
ntra
tion
(mg/
L)
Effluent Volume (m L)
Figure 4.7. Effluent levels of B, Cr, Mn, and V measured in Trapper Mine (CO) column leaching study (FA = fly ash, OVB = overburden, GWS = Colorado groundwater standard).
0.001
0.01
0.1
1
10
100
1000
10000
0 2000 4000 6000 8000 10000
FAOVBFA over OVB
Effl
uent
Ba
Con
cent
ratio
n (m
g/L)
Effluent Volume (m L)
CDW S = 2.0 mg/L
Figure 4.8

B-5
0
50
100
150
200
0 2000 4000 6000 8000 10000
FAOVBFA over OVB
Effl
uent
B C
once
ntra
tion
(mg/
L)
Effluent Volume (m L)
Figure 4.9
0
0.1
0.2
0.3
0.4
0.5
0 2000 4000 6000 8000 10000
FAOVBFA over OVB
Effl
uent
Cr
Con
cent
ratio
n (m
g/L)
Effluent Volume (m L)
CDW S = 0.05 mg/L
Figure 4.10

B-6
0
0.2
0.4
0.6
0.8
1
0 2000 4000 6000 8000 10000
FAOVBFA over OVB
Effl
uent
Mn
Con
cent
ratio
n (m
g/L)
Effluent Volume (m L)
CDW S = 0.05 mg/L
Figure 4.11
0
0.1
0.2
0.3
0.4
0 2000 4000 6000 8000 10000
FAOVBFA over OVB
Effl
uent
V C
once
ntra
tion
(mg/
L)
Effluent Volume (m L)
Figure 4.12

B-7
0.00
0.05
0.10
0.15
0.20
0.25
0.30
1986 1988 1990 1992 1994 1996 1998 2000
W ell 286W ell 289W ell 290W ell 291A
rsen
ic C
once
ntra
tion
(mg/
L)
Sampling Year
MontanaMCL
Figure 4.13 Historic arsenic (As) concentrations in groundwater monitoring wells at Savage
Mine (MT).
Universal Site Well - MW-8
pH, f
ield
(s. u
.)
Sample Date
6
7
8
9
10
05/01/1997 05/01/1999 05/01/200105/01/1998 05/01/2000 05/01/2002
Figure 4.14 Time-series plot of measured pH in field leachate samples.

B-8
Universal Site Well - MW-8
Sulfa
te, d
isso
lved
(mg/
L)
Sample Date
1000
1500
2000
2500
3000
3500
4000
05/01/1997 05/01/1999 05/01/200105/01/1998 05/01/2000 05/01/2002
Figure 4.15. Time-series plot of measured sulfate concentrations in field leachate samples.
Universal Site Well - MW-8
Bor
on, d
isso
lved
(mg/
L)
Sample Date
0
10
20
30
40
50
60
05/01/1997 05/01/1999 05/01/200105/01/1998 05/01/2000 05/01/2002
Figure 4.16. Time-series plot of measured boron concentrations in field leachate samples.

B-9
Universal Site Well - MW-8
Ars
enic
, dis
solv
ed (m
g/L)
Sample Date
0.10
0.15
0.20
0.25
0.30
05/01/1997 05/01/1999 05/01/200105/01/1998 05/01/2000 05/01/2002
Figure 4.17. Time-series plot of arsenic concentrations in field leachate samples.
Universal Site Wells - MW3 and MW4
MW-3 MW-4
pH, f
ield
(s. u
.)
Sample Date
5
6
7
8
9
05/01/1988 05/01/1990 05/01/1992 05/01/1994 05/01/1996 05/01/1998 05/01/2000 05/01/200205/01/1989 05/01/1991 05/01/1993 05/01/1995 05/01/1997 05/01/1999 05/01/2001
Figure 4.18. Time-series plot showing pH measured in groundwater samples.
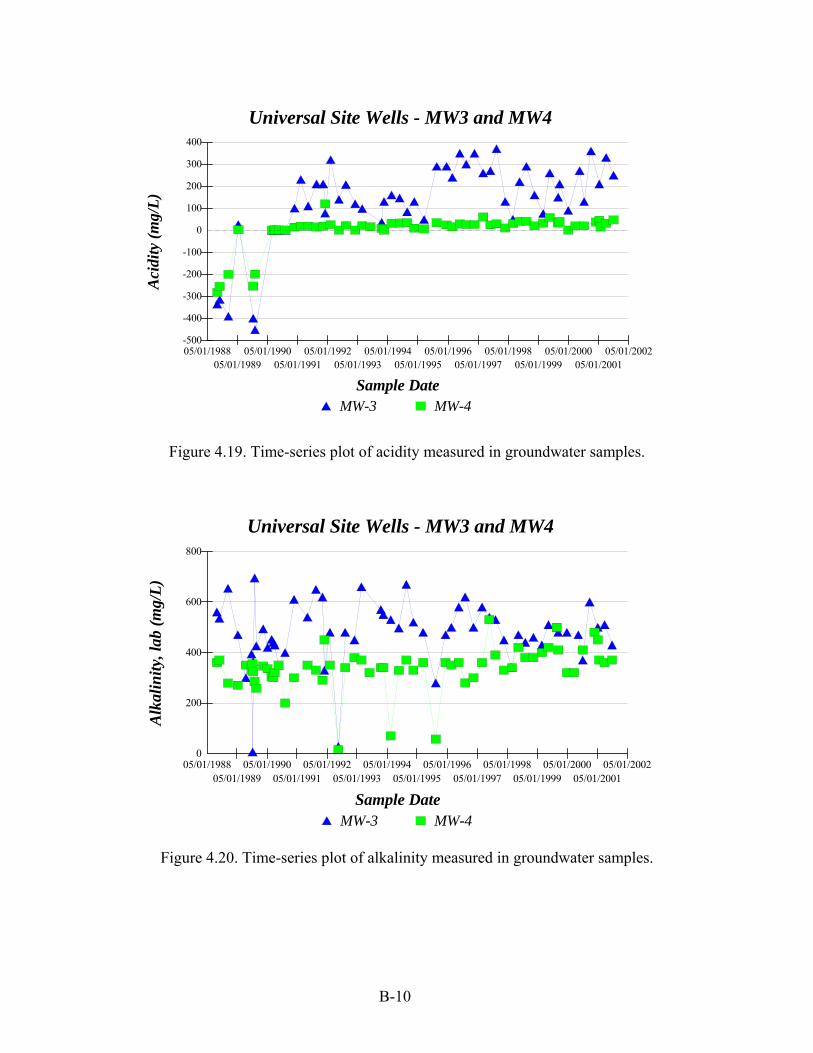
B-10
Universal Site Wells - MW3 and MW4
MW-3 MW-4
Aci
dity
(mg/
L)
Sample Date
-100
-200
-300
-400
-500
0
100
200
300
400
05/01/1988 05/01/1990 05/01/1992 05/01/1994 05/01/1996 05/01/1998 05/01/2000 05/01/200205/01/1989 05/01/1991 05/01/1993 05/01/1995 05/01/1997 05/01/1999 05/01/2001
Figure 4.19. Time-series plot of acidity measured in groundwater samples.
Universal Site Wells - MW3 and MW4
MW-3 MW-4
Alk
alin
ity, l
ab (m
g/L)
Sample Date
0
200
400
600
800
05/01/1988 05/01/1990 05/01/1992 05/01/1994 05/01/1996 05/01/1998 05/01/2000 05/01/200205/01/1989 05/01/1991 05/01/1993 05/01/1995 05/01/1997 05/01/1999 05/01/2001
Figure 4.20. Time-series plot of alkalinity measured in groundwater samples.

B-11
Universal Site Wells - MW3 and MW4
MW-3 MW-4
Man
gane
se, d
isso
lved
(mg/
L)
Sample Date
0
5
10
15
05/01/1988 05/01/1990 05/01/1992 05/01/1994 05/01/1996 05/01/1998 05/01/2000 05/01/200205/01/1989 05/01/1991 05/01/1993 05/01/1995 05/01/1997 05/01/1999 05/01/2001
Figure 4.21. Time-series plot of manganese measured in groundwater Samples
Universal Site Wells - MW3 and MW4
MW-3 MW-4
Iron
, dis
solv
ed (m
g/L)
Sample Date
0
10
20
30
40
50
05/01/1988 05/01/1990 05/01/1992 05/01/1994 05/01/1996 05/01/1998 05/01/2000 05/01/200205/01/1989 05/01/1991 05/01/1993 05/01/1995 05/01/1997 05/01/1999 05/01/2001
Figure 4.22. Time-series plot of iron measured in groundwater samples.

B-12
Universal Site Wells - MW3 and MW4
MW-3 MW-4
Sulfa
te, d
isso
lved
(mg/
L)
Sample Date
0
500
1000
1500
2000
2500
3000
05/01/1988 05/01/1990 05/01/1992 05/01/1994 05/01/1996 05/01/1998 05/01/2000 05/01/200205/01/1989 05/01/1991 05/01/1993 05/01/1995 05/01/1997 05/01/1999 05/01/2001
Figure 4.23. Time-series plot of sulfate measured in groundwater samples.
Universal Site Wells - MW3 and MW4
MW-3 MW-4
Chl
orid
e, d
isso
lved
(mg/
L)
Sample Date
0
10
20
30
40
50
60
70
05/01/1988 05/01/1990 05/01/1992 05/01/1994 05/01/1996 05/01/1998 05/01/2000 05/01/200205/01/1989 05/01/1991 05/01/1993 05/01/1995 05/01/1997 05/01/1999 05/01/2001
Figure 4.24. Time-series plot of chloride measured in groundwater samples.
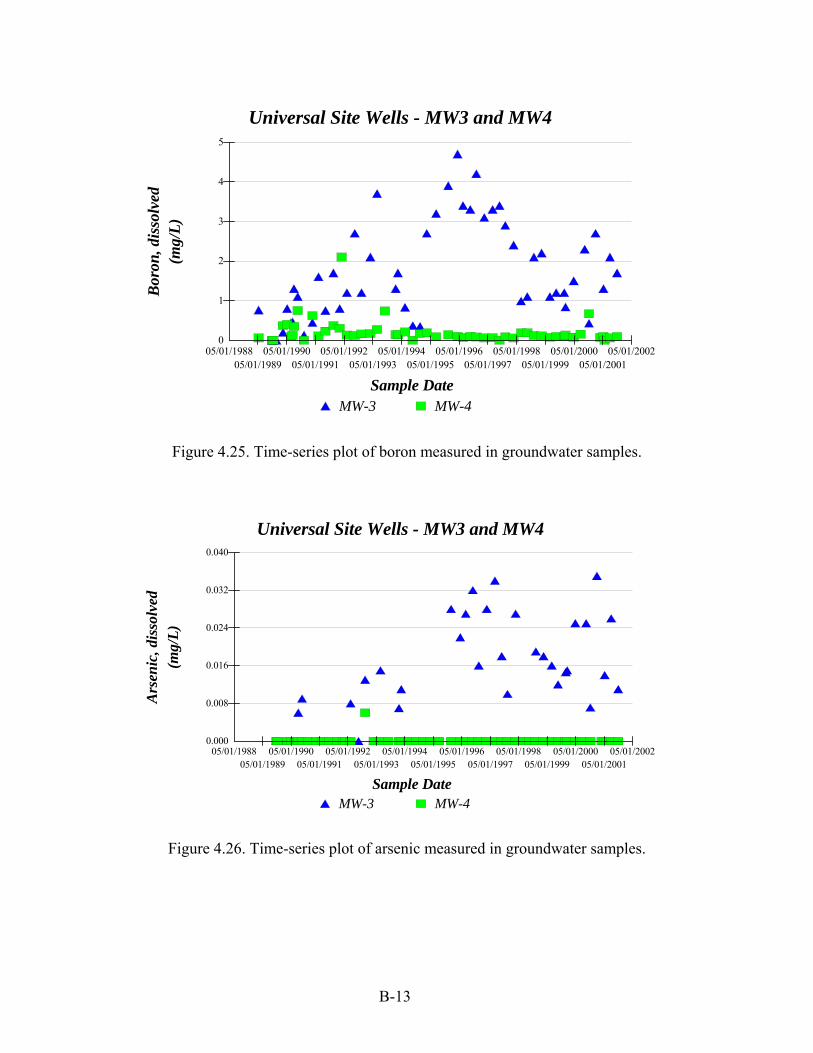
B-13
Universal Site Wells - MW3 and MW4
MW-3 MW-4
Bor
on, d
isso
lved
(mg/
L)
Sample Date
0
1
2
3
4
5
05/01/1988 05/01/1990 05/01/1992 05/01/1994 05/01/1996 05/01/1998 05/01/2000 05/01/200205/01/1989 05/01/1991 05/01/1993 05/01/1995 05/01/1997 05/01/1999 05/01/2001
Figure 4.25. Time-series plot of boron measured in groundwater samples.
Universal Site Wells - MW3 and MW4
MW-3 MW-4
Ars
enic
, dis
solv
ed(m
g/L)
Sample Date
0.000
0.008
0.016
0.024
0.032
0.040
05/01/1988 05/01/1990 05/01/1992 05/01/1994 05/01/1996 05/01/1998 05/01/2000 05/01/200205/01/1989 05/01/1991 05/01/1993 05/01/1995 05/01/1997 05/01/1999 05/01/2001
Figure 4.26. Time-series plot of arsenic measured in groundwater samples.

B-14
Universal Site - Mine SeeppH
, fie
ld (s
. u.)
Sample Date
2
3
4
5
6
7
8
05/01/1988 05/01/1990 05/01/1992 05/01/1994 05/01/1996 05/01/1998 05/01/2000 05/01/200205/01/1989 05/01/1991 05/01/1993 05/01/1995 05/01/1997 05/01/1999 05/01/2001
Figure 4.27. Time-series plot of pH measured in mine-seep water samples.
Universal Site - Mine Seep
Aci
dity
(mg/
L)
Sample Date
0
100
200
300
400
05/01/1988 05/01/1990 05/01/1992 05/01/1994 05/01/1996 05/01/1998 05/01/2000 05/01/200205/01/1989 05/01/1991 05/01/1993 05/01/1995 05/01/1997 05/01/1999 05/01/2001
Figure 4.28. Time-series plot of acidity measured in mine-seep water samples.
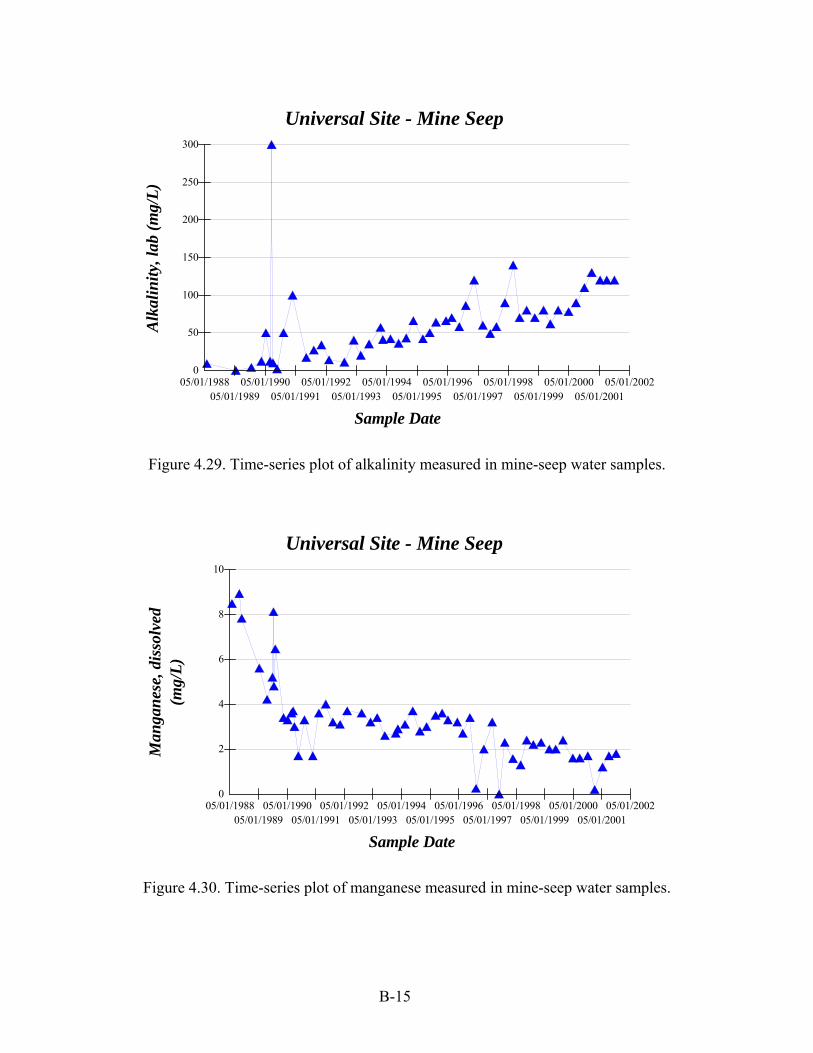
B-15
Universal Site - Mine SeepA
lkal
inity
, lab
(mg/
L)
Sample Date
0
50
100
150
200
250
300
05/01/1988 05/01/1990 05/01/1992 05/01/1994 05/01/1996 05/01/1998 05/01/2000 05/01/200205/01/1989 05/01/1991 05/01/1993 05/01/1995 05/01/1997 05/01/1999 05/01/2001
Figure 4.29. Time-series plot of alkalinity measured in mine-seep water samples.
Universal Site - Mine Seep
Man
gane
se, d
isso
lved
(mg/
L)
Sample Date
0
2
4
6
8
10
05/01/1988 05/01/1990 05/01/1992 05/01/1994 05/01/1996 05/01/1998 05/01/2000 05/01/200205/01/1989 05/01/1991 05/01/1993 05/01/1995 05/01/1997 05/01/1999 05/01/2001
Figure 4.30. Time-series plot of manganese measured in mine-seep water samples.
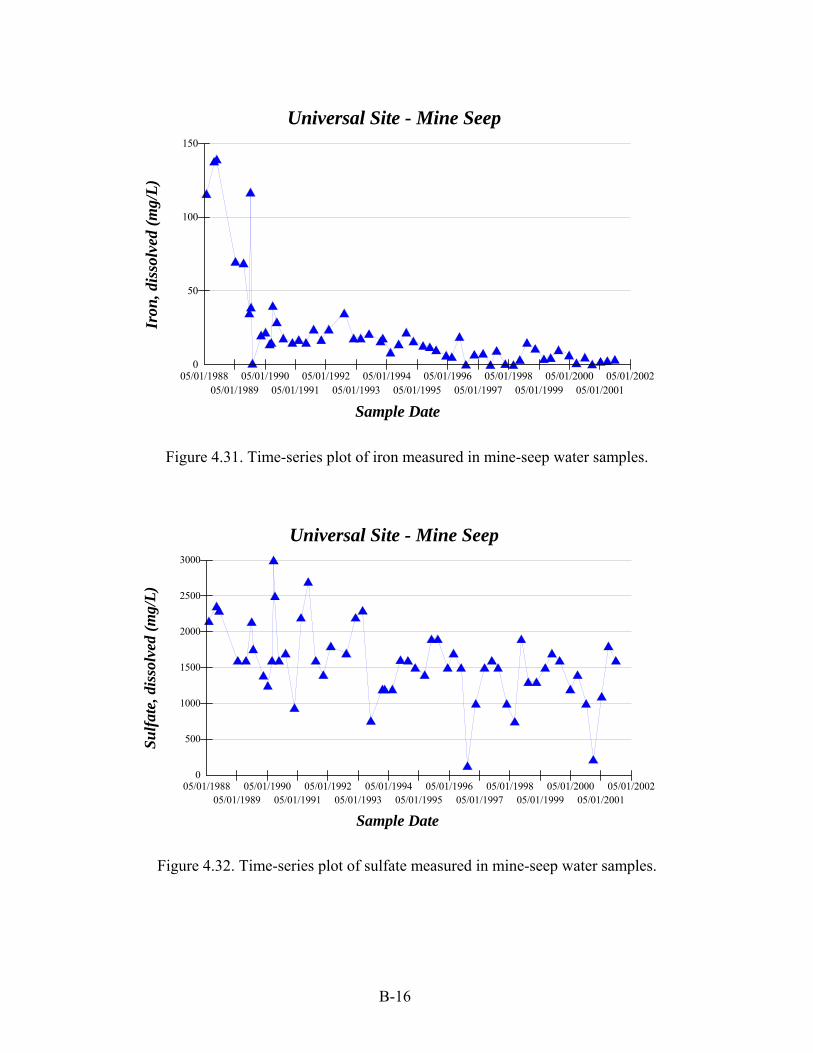
B-16
Universal Site - Mine Seep
Iron
, dis
solv
ed (m
g/L)
Sample Date
0
50
100
150
05/01/1988 05/01/1990 05/01/1992 05/01/1994 05/01/1996 05/01/1998 05/01/2000 05/01/200205/01/1989 05/01/1991 05/01/1993 05/01/1995 05/01/1997 05/01/1999 05/01/2001
Figure 4.31. Time-series plot of iron measured in mine-seep water samples.
Universal Site - Mine Seep
Sulfa
te, d
isso
lved
(mg/
L)
Sample Date
0
500
1000
1500
2000
2500
3000
05/01/1988 05/01/1990 05/01/1992 05/01/1994 05/01/1996 05/01/1998 05/01/2000 05/01/200205/01/1989 05/01/1991 05/01/1993 05/01/1995 05/01/1997 05/01/1999 05/01/2001
Figure 4.32. Time-series plot of sulfate measured in mine-seep water samples.

B-17
Universal Site - Mine Seep
Chl
orid
e, d
isso
lved
(mg/
L)
Sample Date
0
500
1000
1500
05/01/1988 05/01/1990 05/01/1992 05/01/1994 05/01/1996 05/01/1998 05/01/2000 05/01/200205/01/1989 05/01/1991 05/01/1993 05/01/1995 05/01/1997 05/01/1999 05/01/2001
Figure 4.33. Time-series plot of chloride measured in mine-seep water samples.
Universal Site - Mine Seep
Bor
on, d
isso
lved
(mg/
L)
Sample Date
0
1
2
3
4
5
05/01/1988 05/01/1990 05/01/1992 05/01/1994 05/01/1996 05/01/1998 05/01/2000 05/01/200205/01/1989 05/01/1991 05/01/1993 05/01/1995 05/01/1997 05/01/1999 05/01/2001
Figure 4.34. Time-series plot of boron measured in mine-seep water samples.

B-18
Figure 4.35. Alkalinity and pH values versus time for the mine discharge for 1-year postinjection.
Figure 4.36. Concentration of iron, aluminum, manganese, and pH versus time for the mine discharge for 1-year postinjection.

B-19
Figure 4.37

B-20
L-2 Lower SeepCalcium
0
100
200
300
400
500
600
Sampling Date
Cal
cium
Con
cent
ratio
n (m
g/L)
Period of grout injection
Figure 4.38. Time-series plot for measured calcium concentrations.
L-2 Lower SeepIron
0
50
100
150
200
250
300
350
Sampling Date
Iron
Con
cent
ratio
n (m
g/L)
Period of grout injection
Figure 4.39
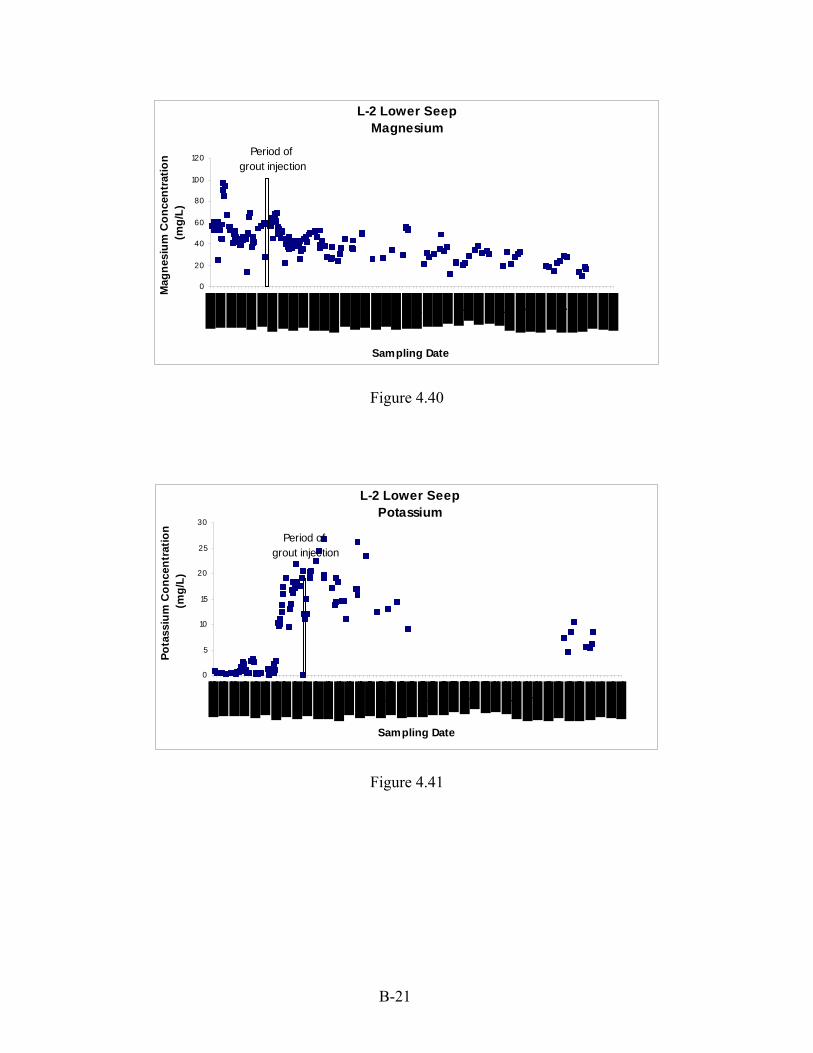
B-21
L-2 Lower SeepMagnesium
0
20
40
60
80
100
120
Sampling Date
Mag
nesi
um C
once
ntra
tion
(mg/
L)
Period of grout injection
Figure 4.40
L-2 Lower SeepPotassium
0
5
10
15
20
25
30
Sampling Date
Pota
ssiu
m C
once
ntra
tion
(mg/
L)
Period of grout injection
Figure 4.41
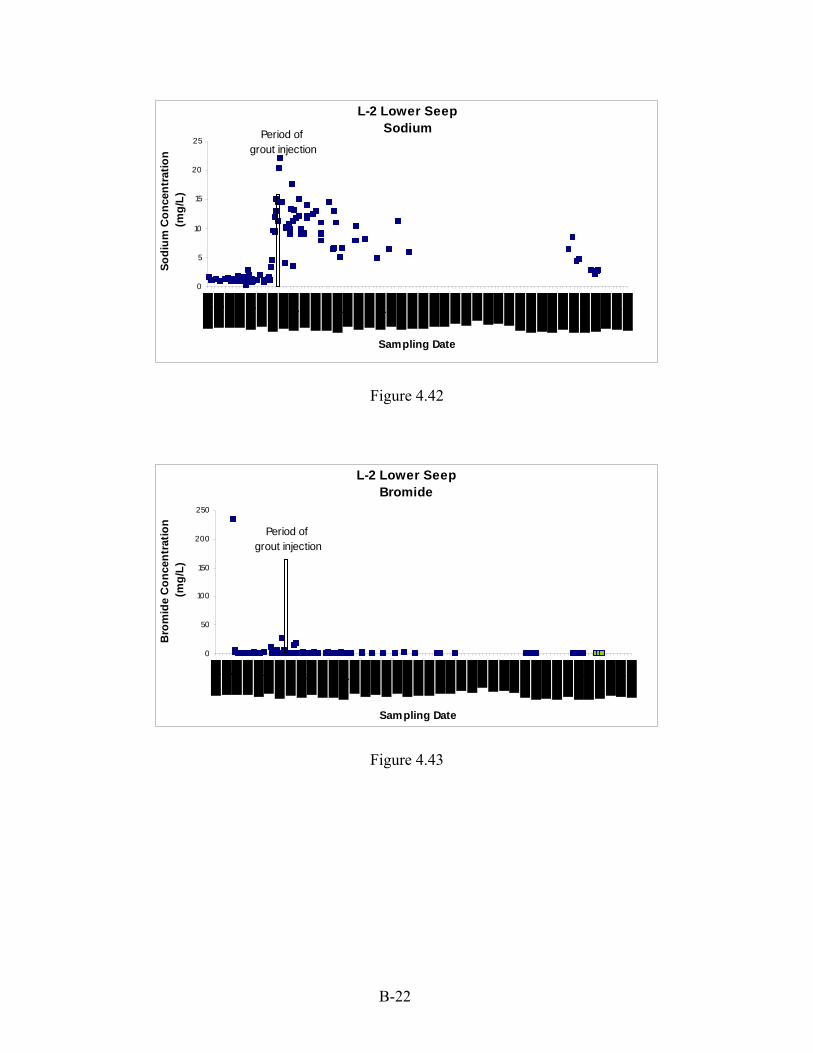
B-22
L-2 Lower SeepSodium
0
5
10
15
20
25
Sampling Date
Sodi
um C
once
ntra
tion
(mg/
L)
Period of grout injection
Figure 4.42
L-2 Lower SeepBromide
0
50
100
150
200
250
Sampling Date
Bro
mid
e C
once
ntra
tion
(mg/
L)
Period of grout injection
Figure 4.43

B-23
L-2 Lower SeepChloride
0
5
10
15
20
25
30
35
40
Sampling Date
Chl
orid
e C
once
ntra
tion
(mg/
L)Period of
grout injection
Figure 4.44
L-2 Lower SeepSulfate
0
1000
2000
3000
4000
5000
6000
7000
Sampling Date
Sulfa
te C
once
ntra
tion
(mg/
L)
Period of grout injection
Figure 4.45

B-24
L-2 Lower SeepAluminum
0
50
100
150
200
250
300
Sampling Date
Alu
min
um C
once
ntra
tion
(mg/
L)
Period of grout injection
Figure 4.46
L-2 Lower SeepManganese
0
2
4
6
8
10
12
14
16
18
Sampling Date
Man
gane
se C
once
ntra
tion
(mg/
L)
Period of grout injection
Figure 4.47
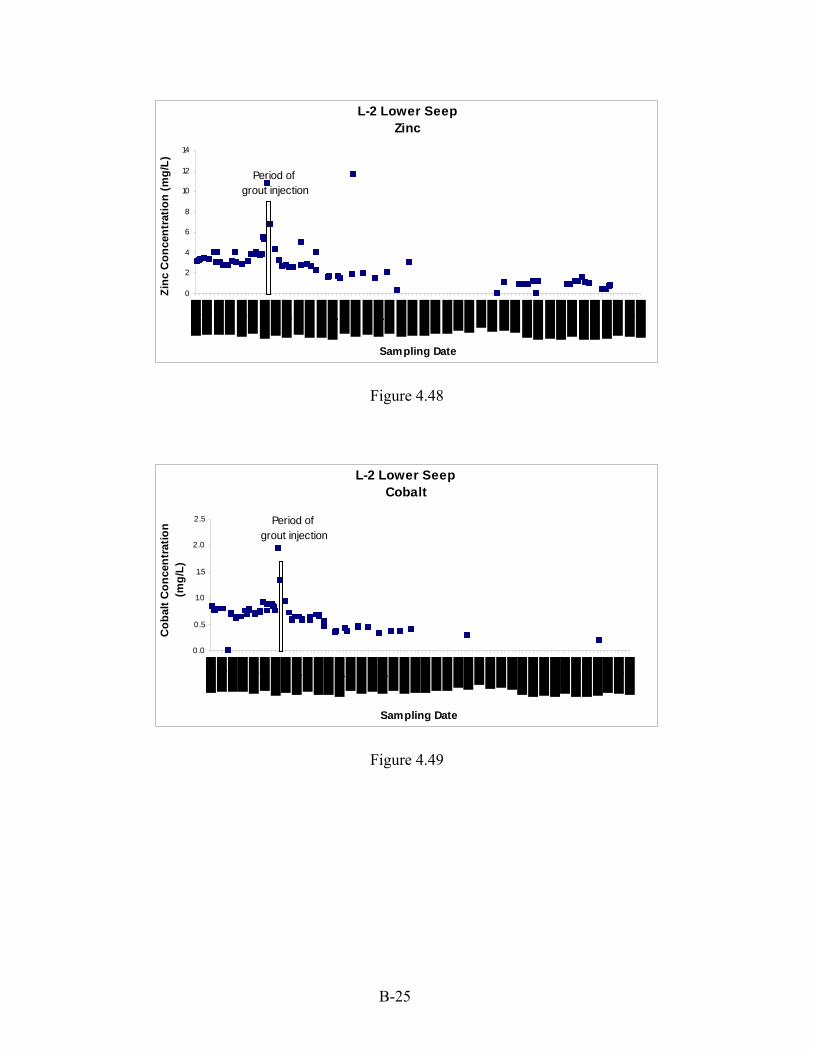
B-25
L-2 Lower SeepZinc
0
2
4
6
8
10
12
14
Sampling Date
Zinc
Con
cent
ratio
n (m
g/L)
Period of grout injection
Figure 4.48
L-2 Lower SeepCobalt
0.0
0.5
1.0
1.5
2.0
2.5
Sampling Date
Cob
alt C
once
ntra
tion
(mg/
L)
Period of grout injection
Figure 4.49
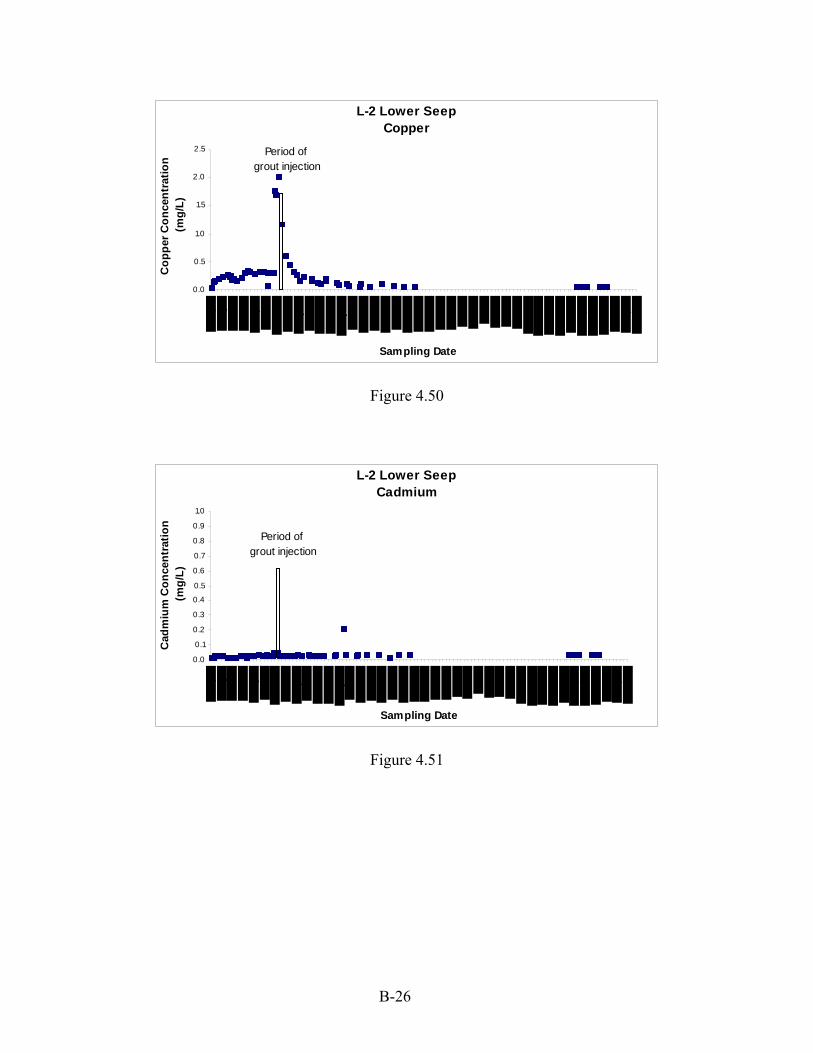
B-26
L-2 Lower SeepCopper
0.0
0.5
1.0
1.5
2.0
2.5
Sampling Date
Cop
per C
once
ntra
tion
(mg/
L)
Period of grout injection
Figure 4.50
L-2 Lower SeepCadmium
0.0
0.1
0.2
0.3
0.4
0.5
0.6
0.7
0.8
0.9
1.0
Sampling Date
Cad
miu
m C
once
ntra
tion
(mg/
L)
Period of grout injection
Figure 4.51

B-27
L-2 Lower SeepNickel
0.0
1.0
2.0
3.0
4.0
5.0
6.0
Sampling Date
Nic
kel C
once
ntra
tion
(mg/
L)Period of
grout injection
Figure 4.52
L-2 Lower SeepTotal Acidity
0
500
1000
1500
2000
2500
3000
Sampling Date
Tota
l Aci
dity
(mg/
L)
Period of grout injection
Figure 4.53
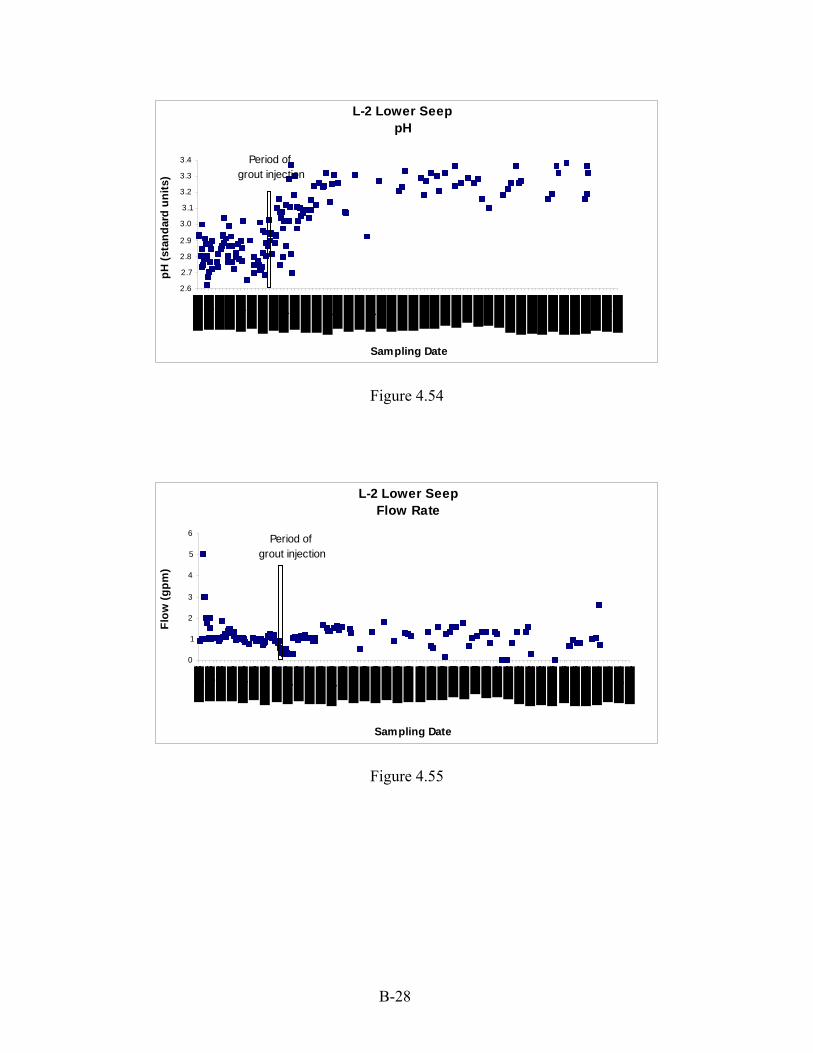
B-28
L-2 Lower SeeppH
2.6
2.7
2.8
2.9
3.0
3.1
3.2
3.3
3.4
Sampling Date
pH (s
tand
ard
units
)Period of
grout injection
Figure 4.54
L-2 Lower SeepFlow Rate
0
1
2
3
4
5
6
Sampling Date
Flow
(gpm
)
Period of grout injection
Figure 4.55

B-29
L-2 Lower SeepTotal Dissolved Solids
0
1000
2000
3000
4000
5000
6000
Sampling Date
Tota
l Dis
solv
ed S
olid
s (m
g/L)
Period of grout injection
Figure 4.56