use of comparisons of patterns of stock return and accounting data in understanding apparently...
TRANSCRIPT

Use of Comparisons of Patterns of Stock Returnand Accounting Data in Understanding
Apparently Anomalous Returns toAccounting-based Trading Strategies
PETER EASTON, ProfessorOhio State University
Bernard, Thomas, and Wahlen (1997) examine six accounting-based stockprice anomalies, using samples of firms drawn from the Center for Research inSecurity Prices (CRSP)/COMPUSTAT population over the period 1973 to 1992.Their aim is to determine the extent to which the anomalies represent marketmispricing or reflect risk premia for unidentified risk. They argue that marketmispricing is indicated if (1) the anomalous returns are concentrated aroundsubsequent earnings announcements in patterns suggesting that the earningsinformation causes traders to re-examine their prior (incorrect) beliefs, and (2)anomalous returns on zero-investment portfolios are positive, period after peri-od. They claim that the absence of these attributes increases the likelihood thatthe anomaly is an artifact of mismeasured risk. The primary results of the paperare most easily seen in their Table 4 and Figures 1 and 2.
Bernard and Thomas (1990) reported evidence of condition (1) andBernard and Thomas (1989) reported evidence of condition (2). For theBernard and Thomas (1990) sample, a trading strategy of going short stocks inthe lowest SUE decile and investing the proceeds in stocks in the highest SUEdecile yielded excess returns that tended to be concentrated around the subse-quent four earnings announcement dates, and the pattern of these excess returns(+, +, +, -) coincided with the pattern of autocorrelations in the SUEs. This evi-dence was interpreted as consistent with a market that forms expectations as ifearnings follow a seasonal random walk, naively ignoring the autocorrelation.The abrupt and predictable price changes at subsequent earnings announcementdates have been seen by many (e.g.. Ball 1992; Ball and Bartov 1996) as thephenomenon that is most difficult to explain using a traditional risk story.Bernard and Thomas (1989) reported positive returns to their zero-investmentportfolio in 44 of the 50 quarters in their sample period, thus decreasing thelikelihood that post earnings-announcement drift was due to mispricing, ratherthan an unidentified risk premium. This method of separating risk and mispric-ing explanations has been used in several subsequent studies (e.g., Holthausenand Larcker 1992; Sloan 1996).
Contemporary Accounting Research Wol 14 No. 1 (Spring 1997) pp. 137-151 ©CAAA

138 Contemporary Accountitig Research
The contribution of Bernard, Thomas, and Wahlen (1997) lies in the appli-cation of the Bernard and Thomas (1989, 1990) method to six other tradingstrategies: five based on accounting and one based on size. They interpret theirresults as indicating that the anomaly based on earnings momentum (SUEs)probably reflects market mispricing, but the two value/glamour anomalies(based on the book-market ratio and the earnings-price ratio), and two anom-alies based on computerized fundamental analyses (from Ou and Penman 1989and Holthausen and Larcker 1992) are more likely to reflect risk premia thanindicated by prior research where evidence on the anomaly based on pricemomentum is mixed. Because analyses of returns from a size-based strategyare included "to indicate whether anomalous returns [from other strategies] areattributable to the size effect," Bernard, Thomas, and Wahlen draw no conclu-sions regarding the likely explanation for observed excess returns to thisstrategy.
The paper may be viewed as a response to the call from Ball (1992) fordevelopment (and testing) of theories of market inefficiency. Their simple the-ory has two assumptions: if a security is mispriced, corrections will occuraround subsequent information releases, and a disproportionate amount of pricecorrection occurs at future earnings announcements. Empirical evidence incon-sistent with these assumptions is viewed as evidence of mismeasured risk. Thecontribution of the paper lies in the demonstration that market mispricing con-sistent with the Bernard, Thomas, and Wahlen (1997) assumptions is notobserved for accounting-based anomalies other than earnings momentum. Aswith all tests of market efficiency, the empirical tests are a joint test of the the-ory (in this case tests of the validity of the assumptions) and market mispric-ing. Because we cannot directly test the validity of these assumptions, our con-clusions regarding the mispricing versus mismeasured risk explanations of theresults will depend on the extent to which we believe that the assumptions arereasonable descriptions of reality.
Although concentration of predictable anomalous returns around subse-quent earnings announcements and the absence of large losses may, as Bernard,Thomas, and Wahlen (1997) claim, change readers' priors regarding the likeli-hood of a market mispricing explanation, absence of these features may notchange priors at all, because the evidence is consistent with either an unidenti-fied risk factor or mispricing explanation. Further, evidence of similar returnpatterns for the Bernard and Thomas (1990) SUE strategy and for other tradingstrategies may lead readers to question their priors regarding the likelihood thatthe Bernard and Thomas result is due to market mispricing. Finally, the poten-tial contribution of this paper rests on the choice of bases and methods forcomparison. I will suggest some alternative bases and methods.

U s e o f C o m p a r i s o n s o f P a t t e m s o f S t o c k R e t u m a n d A c c o u n t i n g D a t a . . . . 1 3 9
Possible interpretations from the Bernard and Thomas tests
Anomalous returns concentrated around earnings announcements
Positive evidenceA concentration of anomalous returns around earnings announcements could beinterpreted as evidence that the market misprices stocks due to biases in its esti-mates of future earnings, and this mispricing is corrected when the earnings aresubsequently announced. This relation is the interpretation in Bernard, Thomas,and Wahlen (1997). On the other hand, these returns could be due to other fac-tors (such as market frictions) that are manifested at the earnings announce-ment. Evidence consistent with this explanation is seen in Table 3 where thesum of the absolute values of the returns across the four announcement win-dows is 2.5 percent for the SUE strategy and 3.71 percent for the size strategy.If, as Bernard, Thomas, and Wahlen assume, earnings information is on aver-age "neutral" for the size strategy, the market reaction on earnings announce-ment dates for this strategy is not due to the bias in the market's expectation ofearnings. Further the explanation for the announcement period excess returnsto the size strategy may also apply to other strategies.' Thus, we may seekempirical evidence in support of other explanations. For example, we may lookfor evidence of the proportion of trades at, or near, the bid price during theearnings announcement window for each side of the trading strategy: moretrades near the ask price for the long side of the portfolio and near the bid pricefor the short side of the portfolio would suggest that bid-ask bounce (not mar-ket mispricing) may explain the apparent price movement during the earningsannouncement window. An alternative explanation may lie in the results ofChari, Jaganathan, and Ofer (1988), who show that the returns to a size-basedstrategy are primarily due to the small firm side of the portfolio, and the returnsto these stock are partly explained by the tendency to announce "good" newsearly.^ Perhaps firms with prior very good news (those in the high SUE decile)are expected to release subsequent good news early so that, following the logicin Chari, Jaganathan, and Ofer, excess returns will be positive. Suppose, how-ever, that firms with prior very "bad" news are expected to announce furtherbad news early: if there is no early announcement, price will rise, on-time newswill lead to a fall in prices, and price will rise further if there is no on-timeannouncement, and ceteris paribus, there will be no price change at the latedate. Although these explanations are speculative, they are, nevertheless, plau-sible and empirically verifiable.
Negative evidenceAvailability of reasonably reliable earnings announcement dates provides aconvenient basis for the researcher to examine price corrections (both magni-tude and direction) on the release of subsequent information. However, evi-dence that the share price correction is not concentrated around earningsannouncements is consistent with both market mispricing with a gradual cor-
140 Contemporary Accounting Research
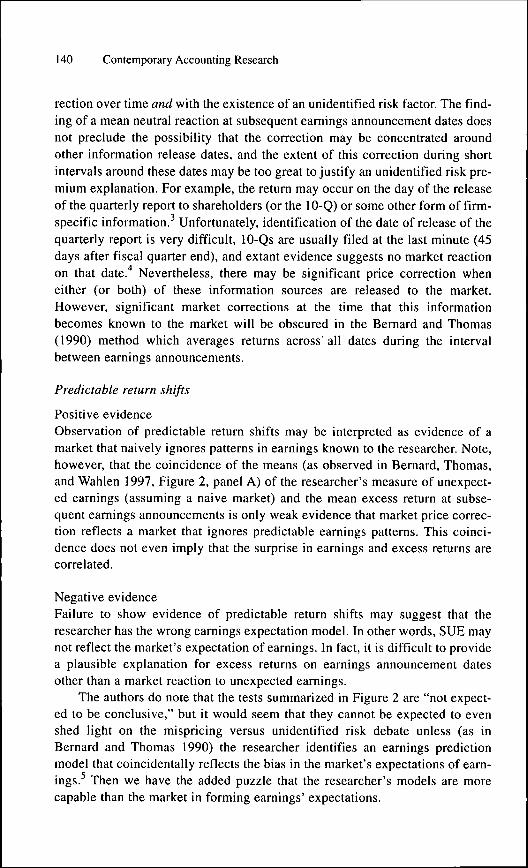
rection over time and with the existence of an unidentified risk factor. The find-ing of a mean neutral reaction at subsequent earnings announcement dates doesnot preclude the possibility that the correction may be concentrated aroundother information release dates, and the extent of this correction during shortintervals around these dates may be too great to justify an unidentified risk pre-mium explanation. For example, the return may occur on the day of the releaseof the quarterly report to shareholders (or the 10-Q) or some other form of firm-specific information. Unfortunately, identification of the date of release of thequarterly report is very difficult, 10-Qs are usually filed at the last minute (45days after fiscal quarter end), and extant evidence suggests no market reactionon that date.'' Nevertheless, there may be significant price correction wheneither (or both) of these information sources are released to the market.However, significant market corrections at the time that this informationbecomes known to the market will be obscured in the Bernard and Thomas(1990) method which averages retums across' all dates during the intervalbetween eamings announcements.
Predictable return shifts
Positive evidenceObservation of predictable retum shifts may be interpreted as evidence of amarket that naively ignores pattems in earnings known to the researcher. Note,however, that the coincidence of the means (as observed in Bernard, Thomas,and Wahlen 1997, Figure 2, panel A) of the researcher's measure of unexpect-ed earnings (assuming a naive market) and the mean excess retum at subse-quent eamings announcements is only weak evidence that market price correc-tion reflects a market that ignores predictable eamings patterns. This coinci-dence does not even imply that the surprise in earnings and excess retums arecorrelated.
Negative evidenceFailure to show evidence of predictable retum shifts may suggest that theresearcher has the wrong eamings expectation model. In other words, SUE maynot reflect the market's expectation of earnings. In fact, it is difficult to providea plausible explanation for excess returns on eamings announcement datesother than a market reaction to unexpected eamings.
The authors do note that the tests summarized in Figure 2 are "not expect-ed to be conclusive," but it would seem that they cannot be expected to evenshed light on the mispricing versus unidentified risk debate unless (as inBernard and Thomas 1990) the researcher identifies an earnings predictionmodel that coincidentally reflects the bias in the market's expectations of eam-ings. Then we have the added puzzle that the researcher's models are morecapable than the market in forming eamings' expectations.

U s e of C o m p a r i s o n s o f P a t t e r n s of S t o c k R e t u m a n d A c c o u n t i n g D a t a . . . . 141
Consistently positive quarterly returns
Positive evidenceBernard, Thomas, and Wahlen (1997) interpret the high mean, low standarddeviation, and the observation of negative retums to the trading strategy basedon SUEs in only eight of their 74 sample quarters as evidence of market mis-pricing, rather than risk. However, such an interpretation raises the inevitablequestion: what proportion of losses would be considered risky? Further, theinterpretation is subject to the caveat that investors may expect a higher inci-dence of positive returns as compensation for the possibility of a catastrophicloss that may be observed in a subsequent quarter beyond the sample period.Nevertheless, the Bernard, Thomas, and Wahlen method is intuitively appeal-ing inasmuch as we would expect to see at least some losses in a more riskystrategy and less losses in a less risky strategy.
Despite the intuitive appeal of the Bernard, Thomas, and Wahlen (1997)method, it should be noted that both recurring positive returns and an equalincidence of positive and negative returns may, arguably, be consistent withmismeasurement of risk. Believers in the simple notion of the existence ofrewards (in the form of higher returns) for increased risk could argue a higherincidence of positive returns is more convincing evidence of risk differencesacross the two sides of the "hedge" portfolio. Within the framework of a sim-ple capital asset pricing model, losses are expected as frequently as gains forany zero investment strategy that does not perfectly hedge unsystematic or sys-tematic risk. Although (as Bernard, Thomas, and Wahlen observe) forminglarge portfolios should diversify away most unsystematic risk and the hedgeportfolio may diversify all systematic risk, we cannot be sure that any particu-lar portfolio will indeed be an adequate hedge against risk.^
Negative evidenceEvidence of a large loss or a similar incidence of gains and losses may be seenas evidence of an unidentified risk factor. However, for portfolios where theseretum patterns are observed there is also evidence of a concentration of returnsaround subsequent eamings announcement dates (see, for example, the retumpattems for size and for the Ou and Penman 1989 strategies). Is this evidenceof unidentified risk factors and mispricing or is it evidence of neither (forexample, mis-measurement of retums, good news announced early, etc.)?
Measurement of retumsBernard, Thomas, and Wahlen (1997) report average calendar-quarter excessretums for trading strategies based on information that arrives quarterly for theSUE and announcement-quarter retum strategies and annually for the otherstrategies. Use of more recent information for some strategies and older infor-mation for others may affect the calculated average excess retums and there-fore influence the conclusions regarding mispricing or unidentified risk factors.

142 Contemporary Accounting Research
Investment positions are held for 100 trading days for the SUE strategy and for260 trading days for the remaining strategies. Mispricing effects may differconsiderably between 100 and 260 days after information release. For example,it is evident from Table 3, where the mean excess return to the SUE strategy is5.9 percent in the first quarter after portfolio formation and -0.98 percent in thefourth quarter after portfolio formation, that including excess retums from thelater quarters in the excess return calculation would lead to more negative aver-age calendar-quarter excess retums than observed by Bemard, Thomas, andWahlen. Similarly focussing only on the first 100 days for the announcement-quarter returns strategy would also yield more negative returns than observedby Bernard, Thomas, and Wahlen, because excess returns are only 0.26 percentin the first quarter, but are 1.59 percent, 2.15 percent, and 2.32 percent in thesubsequent quarters. Use of 260 trading days for the SUE strategy and/or 100trading days for the announcement quarter retum strategy may change our con-clusions regarding the likelihood of risk versus mispricing explanations.
Further, there is no apparent reason for the focus in Bernard, Thomas, andWahlen (1997) on trading strategies based on holding stocks for 100 or 260trading days. The results in Table 3 and Figure 2 would suggest that tradingstrategies that exploit excess returns during shorter holding periods aroundearnings announcements may yield consistently positive excess returns. Theevidence in Chambers and Penman (1984) of the predictability of eamingsannouncement dates suggests that such strategies are implementable.
Comparisons of return patterns across the various strategies
A focus on returnsAlthough Bemard, Thomas, and Wahlen (1997) apply the same battery of teststo all six accounting anomalies (and to the size-based strategy), comparisons ofthe results of these tests across the anomalies are few, and there are only cur-sory attempts to determine whether these anomalies capture the same or differ-ent underlying phenomena. They report several cases of significant correlationsamong the quintile ranks of each of the factors on which the trading strategiesare based, but they conclude that "the correlations suggest that the six anom-alies capture different phenomena for the most part." Alternative interpreta-tions include the following: (1) all anomalies are poor indications of the sameunderlying phenomenon, and (2) correlation of quintile ranks is too crude toenable identification of the extent to which the anomalies capture similareffects. Nevertheless, the paper provides a useful starting point for future com-parisons of the anomalies. Recent developments in the finance and the account-ing literatures provide opportunities to develop from this base. These compar-isons may throw some light on the mispricing versus risk factor debate.
Recently Fama and French (1993, 1996) and Barber and Lyon (1997a, b)provide a means of comparing the excess returns to various trading strategies.When seen as methods for comparison of trading strategies, these methods are

Use of Comparisons of Patterns of Stock Return and Accounting Data . . . . 143
similar, in principle, to the method used by Jaffe, Keim, and Westerfield (1989)to differentiate the effects on stock retums of size and the earnings-to-priceratio. Unlike the method in Bemard, Thomas, and Wahlen (1997), these papersprovide a means of determining whether the effect of one trading strategy sub-sumes, or is subsumed by, the effect of another. Their methods are potentiallymore powerful than the Bernard, Thomas, and Wahlen method because theyprovide a mechanism for identifying excess returns after controlling for otherfactors. I will briefly discuss these methods and the possibility of applyingthese methods to the data used by Bemard, Thomas, and Wahlen.
The Fama and French three-factor model based on the intertemporal capi-tal asset pricing model may be expressed as the following:
rpt- rft =
where
'ft''mt
i- r/t) + spSMBi+ hpHMLi + ( I )
- the return on portfolio p for month t,- the risk-free rate of retum for month t,= the return on a value-weighted portfolio of stocks for month t,- the retum on a portfolio designed to mimic the risk related to
size: the difference between retums on a portfolio of smallstocks and a portfolio of large stocks; andthe return on a portfolio designed to mimic the risk related tothe ratio of book value of equity to market value of equity: thedifference between returns on a portfolio of high book-to-mar-ket stocks and a portfolio of low book-to-market stocks.
HMLt =
Fama and French (1993) show that the coefficient (hp) on HMLf is associatedwith relative distress: a positive coefficient indicating distress and a negativecoefficient indicating strength. Fama and French (1996) use this model toexplain all of the well-known market anomalies (including the earnings-priceanomaly) other than post earnings-announcement drift. The only anomaly theycould not explain by this three-factor model was the short-term retum momen-tum model of Jegadeesh and Titman (1993).^
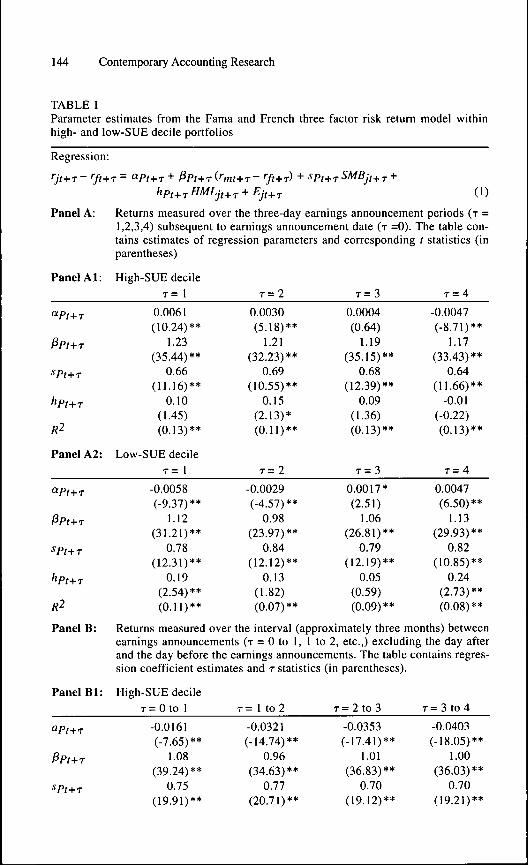
The recent availability (from CRSP) of daily returns on risk free securitiesprovides an opportunity to adapt this Fama and French procedure to comparethe announcement and nonannouncement period returns to various tradingstrategies. As an illustration of this procedure, I conducted Ibbotson (1975)Returns Across Time and Securities (RATS) regressions within both the port-folio of stocks in the high SUE decile and the portfolio of stocks in the lowSUE decile.^ I repeated these regressions for each of the three-day earningsannouncement periods subsequent to the earnings announcement date on whichthe SUE deciles are formed.' I also conducted RATS regressions for the peri-ods between announcements. Results from estimation of these regressions aresummarized in Table 1.
144 Contemporary Accounting Research
TABLE 1Parameter estimates from the Fama and French three factor risk return model withinhigh- and low-SLTE decile portfolios
Regression:
+ PPt+T(''mt+T- Jt+r) +
Panel A:
Panel Al:
(1)
Returns measured over the three-day eamings announcement periods (T =1,2,3,4) subsequent to earnings announcement date (T =0). The table con-tains estimates of regression parameters and corresponding t statistics (inparentheses)
High-SUE decileT = 1 T = 2 T = 3 T = 4
"Pr+T
^Pt+T
SPt+T
hpt+r
R2
Panel A2:
0.0061(10.24)**
1.23(35.44)**
0.66(11.16)**
0.10(1.45)(0.13)**
Low-SUE decileT = 1
0.0030(5.18)**
1.21(32.23)**
0.69(10.55)**
0.15(2.13)*(0.11)**
T = 2
0.0004(0.64)
1.19(35.15)**
0.68(12.39)**
0.09(1.36)(0.13)**
T = 3
-0.0047(-8.71)**
1.17(33.43)**
0.64(11.66)**
-0.01(-0.22)(0.13)**
T = 4
-0.0058(-9.37)**
1.12(31.21)**
0.78(12.31)**
0.19(2.54)**(0.11)**
-0.0029(-4.57)**
0.98(23.97)**
0.84(12.12)**
0.13(1.82)(0.07)**
0.0017*(2.51)
1.06(26.81)**
0.79(12.19)**
0.05(0.59)(0.09)**
0.0047(6.50)**
1.13(29.93)**
0.82(10.85)**
0.24(2.73)**(0.08)**
Panel B: Returns measured over the interval (approximately three months) betweenearnings announcements (T = 0 to 1, 1 to 2, etc.,) excluding the day afterand the day before the earnings announcements. The table contains regres-sion coefficient estimates and T statistics (in parentheses).
Panel Bl: High-SUE decileT = 0 to 1
apt+j -0.0161(-7.65)**
Ppt+T 1.08(39.24)**
spf.^.^ 0.75(19.91)**
T = 1 to 2
-0.0321(-14.74)**
0.96(34.63)**
0.77(20.71)**
T = 2 to 3
-0.0353(-17.41)**
1.01(36.83)**
0.70(19.12)**
T = 3 to 4
-0.0403(-18.05)**
1.00(36.03)**
0.70(19.21)**
U s e of C o m p a r i s o n s o f P a t t e m s of S t o c k R e t u m a n d A c c o u n t i n g D a t a . . . . 145
-0.10(-1.54)(0.32)**
-0.15(-6.31)**(0.29)**
-0.09(-3.54)**(0.30)**
-0.01(-1.04)(0.28)**
Panel Bl: Low-SUE decile
PPt+T
^Pt+T
hpt+T
R2
T = 0 to 1
-0.0629(-28.34)**
1.05(39.94)**
0.64(17.11)**
0.21(5.72)**(0.30)**
T = 1 to 2
-0.0506(-20.82)**
L06(37.93)**
0.72(18.31)**
0.24(5.95)**(0.28)**
T = 2 t o 3
-0.0495(-20.82)**
1.13(39.73)**
0.70(17.41)**
0.35(8.25)**(0.29)**
T = 3 to 4
-0.0544(-18.05)**
1.14(35.53)**
0.84(19.51)**
0.38(8.98)(0.29)**
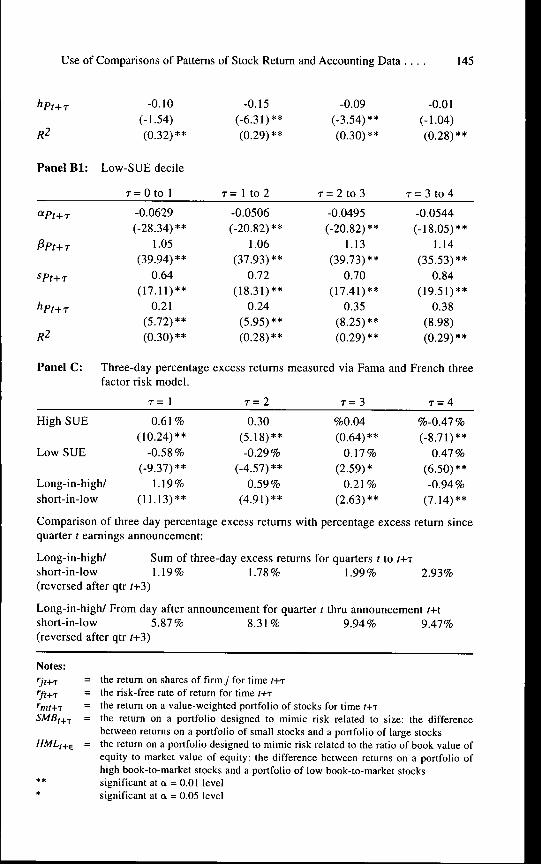
Panel C: Three-day percentage excess returns measured via Fama and French threefactor risk model.
T = 1 T = 2 T = 3 T = 4
High SUE
Low SUE
Long-in-high/short-in-low
0.61%(10.24)**
-0.58%(-9.37)**
1.19%(11.13)**
0.30(5.18)**-0.29%
(-4.57)**0.59%
(4.91)**
%0.04(0.64)**
0.17%(2.59)*
0.21 %(2.63)**
%-0.47%(-8.71)**
0.47%(6.50)**-0.94%
(7.14)**
Comparison of three day percentage excess returns with percentage excess return sincequarter t earnings announcement:
Long-in-high/ Sum of three-day excess returns for quarters t to t+ishort-in-low 1.19% 1.78% 1.99% 2.93%(reversed after qtr /+3)
Long-in-high/ From day after announcement for quarter t thru announcement t+tshort-in-low 5.87% 8.31% 9.94% 9.47%(reversed after qtr r-i-3)
Notes:rjt+i — the return on shares of firm 7 for time (+T'•yj -T = the risk-free rate of return for time t+T''mt+T = 'he return on a value-weighted portfolio of stocks for time f+TSMB,.f.j = the return on a portfolio designed to mimic risk related to size: the difference
between returns on a portfolio of small stocks and a portfolio of large stocksHMLj.^^ = the return on a portfolio designed to mimic risk related to the ratio of book value of
equity to market value of equity: the difference between returns on a portfolio ofhigh book-to-market stocks and a portfolio of low book-to-market stocks
** significant at a = 0.01 level* significant at a = 0.05 level

146 Contemporary Accounting Researcb
Comparison of parameter estimates for the regressions based on three-dayexcess returns for the high SUE (panel Al) and the low SUE (panel A2) decilesreveals a number of insights. Returns at the time of announcement of earningsof stocks in the high SUE decile have a higher P risk (between 1.17 and 1.23)than returns of stocks in the low SUE decile (between 0.98 and 1.13): this sug-gests that the Bernard, Thomas, and Wahlen (1997) procedure of subtractingthe return on the market portfolio may not be sufficient to control for the effectsof market price movements. The significance of the relation between returns toSUE portfolios and returns to a size portfolio (SMBf) is clear from the t statis-tics on the estimates of the coefficient sp, which range from 10.55 to 12.39: theloading on the size factor is greater for the stocks in the low-SUE decile(between 0.78 and 0.82 compared with between 0.64 and 0.69). Note, howev-er, that the relatively low t statistic on the estimates of hp(.^.j in the earningsannouncement intervals suggests that the book-to-price effect (HML() explainslittle of the observed excess returns to the SUE strategy at these dates. Thehigher loadings on 3 risk and size are observed only at the earnings announce-ment date; loadings for returns between announcements (see panels Bl and B2)are lower. There is no obvious pattern in the loadings on the relative distressfactor (HML() for the regressions based on the announcement returns, but, asexpected, the loadings are negative between announcement dates for the stocksin the high-SUE decile (between -0.09 and -0.10: see, panel Bl), indicatingfinancial strength, and positive for the stocks in the low-SUE decile (between0.21 and 0.38: see, panel B2), indicating financial distress. Note, however, thatthe relatively low t statistic on the estimates of hpf+^in the earnings announce-ment intervals suggest that the book-to-price effect explains little of theobserved excess returns to the SUE strategy at these dates.
The patterns of excess returns (estimated as the regression intercepts,apt+j) after controlling for size and book-to-market differences, are similar tothe pattern observed by Bernard and Thomas (1990) and by Bernard, Thomas,and Wahlen (1997). In other words, although size is a statistically significantexplanatory factor for post earnings-announcement returns, a significant por-tion remains unexplained.
Although the aim of Fama and French (1993, 1996) is to isolate three riskfactors for use in an empirical version ofthe intertemporal capital-asset pricingmodel and to demonstrate the effectiveness of these factors in explaining vari-ous anomalies, the method may be adapted to examine the extent to which anyanomaly subsumes, or is subsumed by, another. Just as SMBj represents thereturn to a size-based strategy (long in small stock and short in large stock), sowe could calculate a return to any other strategy. Indices of returns to otherstrategies could be added to regression (1) or substituted for SMB^ or HMLi .Significant coefficients on these indices would indicate that the excess returnto the portfolio was partially explained by the returns on the other strategy, butif (as in my analysis of the SUE deciles) non-zero intercepts remain, then theother strategy does not completely explain the portfolio excess returns.

Use of Comparisons of Patterns of Stock Retum and Accounting Data . . . . 147
Barber and Lyon (1997a, b) argue that use of indices (such as the return ona size-matched portfolio in Bernard and Thomas 1990; return to the marketportfolio in Bernard, Thomas, and Wahlen 1997 and SMBf and HMLf in Famaand French 1993, 1996) may lead to biased estimates of excess return. Theydemonstrate the superiority of a method that compares the returns of the sub-ject portfolio and return on a portfolio formed by matching each firm to anoth-er on the basis of size and price-to-book ratio. Their method has an obviousapplication in the comparison of the seven trading strategies analyzed inBernard, Thomas, and Wahlen.
A focus on accounting dataBernard, Thomas, and Wahlen (1997), like many of their predecessors (Ou andPenman 1989 being the obvious notable exception), focus on an analysis ofstock returns. Yet, we as accountants have a comparative advantage in under-standing the accounting numbers that may describe the nature of the firms intheir samples. A detailed analysis of the accounting numbers which lie behindthe data used to form the portfolios may be useful in distinguishing betweenmispricing and risk stories.
Sloan (1996) using a method similar to Bernard, Thomas, and Wahlen(1997), demonstrates the possibility of yet another anomaly based on accruals.He finds that firms with relatively high (low) levels of accruals experience neg-ative (positive) future excess stock returns that are concentrated around futureearnings announcements. Annual returns to a hedge portfolio are positive in 28of the 30 years examined and returns to this portfolio over the 12 days com-prised of three days around each of the four subsequent earnings announcementperiods are positive in each of the 19 years examined. This paper is interestingin the context of Bernard, Thomas, and Wahlen, because it brings attention tothe possibility that market mispricing may be due to investors' interpretation ofvarious accounting data items (in particular, accruals versus cash flows).
The results suggest that a detailed analysis of the accounting data for theobservations in the portfolios created by Bernard, Thomas, and Wahlen (1997)may provide some interesting insights. I have summarized accounting datafrom the high- and the low-SUE deciles as an illustration. The pattern of returnsto the high (low) accrual portfolio (observed by Sloan 1996) appears to be sim-ilar to the pattern of returns to the low (high) SUE portfolio leading to the obvi-ous question: are the accruals of the low (high) SUE portfolio relatively high(low)? Table 2 reports the mean (median) ratio of various components of earn-ings to average total assets for the four quarters before, the quarter of, and thefour quarters after the earnings announcement date for observations in the high-est SUE decile and for observations in tbe lowest SUE decile.'"

148 Contemporary Accounting Research
TABLE 2Mean and median ratio of various accounting data items to average total assets over thenine quarters surrounding the earnings announcement date on which SUE portfolios areformed.
Panel A: High SUE (
Accounting data
Earnings
Accruals
Cash
A Current assets
A Current liabilities
A Inventory
A Receivables
A Payables
-4
1.494
(1.790)
-1.830
(-1.440)
3.296
(3.290)
0.133
(0.220)
0.468
(0.435)
-0.438
(0.000)
0.218
(0.240)
0.090
(0.170)
decile
-3
2.197
(2.180)
-1.133
(-1.060)
3.329
(3.310)
0.504
(0.440)
0.435
(0.350)
0.011
(0.000)
0.424
(0.320)
0.252
(0.170)
Panel B: Low SUE decile
Accounting data
Earnings
Accruals
Cash
A Current assets
A Current liabilities
A Inventory
A Receivables
A Payables
-4
2.896
(2.520)
-0.702
(-0.780)
3.598
(3.330)
0.886
(0.620)
0.335
(0.290)
0.331
(0.140)
0.513
(0.280)
0.162
(0.140)
-3
2.315
(2.105)
-0.729
(-0.810)
3.043
(2.880)
0.715
(0.545)
0.191
(0.170)
0.589
(0.170)
-0,027
(0.130)
0.182
(0.100)
Quarter relative to SUE portfolio formation date
-2
2.591
(2.440)
-0.970
(-1.000)
3.561
(3.540)
0.755
(0.540)
0.523
(0.370)
0.279
(0.060)
0.486
(0.320)
0.299
(0.170)
-1
1.^11
(2.690)
-0.544
(-0.770)
3.521
(3.530)
1.399
(0.780)
0.741
(0.380)
0.617
(0.120)
0.724
(0.410)
0.409
(0.170)
0
3.817
(3.390)
-0.760
(-0.940)
4.577
(4.375)
1.160
(0.810)
0.718
(0.580)
0.197
(0.065)
0.922
(0.480)
0.368
(0.270)
1
3.476
(3.030)
-0.692
(-0.825)
4.168
(3.930)
0.970
(0.640)
0.460
(0.360)
0.691
(0.180)
0.212
(0.200)
0.286
(0.170)
2
3.443
(2.980)
-0.602
(-0.900)
4.045
(3.880)
1.160
(0.600)
0.559
(0.350)
0.721
(0.170)
0.370
(0.180)
0.302
(0.150)
3
3.451
(2.965)
-0.169
(-0.610)
3.620
(3.525)
1.544
(0.780)
0.511
(0,270)
0,766
(0.140)
0.651
(0,330)
0,300
(0.095)
Quarter relative to SUE portfolio formation date
-2
1.970
(1.810)
-0.892
(-0.930)
2.862
(2.790)
0.447
(0.380)
0.087
(0.090)
0.312
(0.080)
0.049
(0.070)
0.026
(0.010)
-1
1.548
(1.530)
-0.827
(-0.950)
2.374
(2.440)
0.384
(0.300)
-0.041
(-0.010)
0.214
(0.060)
0.068
(0.040)
-0.047
(-0.060)
0
0.530
(0.980)
-2.131
(-1.750)
2.661
(2.640)
-0.574
(-0.120)
0.305
(0.240)
-0.437
(-0.030)
-0.191
(-0.060)
0.038
(0.035)
1
1.160
(1.290)
-1.354
(-1.240)
2.513
(2.510)
0.217
(0.160)
0.318
(0.180)
-0.143
(0.000)
0.311
(0.180)
0.214
(0.060)
2
1.369
(1.465)
-1.538
(-1.355)
2.907
(2.770)
-0.007
(0.095)
0.279
(0.155)
-0.145
(0.000)
0.159
(0.100)
0.092
(0.030)
3
1,566
(1.500)
-1,158
(-1,155)
2,724
(2,730)
0,306
(0,160)
0,211
(0,070)
0,073
0,000)
0,242
(0,090)
0.056
(-0,010)
4
3,825
(3.240)
-0,725
(-0,995)
4,550
(4,185)
1,008
(0,590)
0,531
(0.390)
0,261
(0,050)
0,735
(0.340)
0,299
(0,210)
4
1,542
(1,590)
-1,685
(-1,490)
3,227
(3,000)
-0,109
(0,010)
0,325
(0.235)
-0,171
(0,000)
0,110
(0,070)
0,163
(0.130)
Notes :Accruals are calculated as the change in noncash assets, less the change in current liabilities (exclu-sive of short-term debt and taxes), less depreciation expense. Earnings is income from continuingoperations, and cash is the difference between earnings and accruals (as defined above).

Use of Comparisons of Pattems of Stock Retum and Accounting Data . . . . 149
For the high-SUE decile, eamings increase steadily over the four quarters priorto the eamings announcement quarter. This increase is to be expected becausefirms are grouped into this decile if they have relatively high eamings in theannouncement quarter and/or relatively low earnings four quarters prior to theeamings announcement quarter. It is interesting to note that accruals increasesteadily (from -1.83 percent of total assets to -0.544 percent of total assets)over these quarters, whereas the cash component of earnings changes very lit-tle (3.296 percent to 3.521 percent)." However, in the eamings announcementquarter, accruals change relatively little (-0.544 to -0.76), whereas cashchanges dramatically (3.521 to 4.577). The pattern of accruals and cash for thelow-SUE decile (see panel B) is very different. Earnings changes over the fourquarters prior to the eamings announcement are primarily due to cash flowswhereas the decrease in earnings in the announcement quarter is primarily dueto a decrease in accruals caused by an increase in current liabilities, a run-downof inventory, a decrease in receivables and an increase in payables. Fixation onthese accruals (as suggested by Sloan 1996) would lead to over-reaction at theeamings announcement date (or a little later when the accrual componentbecomes known) and subsequent upward revision of prices. Yet prices for thelow-SUE decile are subsequently revised downward, consistent with a marketperception that the accruals are more temporary than they turn out to be. On theother hand, under-estimation of the persistence of the cash component of eam-ings (also suggested by Sloan) would result in under-reaction to the good newsin cash in the high-SUE decile and in the subsequent upward correction ofprices so that the price revisions for the high-SUE decile are consistent with theresults in Sloan. The apparent similarities and differences in the patterns of theaccounting data between the portfolios based on accruals and the portfoliosbased on eamings suggest that further investigation of the accounting data anddevelopment and testing of the hypothesis based on these accounting data maybe worthwhile extensions of the work by Bernard, Thomas, and Wahlen.
Endnotes1 Bernard, Thomas, and Wahlen (1997) partially address this issue when comparing
excess returns on the Ou and Penman strategy and the excess returns to the sizestrategy. This point, however, applies to comparisons across all of the strategies.
2 The logic is as follows. Suppose there are only three announcement times:"early," "on-time," and "late." Good news is announced early, bad news late, andaverage news on time. If no announcement is made early, the price will drop. Onthe on-time date, the price will rise if there is an announcement, and it will fall ifthere is no announcement. Ceteris paribus, there will be no price change at thelate date. Consequently, the measured average return on announcement dates willbe positive.
3 Bernard, Thomas, and Wahlen (1997) argue that the set of information released atearnings announcement dates is more likely to correct mispricing, relative toother possible information releases, because it relates to a prior period andpotentially resolves uncertainty and divergent beliefs amongst investors regardingprior events. The same argument may be made in support of use of the quarterly
150 Contemporary Accoutiting Research
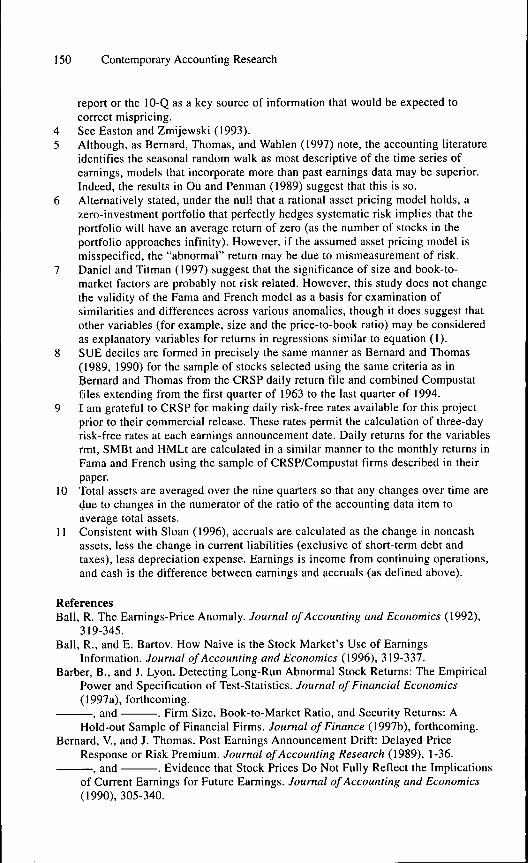
report or the 10-Q as a key source of information that would be expected tocorrect mispricing.
4 See Easton and Zmijewski (1993).5 Although, as Bernard, Thomas, and Wahlen (1997) note, the accounting literature
identifies the seasonal random walk as most descriptive of the time series ofearnings, models that incorporate more than past earnings data may be superior.Indeed, the results in Ou and Penman (1989) suggest that this is so.
6 Alternatively stated, under the null that a rational asset pricing model holds, azero-investment portfolio that perfectly hedges systematic risk implies that theportfolio will have an average return of zero (as the number of stocks in theportfolio approaches infinity). However, if the assumed asset pricing model ismisspecified, the "abnormal" return may be due to mismeasurement of risk.
7 Daniel and Titman (1997) suggest that the significance of size and book-to-market factors are probably not risk related. However, this study does not changethe validity of the Fama and French model as a basis for examination ofsimilarities and differences across various anomalies, though it does suggest thatother variables (for example, size and the price-to-book ratio) may be consideredas explanatory variables for returns in regressions similar to equation (1).
8 SUE deciles are formed in precisely the same manner as Bernard and Thomas(1989, 1990) for the sample of stocks selected using the same criteria as inBernard and Thomas from the CRSP daily return file and combined Compustatfiles extending from the first quarter of 1963 to the last quarter of 1994.
9 I am grateful to CRSP for making daily risk-free rates available for this projectprior to their commercial release. These rates permit the calculation of three-dayrisk-free rates at each earnings announcement date. Daily returns for the variablesrmt, SMBt and HMLt are calculated in a similar manner to the monthly returns inFama and French using the sample of CRSP/Compustat firms described in theirpaper.
10 Total assets are averaged over the nine quarters so that any changes over time aredue to changes in the numerator of the ratio of the accounting data item toaverage total assets.
11 Consistent with Sloan (1996), accruals are calculated as the change in noncashassets, less the change in current liabilities (exclusive of short-term debt andtaxes), less depreciation expense. Earnings is income from continuing operations,and cash is the difference between earnings and accruals (as defined above).
ReferencesBall, R. The Earnings-Price Anomaly. Journal of Accounting and Economics (1992),
319-345.Ball, R., and E. Bartov. How Naive is the Stock Market's Use of Earnings
Information. Joumai of Accounting and Economics (1996), 319-337.Barber, B., and J. Lyon. Detecting Long-Run Abnormal Stock Returns: The Empirical
Power and Specification of Test-Statistics. Journal of Financial Economics(1997a), forthcoming.
, and . Firm Size, Book-to-Market Ratio, and Security Returns: AHold-out Sample of Financial Firms. Joumai of Finance (1997b), forthcoming.
Bernard, V., and J. Thomas. Post Earnings Announcement Drift: Delayed PriceResponse or Risk Premium. Joumai of Accounting Research (1989), 1-36.
, and . Evidence that Stock Prices Do Not Fully Reflect the Implicationsof Current Earnings for Future Earnings. Joumai of Accounting and Economics(1990), 305-340.
Use of Comparisons of Pattems of Stock Retum and Accounting Data . . . . 151
> , and J. Wahlen. Accounting Based Stock Price Anomalies: SeparatingMarket Inefficiencies From Research Design Flaws. Contemporary AccountingResearch (Summer 1997), 89-136.
Chambers, A., and S. Penman. Timeliness of Reporting and the Stock Price Reactionto Earnings Announcements. Joumai of Accounting Research (1984), 21-47.
Chad, V., R. Jaganathan and A. Ofer. Seasonalities in Security Returns: The Case ofEamings Announcements. Joumai of Financial Economics (1988), 101-121.
Daniel, K., and S. Titman. Evidence on the Characteristics of Cross SectionalVariation in Stock Returns. Journal of Finance (1997), forthcoming.
Easton, P, and M. Zmijewski. SEC Form lOK/lOQ Reports and Annual Reports toShareholders: Reporting Lags and Squared Market Model Prediction Errors.Journal of Accounting Research (1993), 113-129.
Fama, E., and K. French. Common Factors in the Returns on Stocks and Bonds.Journal of Financial Economics (1993), 3-56.
, and . Multifactor Explanations of Asset Pricing Anomalies. Journal ofFinance (1996), 55-84.
Holthausen, R., and D. Larcker. The Prediction of Stock Returns Using FinancialStatement Information. Journal of Accounting and Economics (1992), 373-411.
Ibbotson, R. Price Performance of Common Stock New Issues. Journal of FinancialEconomics (1975), 235-272.
Jaffe, J., D. Keim, and R. Westerfield. Eamings Yields, Market Values and StockReturns. Journal of Finance (1989), 135-148.
Jegadeesh, D., and S. Titman. Returns to Buying Winners and Selling Losers:Implications for Stock Market Efficiency. Journal of Finance (1993), 65-91.
Ou J., and S. Penman. Financial Statement Analysis and the Prediction of StockRetums. Joumai of Accounting and Economics (1989), 295-329.
Sloan, R. Do Stock Prices Reflect Information in Accruals and Cash Flows AboutFuture Eamings? Accounting Review (1996), 289-315.
