use of digested slurry from livestock manure in paddy
TRANSCRIPT
Use of Digested Slurry from Livestock Manure in Paddy Fields and its Environmental Effect in Southeast Asia
ORITATE Fumiko*
*Renewable Energy and Resources Unit, Regional Resources Engineering Division
Abstract
Use of digested slurry from livestock manure in paddy fields and the associated environmental effects were examined using a regional diagnosis and field experiments with the aim of establishing a sustainable biomass use system in Southeast Asia. First, analysis of biomass use in a suburban village in Southern Vietnam identified several options for improving the regional environment and generating energy, resulting in a preferred proposal to use currently untreated livestock manure for biogas production and use digested slurry as a fertilizer in paddy fields. Second, the effects of using digested slurry as fertilizer on rice production and environmental impacts were evaluated through field experiments. This study clarified that digested slurry can be substituted for chemical fertilizers, and nitrogen loading and fecal contamination of receiving waters can be avoided if no water is discharged from the treated plot for a sufficient duration. Third, the economic feasibility of using digested slurry was evaluated in field experiments, which found that it is economically feasible if the nitrogen concentration of the digested slurry can be raised to five times that of present conditions. Finally, the effects of extending this regional scenario to all of Southeast Asia on nitrogen loads discharged to water bodies and on greenhouse gas emissions was estimated and evaluated.
Key words: Southeast Asia, Regional biomass use, Biogas digester, Paddy field, Digested slurry, GHG emission
Contents
1. INTRODUCTION 1.1 Background 1.2 Research Problem 1.3 Objectives of This Study 1.4 Structure of the Thesis2. LITERATURE REVIEW 2.1 Household Biogas Systems in Rural Area of Southeast Asia 2.2 Methods for Analysis and Evaluation of Regional Conditions of Biomass Use 2.3 Fertilizer Effects of Digested Slurry on Rice Plants 2.4 Environmental Effects of Application of Digested Slurry in Paddy Fields 2.5 Transportation and Application Methods of Digested Slurry to Paddy Fields 2.6 Summary3. ANALYSIS OF PRESENT CONDITIONS OF BIOMASS USE IN A SUBURBAN VILLAGE IN SOUTHERN VIETNAM 3.1 Introduction 3.2 Methods 3.3 Results and Discussion 3.4 Conclusion
農研報告.農村工学 1135 ~ 200, 2017
135
ブック 1.indb 135 2017/03/22 10:05:32

4. FEASIBILITY OF USE OF DIGESTED SLURRY IN PADDY FIELDS FROM FERTILIZER EFFECT AND ENVIRONMENTAL IMPACT
4.1 Introduction 4.2 Materials and Methods 4.3 Results and Discussion 4.4 Conclusions5. FEASIBILITY OF USE OF DIGESTED SLURRY IN PADDY FIELDS FROM ECONOMICAL ASPECT 5.1 Introduction 5.2 Materials and Methods 5.3 Results and Discussion 5.4 Conclusions6. DISCUSSIONS 6.1 Installation and Evaluation of the System to use Digested Slurry from Biogas Digesters 6.2 Advanced Regional Biomass Use System with Bio-ethanol Production from Rice Straw 6.3 Prospect for Diffusion of Regional Biomass Use System to Southeast Asia7. CONCLUSIONACKNOWLEDGEMENTSAPPENDIXES Appendix 1 Bases of data used for regional diagnosis Appendix 2 Calculation procedures of cost for fertilization Appendix 3 Calculation procedures of the number of milk cow in Southeast AsiaREFERENCES
農研機構研究報告 農村工学研究部門 第 1 号 (平成 29 年 3 月) ORITATE Fumiko:Use of Digested Slurry from Livestock Manure in Paddy Fields and its Environmental Effect in Southeast Asia136 137
ブック 1.indb 136 2017/03/22 10:05:32

1. INTRODUCTION
1.1 Background
Use of fossil fuels has given us comfortable life through economic growth and development of industry. However, such use has caused environmental problems such as water and air pollution and global warming by greenhouse gas (GHG) emissions at the same time. Moreover, fossil fuels are exhaustible resources, whose stock have been decreasing year after year. It is therefore important to consider a lifestyle without depending on fossil fuels. Currently, in rapid developing countries such as Southeast Asian Countries, rapid economic growth and industrialization cause rapid increase of energy demand and severe environmental problems (Samantha and Milou, 2010). Main energy sources are fossil fuels with the share of 37% for oil, 21% for natural gas and 16% for coal (IEA, 2013), and energy-related CO2 emissions have increased to 1.2 gigatonnes (Gt) in 2011 in Southeast Asia (Adiarso et al., 2013). These are problems which developed countries have once experienced in advance of developing countries.
For these circumstances, a shift in the paradigm to supply sustainable energy sources by utilization of renewable energy has been proposed (Samantha and Milou, 2010). Bioenergy is an attractive among renewable energies because of its properties of not only “renewable”, but also “storable and substitutive”, “abundant” and “carbon neutral” (Ogi, 2002). It can contribute to a reduction in GHG emissions by substituting for fossil fuels. Moreover, it also can contribute to decrease environmental pollution such as nitrogen load in water bodies when the bioenergy source is wasted biomass. For this, wasted biomass is focused in this study.
Wasted biomass such as livestock manure and agricultural residues are abundant in rural area. Many biomass are spatially distributed thinly and widely (Sakoda et al., 2006). Considering the cost and energy for transporting them for use, decentralized regional biomass use system is desirable. In Southeast Asian Countries, rural areas play an important role in national development because population of rural area is more than 50% of total in 2014 (FAOSTAT, 2015a), and ratio of agriculture in GDP is still more than 10% (except for Brunei, Myanmar, Malaysia and Singapore) (The World Bank, 2015) in each of Southeast Asian Countries.
Therefore, construction of regional biomass use system (especially, wasted biomass) in rural area would be greatly meaningful. For this, it is important to propose appropriate biomass use scenario for construction of regional biomass use system, which is particularly suitable for Southeast Asian Countries. Here, “appropriate” indicates that the scenario is adoptable both technologically and economically. The effect of adoption of the scenario should also be fully investigated.
In Southeast Asian Countries, livestock farming and rice production is popular. Therefore, the following two kinds of biomass use systems may have potential to be developed in Southeast Asia: 1) using untreated livestock manure for feedstock of household methane fermentation system called “biogas digesters”, and using generated biogas for fuel in households, and 2) using unused rice straw for feedstock of bio-ethanol, and using the bio-ethanol as substitution of fossil fuels. Biogas digesters have already been used in rural area in Southeast Asia as discussed in the following chapters. By contrast, bio-ethanol production from rice straw is still under development and many improvements are required before the system become economically feasible (Igarashi, 2008; Kunimitsu and Ueda, 2013) through various trials for improving the processes for conversion of rice straw to bio-ethanol (Fujita et al., 2011; Tran et al., 2013; Vu et al., 2013). Therefore, this study sets a main focus on the former scenario, namely, using untreated livestock manure for feedstock of household biogas digesters, and using generated biogas for fuel in households.
1.2 Research Problem
Vietnam is selected as the study area of this study because Vietnam is a major rice producing country and also in which livestock farming is popular among Southeast Asian Countries. In Vietnam, energy demands are increasing with rapid economic growth (Pham et al., 2011; Nguyen et al., 2013), and environmental problems have become increasingly significant. It is forecasted that annual energy demands will increase by approximately 12.1% from 2010 to 2020, accompanied by yearly decreases in fossil fuel sources (Nguyen et al., 2013). Rapid economic growth has also led to rapid increases in the livestock industry with greater demands for meat products. Air pollution such as odor and pollution of aquifers and surface water caused by improper treatment of livestock excreta are becoming very serious (Vu et al., 2007; Vu et al., 2012; Thu et al., 2012).
農研機構研究報告 農村工学研究部門 第 1 号 (平成 29 年 3 月) ORITATE Fumiko:Use of Digested Slurry from Livestock Manure in Paddy Fields and its Environmental Effect in Southeast Asia136 137
ブック 1.indb 137 2017/03/22 10:05:33
As for rice production, the annual planted area and production are 7.9 million ha and 44 million tons, respectively (General Statistics Office Vietnam, 2013). Moreover, Vietnam is known as the world’s second largest exporter of rice (Ministry of Agriculture, Forestry and Fisheries of Japan, 2014). By-products in rice cultivation such as rice husk and straw are estimated to be generated at approximately 60 million tons per year, but very few of them (5-7%) are used, and the rest are burned directly in the field. Although the agricultural sector occupied only 18% in GDP, more than 46% of national population are engaged in agricultural activities (General Statistics Office Vietnam, 2013). It is also characteristic in Vietnam that approximately 70% of the population is still living in rural areas (Pham et al., 2011; Nguyen et al., 2013; Sakata, 2013), which indicates that rural areas have significant economical meaning for national development (Sakata, 2013).
Based on these circumstances in Vietnam, the government has set targets to increase the share of renewable energy in total commercial primary energy from 3% in 2010 to 5% in 2020 and 11% in 2050 (The Prime Minister of Vietnam, 2011a) and to increase the share of electricity generated from renewable resources such as wind and biomass from 3.5% of total electricity generation in 2010 to 4.5% in 2020 and 6% in 2030 (The Prime Minister of Vietnam, 2011b). Among renewable energies, the government is especially interested in biomass technology improvement to take advantage of diverse local biomass resources and produce new energy for replacing fossil fuels (Nguyen et al., 2013). With the above promotions concerning energy, strategies for environmental protection have also been issued (The Prime Minister of Vietnam, 2012) aiming to improve the environment in polluted and deteriorated areas, to mitigate deterioration and exhaustion of natural resources, to improve the capability of actively responding to climate change and to reduce increases in GHG emissions.
In view of such targets of the Vietnam government, it is meaningful to approach the task about biogas digesters. Therefore, this study sets a focus on biogas digesters, which are widely adopted throughout the world. In developing countries, there are currently millions of household biogas digesters (Thu et al., 2012). There are 30 million household biogas digesters in China, 3.8 million in India, 60,000 in Bangladesh (Thu et al., 2012), several hundred in the Philippines (Elauria and Elauria, 2013), and an increasing number in Africa, Peru (Thu et al., 2012), Nepal (Rajendran et al., 2012) and Cambodia (Bunthoeun et al., 2013). In Vietnam, similar to the above countries, household biogas digesters have spread countrywide in rural areas, especially recently with encouragement for participation in the “biogas program for the animal husbandry sector in Vietnam” (Vietnam Livestock Production Department MARD and Netherlands Development Organization SNV, 2013). This program aims to solve environmental problems such as air and water pollution caused by livestock manure, and to provide a clean and affordable energy source for the local people (Thu et al., 2012; Vietnam Livestock Production Department MARD and Netherlands Development Organization SNV, 2013).
Biogas acquired from biogas digesters is mainly used as fuel for cooking, lighting and electricity. Therefore, biogas digesters provide farmers with benefits of clean energy, saved cost by substituting for fossil fuels or reduced workload to collect firewood that can be substituted by biogas. On the other hand, problems are that most digested slurry from biogas digesters is discharged to water bodies without any treatment, and only small amounts are used as fertilizer for garden trees or vegetables in fields adjacent to farmer houses and as feed for fish (Thu et al., 2012; Huong et al., 2014). Discharge of digested slurry deteriorates water quality in water bodies because it contains high concentrations of nitrogen (Oritate et al., 2015) and fecal indicator microbes (Huong et al., 2014).
Focusing on the fertilizer components contained in digested slurry such as nitrogen, potassium and phosphorus, use in agricultural fields can be proposed as an effective solution (Yuyama et al., 2007). Especially, this study sets the main objective on applying digested slurry to the rice paddy fields. Such a selection of the objective is motivated by the facts that: 1) paddy fields occupy large areas of agricultural fields in Southeast Asian Countries, 2) most nitrogen components in digested slurry are ammonia-nitrogen compounds (Matsunaka et al., 2002), which rice prefers as a source of nitrogen (Ishii et al., 2011), and 3) paddy fields have high nitrogen removal capacity through denitrification and uptake by plants (Kyaw et al., 2005). However, the utilization of digested slurry in paddy fields in Vietnam is rarely conducted because of lack of knowledge or fear of cost for transportation and application to farmlands. Therefore, it is necessary to establish a feasible system of the use of digested slurry by evaluating it from various aspects such as fertilizer effects on rice, environmental effects, costs and labor for transportation and application to the field, and evaluation of the environmental effects at the regional level.
農研機構研究報告 農村工学研究部門 第 1 号 (平成 29 年 3 月) ORITATE Fumiko:Use of Digested Slurry from Livestock Manure in Paddy Fields and its Environmental Effect in Southeast Asia138 139
ブック 1.indb 138 2017/03/22 10:05:33
1.3 Objectives of This Study
Based on the above discussions, this study aims to evaluate the effects of applying digested slurry to paddy fields in rural areas of rapidly developing countries in Southeast Asia by using a suburban village in Southern Vietnam as a case study area. The detailed objectives are as follows.
1. To propose sustainable regional biomass use scenarios through adopting a “regional diagnosis” approach, which is a method for constructing a material flow diagram at a regional level.
2. To evaluate the feasibility of using digested slurry in paddy fields in terms of fertilizer effects on rice, and environmental impacts such as nitrogen load and fecal contamination.
3. To evaluate the feasibility of using digested slurry in paddy fields in terms of costs for transportation and application of slurry by adopting the pouring method.
1.4 Structure of the Thesis
This thesis consists of seven chapters.Chapter 1 summarizes the current situation of energy and the environment in Southeast Asia, technologies for energy
production from biomass as background of this study, and states the objectives of this study.Chapter 2 reviews the previous studies about 1) household biogas systems in rural area of Southeast Asia, 2) methods
for analysis and evaluation for regional conditions of biomass use, 3) fertilizer effects of digested slurry on rice plants and 4) environmental effects in application of digested slurry in paddy fields and 5) transportation and application methods of digested slurry for use in paddy fields.
Chapter 3 clarifies the present conditions of biomass use in a suburban village in Southern Vietnam, in which rice cultivation and livestock farming are popular, by regional diagnosis, and indicate the necessity of treatment of untreated livestock manure and effective use of untreated digested slurry which are currently discharged to water bodies.
Chapter 4 evaluates the feasibility of using digested slurry in paddy fields in Southern Vietnam in terms of fertilizer effects on rice and environmental impacts such as nitrogen load and fecal contamination in lower water bodies through field experiments in the study area.
Chapter 5 evaluates the feasibility of using digested slurry in paddy fields in Southern Vietnam in terms of economy such as costs for transportation and application to farmlands by adopting the pouring method through field experiments in the study area.
Chapter 6 discusses possibilities of installing the system of using digested slurry from biogas digesters in a particular setting of a suburban village in Southern Vietnam, based on the results in Chapters 3 to 5. In particular, it estimates the effect of adopting it on environmental loads such as nitrogen load in water bodies and GHG emissions. It also considers a case for adding an optional biomass use system, that is, bio-ethanol production from rice straw as the case in which regional biomass use is further improved. Moreover, it proposes the diffusion of these systems throughout Southeast Asia by estimating the reduction of environmental load, and suggests the implications of the results of this study.
Chapter 7 summarizes the conclusion of this study.
2. LITERATURE REVIEW
2.1 Household Biogas Systems in Rural Area of Southeast Asia
Methane fermentation is a biochemical process to decompose organic wastes into CH4 and CO2 under anaerobic conditions by metabolic processes of microorganisms (Li, 2005). Ratios of CH4 and CO2 in biogas obtained by methane fermentation are approximately 60% and 40%, respectively, and calorific values of biogas are generally 5,000-6,000 kcal (21-25 MJ) per 1 Nm3 (Li, 2005). Methane fermentation can be classified into non-heating fermentation (< 25oC), mesophilic fermentation at approximately 35oC (30-40oC), and thermophilic fermentation at approximately 55oC (50-60oC). Comparing the aspects of treatment properties of the latter two types of fermentation reveals that, thermophilic fermentation is advantageous because of a high hydrolysis rate, high death rate of pathogens and high fermentation speed, despite a disadvantage with the easy accumulation of organic acids. In contrast, mesophilic fermentation is advantageous because of high stability despite a low degradation speed (Li, 2005). Methane fermentation is carbon neutral, and can use
農研機構研究報告 農村工学研究部門 第 1 号 (平成 29 年 3 月) ORITATE Fumiko:Use of Digested Slurry from Livestock Manure in Paddy Fields and its Environmental Effect in Southeast Asia138 139
ブック 1.indb 139 2017/03/22 10:05:33

various kind of wasted biomass such as sewage sludge, garbage and livestock wastes as feedstock, providing significant implications for global environmental conservation (Noike, 2009).
“Methane fermentation technology” is a technology to biologically decompose wasted biomass by the principle of methane fermentation, and collect and use the product CH4 as an energy resource. Therefore, “methane fermentation technology” is also called “Biogas Technology” (Li, 2005). Biogas technology has the following advantages (Thu et al., 2012; Nguyen, 2005); 1) reduces the GHG emissions from manure, 2) produces renewable energy, 3) reduces the workload for farmers to collect firewood for cooking in rural areas, 4) reduces deforestation, and 5) improves the surrounding environment by reducing odors and pathogens.
There are currently millions of household biogas digesters (Thu et al., 2012) as mentioned in Chapter 1. There are several types of biogas digesters, and currently the most popular type in rural areas around Ho Chi Minh City is the fixed dome type made from solid bricks and mortar, and buried underground as shown in Fig. 1. There are three main components continuously connected; (i) inlet tank where pig manure is mixed with water before it is discharged into the digester; (ii) digester where the mixture of pig manure and water is fermented to produce methane and other gases; (iii) compensating tank that collects excess slurry effluent from the digester (Nguyen et al., 2012). Average size of a digester is approximately 8 m3, the capacity to make a profit with biogas generated from the manure of 15-20 head of pigs or 4-6 head of milk cows (Information acquired by Interviews of Department of Agriculture and Rural Development, Ho Chi Minh City (DARD-HCMC) in 2010). Incidentally, polyethylene tube biogas digesters as shown in Fig. 2 are popular in the Mekong Delta Region (Yamada, 2008; Nguyen et al., 2012) because they are low cost, easy to install and applicable to the regions where the ground water level is high (Nguyen et al., 2012) because their shapes mean they can be installed without deep excavation of the ground (Fig. 2). A reduction of more than 1,000 t-CO2 per year was achieved with introduction of polyethylene tube type biogas digesters in 961 households of a village in the Mekong Delta by the Clean Development Mechanism (CDM) Project (Matsubara et al., 2014; Izumi et al., 2013).
Biogas from biogas digesters is mainly used as fuel for cooking, lighting and electricity. On the other hand, most digested slurry from biogas digesters is discharged to water bodies without any treatment, only small amounts are used as fertilizer for garden trees or vegetables in fields adjacent to farmer houses and as feed for fish (Thu et al., 2012; Huong et
Fig. 2 Polyethylene tube biogas digester
Fig. 1 Fixed dome type of household biogas digester
Livestock manure &Washing water
Biogas digesterAbout 8m3 underground
Methane gas
Use for cooking
1. Mixing tank, 2. Inlet pipe, 3. Digesting tank, 4. Dome-gas pipe, 5. Outlet pipe, 6. Compensation tank Source: http://biogas.org.vn/english/Introduction/Technology.aspx
1 - Pig-pen; 2 - Inlet pipe; 3 - Digester; 4 - Outlet pipe; 5 -Discharge pond; 6 - Garden; 7 - Gas vent; 8 - Security valve; 9 PE gas-holder; 10 - StoveSource: Nguyen et al. 2012
農研機構研究報告 農村工学研究部門 第 1 号 (平成 29 年 3 月) ORITATE Fumiko:Use of Digested Slurry from Livestock Manure in Paddy Fields and its Environmental Effect in Southeast Asia140 141
ブック 1.indb 140 2017/03/22 10:05:34
al., 2014). The Mekong Delta Region is an exception because specific material flow called VACB systems (Vuon=garden; Ao=pond; Chuong=pigsty; B=biogas digester) (Yamada, 2008) is formed, and most of the digested slurry is used as feed for fish. Discharge of digested slurry deteriorates water quality in water bodies because high concentrations of nitrogen (Oritate et al., 2015) and fecal indicator microbes (Huong et al., 2014) are confirmed in digested slurry. Focusing on the fertilizer components contained in digested slurry, use in agricultural fields can be proposed as an effective solution (Yuyama et al., 2007). Especially, the feasibility of utilization of digested slurry in paddy field is significant as mentioned in Chapter 1. However, the utilization of digested slurry in paddy fields in Vietnam is rarely conducted, and needed the investigation to evaluate the feasibility.
2.2 Methods for Analysis and Evaluation of Regional Conditions of Biomass Use
Quantitative clarification of the material flow related to biomass use in the objective region is important to propose appropriate biomass use plan. “Material Flow Analysis” established by Brunner and Rechberger (2004) is well known as a similar study that assessed the environmental impacts of human activities on nutrient flow (Do et al., 2013). In Japan, the nitrogen flow analysis established by Matsumoto (2000) focusing on compartments of “farmland”, “animal” and “human” based on statistical data is well known as a forerunner for this kind of study. Based on the methods of Matsumoto (2000), Yuyama (2005) developed a method called “regional diagnosis” for estimating circulation of regional biomass. “regional diagnosis” aims to clarify the sustainability and soundness of a biomass use plan based on accurate understanding of the present conditions of the material flow of biomass use in the objective area, and compares several ideas in terms of selection of feedstock biomass, biomass conversion process, scale and disposition of biomass conversion facilities (Yuyama, 2005).
For the purpose of “regional diagnosis”, the “Diagnosis Model for Biomass Resources Circulative Use” was developed by Yuyama (2004). Structure of it is similar to the concept of “Material Flow Analysis” established by Brunner and Rechberger (2004) (Matsuno et al., 2006). Applied biomass is composed of organic wastes such as livestock wastes, agricultural residues, food processing residues, wood or fish wastes, garbage and sludge of domestic waste water, which are available abundantly in rural areas. Evaluated parameters are nitrogen, phosphorus, potassium, carbon and raw weights of each material. Basic unit areas are municipalities, and “agricultural fields”, “livestock facilities”, “water bodies”, “human living areas”, “food processing facilities” and “recycling facilities” (Yuyama, 2004). The method has been used for estimation of major sources of nitrogen loads and examination of the effectiveness of measures to reduce nitrogen loads to water bodies in river basins of Japan (Matsuno et al., 2006). Following these studies, this study will use this method extensively to clarify and evaluate the present conditions of biomass use and regional environment in an objective area. However, to adapt this method to developing countries such as Vietnam in which available data is limited, the structure may have to be simplified to be suitable for the site. Thus, this issue will be a main focus in Chapter 3.
2.3 Fertilizer Effects of Digested Slurry on Rice Plants
Digested slurry contains specific amounts of nitrogen, potassium and phosphorus as mentioned in Chapter 1, making it a potential fertilizer for plants. Digested slurry has almost the same effects as chemical fertilizers under various application conditions. Li et al. (2003) indicated that the effects of cattle digested slurry applied by spreading onto the soil surface at both basal and top-dressing (both were after transplanting) on plant length, leaf area index (LAI), grain yield, or biomass of edible rice were not significantly different from those of chemical fertilizers with approximately equal nitrogen application rates in a field experiment with clay loam. Miho et al. (2004) reported that the plot with digested slurry applied by spreading onto or into the surface water at both basal and topdressing showed almost the same effects on growth and production of edible rice as chemical fertilizers with the same nitrogen application rates in a field experiment. Sunaga et al. (2009) and Win et al. (2009) reported that rice growth and biomass production of high-yielding rice was almost the same in plots with cattle digested slurry applied by spreading onto the soil surface and immediately plowing at basal, and spreading onto surface water at topdressing as plots with chemical fertilizers applied at the same nitrogen application rate in the lysimeter experiments using gray lowland soil. Zenmyo et al. (2009) indicated that rice growth of edible rice with digested slurry applied was almost the same as chemical fertilizer by the same application method of Sunaga et al. (2009) and Win et al. (2009) with pot experiments using gray lowland soil. Koga et al. (2010) showed that application of digested
農研機構研究報告 農村工学研究部門 第 1 号 (平成 29 年 3 月) ORITATE Fumiko:Use of Digested Slurry from Livestock Manure in Paddy Fields and its Environmental Effect in Southeast Asia140 141
ブック 1.indb 141 2017/03/22 10:05:34

slurry as top-dressing by pouring with irrigation water onto the field increased yield components such as grain number per head of rice plants and grain yield of edible rice in the field experiments, and concluded that digested slurry is effective for growth and yield of rice plants when used as a top-dressing. Watanabe et al. (2011) reported that there was no significant difference in yield, taste, dry weight and nitrogen content of rice plants at the heading stage in plots with digested slurry applied by spreading onto soil surface and plowing immediately or injection into soil at basal and spreading onto soil surface with irrigation water at topdressing as the plot with chemical fertilizer applied at approximately the same nitrogen application rates. Kamioka and Kamewada (2011) indicated that almost the same rice growth and yield of edible rice was obtained when using cattle digested slurry as basal by spreading onto surface water, and plowing immediately similar to the use of chemical fertilizer of the same nitrogen application rate in field experiments. Mihara et al. (2011) showed almost the same rice growth and yield of edible rice when using digested slurry as basal and topdressing both by spreading in the surface water after transplanting similar to treatment of chemical fertilizer with twice the rate of nitrogen application as chemical fertilizer in the field experiment with gray lowland soil. Phayom et al. (2012) reported that the use of digested slurry as topdressing with periodic application to poor sandy loam soil increased N uptake, agronomic efficiency, which is the increase in grain yield per unit N input (Li et al., 2003), and fertilizer N recovery efficiency when compared with the use of chemical fertilizer as mainly basal. Nishikawa et al. (2012) reported that at the standard nitrogen application rate for edible rice (10 g m-2), almost the same grain yield was obtained in plots with cattle slurry applied as basal or split applications and topdressing as in plots treated with chemical fertilizer for an average of seven years with yearly applications. They also indicated the split application of digested slurry improved N efficiency in rice plants in field experiments with grey lowland soil.
The above previous studies show that the application rate of digested slurry was decided based on ammonia-nitrogen (NH4-N) (Win et al., 2009; Kamioka and Kamewada, 2011; Nishikawa et al., 2012) or based on total nitrogen (T-N) (Miho et al., 2004; Zenmyo et al., 2009; Koga et al., 2010; Mihara et al., 2011; Phayom et al., 2012) in the digested slurry. Appropriate application rate for digested slurry should be decided according to various factors such as field conditions, application method, chemical properties of digested slurry, or inorganic N mineralized from the soil that sometimes accounts for 60-70% of the total N uptake during the growing period (Nishikawa et al., 2012).
There are also reports that digested slurry decreased rice growth and production when compared to chemical fertilizers. Ammonia volatilization was increased by high pH, high NH4-N concentrations in surface water, high water temperature or high wind speed (Hayashi et al., 2008). Therefore, nitrogen loss by ammonia volatilization should be taken into account in application of digested slurry with high pH and high NH4-N concentrations to paddy fields. Zenmyo et al. (2009) reported that tiller number, shoot dry weight and the gross recovery rate of nitrogen applied to edible rice decreased with the use of digested slurry by spreading on the soil surface and plowing immediately at basal, and spreading onto surface water at topdressing in a pot experiment with gray lowland soil, and concluded that this may be due to nitrogen loss by ammonia volatilization. Watanabe et al. (2011) also reported that use of digested slurry by pouring with irrigation water as basal decreased yield, dry weight and nitrogen content of rice plants at the heading stage in field experiments. Miho et al. (2004), Sunaga et al. (2009), Win et al. (2009; 2010), Sasada et al. (2011) and Chen et al. (2013) reported higher ammonia volatilization in application of digested slurry when compared to chemical fertilizer applications such as 13% of applied NH4-N (Win et al., 2009), 8.9% of applied NH4-N (Win et al., 2010), 2.5-2.9% of applied NH4-N (Sasada et al., 2011) and approximately 16.4% of applied N (Chen et al., 2013). Soil in Vietnam has a pH lower than 5 (Pham et al., 2006). Ammonia volatilization for surface water with a pH of 3.4 to 6.2 was low, approximately 1.7% of the N applied during the cropping period when applying urea during the wet season in the Mekong Delta Region in Vietnam (Watanabe et al., 2009). Loss of nitrogen from digested slurry in paddy fields in Vietnam with relatively low pH is not significant, but not negligible.
2.4 Environmental Effects of Application of Digested Slurry in Paddy Fields
Nitrogen in digested slurry enters the soil N pool mainly as NH4-N. Li et al. (2003) reported that the NH4-N was directly used by rice or absorbed by soil clay particles, or, alternatively, could be oxidized to NO3-N and may diffuse or percolate into the soil reduction layer, and then, be lost by denitrification. They also mentioned that organic matter in digested slurry may enter the soil organic pool and contribute to the preservation of soil fertility, therefore, pollution of
農研機構研究報告 農村工学研究部門 第 1 号 (平成 29 年 3 月) ORITATE Fumiko:Use of Digested Slurry from Livestock Manure in Paddy Fields and its Environmental Effect in Southeast Asia142 143
ブック 1.indb 142 2017/03/22 10:05:34
underground water and streams by nitrogen and organic matter is not a major problem, if water is kept in the paddy field after application of digested slurry. Watanabe et al. (2011) reported that the nitrogen load in effluents for application of digested slurry by three different application methods, i.e. pouring with irrigation water, spreading onto the soil surface and mixing with soil, and injection into soil, were almost the same as application of chemical fertilizer, approximately 10% of nitrogen applied during cultivation. Sasada et al. (2011) indicated that the concentrations of total soluble organic C and total soluble N in the drainage water were not significantly different among the treatments of cattle digested slurry, pig digested slurry and chemical fertilizer, and the concentrations of nitrate were lower than 0.5 mg L-1 in all treatments during flooding in the lysimeter experiment with gray lowland soil. Kamioka and Kamewada (2011) indicated no significant difference in infiltration of inorganic nitrogen, which was approximately 2.5% of applied nitrogen, between treatments of cattle digested slurry and chemical fertilizer in the lysimeter experiment with andosol. Sunaga et al. (2009) showed that the T-N leaching in the treatments of cattle digested slurry was approximately 3%, almost the same as chemical fertilizer with the same nitrogen application rate in the lysimeter experiment with gray lowland soil. Chen et al. (2013) indicated that there was no significant difference in nitrogen load by surface discharge and percolation between treatments with digested slurry and chemical fertilizers, differences were small at approximately 0.7% and 2.0% for the N applied. From these previous results, nitrogen loads by surface discharge or percolation may not be crucial. However, the low nitrogen loads are derived from their proper water management after fertilization. For example, Watanabe et al. (2011) showed that nitrogen concentrations in surface water increased to more than 10 mg L-1 after application of digested slurry or chemical fertilizers of 6.0 to 7.0 gN m-2 and two weeks were needed to decrease to less than 1 mg L-1 in a field experiment. Therefore, they proposed that at least two weeks is needed to prevent surface discharge. Kamioka and Kamewada (2011) indicated that nitrogen levels in surface water at the plots treated with digested slurry and chemical fertilizers of 4.0 gN m-2 once increased to more than 15 mg L-1 after fertilization, and decreased to 0.3 mg L-1 in 10 days after fertilization in lysimeter experiments. Chen et al. (2013) also indicated that for 7 days after application of digested slurry or chemical fertilizer, nitrogen levels were relatively high, and concluded that it is necessary to prevent surface water overflow from the plot for 7 days after fertilization to avoid surface water pollution. These studies suggested that, to avoid pollution due to surface drainage, surface water must be kept on a paddy field for an enough period until its nitrogen concentration is reduced. They also suggested that the length of such a period could be variable according to local soil and climate conditions. This implies the necessity of conducting field experiments in the study area in Vietnam to find a suitable length of such a period.
Microbial pollution of surrounding environments with application of digested slurry should be considered if: 1) feedstock of digested slurry contains livestock or human manure, 2) fermentation is not conducted with thermophilic way, or 3) fermentation is conducted without any sterilization processes. Huong et al. (2014) reported that E. coli concentrations in feedstock was reduced only 1 to 2 log units during digestion, and 3.70±0.84 log10 CFU (CFU, colony forming unit) mL-1 of E. coli (n=146) was contained in digested slurry from household biogas digesters with feedstock of pig slurry and human excreta in Northern Vietnam. Similar reduction capacity was reported in E. coli for biogas digesters with feedstock of swine manure in Southern Vietnam (Kobayashi et al., 2007). Huong et al. (2014) estimated that such a limited reduction in E. coli suggests that bacterial pathogens like Salmonella, which has been found in 5-50% of pigs in Vietnam, and Campylobacter, which is an important cause of diarrhea in Vietnamese children, are likely to be present in the effluent from biogas systems with the feedstock of pig manure and human excreta. Contamination of rice plants and hygienic risk for humans who eat rice from the application of digested slurry should be low because rice is eaten after cooking. Prevention of microbial pollution of lower water bodies with application of digested slurry should be considered. Pathogens derived from manure-related material after being applied to paddy fields can be decreased gradually by exposition of UV radiation or increases in the pH of surface water during photosynthesis of rice plants (Ueda et al., 2003). It was indicated that fecal coliforms in surface water in paddies treated with unchlorinated secondary effluents from sewage treatment works decreased at a rate of approximately 0.6 log day-1 (Ueda et al., 2003). However, survival of microbes in the environment is influenced by many factors including temperature, soil types, occurrence of other bacteria and soil protozoa (Ohtomo et al., 2004), sunlight, organic matter content, etc. (Nicholson et al., 2005). Therefore, it is important to examine the microbial fates at sites, where digested slurry is applied, to prevent hygienic water pollution of lower water bodies by discharging of surface water in which sufficient decrease in pathogens is not confirmed.
農研機構研究報告 農村工学研究部門 第 1 号 (平成 29 年 3 月) ORITATE Fumiko:Use of Digested Slurry from Livestock Manure in Paddy Fields and its Environmental Effect in Southeast Asia142 143
ブック 1.indb 143 2017/03/22 10:05:34

2.5 Transportation and Application Methods of Digested Slurry to Paddy Fields
The utilization of digested slurry in paddy fields requires transportation of digested slurry from the biogas digesters (Thu et al., 2012) and application to the fields. As a transportation method of digested slurry, vacuum trucks are popular and usually used in Japan (Yamaoka et al., 2012). A model for planning the effective transportation and application of digested slurry to farmlands using vacuum trucks was developed in Japan (Yamaoka et al., 2009; 2011; 2012). In the model, optimal plan for transportation and application of digested slurry can be calculated considering such factors as production rate or chemical components of digested slurry, locations of the biogas plant and agricultural fields, possible application season, application rate per area, application area of fields, numbers of vacuum trucks (Yamaoka et al., 2009). The model has been developed by introducing the use of slurry spreaders (Yamaoka et al., 2011), operation with plural vacuum trucks for digested slurry and installation of intermediate tanks (Yamaoka et al., 2012).
There are three methods for application of digested slurry to paddy fields, i.e. pouring with irrigation water from an inlet using a vacuum truck, spreading on the soil surface with a digested slurry spreader, and injecting into the soil with an injector (Watanabe et al., 2011). The pouring method is applicable after irrigation and during rice growth as additional fertilization (Phayom et al., 2012). The methods for application with a spreader and injector are applicable for basal fertilization before planting (Iida et al., 2009). The spatial distribution of digested slurry focusing on nitrogen applied to a field by the pouring method has been examined by numerical analysis (Yuge et al., 2014; Inomura et al., 2010). The possibility to obtain the same or better yield with the use of digested slurry by the pouring method as by conventional cultivation with chemical fertilizers has been shown through actual field studies (Koga et al., 2010; Mihara et al., 2011). The detailed procedures for the pouring method were compiled by Iwashita et al. (2008) as follows; 1) decreasing the surface water of the field to shallow ponding conditions such as a water level of 0 cm (Koga et al., 2010) or 0.3 cm (Mihara et al., 2011) before application of digested slurry, 2) pouring digested slurry with a specific volume of irrigation water, so that the water depth increased by 4 to 5 cm (Mihara et al., 2011) on the field, 3) digging a trench when there is a shortage of irrigation water and 4) improving the land level by careful paddling. From the above, it was concluded that the pouring method is applicable in Vietnam because of fewer machines so this method was to be decided to test in this study as the first trial.
2.6 Summary
In summary, this chapter has identified the following gaps between the achievements of previous studies and the objectives of this study set in Chapter 1, and the approaches that will be taken in the subsequent chapters in order to close such gaps:1) “Regional diagnosis” developed in Japan is an effective method to understand the present conditions of biomass
use and simulate future biomass use plans at the regional level. However, since simply applying this method as it is needs a lot of detailed data, simplifying the framework of this method would be practical and helpful for applying it to developing countries such as Vietnam in which available data is certainly limited.
2) Effectiveness of digested slurry as fertilizer for rice plant has been studied extensively on Japanese paddy fields under various conditions such as: applications as basal or top-dressing; applications onto soil or surface water with or without plowing immediately or injecting to soil; trials of various nitrogen application rates, like adjusting the rate to be the same as the case of chemical fertilizer by the NH4-N content or the T-N content of digested slurry. However, situations for paddy fields in Southeast Asia are quite different from the ones in Japan in terms of climate, soil properties, and rice cultivation styles, etc. Warm climate may cause rapid mineralization of applied nitrogen in digested slurry and soil nitrogen. High or low pH of soil may influence the available ratio of applied nitrogen for rice plants through ammonia volatilization. Rice cultivation styles in Vietnam in which nitrogen fertilizer is applied twice or three times as top-dressing may bring different results from Japanese cases in terms of fertilizer effects of digested slurry for rice. However, there are currently few reports investigating this issue. Therefore, it is necessary to investigate the effectiveness of digested slurry as fertilizer considering appropriate application rate and timing for the site in Vietnam.
3) It has been shown that environmental pollution in lower water bodies such as nitrogen loads and fecal contamination through surface discharge after application of digested slurry may be prevented by keeping surface water of paddy fields for a certain period after application of slurry. However, the period of such water retention may be different
農研機構研究報告 農村工学研究部門 第 1 号 (平成 29 年 3 月) ORITATE Fumiko:Use of Digested Slurry from Livestock Manure in Paddy Fields and its Environmental Effect in Southeast Asia144 145
ブック 1.indb 144 2017/03/22 10:05:34
according to the situation in the paddy field. Some experiments suggested the period be seven days after fertilization, while other experiments ten days. Therefore, it is necessary to investigate the fate of nitrogen and fecal indicator microbes in surface water after application of digested slurry in paddy fields.
4) Several kinds of transportation and application methods of digested slurry to paddy fields have been developed in Japan. Vacuum trucks are popularly used for transportation, and pouring method is supposed to be the most suitable method when focusing on availability of digested slurry not only for basal but also for top-dressing and minimum necessity of equipment for adopting it. For these reasons, pouring method using vacuum trucks seems to be the most recommendable method in developing countries such as Vietnam in which specific transportation and application method of slurry has not yet existed, and nitrogen fertilizer is conventionally applied twice or three times as top-dressing. However, the conditions of paddy fields in Southeast Asian Countries are substantially different from Japan. For example, pouring method needs strict and flexible water management to achieve even spatial distribution of digested slurry as mentioned in Section of 2.5, but it may be sometimes difficult in paddy fields in Southeast Asia including Vietnam, where water management practices are not so strict nor flexible, which may sometimes cause extremely dry conditions in surface soil or deep flooding of surface water. Moreover, the cost needed for application of slurry by pouring method may be significantly different between the cases in Japan and Vietnam. If the cost becomes extremely higher than that of conventional cultivation methods with chemical fertilizers, the adoption of slurry may be difficult. For these reasons, it is necessary to investigate whether the pouring method is adoptable to paddy fields in Vietnam through field surveys and observations, and the evaluation from the economic aspect.
3. ANALYSIS OF PRESENT CONDITIONS OF BIOMASS USE IN A SUBURBAN VILLAGE IN SOUTHERN
VIETNAM
3.1 Introduction
This chapter describes the present conditions of regional biomass use in preparation for proposing improved biomass scenario later in Chapter 6 in a suburban village in Southern Vietnam. The village is one of common villages in Southeast Asia due to existence of livestock farming and rice cultivation. Data related to livestock farming, rice cultivation and so on is collected by interviews, field surveys and literature reviews, and applied to the regional diagnosis.
3.2 Methods
3.2.1 Objective Village
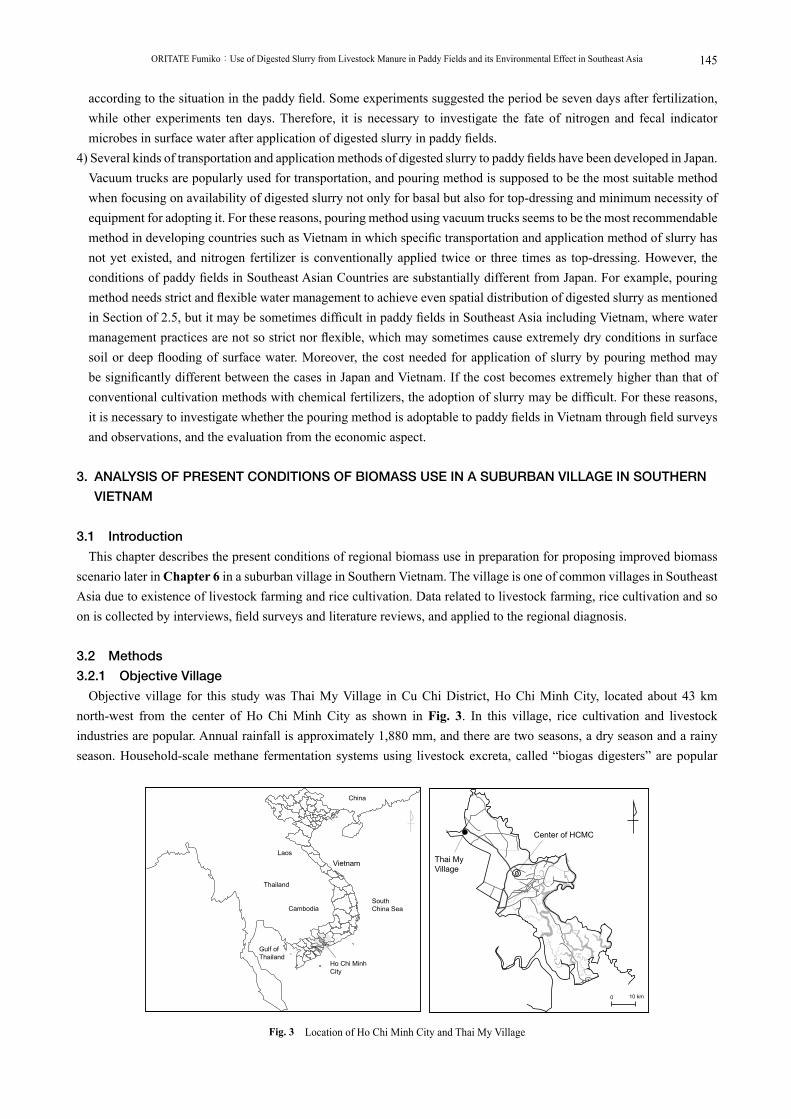
Objective village for this study was Thai My Village in Cu Chi District, Ho Chi Minh City, located about 43 km north-west from the center of Ho Chi Minh City as shown in Fig. 3. In this village, rice cultivation and livestock industries are popular. Annual rainfall is approximately 1,880 mm, and there are two seasons, a dry season and a rainy season. Household-scale methane fermentation systems using livestock excreta, called “biogas digesters” are popular
Fig. 3 Location of Ho Chi Minh City and Thai My Village
Center of HCMC
Thai My Village
0 10 km
Vietnam
South China Sea
Ho Chi Minh City
Cambodia
Laos
Thailand
China
Gulf of Thailand
農研機構研究報告 農村工学研究部門 第 1 号 (平成 29 年 3 月) ORITATE Fumiko:Use of Digested Slurry from Livestock Manure in Paddy Fields and its Environmental Effect in Southeast Asia144 145
ブック 1.indb 145 2017/03/22 10:05:34

Item Data〔(Data source)〕a. Basic information
(a) Land use and the area Total area of the village 2,415 ha〔(1)〕 Agricultural land 1,861 ha〔(1)〕 Road 113 ha〔(1)〕 River and Canal area 123 ha〔(1)〕 Residential area 159 ha〔(1)〕 Others 159 ha〔(1)〕(b) Population Population 10,849 people〔(1)〕 Number of households 2,873 households〔(1)〕 Number of farmer households 967 households〔(1)〕 Agricultural workers 2,224 people〔(1)〕(c) Variety and usage of energy at home Fuel variety Electricity, Wood, Biogas, Rice straw and husk〔(1)〕 Usage of fuel Electrical equipment, Lighting, TV, Radio, Stove burner, Cooking〔(1)〕(d) Conditions of sources for drinking water Water well in house (Depth; 4-50 m), Tank for drinking water〔(1)〕(e) Environmental problems Discharge of large quantity of untreated pig excreta〔(1)〕
b. Agricultural information (a) Main crop situation, annual planted area
Rice 544 ha, 2 or 3 crops in a year according to the economic situation or field conditions〔(2)〕
Corn and peanuts 200 ha〔(2)〕 Vegetables 75 ha〔(2)〕 Fruits 146 ha〔(2)〕(b) Agricultural machinery
Machinery types and numbers in the village
Combine; 2 equipmentTractor; 7-8 equipmentRice mill; 4 equipmentTilling machineryWater pump〔(2)〕
Fuel types for machinery Diesel oil (for large machinery)Gasoline (for small machinery) 〔(2)〕
c. Information about rice cultivation(a) Variety and application rate of fertilizer
Mixed fertilizer of NPK, Urea, Phosphorus, Potassium, etc.500-900 kg ha-1 (crop season)-1 (total weight of fertilizers)〔(3)〕
(b) Method for water management By portable pump owned by farmer through canals nearby the field〔(4)〕
(c) Water quality of canal and river Shown in Table 2〔(5)〕
Table 1 Data collected for regional diagnosis (Page 1 of 3)
in this village through promotion by government-led programs (Vietnam Livestock Production Department MARD and Netherlands Development Organization SNV, 2013). There are 111 households that have biogas digesters with capacities of 7.8±1.2 m3 in the fermentation tank volume. Information and data collected by the surveys are shown in Table 1.
農研機構研究報告 農村工学研究部門 第 1 号 (平成 29 年 3 月) ORITATE Fumiko:Use of Digested Slurry from Livestock Manure in Paddy Fields and its Environmental Effect in Southeast Asia146 147
ブック 1.indb 146 2017/03/22 10:05:35
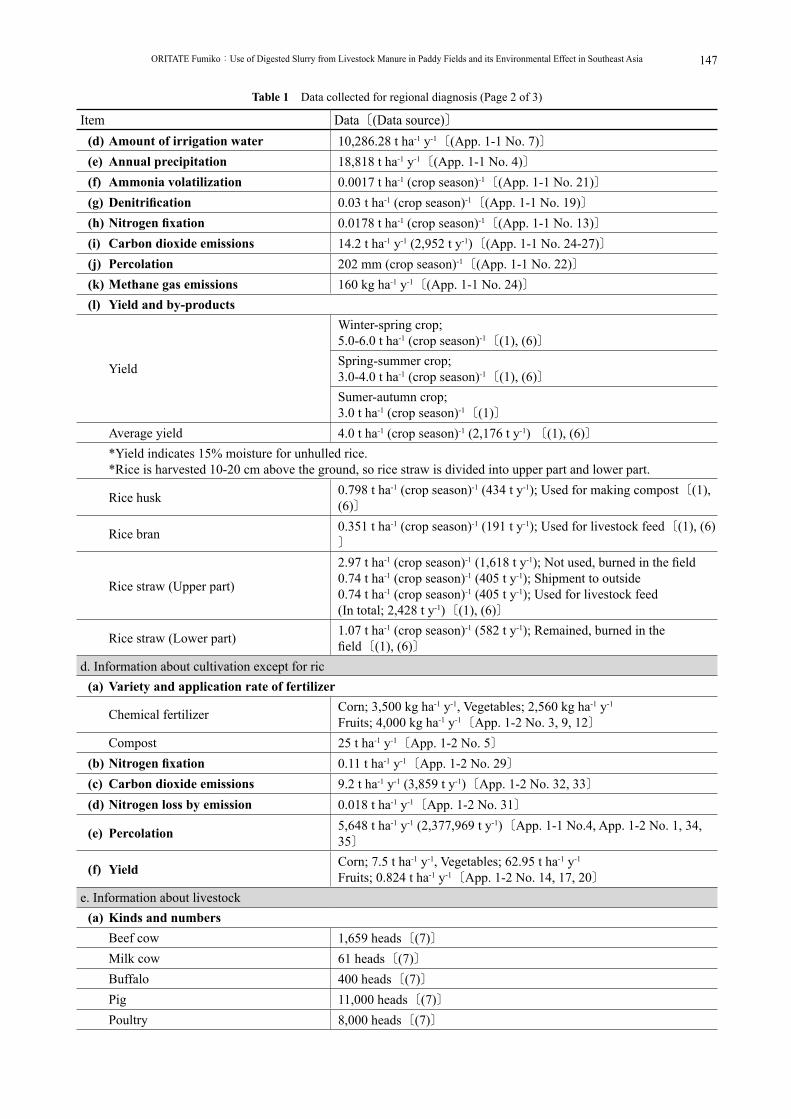
Table 1 Data collected for regional diagnosis (Page 2 of 3)
Item Data〔(Data source)〕(d) Amount of irrigation water 10,286.28 t ha-1 y-1〔(App. 1-1 No. 7)〕(e) Annual precipitation 18,818 t ha-1 y-1〔(App. 1-1 No. 4)〕(f) Ammonia volatilization 0.0017 t ha-1 (crop season)-1〔(App. 1-1 No. 21)〕(g) Denitrification 0.03 t ha-1 (crop season)-1〔(App. 1-1 No. 19)〕(h) Nitrogen fixation 0.0178 t ha-1 (crop season)-1〔(App. 1-1 No. 13)〕(i) Carbon dioxide emissions 14.2 t ha-1 y-1 (2,952 t y-1)〔(App. 1-1 No. 24-27)〕(j) Percolation 202 mm (crop season)-1〔(App. 1-1 No. 22)〕(k) Methane gas emissions 160 kg ha-1 y-1〔(App. 1-1 No. 24)〕(l) Yield and by-products
Yield
Winter-spring crop;5.0-6.0 t ha-1 (crop season)-1〔(1), (6)〕Spring-summer crop;3.0-4.0 t ha-1 (crop season)-1〔(1), (6)〕Sumer-autumn crop;3.0 t ha-1 (crop season)-1〔(1)〕
Average yield 4.0 t ha-1 (crop season)-1 (2,176 t y-1) 〔(1), (6)〕 *Yield indicates 15% moisture for unhulled rice. *Rice is harvested 10-20 cm above the ground, so rice straw is divided into upper part and lower part.
Rice husk 0.798 t ha-1 (crop season)-1 (434 t y-1); Used for making compost〔(1), (6)〕
Rice bran 0.351 t ha-1 (crop season)-1 (191 t y-1); Used for livestock feed〔(1), (6)〕
Rice straw (Upper part)
2.97 t ha-1 (crop season)-1 (1,618 t y-1); Not used, burned in the field0.74 t ha-1 (crop season)-1 (405 t y-1); Shipment to outside0.74 t ha-1 (crop season)-1 (405 t y-1); Used for livestock feed(In total; 2,428 t y-1)〔(1), (6)〕
Rice straw (Lower part) 1.07 t ha-1 (crop season)-1 (582 t y-1); Remained, burned in the field〔(1), (6)〕
d. Information about cultivation except for ric(a) Variety and application rate of fertilizer
Chemical fertilizer Corn; 3,500 kg ha-1 y-1, Vegetables; 2,560 kg ha-1 y-1
Fruits; 4,000 kg ha-1 y-1〔App. 1-2 No. 3, 9, 12〕 Compost 25 t ha-1 y-1〔App. 1-2 No. 5〕(b) Nitrogen fixation 0.11 t ha-1 y-1〔App. 1-2 No. 29〕(c) Carbon dioxide emissions 9.2 t ha-1 y-1 (3,859 t y-1)〔App. 1-2 No. 32, 33〕(d) Nitrogen loss by emission 0.018 t ha-1 y-1〔App. 1-2 No. 31〕
(e) Percolation 5,648 t ha-1 y-1 (2,377,969 t y-1)〔App. 1-1 No.4, App. 1-2 No. 1, 34, 35〕
(f) Yield Corn; 7.5 t ha-1 y-1, Vegetables; 62.95 t ha-1 y-1
Fruits; 0.824 t ha-1 y-1〔App. 1-2 No. 14, 17, 20〕e. Information about livestock
(a) Kinds and numbers Beef cow 1,659 heads〔(7)〕 Milk cow 61 heads〔(7)〕 Buffalo 400 heads〔(7)〕 Pig 11,000 heads〔(7)〕 Poultry 8,000 heads〔(7)〕
農研機構研究報告 農村工学研究部門 第 1 号 (平成 29 年 3 月) ORITATE Fumiko:Use of Digested Slurry from Livestock Manure in Paddy Fields and its Environmental Effect in Southeast Asia146 147
ブック 1.indb 147 2017/03/22 10:05:35
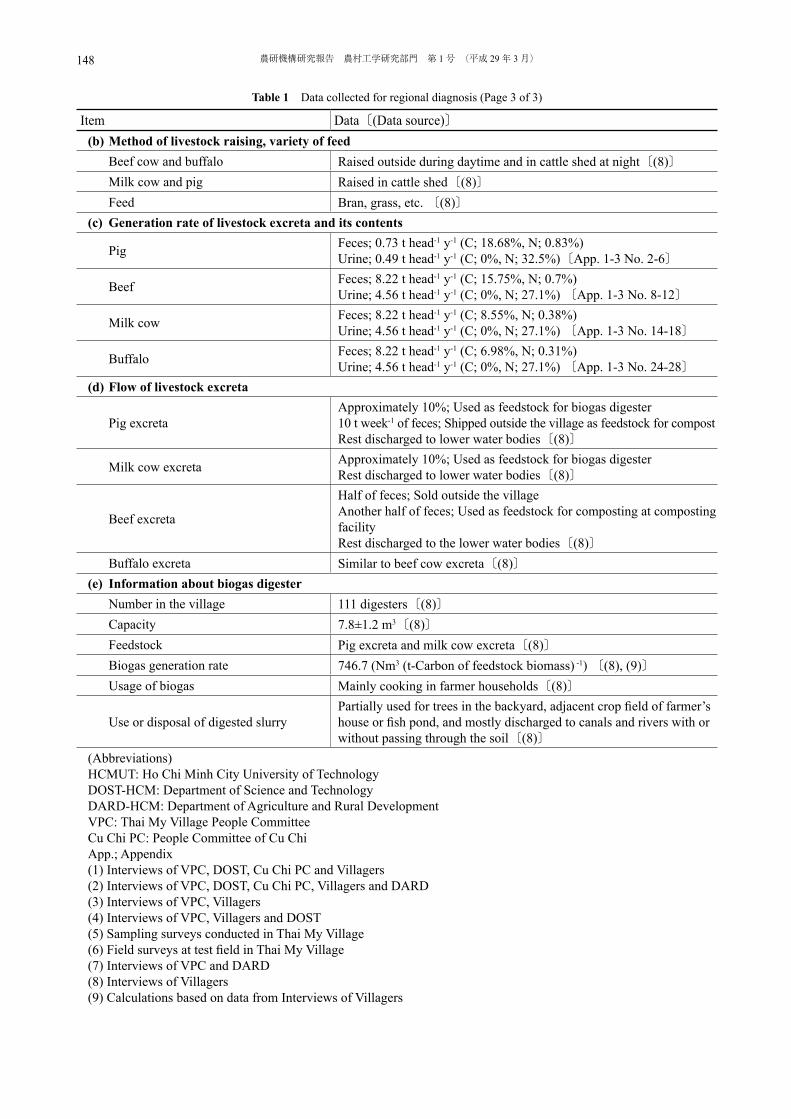
Item Data〔(Data source)〕(b) Method of livestock raising, variety of feed Beef cow and buffalo Raised outside during daytime and in cattle shed at night〔(8)〕 Milk cow and pig Raised in cattle shed〔(8)〕 Feed Bran, grass, etc. 〔(8)〕(c) Generation rate of livestock excreta and its contents
Pig Feces; 0.73 t head-1 y-1 (C; 18.68%, N; 0.83%) Urine; 0.49 t head-1 y-1 (C; 0%, N; 32.5%)〔App. 1-3 No. 2-6〕
Beef Feces; 8.22 t head-1 y-1 (C; 15.75%, N; 0.7%) Urine; 4.56 t head-1 y-1 (C; 0%, N; 27.1%) 〔App. 1-3 No. 8-12〕
Milk cow Feces; 8.22 t head-1 y-1 (C; 8.55%, N; 0.38%) Urine; 4.56 t head-1 y-1 (C; 0%, N; 27.1%) 〔App. 1-3 No. 14-18〕
Buffalo Feces; 8.22 t head-1 y-1 (C; 6.98%, N; 0.31%) Urine; 4.56 t head-1 y-1 (C; 0%, N; 27.1%) 〔App. 1-3 No. 24-28〕
(d) Flow of livestock excreta
Pig excretaApproximately 10%; Used as feedstock for biogas digester10 t week-1 of feces; Shipped outside the village as feedstock for compostRest discharged to lower water bodies〔(8)〕
Milk cow excreta Approximately 10%; Used as feedstock for biogas digester Rest discharged to lower water bodies〔(8)〕
Beef excreta
Half of feces; Sold outside the village Another half of feces; Used as feedstock for composting at composting facility Rest discharged to the lower water bodies〔(8)〕
Buffalo excreta Similar to beef cow excreta〔(8)〕(e) Information about biogas digester Number in the village 111 digesters〔(8)〕 Capacity 7.8±1.2 m3〔(8)〕 Feedstock Pig excreta and milk cow excreta〔(8)〕 Biogas generation rate 746.7 (Nm3 (t-Carbon of feedstock biomass) -1) 〔(8), (9)〕 Usage of biogas Mainly cooking in farmer households〔(8)〕
Use or disposal of digested slurryPartially used for trees in the backyard, adjacent crop field of farmer’s house or fish pond, and mostly discharged to canals and rivers with or without passing through the soil〔(8)〕
(Abbreviations) HCMUT: Ho Chi Minh City University of TechnologyDOST-HCM: Department of Science and TechnologyDARD-HCM: Department of Agriculture and Rural DevelopmentVPC: Thai My Village People CommitteeCu Chi PC: People Committee of Cu ChiApp.; Appendix(1) Interviews of VPC, DOST, Cu Chi PC and Villagers(2) Interviews of VPC, DOST, Cu Chi PC, Villagers and DARD(3) Interviews of VPC, Villagers(4) Interviews of VPC, Villagers and DOST(5) Sampling surveys conducted in Thai My Village(6) Field surveys at test field in Thai My Village(7) Interviews of VPC and DARD(8) Interviews of Villagers(9) Calculations based on data from Interviews of Villagers
Table 1 Data collected for regional diagnosis (Page 3 of 3)
農研機構研究報告 農村工学研究部門 第 1 号 (平成 29 年 3 月) ORITATE Fumiko:Use of Digested Slurry from Livestock Manure in Paddy Fields and its Environmental Effect in Southeast Asia148 149
ブック 1.indb 148 2017/03/22 10:05:35
3.2.2 Method of the Regional Diagnosis
The regional diagnosis method, developed by Yuyama (2005), is designed to draw a region-wide map of material flows on the basis of survey data, and conducted by the following procedures.
First, data needed for analysis of the present conditions of biomass use for the objective area were collected as described in the following section. Some data had to be substituted with Japanese ones though on-site or Vietnamese original data should be used for the regional diagnosis. Most data related to non-paddy fields were substituted with Japanese ones. However, the regional diagnosis in this study focused on material flow around paddy field compartments. Therefore, most conclusions in this study reflect the Vietnamese on-site situation.
Second, the present conditions of biomass use were represented as the “present” material flow diagram. It is composed of a “compartment (box)” that represents space to generate, convert or use biomass, and “arrow” that represents material flow. The compartments involve livestock farming, agricultural fields, biogas digesters, and composting facilities, etc. Components for analysis were raw weight, water content, carbon content and nitrogen content of feedstock biomass and products. Each value used in the material flow diagram was calculated by multiplying the specific unit of each parameter by its abundance. Specific unit was based on the surveys or literature and the data sources and detailed calculations are shown in the Appendix 1 of this thesis.
Third, the regional diagnosis method evaluates the effects of newly installing biomass conversion facilities, such as biogas digesters, by recalculating the material flows after adjusting some input data according to future scenarios. This step will be a focus in Chapter 6.
3.2.3 Data Collection for Regional Diagnosis
Data for regional diagnosis was collected by interviews, field surveys and literature reviews. Interviews were conducted from 11 to 29 January 2010 and 27 October 2010. Interviewees were farmers (30 households)
and public administrations such as Vietnam Department of Science and Technology, Peoples Committee of Ho Chi Minh City (DOST-HCM), Department of Agriculture and Rural Development of Ho Chi Minh City (DARD-HCM), People committee of Cu Chi District, People committee of Thai My Village, the objective village in this study.
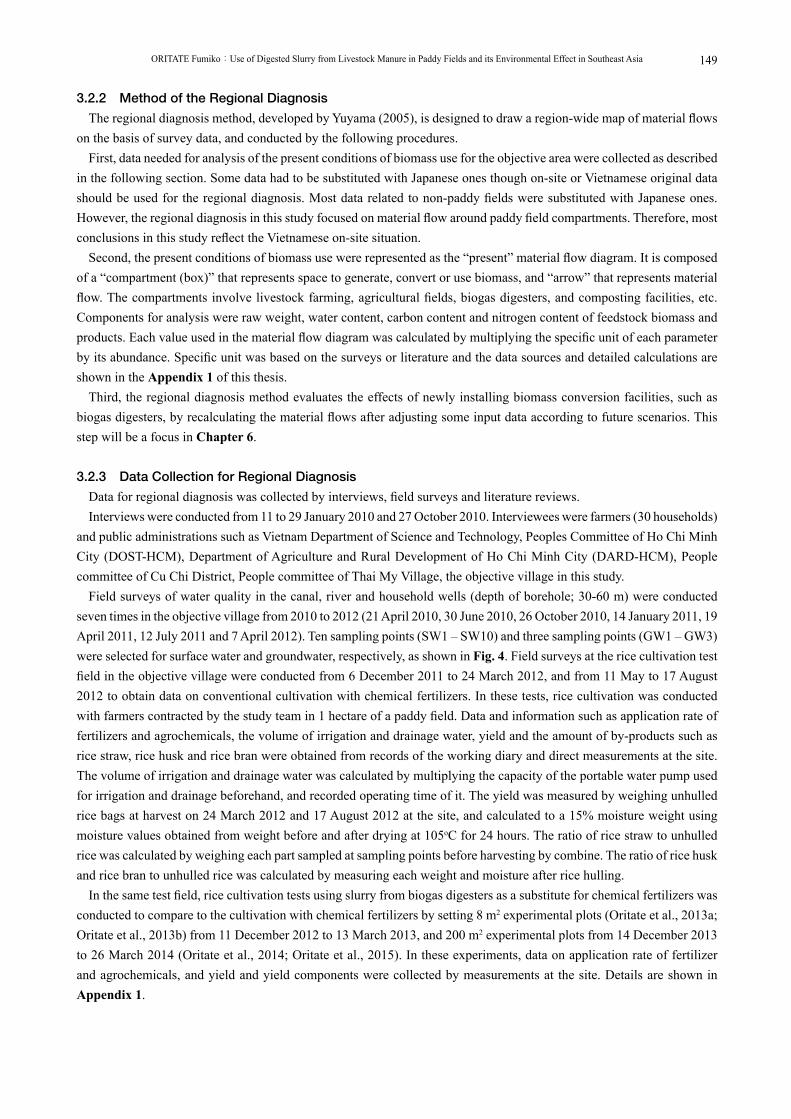
Field surveys of water quality in the canal, river and household wells (depth of borehole; 30-60 m) were conducted seven times in the objective village from 2010 to 2012 (21 April 2010, 30 June 2010, 26 October 2010, 14 January 2011, 19 April 2011, 12 July 2011 and 7 April 2012). Ten sampling points (SW1 – SW10) and three sampling points (GW1 – GW3) were selected for surface water and groundwater, respectively, as shown in Fig. 4. Field surveys at the rice cultivation test field in the objective village were conducted from 6 December 2011 to 24 March 2012, and from 11 May to 17 August 2012 to obtain data on conventional cultivation with chemical fertilizers. In these tests, rice cultivation was conducted with farmers contracted by the study team in 1 hectare of a paddy field. Data and information such as application rate of fertilizers and agrochemicals, the volume of irrigation and drainage water, yield and the amount of by-products such as rice straw, rice husk and rice bran were obtained from records of the working diary and direct measurements at the site. The volume of irrigation and drainage water was calculated by multiplying the capacity of the portable water pump used for irrigation and drainage beforehand, and recorded operating time of it. The yield was measured by weighing unhulled rice bags at harvest on 24 March 2012 and 17 August 2012 at the site, and calculated to a 15% moisture weight using moisture values obtained from weight before and after drying at 105oC for 24 hours. The ratio of rice straw to unhulled rice was calculated by weighing each part sampled at sampling points before harvesting by combine. The ratio of rice husk and rice bran to unhulled rice was calculated by measuring each weight and moisture after rice hulling.
In the same test field, rice cultivation tests using slurry from biogas digesters as a substitute for chemical fertilizers was conducted to compare to the cultivation with chemical fertilizers by setting 8 m2 experimental plots (Oritate et al., 2013a; Oritate et al., 2013b) from 11 December 2012 to 13 March 2013, and 200 m2 experimental plots from 14 December 2013 to 26 March 2014 (Oritate et al., 2014; Oritate et al., 2015). In these experiments, data on application rate of fertilizer and agrochemicals, and yield and yield components were collected by measurements at the site. Details are shown in Appendix 1.
農研機構研究報告 農村工学研究部門 第 1 号 (平成 29 年 3 月) ORITATE Fumiko:Use of Digested Slurry from Livestock Manure in Paddy Fields and its Environmental Effect in Southeast Asia148 149
ブック 1.indb 149 2017/03/22 10:05:35
3.3 Results and Discussion
3.3.1 Estimation of Present Conditions of Biomass Use
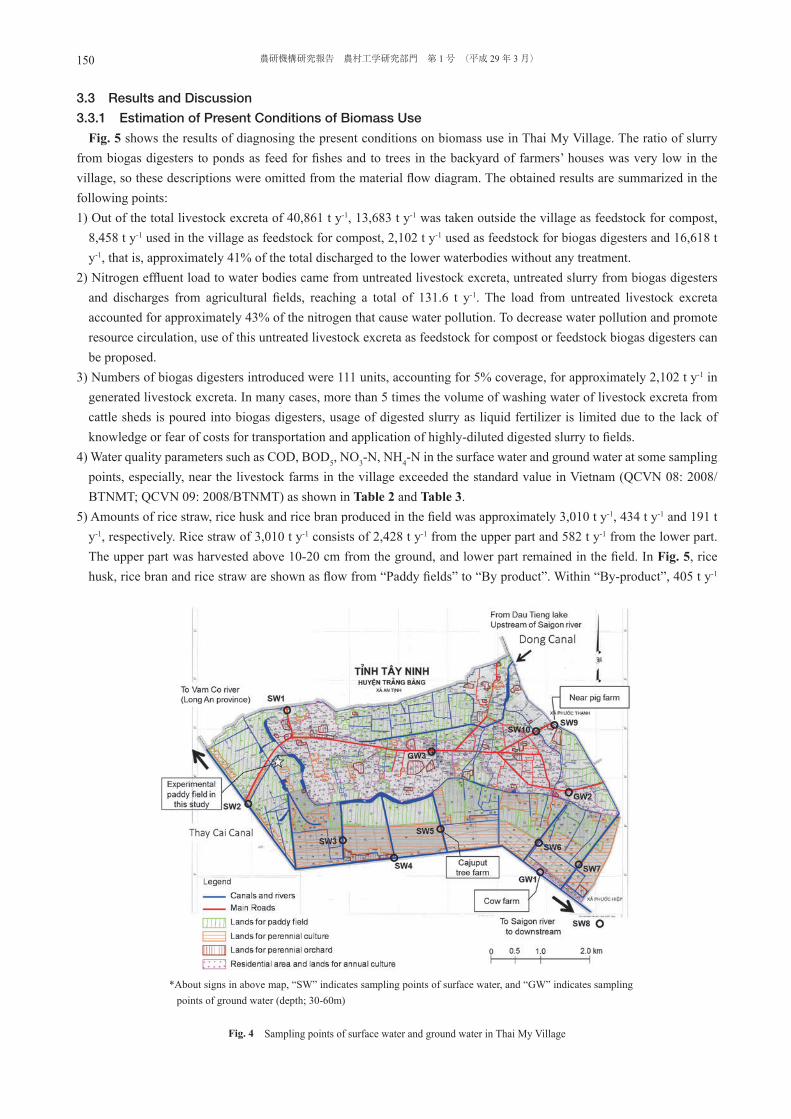
Fig. 5 shows the results of diagnosing the present conditions on biomass use in Thai My Village. The ratio of slurry from biogas digesters to ponds as feed for fishes and to trees in the backyard of farmers’ houses was very low in the village, so these descriptions were omitted from the material flow diagram. The obtained results are summarized in the following points:1) Out of the total livestock excreta of 40,861 t y-1, 13,683 t y-1 was taken outside the village as feedstock for compost,
8,458 t y-1 used in the village as feedstock for compost, 2,102 t y-1 used as feedstock for biogas digesters and 16,618 t y-1, that is, approximately 41% of the total discharged to the lower waterbodies without any treatment.
2) Nitrogen effluent load to water bodies came from untreated livestock excreta, untreated slurry from biogas digesters and discharges from agricultural fields, reaching a total of 131.6 t y-1. The load from untreated livestock excreta accounted for approximately 43% of the nitrogen that cause water pollution. To decrease water pollution and promote resource circulation, use of this untreated livestock excreta as feedstock for compost or feedstock biogas digesters can be proposed.
3) Numbers of biogas digesters introduced were 111 units, accounting for 5% coverage, for approximately 2,102 t y-1 in generated livestock excreta. In many cases, more than 5 times the volume of washing water of livestock excreta from cattle sheds is poured into biogas digesters, usage of digested slurry as liquid fertilizer is limited due to the lack of knowledge or fear of costs for transportation and application of highly-diluted digested slurry to fields.
4) Water quality parameters such as COD, BOD5, NO3-N, NH4-N in the surface water and ground water at some sampling points, especially, near the livestock farms in the village exceeded the standard value in Vietnam (QCVN 08: 2008/BTNMT; QCVN 09: 2008/BTNMT) as shown in Table 2 and Table 3.
5) Amounts of rice straw, rice husk and rice bran produced in the field was approximately 3,010 t y-1, 434 t y-1 and 191 t y-1, respectively. Rice straw of 3,010 t y-1 consists of 2,428 t y-1 from the upper part and 582 t y-1 from the lower part. The upper part was harvested above 10-20 cm from the ground, and lower part remained in the field. In Fig. 5, rice husk, rice bran and rice straw are shown as flow from “Paddy fields” to “By product”. Within “By-product”, 405 t y-1
Fig. 4 Sampling points of surface water and ground water in Thai My Village
*About signs in above map, “SW” indicates sampling points of surface water, and “GW” indicates sampling points of ground water (depth; 30-60m)
農研機構研究報告 農村工学研究部門 第 1 号 (平成 29 年 3 月) ORITATE Fumiko:Use of Digested Slurry from Livestock Manure in Paddy Fields and its Environmental Effect in Southeast Asia150 151
ブック 1.indb 150 2017/03/22 10:05:35
was transported outside the village, 595 t y-1 used as feed for livestock and 434 t y-1 used as feedstock for compost inside the village. Whereas, 1,618 t y-1 of the upper part of rice straw, which is larger than the “By product” was not used effectively and burned in the fields along with 582 t y-1 of the lower part of rice straw within a few weeks after harvesting. Promotion of effective use of this unused rice straw is desired in terms of resource circulation in the region.
3.3.2 Options for Decrease of Environmental Loads by Biomass Use focusing on Energy Production
In the previous section, the necessity to promote effective use of untreated livestock excreta that is discharged into water bodies at present was proposed in terms of decrease of environmental loads and regional resource circulation. Moreover, the desirability of effective use of rice straw that is unused at present is also proposed in terms of promoting resource circulation. Among some options for use of these biomass, the use as the feedstock for regional energy production such as biogas or bio-ethanol would be sensible options. Technology for bio-ethanol production from rice straw is now under development as mentioned in Chapter 1, but biogas technology has already been adopted in rural areas in Vietnam as mentioned in Chapter 2 and this chapter. Therefore, use of livestock manure as feedstock for biogas digesters is discussed hereafter. Especially, biogas digesters followed by the use of digested slurry as a fertilizer in paddy fields which occupy large area of agricultural land in the region is proposed as an effective option in terms of 1) decreasing environmental loads, 2) increasing regional energy production, and 3) saving the input of chemical fertilizers to agricultural fields. Organic components in livestock excreta are decomposed through methane fermentation processes in biogas digesters (Li, 2005), therefore, digested slurry is easier for plants to use when compared to untreated livestock excreta. However, since actual use of digested slurry in paddy fields is now rarely conducted at the site as mentioned above, it is necessary to investigate effects of it on rice as a fertilizer, environmental effects such as nitrogen pollution or fecal contamination of lower water bodies through surface discharge, and transportation and application method which is economically feasible.
COD BOD5 NH4-N NO3-N TNmg L-1 mg L-1 mg L-1 mg L-1 mg L-1
SW1a 89 19.7 1.5 20.1 9.0SW2 72 18.6 1.1 1.5 6.5SW3 138 19.1 1.6 0.9 3.0SW4 98 28.9 3.4 1.2 7.8SW5 84 21.1 1.2 0.4 3.2SW6 75 20.0 3.8 1.5 9.0SW7 125 17.1 1.5 3.3 5.6SW8 84 27.9 3.1 4.3 8.6SW9 254 74.0 7.4 2.3 18.5
SW10 14 5.4 0.2 0.2 0.7QCVN08b ≤30 ≤15.0 ≤0.5 ≤10.0 -
a SW1-SW10 are the sampling points as shown in Fig. 4. Each value is the average of all data obtained by sampling surveys except for the following missing values: all parameters of SW10 on 26 October 2010, SW6 on 14 January 2011 and SW10 on 7 April 2012 for without water at sampling points, and TN of all sampling points on 21 April 2010 for missing of analysis.
b “QCVN08” is standard for surface water in Vietnam, “QCVN08: 2008/BTNMT”
Table 2 Surface water quality of rivers and canals in Thai My Village
Table 3 Ground water quality in Thai My Village
pH TOC NH4-N NO3-N TNmg L-1 mg L-1 mg L-1 mg L-1
GW1a 6.4 2.2 3.1 2.7 7.1GW2 5.8 4.9 0.2 0.3 0.5GW3 5.4 0.9 0.1 0.5 0.8
QCVN09b 5.5-8.5 - ≤0.1 - -a GW1-GW3 are the sampling points as shown in Fig. 4. Each value is the average of all data obtained
by sampling surveys except for the following missing values: NO3-N and TN in all sampling points on 21 April 2010 for missing of analysis
b “QCVN09” is standard for ground water in Vietnam, “QCVN09: 2008/BTNMT”
農研機構研究報告 農村工学研究部門 第 1 号 (平成 29 年 3 月) ORITATE Fumiko:Use of Digested Slurry from Livestock Manure in Paddy Fields and its Environmental Effect in Southeast Asia150 151
ブック 1.indb 151 2017/03/22 10:05:35

3.4 Conclusion
This chapter investigated the present conditions of biomass use focusing on livestock excreta treatment, rice cultivation and conditions of water quality in waterbodies. Necessary data and information were collected from literature reviews, interviews of farmers and public administrative staff, and field surveys. The material flow diagram that represents the present biomass use showed that untreated livestock excreta may cause water pollution, and some by-products from rice cultivation are not effectively used despite they are sources of energy. The effective use of these through appropriate conversion process can contribute to an increase in production of regional energy such as biogas or bio-ethanol. Especially, the use of currently untreated livestock excreta as a feedstock for biogas digesters followed by the use of digested slurry in paddy fields as a fertilizer is an effective option in terms of environmental conservation and saving the input of chemical fertilizers to agricultural fields.
In promotion of the use of digested slurry, it is necessary to investigate effects of it on rice as a fertilizer, environmental effects, and transportation and application method which is economically feasible.
Fig. 5 Present conditions of Thai My village
Agricultural field
Water bodies in the lower reaches
Compo-sting
facility
Shipment to the outside system
NH3, N2, CH4, CO2 emissionW; 5,306 N; 17.2 C; 1,527
Water bodies in the upper reaches
FoodW; 6,341C; 2,218N; 53.4
Feed, Bedding materialW; 595C; 192N; 4.2
Feces and urineW; 2,102C; 70N; 8.4
Irrigation WaterW; 2,238,295C; 9N; 2.9
Surface drainageW; 1,591,587C; 13N; 4.1
Paddy fields
Feces and urine for compost outsideW; 13,683C; 266N; 20.7
Food W;1,551C; 560N; 15.8
PhotosynthesisNitrogen fixationW; 6,233 C; 1,700 N; 9.7
PrecipitationW; 4,094,797C; 8N; 4.5
PrecipitationW; 7,922,378C; 15 N; 8.7
Chemical fertilizer,W; 457 C; 0 N; 54.4Rice husk
W; 434C; 128N; 1.2
Atomos-phere
Atomos-phere
Rice straw, Rice bran
BiogasW; 63 C; 28
N; 0
Downstream
Feed(Rice straw)W; 405C; 127N; 2.3
Percolation, LeachingW; 1,098,880C; 0N; 12.1
Rice straw, Rice husk, Rice branW; 1,434C; 447N; 7.6
Feces and urineW; 16,618 C; 385 N; 57.0
FecesW; 8,458C; 236N; 10.5
Evapotranspiration W; 3,642,624
SlurryW; 11,296C; 38N; 7.6
Chemical fertilizerW; 1,476 C; 0 N; 118.4
Gas (involvingH2O)W; 4,771 C; 146
N; 2.5 CompostW; 4,121C; 219N; 9.3
CompostW; 796 C; 695 N; 40.9
Percolation, LeachingW; 2,377,969C; 0N; 50.8
WaterW 10,512
PhotosynthesisNitrogen fixationW; 8,132 C; 2,218 N; 44.2
Evapotranspiration W; 5,545,665
Non-paddyfields
NH3, N2, CO2 emissionW; 3,867 N; 7.6C; 1,053
SlurryW; 1,255C; 4N; 0.8
Biogasdigester
By-product
Live-stock
W ; Raw weightC ; Carbon contentN ; Nitrogen contentUnit (t・y-1)
Livestock excreta
Water input to the agricultural field
Water output from the agricultural field
Organic fertilizer
Agricultural product
Agricultural by-product
Gas
Intake from the air
農研機構研究報告 農村工学研究部門 第 1 号 (平成 29 年 3 月) ORITATE Fumiko:Use of Digested Slurry from Livestock Manure in Paddy Fields and its Environmental Effect in Southeast Asia152 153
ブック 1.indb 152 2017/03/22 10:05:36

4. FEASIBILITY OF USE OF DIGESTED SLURRY IN PADDY FIELDS FROM FERTILIZER EFFECT AND
ENVIRONMENTAL IMPACT
4.1 Introduction
Digested slurry has a potential to be effective fertilizer and also baneful pollutants, because it contains a lot of organic substances, nitrogen and pathogenic microbes. However, effects as a fertilizer and environment impacts of digested slurry have not been quantitatively evaluated in paddy fields in Vietnam. In this chapter, fertilizer effects, fate of nitrogen and fecal indicator microbes with application of slurry are investigated by the field experiment. For evaluation of fertilizer effects, two types of nitrogen application rate focusing on T-N and NH4-N in digested slurry was prepared to propose the appropriate application rate of digested slurry at the site. For evaluation of environmental effects, prevention of pollution of lower water bodies derived from surface discharge was focused on. Fate of nitrogen components and fecal indicator microbes in surface water of a paddy field after fertilization was investigated to propose the appropriate period for keeping surface water in the paddy fields.
4.2 Materials and Methods
4.2.1 Experimental Fields and Fertilizers
An experiment was conducted during the dry season from December 2012 to March 2013 in a paddy field of Binh Ha Dong, Thai My Village, Cu Chi District (10º59’1978” N 106º22’0857” E). Areas around the experimental field in the western part of Thai My Village are low-lying land, and rice cultivation is conducted twice a year in most paddy fields. The soil is Typic Sulfaquepts (USDA 2010). Main properties of the soil in the experimental fields were: pH of 3.82, EC of 0.017 S m-1, T-N of 3.4 g kg-1, total carbon (T-C) of 43.1 g kg-1, NH4-N of 4.45 mg 100g-1, nitrate-nitrogen (NO3-N) of 0.02 mg 100g-1, calcium oxide (CaO), magnesium oxide (MgO) and potassium oxide (K2O) of 52.9, 41.1 and 17.1 mg 100g-1, respectively.
Experimental plots for three treatments with two replicates of each 8 m3 were set in the experimental fields as shown in Fig. 6.; 1) chemical fertilized plots (hereafter, CF), 2) digested slurry plots with the same nitrogen application rate as CF for NH4-N in digested slurry (hereafter, MF(NH4-N)), and 3) digested slurry plots with the same nitrogen application rate as CF for total kjeldahl nitrogen (TKN) in digested slurry (hereafter, MF(T-N)). Granulated mixed fertilizer of NPK (N: P2O5: K2O= 20: 20: 15), powdered urea and phosphorus fertilizer were applied to plot of CF. Digested slurry was collected from household scale biogas digesters of pig farmers shown in Fig. 7 in Thai My Village. The feedstock was pig manure and wash water from pig pens that was fermented at air-temperature. Collected digested slurry was transported from pig farms to a storage tank shown in Fig. 8 installed nearby the experimental paddy field. The digested slurry was sampled at the first additional fertilization on 20 December 2012. Main
Fig. 6 Experimental plots
Fig. 7 Biogas digester in a pig farm
Fig. 8 Storage tank of digested slurry
農研機構研究報告 農村工学研究部門 第 1 号 (平成 29 年 3 月) ORITATE Fumiko:Use of Digested Slurry from Livestock Manure in Paddy Fields and its Environmental Effect in Southeast Asia152 153
ブック 1.indb 153 2017/03/22 10:05:38

properties of the digested slurry were: pH of 7.05, EC of 0.32 S m-1, TKN of 885 mg L-1, NH4-N of 322 mg L-1, NO3-N of less than 0.01 mg L-1, PO4-P of 32.7 mg L-1, K+ of 213 mg L-1, E. coli of 3.6E+07 CFU 100 mL-1 and Coliforms of 5.40E+07 CFU 100 mL-1. Nitrogen, phosphorus and potassium concentrations of this digested slurry was analyzed again at the second additional fertilization on 8 January 2013, and the values were TKN of 566 mg L-1, and NH4-N of 449 mg L-1, PO4-P of 9.92 mg L-1 and of K+ of 236 mg L-1. At the third additional fertilization, the analysis of nitrogen concentrations was failed to be conducted.
4.2.2 Rice Cultivation Schedule and Fertilization Design
Rice cultivation was conducted based on the customary cultivation schedule in Thai My Village. Rice cultivar was “OM7347” and sowed directly in the ponded field on 11 December 2012. Additional fertilization was applied 3 times on 20 December 2012, 8 January 2013 and 22 January 2013. Chemical fertilizers were applied onto the surface water, and digested slurry was applied through rice plants using a bucket onto the surface water. Harvesting was conducted on 13 March 2013. Fertilization design is shown in Table 4, and planned and actual application rate of fertilizers is shown in Table 5. Application rate of digested slurry was decided based on the nitrogen concentrations in the digested slurry sampled and measured twice before the experiment with approximately 300 and 400 mg L-1 for NH4-N and TKN, respectively. Because N concentrations in digested slurry were variable, the actual nitrogen application rate was different from originally planned one.
4.2.3 Sampling and Analysis
Sampling of surface water was conducted mainly after fertilization during the flooded term, that is, on 11, 19, 20, 21, 22, 27 December 2012 and 9, 15, 23 January 2013. NH4-N and NO3-N were measured by the ion chromatograph (ICS-1500, Dionex), T-N was measured by the kjeldahl method and E. coli and Coliforms analyzed by the surface plating method using XMG agar (Nissuipharma).
Samples of surface soil were collected at a depth of 0-10 cm before seeding, after harvesting and mainly after
Experimental Plot
20 December 2012 8 January 2013 22 January 2013(The first additional fertilization) (The second additional fertilization) (The third additional fertilization)
Material Fertilization rate ha-1 Material Fertilization rate
ha-1 Material Fertilization rate ha-1
CF
Mixed fertilizer of NPKa 150 kg
Urea 100kg Urea 50 kgPhosphorus
fertilizer 400 kg
MF(NH4-N) Slurry 1.0×10⁵ L Slurry 1.5×10⁵ L Slurry 0.6×10⁵ Lb
MF(T-N) Slurry 0.8×10⁵ L Slurry 1.2×10⁵ L Slurry 0.5×10⁵ L
Planned fertilization ratea (kg ha-1) Actual fertilization rateb (kg ha-1)N P2O5 K2O N P2O5 K2O
T-N (NH4-N) T-N (NH4-N)CF 100 94 47 100 94 47
MF (NH4-N) 132 (99) - - 209 (128) 12 86MF(T-N) 100 (75) - - 166 (102) 10 69
Table 4 Fertilization design
Table 5 Planned and actual application rate of fertilizers
a Components of mixed fertilizer of NPK are N: P2O5: K2O=20: 20: 15,b Planned application rate: 0.8×10⁵ L
a Application rate of each fertilizer was planned focusing on nitrogen application rateb Actual fertilization rate was calculated by analyzed values of N, P and K in the slurry and applied volume of slurry at each
fertilization. Analyzed values of the slurry at the second fertilization were also used as the concentrations of N, P and K for the actual fertilization rate at the third additional fertilization
農研機構研究報告 農村工学研究部門 第 1 号 (平成 29 年 3 月) ORITATE Fumiko:Use of Digested Slurry from Livestock Manure in Paddy Fields and its Environmental Effect in Southeast Asia154 155
ブック 1.indb 154 2017/03/22 10:05:38
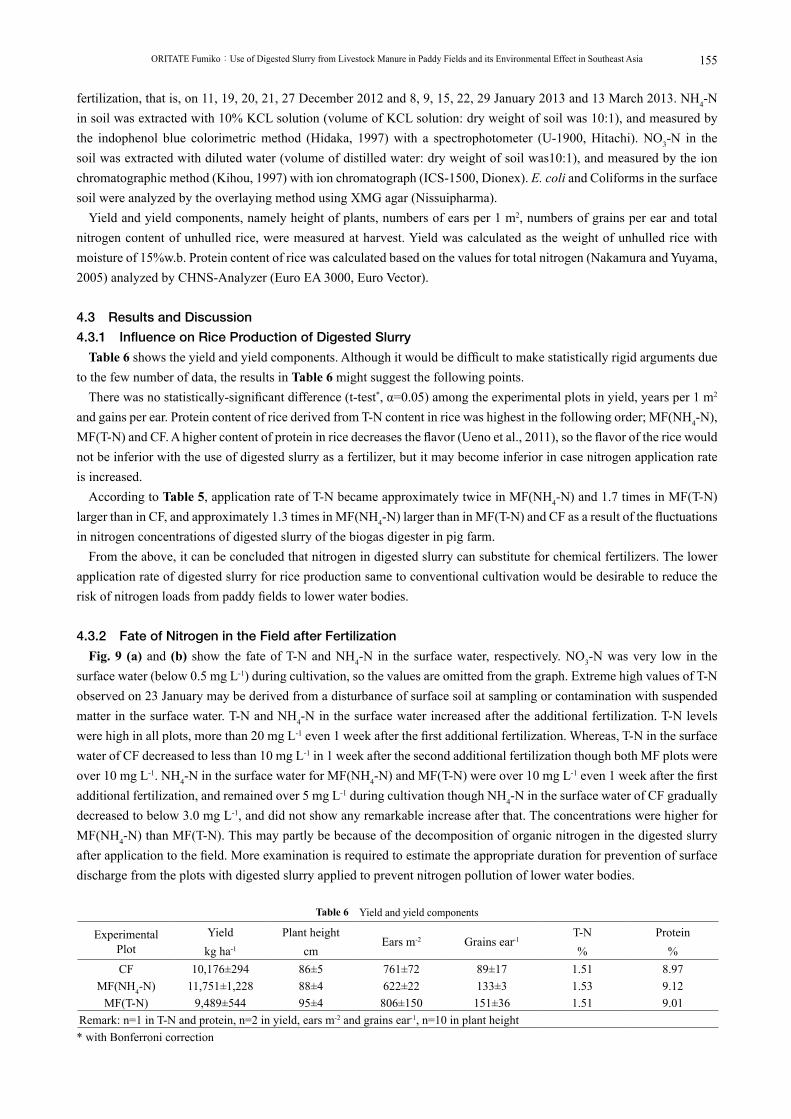
fertilization, that is, on 11, 19, 20, 21, 27 December 2012 and 8, 9, 15, 22, 29 January 2013 and 13 March 2013. NH4-N in soil was extracted with 10% KCL solution (volume of KCL solution: dry weight of soil was 10:1), and measured by the indophenol blue colorimetric method (Hidaka, 1997) with a spectrophotometer (U-1900, Hitachi). NO3-N in the soil was extracted with diluted water (volume of distilled water: dry weight of soil was10:1), and measured by the ion chromatographic method (Kihou, 1997) with ion chromatograph (ICS-1500, Dionex). E. coli and Coliforms in the surface soil were analyzed by the overlaying method using XMG agar (Nissuipharma).
Yield and yield components, namely height of plants, numbers of ears per 1 m2, numbers of grains per ear and total nitrogen content of unhulled rice, were measured at harvest. Yield was calculated as the weight of unhulled rice with moisture of 15%w.b. Protein content of rice was calculated based on the values for total nitrogen (Nakamura and Yuyama, 2005) analyzed by CHNS-Analyzer (Euro EA 3000, Euro Vector).
4.3 Results and Discussion
4.3.1 Influence on Rice Production of Digested Slurry
Table 6 shows the yield and yield components. Although it would be difficult to make statistically rigid arguments due to the few number of data, the results in Table 6 might suggest the following points.
There was no statistically-significant difference (t-test*, α=0.05) among the experimental plots in yield, years per 1 m2 and gains per ear. Protein content of rice derived from T-N content in rice was highest in the following order; MF(NH4-N), MF(T-N) and CF. A higher content of protein in rice decreases the flavor (Ueno et al., 2011), so the flavor of the rice would not be inferior with the use of digested slurry as a fertilizer, but it may become inferior in case nitrogen application rate is increased.
According to Table 5, application rate of T-N became approximately twice in MF(NH4-N) and 1.7 times in MF(T-N) larger than in CF, and approximately 1.3 times in MF(NH4-N) larger than in MF(T-N) and CF as a result of the fluctuations in nitrogen concentrations of digested slurry of the biogas digester in pig farm.
From the above, it can be concluded that nitrogen in digested slurry can substitute for chemical fertilizers. The lower application rate of digested slurry for rice production same to conventional cultivation would be desirable to reduce the risk of nitrogen loads from paddy fields to lower water bodies.
4.3.2 Fate of Nitrogen in the Field after Fertilization
Fig. 9 (a) and (b) show the fate of T-N and NH4-N in the surface water, respectively. NO3-N was very low in the surface water (below 0.5 mg L-1) during cultivation, so the values are omitted from the graph. Extreme high values of T-N observed on 23 January may be derived from a disturbance of surface soil at sampling or contamination with suspended matter in the surface water. T-N and NH4-N in the surface water increased after the additional fertilization. T-N levels were high in all plots, more than 20 mg L-1 even 1 week after the first additional fertilization. Whereas, T-N in the surface water of CF decreased to less than 10 mg L-1 in 1 week after the second additional fertilization though both MF plots were over 10 mg L-1. NH4-N in the surface water for MF(NH4-N) and MF(T-N) were over 10 mg L-1 even 1 week after the first additional fertilization, and remained over 5 mg L-1 during cultivation though NH4-N in the surface water of CF gradually decreased to below 3.0 mg L-1, and did not show any remarkable increase after that. The concentrations were higher for MF(NH4-N) than MF(T-N). This may partly be because of the decomposition of organic nitrogen in the digested slurry after application to the field. More examination is required to estimate the appropriate duration for prevention of surface discharge from the plots with digested slurry applied to prevent nitrogen pollution of lower water bodies.
ExperimentalPlot
Yield Plant heightEars m-2 Grains ear-1
T-N Proteinkg ha-1 cm % %
CF 10,176±294 86±5 761±72 89±17 1.51 8.97MF(NH4-N) 11,751±1,228 88±4 622±22 133±3 1.53 9.12
MF(T-N) 9,489±544 95±4 806±150 151±36 1.51 9.01Remark: n=1 in T-N and protein, n=2 in yield, ears m-2 and grains ear-1, n=10 in plant height
Table 6 Yield and yield components
* with Bonferroni correction
農研機構研究報告 農村工学研究部門 第 1 号 (平成 29 年 3 月) ORITATE Fumiko:Use of Digested Slurry from Livestock Manure in Paddy Fields and its Environmental Effect in Southeast Asia154 155
ブック 1.indb 155 2017/03/22 10:05:38

Fig. 9 (c) shows the fate of NH4-N in surface soil. NO3-N in surface soil was also very low (below 2.0 mg (100 g dry soil)-1) during cultivation, similar to the surface water, so it is omitted from the graph. NH4-N in the surface soil increased after fertilization and then gradually decreased. The value was higher in MF(NH4-N) than CF throughout the cultivation.
4.3.3 Fate of E. coli and Coliforms in the Field after Fertilization
Fig. 10 (a) and (b) show the fate of E. coli and Coliforms in surface water, respectively. E. coli and Coliforms in surface water at MF(NH4-N) and MF(TN) increased to a maximum of 1.0E+07 CFU 100 mL-1 after application of digested slurry, but decreased below non-detectable levels (less than 1.0E+02 CFU 100 mL-1) within a week and did not show subsequent increases. This result is similar to the findings by Ueda et al. (2003), who conducted experiments by applying unchlorinated secondary effluent from sewage treatment works to the paddy field model, and showed that fecal coliforms in the surface water of the paddy field model decreased 0.6 log day-1 and below 1.0E+03 CFU 100 mL-1 which was the WHO guideline on wastewater reuse for unrestricted irrigation (Mara and Cairncross, 1989) within a week, and concluded that the reason may being the exposition of UV radiation or increases in pH of surface water during photosynthesis of rice plants (Ueda et al., 2003). From this, at least 1 week of prevention of surface discharge from the plots with digested slurry applied is needed to prevent fecal contamination of lower water bodies.
Fig. 10 (c) shows the fate of E. coli in the surface soil. E. coli in MF(NH4-N) and MF(T-N) showed a slight increase (1.0E+02 CFU g-1) with the first application of digested slurry. However, it decreased to a non-detective level (less than 1.0E+01 CFU g-1) within a week and no subsequent increase was observed during cultivation. The reason for decreasing of E. coli and Coliforms were not investigated certainly in this experiment, but lower pH value of less than 4, other bacteria or protozoa in the soil would reduce E. coli and Coliforms.
Coliforms in the surface soil showed a similar trend as E. coli until 22 January 2013, but increased again after 22 January 2013 (omitted from the graph). Considering the trends of E. coli, increases in Coliforms are not likely from digested slurry, so will be investigated in a future study.
Fig. 9 (a) T-N in surface water, (b) NH4-N in surface water, (c) NH4-N in surface soil (n=2)
0
5
10
15
20
25
12/11 12/21 12/31 1/10 1/20 1/30 2/9 2/19 3/1 3/11
NH 4
-N(m
g (1
00g
dry
soil)
-1)
CF
MF(NH4-N)
MF(T-N)
(c)The 1st
add. fert.
The 2ndadd. fert.
The 3rd add. fert.
0
10
20
30
40
12/11 12/21 12/31 1/10 1/20 1/30 2/9 2/19 3/1 3/11
NH 4
-N (m
g L-1
)
CF
MF(NH4-N)
MF(T-N)
The 1st add. fert.
The 2ndadd. fert.
The 3rd add. fert.
(b)
Little surface water in the field so unable to collect water samples during this period
0
20
40
60
80
100
12/11 12/21 12/31 1/10 1/20 1/30 2/9 2/19 3/1 3/11
T-N
(mg
L-1)
CF
MF(NH4-N)
MF(T-N)
(a)The 1st add. fert.
The 2ndadd. fert.
The 3rd add. fert.
Little surface water in the field so unable to collect water samples during this period
農研機構研究報告 農村工学研究部門 第 1 号 (平成 29 年 3 月) ORITATE Fumiko:Use of Digested Slurry from Livestock Manure in Paddy Fields and its Environmental Effect in Southeast Asia156 157
ブック 1.indb 156 2017/03/22 10:05:39

4.4 ConclusionsFertilizer effects of digested slurry on rice, the fates of nitrogen components and fecal indicator microbes in surface
water after application of digested slurry as an additional fertilizer was investigated with the field experiment at the site with comparisons of chemical fertilizer treatments to evaluate the feasibility of use of digested slurry as a fertilizer in paddy fields in Southern Vietnam.
There were no statistically-significant differences between the plots with digested slurry applied and the plots with chemical fertilizers applied in yield and yield components, so digested slurry can be substituted for chemical fertilizer with no bad effects on the rice, and the lower application rate of digested slurry for rice production same to conventional cultivation would be desirable to reduce the risk of nitrogen loads from paddy fields to lower water bodies.
T-N in surface water of the plots with digested slurry applied were greater than 20 mg L-1 in 1 week after the first additional fertilization and more than 10 mg L-1 in 1 week after the second fertilization. NH4-N in surface water was greater than 10 mg L-1 in 1 week after the first additional fertilization, and remained over 5 mg L-1 during cultivation. From this results, more examination is required to estimate the appropriate duration for prevention of surface discharge from the plots with digested slurry applied to prevent nitrogen pollution of lower water bodies.
E. coli and Coliforms in surface water of the plots with digested slurry applied increased just after application of digested slurry, but decreased to non-detectable levels within a week. E. coli and Coliforms in the surface soil showed similar trends. Based on these results, at least 1 week of prevention of surface discharge from the plots with digested slurry applied is needed to prevent fecal contamination of lower water bodies.
Fig. 10 (a) E. coli in surface water, (b) Coliforms in surface water, (c) E. coli in surface soil.
1.0E+02
1.0E+04
1.0E+06
12/11 12/21 12/31 1/10 1/20 1/30 2/9 2/19 3/1 3/11
E. c
oli (
CFU
(dry
matt
er)-1
)E.
col
i (CF
U (1
00m
l)-1)
CF
MF(NH4-N)
MF(T-N)
(c)
The 1st The 2nd The 3rd
1.0E+02
1.0E+04
1.0E+06
1.0E+08
12/11 12/21 12/31 1/10 1/20 1/30 2/9 2/19 3/1 3/11
Colif
orm
s (C
FU (1
00m
l)-1)
CF MF(NH4-N)
MF(T-N)
(b)
Non-detectable levels
Non-detectable levels
Non-detectable levels
1.0E+02
1.0E+04
1.0E+06
1.0E+08
12/11 12/21 12/31 1/10 1/20 1/30 2/9 2/19 3/1 3/11
CFMF(NH4-N)MF(T-N)
(a)
The 1stThe 2nd The 3rd
Little surface water in the field sounable to collect water samplesduring this period
Little surface water in the field so unableto collect water samples during thisperiod
農研機構研究報告 農村工学研究部門 第 1 号 (平成 29 年 3 月) ORITATE Fumiko:Use of Digested Slurry from Livestock Manure in Paddy Fields and its Environmental Effect in Southeast Asia156 157
ブック 1.indb 157 2017/03/22 10:05:39
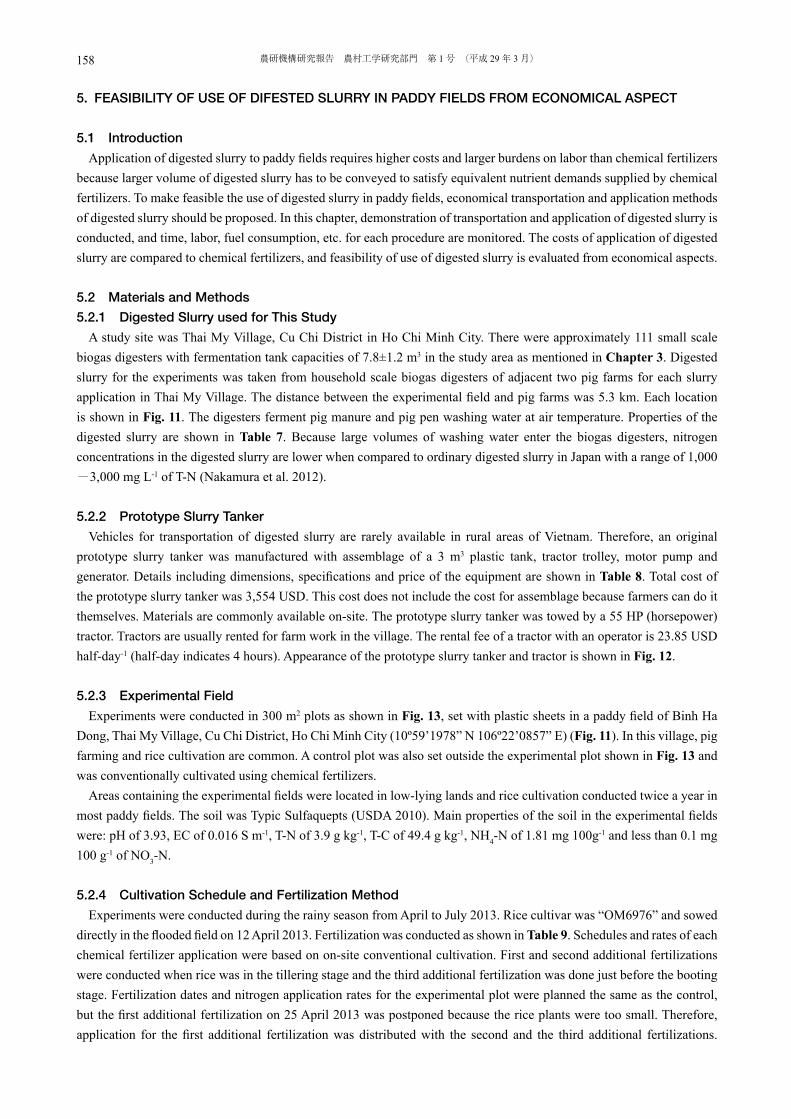
5. FEASIBILITY OF USE OF DIFESTED SLURRY IN PADDY FIELDS FROM ECONOMICAL ASPECT
5.1 Introduction
Application of digested slurry to paddy fields requires higher costs and larger burdens on labor than chemical fertilizers because larger volume of digested slurry has to be conveyed to satisfy equivalent nutrient demands supplied by chemical fertilizers. To make feasible the use of digested slurry in paddy fields, economical transportation and application methods of digested slurry should be proposed. In this chapter, demonstration of transportation and application of digested slurry is conducted, and time, labor, fuel consumption, etc. for each procedure are monitored. The costs of application of digested slurry are compared to chemical fertilizers, and feasibility of use of digested slurry is evaluated from economical aspects.
5.2 Materials and Methods
5.2.1 Digested Slurry used for This Study
A study site was Thai My Village, Cu Chi District in Ho Chi Minh City. There were approximately 111 small scale biogas digesters with fermentation tank capacities of 7.8±1.2 m3 in the study area as mentioned in Chapter 3. Digested slurry for the experiments was taken from household scale biogas digesters of adjacent two pig farms for each slurry application in Thai My Village. The distance between the experimental field and pig farms was 5.3 km. Each location is shown in Fig. 11. The digesters ferment pig manure and pig pen washing water at air temperature. Properties of the digested slurry are shown in Table 7. Because large volumes of washing water enter the biogas digesters, nitrogen concentrations in the digested slurry are lower when compared to ordinary digested slurry in Japan with a range of 1,000-3,000 mg L-1 of T-N (Nakamura et al. 2012).
5.2.2 Prototype Slurry Tanker
Vehicles for transportation of digested slurry are rarely available in rural areas of Vietnam. Therefore, an original prototype slurry tanker was manufactured with assemblage of a 3 m3 plastic tank, tractor trolley, motor pump and generator. Details including dimensions, specifications and price of the equipment are shown in Table 8. Total cost of the prototype slurry tanker was 3,554 USD. This cost does not include the cost for assemblage because farmers can do it themselves. Materials are commonly available on-site. The prototype slurry tanker was towed by a 55 HP (horsepower) tractor. Tractors are usually rented for farm work in the village. The rental fee of a tractor with an operator is 23.85 USD half-day-1 (half-day indicates 4 hours). Appearance of the prototype slurry tanker and tractor is shown in Fig. 12.
5.2.3 Experimental Field
Experiments were conducted in 300 m2 plots as shown in Fig. 13, set with plastic sheets in a paddy field of Binh Ha Dong, Thai My Village, Cu Chi District, Ho Chi Minh City (10º59’1978” N 106º22’0857” E) (Fig. 11). In this village, pig farming and rice cultivation are common. A control plot was also set outside the experimental plot shown in Fig. 13 and was conventionally cultivated using chemical fertilizers.
Areas containing the experimental fields were located in low-lying lands and rice cultivation conducted twice a year in most paddy fields. The soil was Typic Sulfaquepts (USDA 2010). Main properties of the soil in the experimental fields were: pH of 3.93, EC of 0.016 S m-1, T-N of 3.9 g kg-1, T-C of 49.4 g kg-1, NH4-N of 1.81 mg 100g-1 and less than 0.1 mg 100 g-1 of NO3-N.
5.2.4 Cultivation Schedule and Fertilization Method
Experiments were conducted during the rainy season from April to July 2013. Rice cultivar was “OM6976” and sowed directly in the flooded field on 12 April 2013. Fertilization was conducted as shown in Table 9. Schedules and rates of each chemical fertilizer application were based on on-site conventional cultivation. First and second additional fertilizations were conducted when rice was in the tillering stage and the third additional fertilization was done just before the booting stage. Fertilization dates and nitrogen application rates for the experimental plot were planned the same as the control, but the first additional fertilization on 25 April 2013 was postponed because the rice plants were too small. Therefore, application for the first additional fertilization was distributed with the second and the third additional fertilizations.
農研機構研究報告 農村工学研究部門 第 1 号 (平成 29 年 3 月) ORITATE Fumiko:Use of Digested Slurry from Livestock Manure in Paddy Fields and its Environmental Effect in Southeast Asia158 159
ブック 1.indb 158 2017/03/22 10:05:39

An estimated T-N of 400 mg L-1 in the digested slurry was used to calculate the application rate of nitrogen for the experimental plot. The actual nitrogen application rates were as shown in Table 9 based on the nitrogen concentrations in digested slurry shown in Table 7.
For both the second and the third additional fertilizations for the experimental plot, digested slurry was applied with irrigation water from the road side of the field as shown in Fig. 13.
The second additional fertilization was conducted with a vacuum truck. A vacuum truck is ordinarily used for the collection and transportation of sludge from septic tanks of households. The truck had a capacity of 5.5 m3 of digested slurry as shown in Fig. 14 and Table 8 (b). Fig. 15 showed the application of digested slurry with the truck.
The third additional fertilization was conducted with the prototype slurry tanker used for transportation and application of digested slurry. Fig. 16 showed the application of digested slurry with the prototype slurry tanker. The reason why a vacuum truck and a proto-type slurry tanker were used in the second and third additional fertilization was to obtain the data of both types of vehicle for estimation of the cost and labor.
Harvest was conducted on 21 July for the control plot and 26 July for the experimental plot.
Fig. 11 Location of the experimental fi eld, the biogas digesters and pig farms in Thai My Village
pH EC T-Na NH4-N NO3-N PO4-P K+
S m-1 mg L-1 mg L-1 mg L-1 mg L-1 mg L-1
The second additional fertilization (10 May)
Slurry - - 472 305 - - -Canal water - - 11 2 - - -
The third additional fertilization (31 May)
Slurry applied by 1st shuttle 7.3 0.39 312 255 <0.01 28.7 192
Slurry applied by 2nd shuttle 7.0 0.33 264 243 <0.01 30.5 171
Canal water 5.7 0.01 12 N.D.b <0.01 N.D. -a Values for T-N in this table are actually for total kjeldahl nitrogen (TKN), but the values of NO3-N are negligible as shown above.b N.D. Not-Detected. (less than 0.2 mg L-1)
Table 7 Properties of digested slurry and irrigation water
0.5 2.0 km1.00
Canals and riversMain Roads
Lands for paddy field
Lands for perennial culture
Lands for perennial orchard
Residential area and lands for annual culture
Legend
Pig farmsExperimental fieldPig farms (slurry supply in this experiment)a
Route of the tractor (5.3 km)
a Location of pig farms refer to Vision Tech Inc. (2011)
Fig. 11 Location of the experimental field, the biogas digesters and pig farms in Thai My Village
農研機構研究報告 農村工学研究部門 第 1 号 (平成 29 年 3 月) ORITATE Fumiko:Use of Digested Slurry from Livestock Manure in Paddy Fields and its Environmental Effect in Southeast Asia158 159
ブック 1.indb 159 2017/03/22 10:05:47

(a) Equipment for prototype slurry tanker
Machine/Equipment
Machine model HPa Fuel
variety Application DimensionCapacity/Specifications
Initial investment cost (USD)b
Plastic tank - - - Stocking digested slurry
Overall dimension: (H) 1,270 x (W) 1,360 x (L) 2,280 (mm)
143Total capacity: 3 m3
(Available capacity: 2.7 m3)
Tractor trolley - - - Loading tankOverall dimensions: (W) 1,500 x (L) 2,800 (mm) 1,670Tire size: (Φ) 825 x (W) 160 (mm)
Motor Pump PENTAX DX100/2G 1.75 - Collection and pouring
of digested slurry
Characteristic curveQ 0 6 12 18H 9.8 8.3 6.3 3.5
Q: Quantity (m3 h-1), H: Head (m)
372
Generator HONDA HG 7500 SE 13 Gasoline Collection and pouring
of digested slurry220V, 6.0kW, Equipped with the engine of HONDA GX390 1,369
Initial investment cost for prototype slurry tanker (Total of above equipment costs) 3,554
a HP: Horsepower of machineb Data for the costs of equipment were obtained by on-site interviews of farmers and villagers.
Table 8 Equipment used for pouring digested slurry
Table 9 Fertilization design for field experiment
(b) Other equipment
Machine/Equipment
Machine model HP Fuel
variety Use application Remarks Cost (USD)
Tractor FORD 4000 55 Diesel oil
Traction of prototype slurry tanker Rental fee of a tractor for half-daya 23.85
Vacuum truck - - Diesel oil
Collection, transportation and pouring of digested slurry
Rental fee of vacuum truck for 1 dayb
Available capacity of tank of vacuum truck: 5.5 m3
71.55
Engine Pump B80NT 5.5 Gasoline Pouring irrigation water into the fieldc Equipped with a HONDA GX160 engine Owned by
farmersa Rental fee of a tractor including operation and maintenance costs, fuel cost and labor cost for 1 operator. “Half day” indicates 4 hours.b Rental fee of a vacuum truck including operation and maintenance costs, fuel cost and labor cost for 2 operators. “1 day” indicates 8 hours.c Engine pump prepared not only for the irrigation with slurry fertilization, but used for ordinary general agricultural works.
Experimental plot Control plot
Application rate for digested slurry
Application rates for N, P2O5 and K2O as digested slurry
Application rates for N, P2O5 and K2O as chemical fertilizersa
N P2O5 K2O N P2O5 K2OFertilization m3 m-2 g m-2 g m-2 g m-2 g m-2 g m-2 g m-2
The first (25 April) - 0.0 0.0 0.0 4.6 8.0 0.0The second (10 May) 1.67 x 10⁻² 7.9 1.9b 6.0c 4.0 4.0 3.0The third (31 May) 1.09 x 10⁻² 3.1 0.7 2.4 2.0 2.0 3.9
Total 2.76 x 10⁻² 11.0 2.6 8.4 10.6 14.0 6.9a Variety and rate of chemical fertilizers applied on each fertilization day were as follows;1) Urea of 10 g m-2 and phosphorus fertilizer of 50 g m-2 applied on 25 April 2013. 2) Mixed fertilizer of N: P2O5: K2O=20: 20: 15 for 20 g m-2 applied on 10 May 2013.3) Mixed fertilizer of N: P: K=20: 20: 15 of 10 g m-2 and potash fertilizer of 4 g m-2 applied on 31 May 2013. b Data of phosphate concentrations in digested slurry used for second additional fertilization could not be obtained. Therefore, rate
was calculated based on the ratio of phosphate concentrations to total nitrogen concentrations for the third additional fertilization.c Data of potassium concentrations in digested slurry used for second additional fertilization could not be obtained. Therefore, rate
was calculated based on the ratio of potassium concentrations to total nitrogen concentrations for the third additional fertilization.
農研機構研究報告 農村工学研究部門 第 1 号 (平成 29 年 3 月) ORITATE Fumiko:Use of Digested Slurry from Livestock Manure in Paddy Fields and its Environmental Effect in Southeast Asia160 161
ブック 1.indb 160 2017/03/22 10:05:47
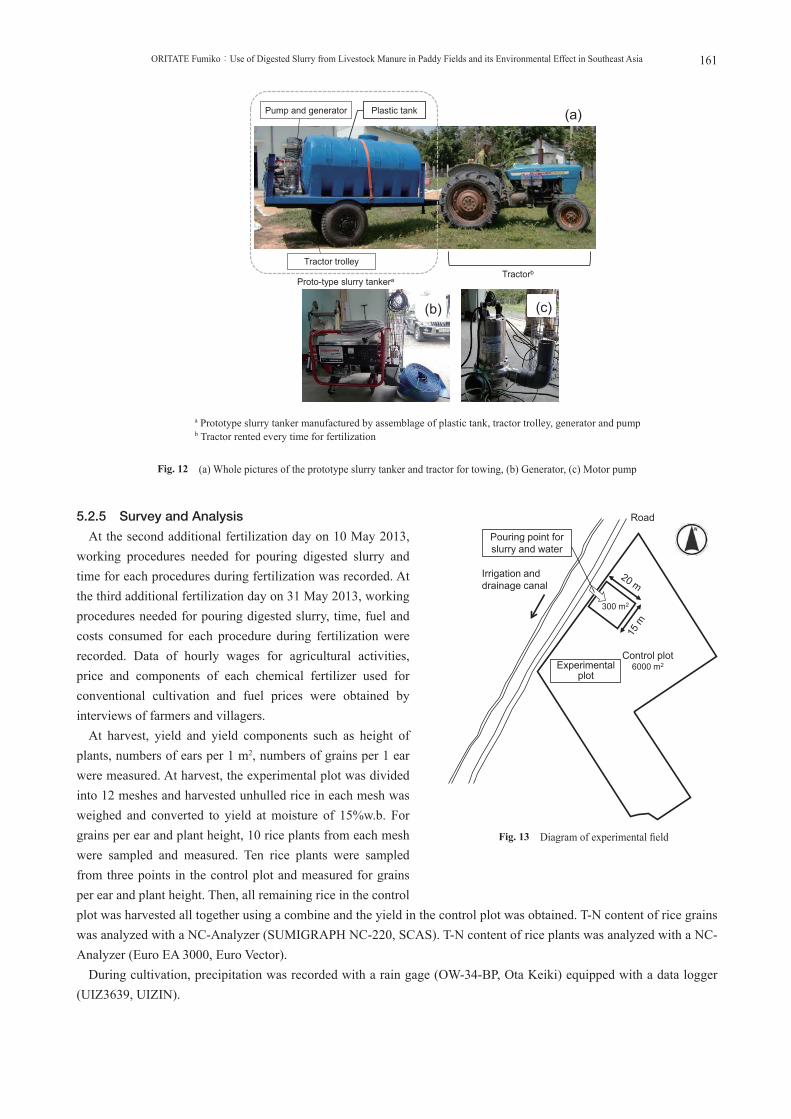
5.2.5 Survey and Analysis
At the second additional fertilization day on 10 May 2013, working procedures needed for pouring digested slurry and time for each procedures during fertilization was recorded. At the third additional fertilization day on 31 May 2013, working procedures needed for pouring digested slurry, time, fuel and costs consumed for each procedure during fertilization were recorded. Data of hourly wages for agricultural activities, price and components of each chemical fertilizer used for conventional cultivation and fuel prices were obtained by interviews of farmers and villagers.
At harvest, yield and yield components such as height of plants, numbers of ears per 1 m2, numbers of grains per 1 ear were measured. At harvest, the experimental plot was divided into 12 meshes and harvested unhulled rice in each mesh was weighed and converted to yield at moisture of 15%w.b. For grains per ear and plant height, 10 rice plants from each mesh were sampled and measured. Ten rice plants were sampled from three points in the control plot and measured for grains per ear and plant height. Then, all remaining rice in the control plot was harvested all together using a combine and the yield in the control plot was obtained. T-N content of rice grains was analyzed with a NC-Analyzer (SUMIGRAPH NC-220, SCAS). T-N content of rice plants was analyzed with a NC-Analyzer (Euro EA 3000, Euro Vector).
During cultivation, precipitation was recorded with a rain gage (OW-34-BP, Ota Keiki) equipped with a data logger (UIZ3639, UIZIN).
Fig. 12 (a) Whole pictures of the prototype slurry tanker and tractor for towing, (b) Generator, (c) Motor pump
a Prototype slurry tanker manufactured by assemblage of plastic tank, tractor trolley, generator and pumpb Tractor rented every time for fertilization
Plastic tankPump and generator
Tractor trolley
Proto-type slurry tankeraTractorb
(a)
(b) (c)
Fig. 13 Diagram of experimental fi eld
Irrigation and drainage canal
300 m2
Control plot 6000 m2
Road
Experimentalplot
Pouring point for slurry and water
農研機構研究報告 農村工学研究部門 第 1 号 (平成 29 年 3 月) ORITATE Fumiko:Use of Digested Slurry from Livestock Manure in Paddy Fields and its Environmental Effect in Southeast Asia160 161
ブック 1.indb 161 2017/03/22 10:05:48

5.3 Results and Discussion
5.3.1 Rice Production with the Use of Digested
Slurry by Pouring Method
Yield and yield components for the experimental and control plots are shown in Table 10. Yield in the experimental plot was 485 g m-2, within the range of 300-500 g m-2 for on-site conventional cultivation (Oritate et al., 2015) and yield for Ho Chi Minh City was 392 g m-2 (General Statistics Office Vietnam, 2011). However, a yield of 299 g m-2 for the control plot was lower than the values for on-site conventional cultivation. As shown in Table 9, nitrogen was applied earlier in the control plot compared to the experimental plot. Therefore, there would be abundant nitrogen in the control plot, so, the vegetative growth stage may have lasted longer in control plot than in the experimental plot. This may result in the smaller yield in the control plot. Rice production in the experimental plot showed that digested slurry can be substituted as the chemical fertilizer for rice production.
5.3.2 Work Procedures, Fuel Consumption and La-
bor for Application of Digested Slurry
Slurry needed for the second and third additional fertilizations of the experimental plot was 5.0 m3 and 3.26 m3, respectively. Slurry was transported by 2 shuttles of the prototype slurry tanker (available capacity of 2.7 m3) for the third additional fertilization and 1 vacuum truck for the second additional fertilization (available capacity of 5.5 m3). Slurry was collected from biogas digesters of pig farms in Thai My Village. Slurry and irrigation water were applied based on previous studies (Koga et al., 2010; Mihara et al., 2011; Kamioka and Kamewada, 2011; Iwashita et al., 2008). At both additional fertilizations, digested slurry and irrigation water were poured together until the increase of 4-5 cm of water level. Water level could not be decreased to shallow ponding conditions proposed by Iwashita et al. (2008) such as a water level of 0 cm (Koga et al., 2011) or 0.3 cm (Mihara et al., 2011) just before the second additional fertilization.
Fig. 14 Photograph of vacuum truck
Fig. 15 Application of digested slurry with the vacuum truck
Fig. 16 Application of digested slurry with the prototype slurry tanker
Table 10 Yield and yield components in experimental plot and control plot
Yield Ears per 1m2 Grains per 1 ear Plant height
Nitrogen content of rice grain
Nitrogen content of rice plants
g m-2 Ears m-2 Grains ear-1 cm % %
Experimental plotAverage 485
(n=12) 232
(n=12)63
(n=120)83.3
(n=119)1.8
(n=12) 4.9
(n=12)SD. 187 107.6 24.9 10.7 0.3 0.6
Control plotAverage 299 483
(n=3)32
(n=30) 91.8
(n=30) 1.9
(n=1) 3.0
(n=3) SD. - 101.9 22.7 12.5 - 0.5
農研機構研究報告 農村工学研究部門 第 1 号 (平成 29 年 3 月) ORITATE Fumiko:Use of Digested Slurry from Livestock Manure in Paddy Fields and its Environmental Effect in Southeast Asia162 163
ブック 1.indb 162 2017/03/22 10:05:49
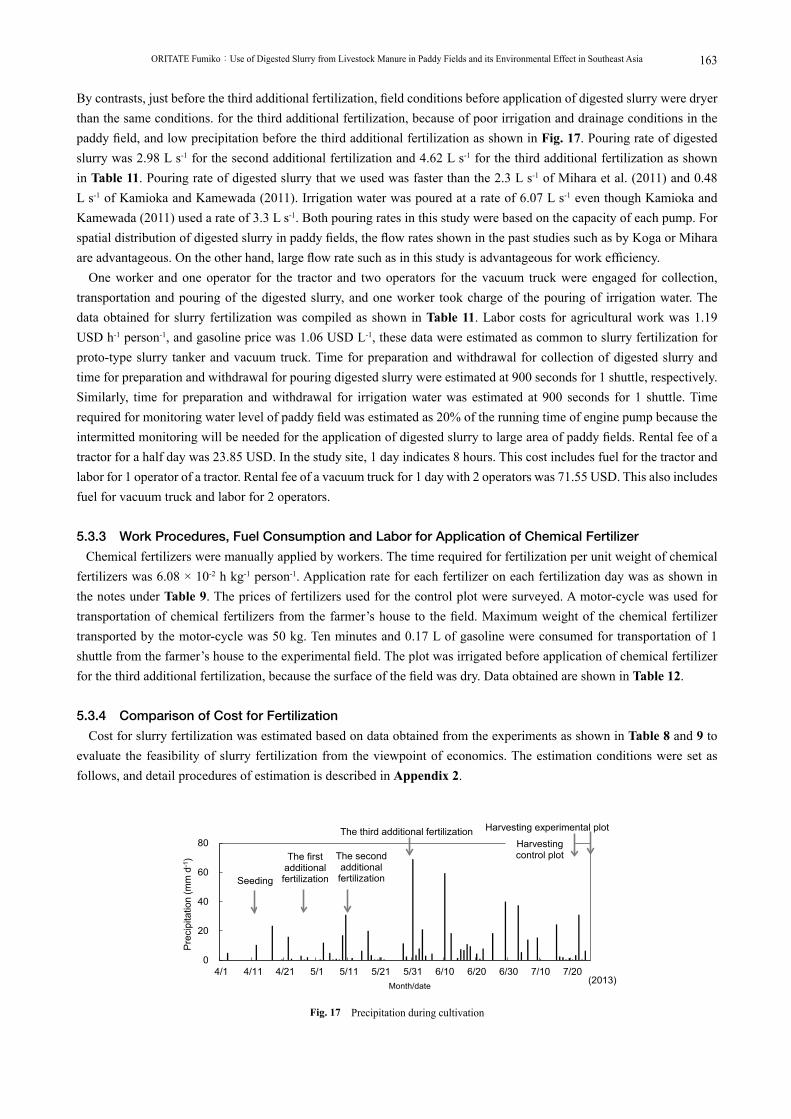
By contrasts, just before the third additional fertilization, field conditions before application of digested slurry were dryer than the same conditions. for the third additional fertilization, because of poor irrigation and drainage conditions in the paddy field, and low precipitation before the third additional fertilization as shown in Fig. 17. Pouring rate of digested slurry was 2.98 L s-1 for the second additional fertilization and 4.62 L s-1 for the third additional fertilization as shown in Table 11. Pouring rate of digested slurry that we used was faster than the 2.3 L s-1 of Mihara et al. (2011) and 0.48 L s-1 of Kamioka and Kamewada (2011). Irrigation water was poured at a rate of 6.07 L s-1 even though Kamioka and Kamewada (2011) used a rate of 3.3 L s-1. Both pouring rates in this study were based on the capacity of each pump. For spatial distribution of digested slurry in paddy fields, the flow rates shown in the past studies such as by Koga or Mihara are advantageous. On the other hand, large flow rate such as in this study is advantageous for work efficiency.
One worker and one operator for the tractor and two operators for the vacuum truck were engaged for collection, transportation and pouring of the digested slurry, and one worker took charge of the pouring of irrigation water. The data obtained for slurry fertilization was compiled as shown in Table 11. Labor costs for agricultural work was 1.19 USD h-1 person-1, and gasoline price was 1.06 USD L-1, these data were estimated as common to slurry fertilization for proto-type slurry tanker and vacuum truck. Time for preparation and withdrawal for collection of digested slurry and time for preparation and withdrawal for pouring digested slurry were estimated at 900 seconds for 1 shuttle, respectively. Similarly, time for preparation and withdrawal for irrigation water was estimated at 900 seconds for 1 shuttle. Time required for monitoring water level of paddy field was estimated as 20% of the running time of engine pump because the intermitted monitoring will be needed for the application of digested slurry to large area of paddy fields. Rental fee of a tractor for a half day was 23.85 USD. In the study site, 1 day indicates 8 hours. This cost includes fuel for the tractor and labor for 1 operator of a tractor. Rental fee of a vacuum truck for 1 day with 2 operators was 71.55 USD. This also includes fuel for vacuum truck and labor for 2 operators.
5.3.3 Work Procedures, Fuel Consumption and Labor for Application of Chemical Fertilizer
Chemical fertilizers were manually applied by workers. The time required for fertilization per unit weight of chemical fertilizers was 6.08 × 10⁻² h kg-1 person-1. Application rate for each fertilizer on each fertilization day was as shown in the notes under Table 9. The prices of fertilizers used for the control plot were surveyed. A motor-cycle was used for transportation of chemical fertilizers from the farmer’s house to the field. Maximum weight of the chemical fertilizer transported by the motor-cycle was 50 kg. Ten minutes and 0.17 L of gasoline were consumed for transportation of 1 shuttle from the farmer’s house to the experimental field. The plot was irrigated before application of chemical fertilizer for the third additional fertilization, because the surface of the field was dry. Data obtained are shown in Table 12.
5.3.4 Comparison of Cost for Fertilization
Cost for slurry fertilization was estimated based on data obtained from the experiments as shown in Table 8 and 9 to evaluate the feasibility of slurry fertilization from the viewpoint of economics. The estimation conditions were set as follows, and detail procedures of estimation is described in Appendix 2.
Fig. 17 Precipitation during cultivation
0
20
40
60
80
4/1 4/11 4/21 5/1 5/11 5/21 5/31 6/10 6/20 6/30 7/10 7/20
Prec
ipita
tion
(mm
d-1
)
Month/date
The first additional fertilization
The second additional fertilization
The third additional fertilizationHarvestingcontrol plot
Harvesting experimental plot
Seeding
(2013)
農研機構研究報告 農村工学研究部門 第 1 号 (平成 29 年 3 月) ORITATE Fumiko:Use of Digested Slurry from Livestock Manure in Paddy Fields and its Environmental Effect in Southeast Asia162 163
ブック 1.indb 163 2017/03/22 10:05:50

1) Application schedule and rates of fertilization are shown in Table 9.2) Transportation distance was 2.5 km.Although the actual distance was 5.3 km to the experimental plot, this distance was reduced to 2.5 km because both
paddy fields and pig farms are distributed in the village as shown in Fig. 11, and digested slurry would be transported from pig farms to the closest paddy fields.
3) T-N in the digested slurry was 400 or 2,000 mg L-1
T-N of approximately 400 mg L-1 was the average value obtained in our previous study (Thang et al. 2011). T-N of 2,000 mg L-1 is a proposed value. Reduction of washing water for livestock sheds into the biogas digesters is expected to reach the plan value of 2,000 mg L-1.
4) Surface water levels in the field before and after application of digested slurry and irrigation water were 0 cm and 4 cm, respectively.
(a) Data common to slurry fertilization for prototype slurry tanker and vacuum truck
No. Category Factor Data1
PriceLabor costs for agricultural work 1.19 (USD h-1 person-1)
2 Gasoline price (Average price in May 2013) 1.06 (USD L-1)
3 Collection of digested slurry Time for preparation and withdrawal for collection of digested slurry 900 (s shuttle-1)a
4 Pouring of digested slurry Time for preparation and withdrawal for pouring of digested slurry 900 (s shuttle-1)
5
Pouring of irrigation water
Flow rate for pouring of irrigation water with engine pump 6.07 (L s-1)6 Fuel consumption rate for engine pump during irrigation 8.91 x 10⁻⁴ (L s-1)7 Time for preparation and withdrawal of irrigation water 900 (s shuttle-1)
8 Time for monitoring water level of paddy fieldb 20% of the running time of an engine pump
a “Shuttle” indicates the shuttle between the field and the biogas digester for slurry fertilizationb Timing of the monitoring may be intermittent
(b) Data for slurry fertilization with prototype slurry tanker
No. Category Factor Data1 Price Rental fee of a tractor for half-day (with 1 operator) 23.85 (USD 4hours-1)
2 Transportation Driving speed of a tractor(20 minutes required for transportation of 5.3 km.) 0.265 (km min.-1)
3
Collection of digested slurry
Flow rate for collection of digested slurry with a motor pump on the prototype slurry tanker 3.08 (L s-1)
4Fuel consumption rate for generator on the prototype slurry tanker to drive the motor pump for collection and pouring of digested slurry (Value is same for pouring of digested slurry)
9.94 x 10⁻⁴ (L s-1)
5 Pouring of digested slurry Flow rate for pouring digested slurry with motor pump on the prototype slurry tanker 4.62 (L s-1)
(c) Data for slurry fertilization with a vacuum truck
No. Category Factor Data1 Price Rental fee of a vacuum truck for 1day (with 2 operators) 71.55 (USD 8hours-1)
2 Transportation Driving speed of a vacuum truck(Tractor speed was used) 0.265 (km min.-1)
3 Collection of digested slurry Flow rate for collection of digested slurry with vacuum truck 4.17 (L s-1)4 Pouring of digested slurry Flow rate for pouring digested slurry with vacuum truck 2.98 (L s-1)
Table 11 Data obtained for slurry fertilization
農研機構研究報告 農村工学研究部門 第 1 号 (平成 29 年 3 月) ORITATE Fumiko:Use of Digested Slurry from Livestock Manure in Paddy Fields and its Environmental Effect in Southeast Asia164 165
ブック 1.indb 164 2017/03/22 10:05:50

No. Category Factor Data1
Price
Labor costs for agricultural work 1.19 (USD h-1person-1)a
2 Gasoline price (Average price in May 2013) 1.06 (USD L-1)a
3 Mixed fertilizer of NPK 0.72 (USD kg-1)4 Urea 0.48 (USD kg-1)5 Phosphorus fertilizer 0.14 (USD kg-1)6 Potash fertilizer 0.50 (USD kg-1)
7
Transportation
Time for transportation between the field and farmer’s house with a motor-cycle
10 (minutes)
8 Fuel consumption rate of a motor-cycle 1.7 x 10⁻² (L min.-1)
9Maximum weight of chemical fertilizer transported with a motor-cycle
50 (kg shuttle-1)
10 ApplicationTime for fertilization per weight of chemical fertilizer and per one workers
6.08 x 10⁻² (h kg-1 person-1)
11
Pouring of irrigation water
in the field
Flow rate for pouring irrigation water with the engine pump 6.07 (L s-1)a
12 Fuel consumption rate for engine pump during irrigation 8.91 x 10⁻⁴ (L s-1)a
13 Time for preparation and withdrawal for pouring of irrigation water 900 (s shuttle-1)a
14 Time for monitoring of water level of paddy fieldb 20% of the running time of the engine pump
a Data is same as for slurry fertilization.b Timing of the monitoring may be intermittent
These results show that an increase in nitrogen concentrations of digested slurry by a reduction in the entry of washing water from livestock sheds into the biogas digesters make slurry fertilization feasible.
Surface water levels before and after slurry fertilization were set at 0 cm and 4 cm for the third additional fertilization even though the experiments were conducted during the rainy season. Surface of the field at the third additional fertilization was dry. Therefore, surface water in the field can be assumed to be almost as dry as the third additional fertilization.
The estimation is summarized in Fig. 18. Costs for fertilization by conventional cultivation with chemical fertilizer was
Table 12 Data obtained for fertilization in conventional cultivation with chemical fertilizer
Fig. 18 Cost comparisons for fertilization
a “Prototype 400 mg L-1” indicates slurry fertilization with the prototype slurry tanker at a nitrogen concentration of 400 mg L-1
b “Prototype 2,000 mg L-1” indicates slurry fertilization with the prototype slurry tanker at a nitrogen concentration of 2,000 mg L-1
c “Vacuum 400 mg L-1” indicates the slurry fertilization with the vacuum truck at a nitrogen concentration of 400 mg L-1
d “Vacuum 2,000 mg L-1” indicates slurry fertilization with the vacuum truck at a nitrogen concentration of 2,000 mg L-1
.
5.2 Conclusions
–
0.00
0.05
0.10
0.15
Chemicalfertilizer
Proto-type400mg L-1
Proto-type2,000mg L-1
Vacuum400mg L-1
Vacuum2,000mg L-1
Cos
t (U
SD m
-2)
Rental fee Cost for chemical Depreciation costMaintenance and repair Cost for transportation Cost for irrigationCost for collection Cost for application
a b c d
Depreciation cost of prototype slurry tankerCost for irrigation
Cost for chemical fertilizer
Cost for transportationCost for application of slurry / chemical fertilizer
Rental fee of tractor / vacuum truckMaintenance and repair cost of prototype slurry tankerCost for collection of slurry
Prototypea
400 mg L-1Prototypeb
2,000 mg L-1Vacuumc
400 mg L-1Vacuumd
2,000 mg L-1
a “Prototype 400 mg L-1” indicates slurry fertilization with the prototype slurry tanker at a nitrogen concentration of 400 mg L-
1 b “Prototype 2,000 mg L-1” indicates slurry fertilization with the prototype slurry tanker at a nitrogen concentration of 2,000
mg L-1 c “Vacuum 400 mg L-1” indicates the slurry fertilization with the vacuum truck at a nitrogen concentration of 400 mg L-1 d “Vacuum 2,000 mg L-1” indicates slurry fertilization with the vacuum truck at a nitrogen concentration of 2,000 mg L-1
Fig. 18 Cost comparisons for fertilization
農研機構研究報告 農村工学研究部門 第 1 号 (平成 29 年 3 月) ORITATE Fumiko:Use of Digested Slurry from Livestock Manure in Paddy Fields and its Environmental Effect in Southeast Asia164 165
ブック 1.indb 165 2017/03/22 10:05:50

estimated as 0.06 USD m-2. However, slurry fertilization with the prototype slurry tanker cost 0.13 USD m-2 and slurry fertilization with a vacuum truck cost 0.10 USD m-2 under the current situation of T-N of 400 mg L-1 in the digested slurry. The increase in T-N in the digested slurry from 400 to 2,000 mg L-1 drastically reduced the costs for slurry fertilization. Costs for slurry fertilization with both the vacuum truck and the prototype slurry tanker were lower than the costs for chemical fertilizers. Costs for slurry fertilization with a vacuum truck were lower than the costs with the prototype slurry tanker, because the vacuum truck can transport larger volumes of digested slurry at one time. However, the use of prototype slurry tankers to transport digested slurry can be economical because vacuum trucks are rarely available in rural areas of Vietnam.
5.4 Conclusions
In this study, digested slurry was applied by the pouring method as additional fertilizer to evaluate the feasibility of the use of digested slurry in paddy fields of Southern Vietnam. Data-related costs and labor for application of digested slurry and rice production by this method were obtained and compared with applications of chemical fertilizers.
Rice production with the use of digested slurry was 485 g m-2, which is within the range of on-site conventional cultivation with chemical fertilizers. Therefore, it was shown that digested slurry can be substituted for chemical fertilizers for rice production.
T-N concentrations from 400 to 2,000 mg L-1 in the digested slurry showed that the cost for slurry fertilization can be reduced to less than the cost for chemical fertilizers.
A reduction in washing water can produce nitrogen concentrations of 2,000 mg L-1 in the digested slurry. For this, large volume of washing water after flashing out the pig manure should be separated from influent to a biogas digester. The separated washing water could be treated by natural purification such as by soil and plants.
Experiments and estimations in this study clarify the feasibility of slurry fertilization in Southern Vietnam.
6. DISCUSSIONS
6.1 Installation and Evaluation of the System to use Digested Slurry from Biogas Digesters
Based on the feasibility of use of digested slurry in paddy fields in Southern Vietnam by evaluation from the view point of impact on rice plants and surrounding environment, and the economy as clarified in Chapters 3-5, a scenario to increase biogas digesters in the village for treatment of currently untreated livestock excreta and to use slurry from the biogas digester at agricultural fields as a fertilizer was proposed and designed as the “Scenario 1”. The details of the scenario are as follows:1) All unused pig and milk cow excreta were considered as feedstock for biogas digesters. By increasing the number of
biogas digesters, excreta from 10,288 pigs and 61 milk cows became the target. 2) Water content of digested slurry was set to one fifth of the water content of digested slurry in “present conditions” based
on consideration of transportation cost of slurry in Chapter 5.3) Digested slurry produced from biogas digesters was used on non-paddy fields at the same application rate as “present
conditions”, and all the rest used at paddy fields as fertilizer. 4) Total nitrogen in the digested slurry was considered as replacement for chemical nitrogen fertilizer based on the results
of rice cultivation tests using digested slurry at the site. Based on the above assumed scenario, material flow in a village was calculated as shown in Fig. 19. Highlighted results
are arranged in Tables 13, 14 and 15.Effluent nitrogen load decreased to 79.7 t y-1 from 131.6 t y-1, equivalent to a 39% reduction. The application rate of
nitrogen chemical fertilizer for rice cultivation decreased to 2.5 t y-1 from 54.4 t y-1 as a result of the application of digested slurry. Percolation and leaching were not changed because the former researches in Japan (Kamioka and Kamewada, 2011; Sunaga et al., 2009; Chen et al., 2013) indicated that the application of digested slurry did not significantly influence on it as mentioned in Chapter 2. Biogas generation rate increased from 52,125 Nm3 y-1 to 326,822 Nm3 y-1. Nitrogen loss from the paddy field slightly increased through ammonia volatilization caused by application of digested slurry to the surface of the paddy field as mentioned in Appendix 1-1, No.47. Therefore, it is necessary to consider a method of
農研機構研究報告 農村工学研究部門 第 1 号 (平成 29 年 3 月) ORITATE Fumiko:Use of Digested Slurry from Livestock Manure in Paddy Fields and its Environmental Effect in Southeast Asia166 167
ブック 1.indb 166 2017/03/22 10:05:50

Fig. 19 “Scenario 1” based on the scenario for increasing biogas digesters and using the slurry from them in paddy fi elds
Agricultural field
Water bodies in the lower reaches
Compo-sting
facility
NH3, N2, CH4, CO2 emissionW; 5,308 N; 18.9 C; 1,527
Water bodies in the upper reaches
FoodW; 6,341C; 2,218N; 53.4
Feed, Bedding materialW; 595C; 192N; 4.2
Feces and urineW; 13,331C; 438N; 52.7
Irrigation WaterW; 2,213,285C; 9N; 2.9
Surface drainageW; 1,591,587C; 13N; 4.1
Paddy fields
Feces and urine for compost outsideW; 13,683C; 266N; 20.7
Food W;1,551C; 560N; 15.8
PhotosynthesisNitrogen fixationW; 6,233 C; 1,700 N; 9.7
PrecipitationW; 4,094,797C; 8N; 4.5
PrecipitationW; 7,922,378C; 15 N; 8.7
Chemical fertilizer,W; 21 C; 0 N; 2.5Rice husk
W; 434C; 128N; 1.2
Atomos-phere
Atomos-phere
Rice straw, Rice bran
BiogasW; 397 C; 175
N; 0
Downstream
Feed(Rice straw)W; 405C; 127N; 2.3
Percolation, LeachingW; 1,098,880C; 0N; 12.1
Rice straw, Rice husk, Rice branW; 1,434C; 447N; 7.6
Feces and urineW; 5,389 C; 17 N; 12.7
FecesW; 8,458C; 236 N; 10.5
Evapotranspiration W; 3,642,624
Chemical fertilizerW; 1,476 C; 0 N; 118.4
Gas (involvingH2O)W; 4,771 C; 146 N; 2.5 Compost
W; 4,121C; 219N; 9.3
CompostW; 796 C; 695 N; 40.9
Percolation, LeachingW; 2,377,969C; 0N; 50.8
WaterW 13,331
PhotosynthesisNitrogen fixationW; 8,132 C; 2,218 N; 44
Evapotranspiration W; 5,545,665
Non-paddyfields
NH3, N2, CO2 emissionW; 3,867 N; 7.6C; 1,053
SlurryW; 1,255C; 4N; 0.8
By-product
Live-stock
SlurryW; 25,010 C; 258 N; 51.9
Biogasdigester
W ; Raw weightC ; Carbon contentN ; Nitrogen contentUnit (t・y-1)
Livestock excreta
Water input to the agricultural field
Water output from the agricultural field
Organic fertilizer
Agricultural product
Agricultural by-product
Gas
Intake from the air
Shipment to the outside system
Table 13 Changes in nitrogen load to lower water bodies from each source
Table 14 Changes in chemical fertilizer use rate in paddy fi elds
Source of nitrogen loadPresent Scenario 1Nitrogen load (t year-1)
Livestock excreta 57.0 12.7Leaching from non-paddy 50.8 50.8Leaching from paddy fields 12.1 12.1Surface drainage from paddy 4.1 4.1Digested slurry 7.6 0.0Total 131.6 79.7
Present Scenario 1Weight Nitrogen Weight Nitrogen
t year-1 t year-1
457 54.4 21 2.5
農研機構研究報告 農村工学研究部門 第 1 号 (平成 29 年 3 月) ORITATE Fumiko:Use of Digested Slurry from Livestock Manure in Paddy Fields and its Environmental Effect in Southeast Asia166 167
ブック 1.indb 167 2017/03/22 10:05:52

application for digested slurry that can minimize the ammonia volatilization rate in the future.Several reports indicate the annual reductions of GHG emission by adoption of household biogas digesters and indicate
the annual reduction rate per one unit of biogas digester (UNFCCC, 2015). Among them, the reduction rate by adoption of concrete dome-type biogas digesters in rural areas of Vietnam is 2.7054 t-CO2e y
-1 *1 per one unit of biogas digester (assuming that operation rate of biogas digesters of 100%) (UNFCCC, 2012). This rate is derived from the difference in GHG emissions between using coal, LPG and kerosene as cooking fuel and substitution with biogas. Increase of biogas digesters of approximately 586 units from 111 at present to 697 in “Scenario 1” can be estimated. Here, number of the units of biogas digesters are estimated based on popular patterns in Thai My Village, that is, to operate one unit of biogas digester, 15 pigs or 5 milk cows are needed. Therefore, approximately 1,600 t-CO2 y
-1 can be reduced in the whole Thai My village from “present conditions” to “Scenario 1”.
6.2 Advanced Regional Biomass Use System with Bio-ethanol Production from Rice Straw
Assuming more improvement of regional biomass use in the future, an advanced scenario can be proposed and designed as “Scenario 2”. In this scenario, a new biomass use system, namely, bio-ethanol production from rice-straw is added to “Scenario 1”. In “Scenario 2”, unused rice straw of 1,618 t y-1 which is harvested and left in the field after rice cultivation is focused on as the feedstock for bio-ethanol. According to the results of experimental production of bio-ethanol from rice straw at a pilot plant on the site, 420 kL year-1 of bio-ethanol can be produced from 6,000 t y-1 of rice straw with a moisture of 60%w.b. (Mochidzuki, 2013). Therefore, the conversion unit for bio-ethanol from rice straw can be calculated as 175 L (t-dry rice straw)-1. Under this scenario, the material flow in a village was calculated as shown in Fig. 20. This revealed that approximately 240 kL year-1 (≓190 t y-1) of bio-ethanol can be produced as regional energy from unused rice straw. Bio-ethanol could reduce GHG emissions from fossil fuels substituted with bio-ethanol. The calorific value of bio-ethanol from rice straw in “Scenario 2” is estimated at approximately 5.21 TJ y-1 according to calorific value of bio-ethanol of 27.40 TJ Gg-1 (IPCC, 2006a) and its specific gravity of 0.7893 kg L-1 (Oki et al., 1994), and by substituting this bio-ethanol for fossil fuel of which GHG emission factor is 69,300 kg-CO2 TJ-1 (IPCC, 2006b), 0.36 Gg-CO2 y
-1 can be reduced within this village.
6.3 Prospect for Diffusion of Regional Biomass Use System to Southeast Asia
This section further evaluated the prospects of the diffusion of the regional biomass use system mentioned above to Southeast Asia. The first scenario considers the use and diffusion of biogas digesters, assuming that manure of all pigs and milk cows is used as feedstock for biogas digesters, and digested slurry is used as fertilizer in agricultural fields. The total numbers of pigs and milk cow throughout Southeast Asia are approximately 72.2 million in 2013 (FAOSTAT, 2015b) and 1.66 million (refer to Appendix 3). The total number of biogas digester units throughout Southeast Asia can be estimated at approximately 5.1 million units calculated as for Thai My village. Therefore, the reduction rate of GHG emission throughout Southeast Asia can be estimated at approximately 14 Mt-CO2 y
-1 *2. This is equal to approximately 3% of the amount of GHG emissions from agricultural sectors in Southeast Asia.
In the above situation, approximately 0.39 Mt y-1 of nitrogen is contained in manure for feedstock for biogas digesters. Therefore, this amount of nitrogen load of digested slurry can be removed from water bodies by using this digested slurry from biogas digesters in agricultural fields as fertilizer. Total renewable water resources in Southeast Asia is 6,396×109 m3y-1 in 2014 (AQUASTAT, 2015), so the reduction of nitrogen load corresponds to a decrease of approximately 0.06 mgN L-1 in all water discharged in Southeast Asia.
The second scenario considers the production and use of bio-ethanol from unused rice straw assuming that two-thirds of harvested rice straw generated in paddy fields is used for feedstock of bio-ethanol as in “Scenario 2” throughout Southeast Asia. Yield in paddy of Southeast Asia was 4.19 t ha-1 in 2013 (FAOSTAT, 2015c), and the volume of rice straw that can be used for bio-ethanol production is estimated at 0.16 Gt y-1 based on the same calculation as for Thai My Village. In this scenario, approximately 23.7 G L y-1 of bio-ethanol can be produced and 350 Mt-CO2 y
-1 can be reduced by substituting
*1 = 2.7054 t-CO2 y-1 in this case
*2 = 14 Mt-CO2e y-1 in this case
農研機構研究報告 農村工学研究部門 第 1 号 (平成 29 年 3 月) ORITATE Fumiko:Use of Digested Slurry from Livestock Manure in Paddy Fields and its Environmental Effect in Southeast Asia168 169
ブック 1.indb 168 2017/03/22 10:05:52
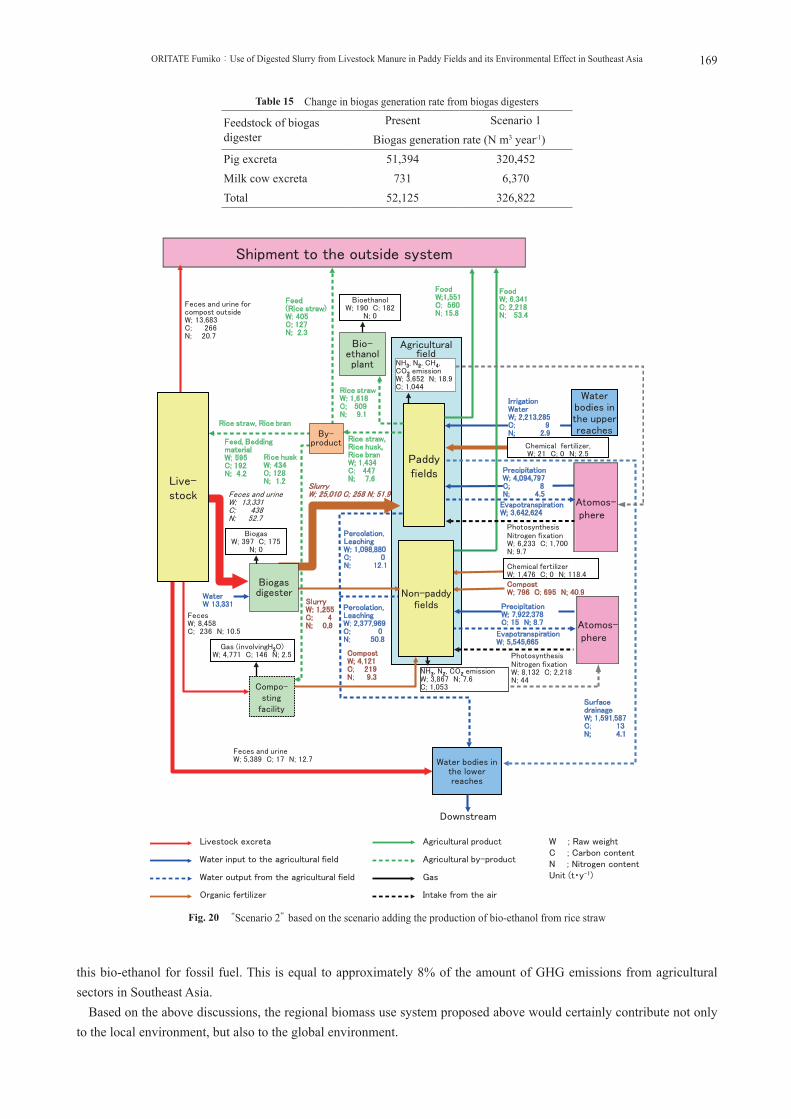
this bio-ethanol for fossil fuel. This is equal to approximately 8% of the amount of GHG emissions from agricultural sectors in Southeast Asia.
Based on the above discussions, the regional biomass use system proposed above would certainly contribute not only to the local environment, but also to the global environment.
Fig. 20 “Scenario 2” based on the scenario adding the production of bio-ethanol from rice straw
Table 15 Change in biogas generation rate from biogas digesters
Feedstock of biogas digester
Present Scenario 1Biogas generation rate (N m3 year-1)
Pig excreta 51,394 320,452Milk cow excreta 731 6,370Total 52,125 326,822
W ; Raw weightC ; Carbon contentN ; Nitrogen contentUnit (t・y-1)
Livestock excreta
Water input to the agricultural field
Water output from the agricultural field
Organic fertilizer
Agricultural product
Agricultural by-product
Gas
Intake from the air
Agricultural field
Water bodies in the lower reaches
Compo-sting
facility
Shipment to the outside system
NH3, N2, CH4, CO2 emissionW; 3,652 N; 18.9 C; 1,044
Water bodies in the upper reaches
FoodW; 6,341C; 2,218N; 53.4
Feed, Bedding materialW; 595C; 192N; 4.2
Feces and urineW; 13,331C; 438N; 52.7
Irrigation WaterW; 2,213,285C; 9N; 2.9
Surface drainageW; 1,591,587C; 13N; 4.1
Paddy fields
Feces and urine for compost outsideW; 13,683C; 266N; 20.7
Food W;1,551C; 560N; 15.8
PhotosynthesisNitrogen fixationW; 6,233 C; 1,700 N; 9.7
PrecipitationW; 4,094,797C; 8N; 4.5
PrecipitationW; 7,922,378C; 15 N; 8.7
Chemical fertilizer,W; 21 C; 0 N; 2.5Rice husk
W; 434C; 128N; 1.2
Atomos-phere
Atomos-phere
Rice straw, Rice bran
BiogasW; 397 C; 175
N; 0
Downstream
Feed(Rice straw)W; 405C; 127N; 2.3
Percolation, LeachingW; 1,098,880C; 0N; 12.1
Rice straw, Rice husk, Rice branW; 1,434C; 447N; 7.6
Feces and urineW; 5,389 C; 17 N; 12.7
FecesW; 8,458C; 236 N; 10.5
Evapotranspiration W; 3,642,624
Chemical fertilizerW; 1,476 C; 0 N; 118.4
Gas (involvingH2O)W; 4,771 C; 146 N; 2.5 Compost
W; 4,121C; 219N; 9.3
CompostW; 796 C; 695 N; 40.9
Percolation, LeachingW; 2,377,969C; 0N; 50.8
WaterW 13,331
PhotosynthesisNitrogen fixationW; 8,132 C; 2,218 N; 44
Evapotranspiration W; 5,545,665
Non-paddyfields
NH3, N2, CO2 emissionW; 3,867 N; 7.6C; 1,053
SlurryW; 1,255C; 4N; 0.8
By-product
Live-stock
SlurryW; 25,010 C; 258 N; 51.9
Biogasdigester
Rice strawW; 1,618C; 509N; 9.1
Bio-ethanol plant
BioethanolW; 190 C; 182
N; 0
農研機構研究報告 農村工学研究部門 第 1 号 (平成 29 年 3 月) ORITATE Fumiko:Use of Digested Slurry from Livestock Manure in Paddy Fields and its Environmental Effect in Southeast Asia168 169
ブック 1.indb 169 2017/03/22 10:05:53

7. CONCLUSION
In this study, feasibility of use of digested slurry from biogas digesters in paddy fields in Southern Vietnam was clarified in terms of fertilizer effects on rice, environmental impacts and economical aspect. Following is the summarization of the results obtained. In addition, effects of regional biomass use system to Southeast Asia were forecasted.
In Chapter 3, regional diagnosis of a representative suburban village in Southern Vietnam where rice cultivation and livestock farming are popular was conducted to clarify the present conditions of use of regional biomass. Literature reviews, interviews at the site and field surveys were conducted to collect data for the present regional diagnosis. The analysis of the material flow diagram clarified that untreated livestock excreta and untreated digested slurry occupied 49% in total nitrogen load to regional water bodies, and may cause water pollution, and that of some by-products from rice cultivation, especially, approximately 67% of harvested rice straw is not effectively used even though they may be sources of energy. As the most effective option for this situation, the use of currently untreated livestock excreta as the feedstock for biogas digesters followed by the use of digested slurry in paddy fields in terms of environmental conservation and saving the input of chemical fertilizers to agricultural fields was proposed. Then, the necessity of investigating the feasibility from the view point of 1) effects on rice as a fertilizer and environmental impacts such as nitrogen pollution or fecal contamination of lower water bodies through surface discharge during its use, and 2) economical methods of transporting and applying it, was proposed to promote of the use of digested slurry.
In Chapter 4, to evaluate the feasibility of use of digested slurry in paddy fields of Southern Vietnam from the view point of fertilizer effects on rice, environmental impacts such as nitrogen load and fecal contamination with application of digested slurry, a field experiment on small plots in a paddy field at the site was conducted to compare it with conventional cultivation with chemical fertilizers. Nitrogen concentrations and fecal indicator microbes such as E. coli and Coliforms in surface water following fertilization, and yield and yield components were surveyed. As the results, there was no significant difference in yield and yield components between both treatments, nitrogen concentrations in surface water in plots treated with digested slurry decreased gradually but were higher than 10 mg L-1 even 1 week after fertilization, and E. coli in surface water of the plot treated with digested slurry decreased to a non-detectable level within 1 week after fertilization. This clarified that digested slurry is applicable as a fertilizer for rice, and that the prevention of nitrogen load and fecal contamination in lower water bodies is possible along with the prevention of discharge from the plot treated with slurry for a determined duration.
In Chapter 5, to evaluate the feasibility of use of digested slurry in paddy fields of Southern Vietnam from the view point of economy and labor, a field experiment to test the use of digested slurry by the pouring method was conducted at the site. A vacuum truck was used to transport and pour the digested slurry, and a prototype slurry tanker was also manufactured to transport and apply digested slurry, because vacuum trucks are rarely available in rural areas of Vietnam. To evaluate feasibility, costs and labor for application of digested slurry were examined and compared with conventional cultivation methods using chemical fertilizers. Among the results, costs for slurry fertilization with a prototype slurry tanker and a vacuum truck were estimated at 0.13 USD m-2, and 0.10 USD m-2, respectively. These costs were higher than the 0.06 USD m-2 for conventional cultivation with T-N of approximately 400 mg L-1 in the digested slurry. However, it was clarified that the cost for slurry fertilization can be lower than that in conventional cultivation when the concentration of nitrogen in the digested slurry is increased from 400 to 2,000 mg L-1. These results clarified that an increase in nitrogen concentrations in digested slurry makes slurry fertilization feasible by decreasing the amount of washing water for livestock sheds that enters into the biogas digesters.
In Chapter 6, according to the results obtained in Chapters 3-5, reduction of 39% of nitrogen load in water bodies and reduction of 1,600 t-CO2 y
-1 of GHG emissions were expected by diffusion of biogas digesters and use of digested slurry in a suburban village in Southern Vietnam. Reduction of 0.36 Gg-CO2 y
-1 of GHG emission was expected by advanced regional biomass use system with bio-ethanol production from rice straw in the village. The diffusion of biogas digesters and use of digested slurry in paddy fields in Southeast Asia would reduce approximately 0.06 mgN L-1 of nitrogen load in the water bodies and approximately 14 Mt-CO2 y
-1 of GHG emission. Diffusion of bio-ethanol production from rice straw would reduce 350 Mt-CO2 y
-1 of GHG emissions. The total reduction of 364 Mt-CO2 y-1 of GHG emission corresponds to
approximately 11% of the amount of GHG emissions from agricultural sectors.
農研機構研究報告 農村工学研究部門 第 1 号 (平成 29 年 3 月) ORITATE Fumiko:Use of Digested Slurry from Livestock Manure in Paddy Fields and its Environmental Effect in Southeast Asia170 171
ブック 1.indb 170 2017/03/22 10:05:53
Vietnam was selected as a representative Southeast Asian country in this study, and regional biomass use systems were developed based on the situation in Vietnam. However, these details differ among countries in the region. Thus, in practice, it will necessary to fine-tune the systems proposed in this study in order to apply them in each Southeast Asian country. In addition, though the systems are based on household biogas digesters, the economies of Southeast Asian Countries are growing rapidly and their livestock sectors will likely grow as well. Therefore, additional consideration of large-scale livestock farming will be necessary in the future.
ACKNOWLEDGEMENTS: The work presented in this manuscript is based on the author’s Ph.D. thesis. First of all, the author wishes to express her sincere gratitude to Dr. Shigeto KAWASHIMA, Professor of Hydrological Environment Engineering, Division of Environmental Science and Technology, Graduate School of Agriculture, Kyoto University, and Chairperson of the Examination Committee, for his keen guidance, valuable suggestions and constructive criticisms in the completion of this study.
The author also wishes to extend her sincere appreciation to the members of the Examination Committee, Professor Dr. Satoshi HOSHINO and Professor Dr. Michihisa IIDA, for their discussions and constructive suggestions in reviewing and improving this thesis.
The author is very grateful to Dr. Kimihito NAKAMURA, Associate Professor of Hydrological Environment Engineering, Division of Environmental Science and Technology, Graduate School of Agriculture, Kyoto University for his valuable advice in improving this thesis.
All of the work presented in this Ph.D. thesis was conducted under the National Institute for Rural Engineering, National Agriculture and Food Research Organization (NIRE-NARO). The author is deeply grateful to Dr. Masaru YAMAOKA, Chief Researcher of Biomass Recycling System in Renewable Resources Engineering Research Division in NIRE-NARO and Dr. Yoshito YUYAMA, Senior Program Officer of Agriculture, Forestry and Fisheries Research Council for all their support and encouragement during this study. The author wishes to thank Dr. Masato NAKAMURA, Senior Researcher of NARO for his sincere support and advice throughout this study. The author is also grateful to Dr. Natsuki SHIMIZU, Associate Professor of Kyoto University, who was a former Postdoctoral Researcher of Biomass Recycling System in NIRE-NARO, for her valuable advice. The author is particularly thankful to Dr. Takao MASUMOTO, Director of Renewable Resources Engineering Research Division for his sincere support.
This study was supported by JST-JICA SATREPS “Sustainable Integration of Local Agriculture and Biomass Industries”. The author is deeply grateful to Dr. Akiyoshi SAKODA, Professor of the Institute of Industrial Science, the University of Tokyo (IIS-UT) and the representative of this project for providing a precious study opportunity in this project and Dr. Kazuhiro MOCHIDZUKI, Project Associate Professor of IIS-UT for sincere support and advice during the project. Special thanks are due to Professor Dr. Nguyen Phuoc Dan, Dr. Dang Vu Bich Hanh and their laboratory members, Mr. Nguyen Duy Khanh, Mr. Nguyen Huu Viet, Mr. Lai Duy Phuong, Ms. Trinh Thi Bich Huyen, and Mr. Nguyen Lam Quang Thoai in the Faculty of Environment, Ho Chi Minh City University of Technology, Vietnam for their sincere cooperation and assistance in the field surveys in Vietnam. The author also expresses appreciation to Mr. Ryuji NAKAYAMA, Project Coordinator for careful support in Vietnam during the project.
The author acknowledges all the members of NIRE-NARO with special recognition to Dr. Iwao KITAGAWA, Dr. Shigeo OGAWA and Dr. Tatsuki UEDA for their helpful support and advice in this study. The author would like to thank Dr. DeMar Taylor, Professor of Tsukuba University, who was engaged for a native check by NIRE-NARO for improving the English of this thesis. The author also acknowledges Ms. Yoshiko HAGIWARA and Ms. Masako YAMAFUJI for their helpful assistance.
The author also acknowledges Dr. Eiji MATSUBARA, Technical Councilor in Japan Association for International Collaboration of Agriculture and Forestry, who was former Project Reader in Rural Development Planning Division of Japan International Research Center for Agricultural Sciences (JIRCAS); Dr. Taro IZUMI and Dr. Shinji HIROUCHI in Rural Development Planning Division of JIRCAS for their helpful advice about Vietnam for promoting this study.
Last but not the least, the author also thanks Dr. Takehide HAMA, Associate Professor of Kumamoto University, who was a senior at Kyoto University and Dr. Yoko FUJIKAWA, Associate Professor of Koyoto University Research Reactor Institute for their guidance
during the author’s time as a student.
APPENDIXES
農研機構研究報告 農村工学研究部門 第 1 号 (平成 29 年 3 月) ORITATE Fumiko:Use of Digested Slurry from Livestock Manure in Paddy Fields and its Environmental Effect in Southeast Asia170 171
ブック 1.indb 171 2017/03/22 10:05:53
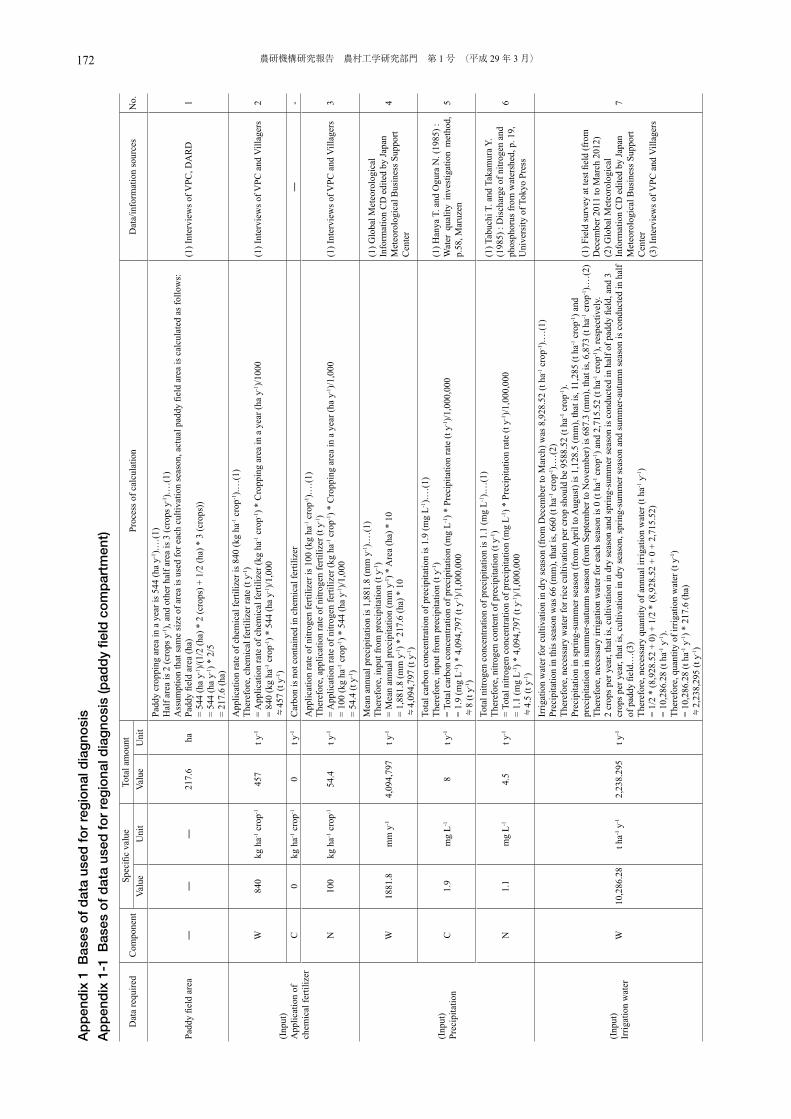
Ap
pen
dix
1 B
ases
of
dat
a us
ed f
or
reg
iona
l dia
gno
sis
Ap
pen
dix
1-1
Bas
es o
f d
ata
used
fo
r re
gio
nal d
iag
nosi
s (p
add
y fie
ld c
om
par
tmen
t)
Dat
a re
quire
dC
ompo
nent
Spec
ific
valu
eTo
tal a
mou
ntPr
oces
s of c
alcu
latio
nD
ata/
info
rmat
ion
sour
ces
No.
Valu
eU
nit
Valu
eU
nit
Padd
y fie
ld a
rea
――
―21
7.6
ha
Padd
y cr
oppi
ng a
rea
in a
yea
r is 5
44 (h
a y-1
).…(1
)H
alf a
rea
is 2
(cro
ps y
-1),
and
othe
r hal
f are
a is
3 (c
rops
y-1).…
(1)
Ass
umpt
ion
that
sam
e si
ze o
f are
a is
use
d fo
r eac
h cu
ltiva
tion
seas
on, a
ctua
l pad
dy fi
eld
area
is c
alcu
late
d as
follo
ws:
Padd
y fie
ld a
rea
(ha)
=
544
(ha
y-1)/(
1/2
(ha)
* 2
(cro
ps) +
1/2
(ha)
* 3
(cro
ps))
= 54
4 (h
a y-1
) * 2
/5=
217.
6 (h
a)
(1) I
nter
view
s of V
PC, D
AR
D1
(Inp
ut)
App
licat
ion
ofch
emic
al fe
rtiliz
er
W84
0kg
ha-1
cro
p-145
7t y
-1
App
licat
ion
rate
of c
hem
ical
ferti
lizer
is 8
40 (k
g ha
-1 c
rop-1
).…(1
)Th
eref
ore,
che
mic
al fe
rtiliz
er ra
te (t
y-1)
= A
pplic
atio
n ra
te o
f che
mic
al fe
rtiliz
er (k
g ha
-1 c
rop-1
) * C
ropp
ing
area
in a
yea
r (ha
y-1)/1
000
= 84
0 (k
g ha
-1 c
rop-1
) * 5
44 (h
a y-1
)/1,0
00≒
457
(t y-1
)
(1) I
nter
view
s of V
PC a
nd V
illag
ers
2
C0
kg h
a-1 c
rop-1
0t y
-1C
arbo
n is
not
con
tain
ed in
che
mic
al fe
rtiliz
er―
-
N10
0kg
ha-1
cro
p-154
.4t y
-1
App
licat
ion
rate
of n
itrog
en fe
rtiliz
er is
100
(kg
ha-1 c
rop-1
).…(1
)Th
eref
ore,
app
licat
ion
rate
of n
itrog
en fe
rtiliz
er (t
y-1)
= A
pplic
atio
n ra
te o
f nitr
ogen
ferti
lizer
(kg
ha-1 c
rop-1
) * C
ropp
ing
area
in a
yea
r (ha
y-1)/1
,000
= 10
0 (k
g ha
-1 c
rop-1
) * 5
44 (h
a y-1
)/1,0
00=
54.4
(t y
-1)
(1) I
nter
view
s of V
PC a
nd V
illag
ers
3
(Inp
ut)
Prec
ipita
tion
W18
81.8
mm
y-1
4,09
4,79
7t y
-1
Mea
n an
nual
pre
cipi
tatio
n is
1,8
81.8
(mm
y-1).…
(1)
Ther
efor
e, in
put f
rom
pre
cipi
tatio
n (t
y-1)
= M
ean
annu
al p
reci
pita
tion
(mm
y-1) *
Are
a (h
a) *
10
= 1,
881.
8 (m
m y
-1) *
217
.6 (h
a) *
10
≒4,
094,
797
(t y-1
)
(1) G
loba
l Met
eoro
logi
cal
Info
rmat
ion
CD
edi
ted
by Ja
pan
Met
eoro
logi
cal B
usin
ess S
uppo
rtC
ente
r
4
C1.
9m
g L-1
8t y
-1
Tota
l car
bon
conc
entra
tion
of p
reci
pita
tion
is 1
.9 (m
g L-1
).…(1
)Th
eref
ore,
inpu
t fro
m p
reci
pita
tion
(t y-1
)=
Tota
l car
bon
conc
entra
tion
of p
reci
pita
tion
(mg
L-1) *
Pre
cipi
tatio
n ra
te (t
y-1)/1
,000
,000
= 1.
9 (m
g L-1
) * 4
,094
,797
(t y
-1)/1
,000
,000
≒8
(t y-1
)
(1) H
anya
T. a
nd O
gura
N. (
1985
) :W
ater
qua
lity
inve
stig
atio
n m
etho
d,
p.58
, Mar
uzen
5
N1.
1m
g L-1
4.5
t y-1
Tota
l nitr
ogen
con
cent
ratio
n of
pre
cipi
tatio
n is
1.1
(mg
L-1).…
(1)
Ther
efor
e, n
itrog
en c
onte
nt o
f pre
cipi
tatio
n (t
y-1)
= To
tal n
itrog
en c
once
ntra
tion
of p
reci
pita
tion
(mg
L-1) *
Pre
cipi
tatio
n ra
te (t
y-1)/1
,000
,000
= 1.
1 (m
g L-1
) * 4
,094
,797
(t y
-1)/1
,000
,000
≒4.
5 (t
y-1)
(1) T
abuc
hi T
. and
Tak
amur
a Y.
(198
5) :
Dis
char
ge o
f nitr
ogen
and
phos
phor
us fr
om w
ater
shed
, p. 1
9,U
nive
rsity
of T
okyo
Pre
ss
6
(Inp
ut)
Irrig
atio
n w
ater
W10
,286
.28
t ha-1
y-1
2,23
8.29
5t y
-1
Irrig
atio
n w
ater
for c
ultiv
atio
n in
dry
seas
on (f
rom
Dec
embe
r to
Mar
ch) w
as 8
,928
.52
(t ha
-1 c
rop-1
).…(1
)Pr
ecip
itatio
n in
this
seas
on w
as 6
6 (m
m),
that
is, 6
60 (t
ha-1
cro
p-1).…
(2)
Ther
efor
e, n
eces
sary
wat
er fo
r ric
e cu
ltiva
tion
per c
rop
shou
ld b
e 95
88.5
2 (t
ha-1 c
rop-1
).Pr
ecip
itatio
n in
sprin
g-su
mm
er se
ason
(fro
m A
pril
to A
ugus
t) is
1,1
28.5
(mm
), th
at is
, 11,
285
(t ha
-1 c
rop-1
) and
prec
ipita
tion
in su
mm
er-a
utum
n se
ason
(fro
m S
epte
mbe
r to
Nov
embe
r) is
687
.3 (m
m),
that
is, 6
,873
(t h
a-1 c
rop-1
).…(2
)Th
eref
ore,
nec
essa
ry ir
rigat
ion
wat
er fo
r eac
h se
ason
is 0
(t h
a-1 c
rop-1
) and
2,7
15.5
2 (t
ha-1 c
rop-1
), re
spec
tivel
y.2
crop
s per
yea
r, th
at is
, cul
tivat
ion
in d
ry se
ason
and
sprin
g-su
mm
er se
ason
is c
ondu
cted
in h
alf o
f pad
dy fi
eld,
and
3cr
ops p
er y
ear,
that
is, c
ultiv
atio
n in
dry
seas
on, s
prin
g-su
mm
er se
ason
and
sum
mer
-aut
umn
seas
on is
con
duct
ed in
hal
f of
pad
dy fi
eld.
…(3
)Th
eref
ore,
nec
essa
ry q
uant
ity o
f ann
ual i
rrig
atio
n w
ater
(t h
a-1 y
-1)
= 1/
2 *
(8,9
28.5
2 +
0) +
1/2
* (8
,928
.52
+ 0
+ 2,
715.
52)
= 10
,286
.28
(t ha
-1 y
-1).
Ther
efor
e, q
uant
ity o
f irr
igat
ion
wat
er (t
y-1)
= 10
,286
.28
(t ha
-1 y
-1) *
217
.6 (h
a)≒
2,23
8,29
5 (t
y-1)
(1) F
ield
surv
ey a
t tes
t fiel
d (f
rom
Dec
embe
r 201
1 to
Mar
ch 2
012)
(2) G
loba
l Met
eoro
logi
cal
Info
rmat
ion
CD
edi
ted
by Ja
pan
Met
eoro
logi
cal B
usin
ess S
uppo
rtC
ente
r(3
) Int
ervi
ews o
f VPC
and
Vill
ager
s
7
農研機構研究報告 農村工学研究部門 第 1 号 (平成 29 年 3 月) ORITATE Fumiko:Use of Digested Slurry from Livestock Manure in Paddy Fields and its Environmental Effect in Southeast Asia172 173
ブック 1.indb 172 2017/03/22 10:05:53
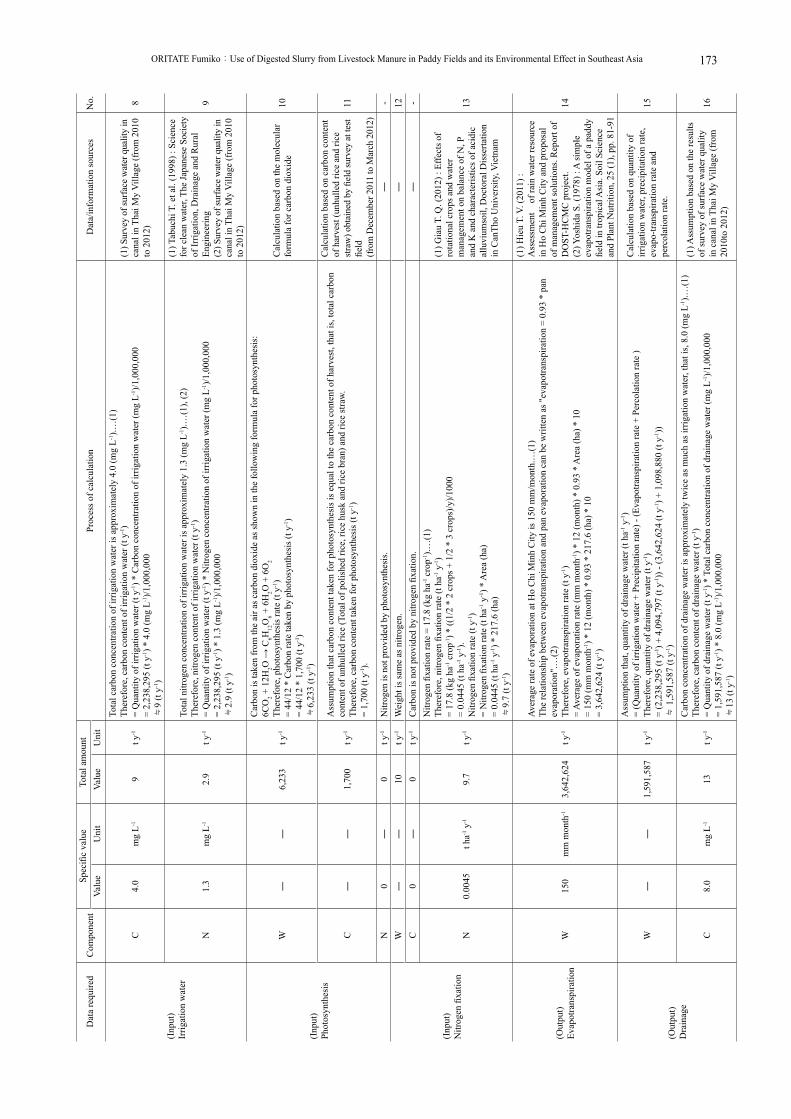
Dat
a re
quire
dC
ompo
nent
Spec
ific
valu
eTo
tal a
mou
ntPr
oces
s of c
alcu
latio
nD
ata/
info
rmat
ion
sour
ces
No.
Valu
eU
nit
Valu
eU
nit
(Inp
ut)
Irrig
atio
n w
ater
C4.
0m
g L-1
9t y
-1
Tota
l car
bon
conc
entra
tion
of ir
rigat
ion
wat
er is
app
roxi
mat
ely
4.0
(mg
L-1).…
(1)
Ther
efor
e, c
arbo
n co
nten
t of i
rrig
atio
n w
ater
(t y
-1)
= Q
uant
ity o
f irr
igat
ion
wat
er (t
y-1) *
Car
bon
conc
entra
tion
of ir
rigat
ion
wat
er (m
g L-1
)/1,0
00,0
00=
2,23
8,29
5 (t
y-1) *
4.0
(mg
L-1)/1
,000
,000
≒9
(t y-1
)
(1) S
urve
y of
surfa
ce w
ater
qua
lity
inca
nal i
n Th
ai M
y V
illag
e (f
rom
201
0to
201
2)8
N1.
3m
g L-1
2.9
t y-1
Tota
l nitr
ogen
con
cent
ratio
n of
irrig
atio
n w
ater
is a
ppro
xim
atel
y 1.
3 (m
g L-1
).…(1
), (2
)Th
eref
ore,
nitr
ogen
con
tent
of i
rrig
atio
n w
ater
(t y
-1)
= Q
uant
ity o
f irr
igat
ion
wat
er (t
y-1) *
Nitr
ogen
con
cent
ratio
n of
irrig
atio
n w
ater
(mg
L-1)/1
,000
,000
= 2,
238,
295
(t y-1
) * 1
.3 (m
g L-1
)/1,0
00,0
00≒
2.9
(t y-1
)
(1) T
abuc
hi T
. et a
l. (1
998)
: Sc
ienc
efo
r cle
an w
ater
, The
Japa
nese
Soc
iety
of Ir
rigat
ion,
Dra
inag
e an
d R
ural
Engi
neer
ing
(2) S
urve
y of
surfa
ce w
ater
qua
lity
inca
nal i
n Th
ai M
y V
illag
e (f
rom
201
0to
201
2)
9
(Inp
ut)
Phot
osyn
thes
is
W―
―6,
233
t y-1
Car
bon
is ta
ken
from
the
air a
s car
bon
diox
ide
as sh
own
in th
e fo
llow
ing
form
ula
for p
hoto
synt
hesi
s:
6CO
2 + 1
2H2O
→ C
6H12
O6 +
6H
2O +
6O
2Th
eref
ore,
pho
tosy
nthe
sis r
ate
(t y-1
)=
44/1
2 *
Car
bon
rate
take
n by
pho
tosy
nthe
sis (
t y-1)
= 44
/12
* 1,
700
(t y-1
)≒
6,23
3 (t
y-1)
Cal
cula
tion
base
d on
the
mol
ecul
arfo
rmul
a fo
r car
bon
diox
ide
10
C―
―1,
700
t y-1
Ass
umpt
ion
that
car
bon
cont
ent t
aken
for p
hoto
synt
hesi
s is e
qual
to th
e ca
rbon
con
tent
of h
arve
st, t
hat i
s, to
tal c
arbo
nco
nten
t of u
nhul
led
rice
(Tot
al o
f pol
ishe
d ric
e, ri
ce h
usk
and
rice
bran
) and
rice
stra
w.Th
eref
ore,
car
bon
cont
ent t
aken
for p
hoto
synt
hesi
s (t y
-1)
= 1,
700
(t y-1
).
Cal
cula
tion
base
d on
car
bon
cont
ent
of h
arve
st (u
nhul
led
rice
and
rice
straw
) obt
aine
d by
fiel
d su
rvey
at t
est
field
(from
Dec
embe
r 201
1 to
Mar
ch 2
012)
11
N0
―0
t y-1
Nitr
ogen
is n
ot p
rovi
ded
by p
hoto
synt
hesi
s.―
-
(Inp
ut)
Nitr
ogen
fixa
tion
W―
―10
t y-1
Wei
ght i
s sam
e as
nitr
ogen
.―
12C
0―
0t y
-1C
arbo
n is
not
pro
vide
d by
nitr
ogen
fixa
tion.
―-
N0.
0045
t ha-1
y-1
9.7
t y-1
Nitr
ogen
fixa
tion
rate
= 1
7.8
(kg
ha-1 c
rop-1
).…(1
)Th
eref
ore,
nitr
ogen
fixa
tion
rate
(t h
a-1 y
-1)
= 17
.8 (k
g ha
-1 c
rop-1
) * ((
1/2
* 2
crop
s + 1
/2 *
3 c
rops
)/y)/1
000
= 0.
0445
(t h
a-1 y
-1).
Nitr
ogen
fixa
tion
rate
(t y
-1)
= N
itrog
en fi
xatio
n ra
te (t
ha-1
y-1) *
Are
a (h
a)=
0.04
45 (t
ha-1
y-1) *
217
.6 (h
a)≒
9.7
(t y-1
)
(1) G
iau
T. Q
. (20
12) :
Effe
cts o
f ro
tatio
nal c
rops
and
wat
er
man
agem
ent o
n ba
lanc
e of
N, P
an
d K
and
cha
ract
eris
tics o
f aci
dic
allu
vium
soil,
Doc
tora
l Dis
serta
tion
in C
anTh
o U
nive
rsity
, Vie
tnam
13
(Out
put)
Evap
otra
nspi
ratio
nW
150
mm
mon
th-1
3,64
2,62
4t y
-1
Aver
age
rate
of e
vapo
ratio
n at
Ho
Chi
Min
h C
ity is
150
mm
/mon
th.…
(1)
The
rela
tions
hip
betw
een
evap
otra
nspi
ratio
n an
d pa
n ev
apor
atio
n ca
n be
writ
ten
as "e
vapo
trans
pira
tion
= 0.
93 *
pan
evap
orat
ion"
.…(2
)Th
eref
ore,
eva
potra
nspi
ratio
n ra
te (t
y-1)
= Av
erag
e of
eva
pora
tion
rate
(mm
mon
th-1) *
12
(mon
th) *
0.9
3 *
Are
a (h
a) *
10
= 15
0 (m
m m
onth
-1) *
12
(mon
th) *
0.9
3 *
217.
6 (h
a) *
10
= 3,
642,
624
(t y-1
)
(1) H
ieu
T. V
. (20
11) :
A
sses
smen
t of
rain
wat
er re
sour
ce
in H
o C
hi M
inh
City
and
pro
posa
l of
man
agem
ent s
olut
ions
. Rep
ort o
f D
OST
-HC
MC
pro
ject
.(2
) Yos
hida
S. (
1978
) : A
sim
ple
evap
otra
nspi
ratio
n m
odel
of a
pad
dy
field
in tr
opic
al A
sia.
Soi
l Sci
ence
an
d Pl
ant N
utrit
ion,
25
(1),
pp. 8
1-91
14
(Out
put)
Dra
inag
e
W―
―1,
591,
587
t y-1
Ass
umpt
ion
that
, qua
ntity
of d
rain
age
wat
er (t
ha-1
y-1)
= (Q
uant
ity o
f irr
igat
ion
wat
er +
Pre
cipi
tatio
n ra
te) -
(Eva
potra
nspi
ratio
n ra
te +
Per
cola
tion
rate
)Th
eref
ore,
qua
ntity
of d
rain
age
wat
er (t
y-1)
= (2
,238
,295
(t y
-1) +
4,0
94,7
97 (t
y-1))
- (3
,642
,624
(t y
-1) +
1,0
98,8
80 (t
y-1))
≒ 1
,591
,587
(t y
-1)
Cal
cula
tion
base
d on
qua
ntity
of
irrig
atio
n w
ater
, pre
cipi
tatio
n ra
te,
evap
o-tra
nspi
ratio
n ra
te a
nd
perc
olat
ion
rate
.
15
C8.
0m
g L-1
13t y
-1
Car
bon
conc
entra
tion
of d
rain
age
wat
er is
app
roxi
mat
ely
twic
e as
muc
h as
irrig
atio
n w
ater
, tha
t is,
8.0
(mg
L-1).…
(1)
Ther
efor
e, c
arbo
n co
nten
t of d
rain
age
wat
er (t
y-1)
= Q
uant
ity o
f dra
inag
e w
ater
(t y
-1) *
Tot
al c
arbo
n co
ncen
tratio
n of
dra
inag
e w
ater
(mg
L-1)/1
,000
,000
= 1,
591,
587
(t y-1
) * 8
.0 (m
g L-1
)/1,0
00,0
00≒
13 (t
y-1)
(1) A
ssum
ptio
n ba
sed
on th
e re
sults
of
surv
ey o
f sur
face
wat
er q
ualit
y in
can
al in
Tha
i My
Vill
age
(fro
m
2010
to 2
012)
16
農研機構研究報告 農村工学研究部門 第 1 号 (平成 29 年 3 月) ORITATE Fumiko:Use of Digested Slurry from Livestock Manure in Paddy Fields and its Environmental Effect in Southeast Asia172 173
ブック 1.indb 173 2017/03/22 10:05:54

Dat
a re
quire
dC
ompo
nent
Spec
ific
valu
eTo
tal a
mou
ntPr
oces
s of c
alcu
latio
nD
ata/
info
rmat
ion
sour
ces
No.
Valu
eU
nit
Valu
eU
nit
(Out
put)
Dra
inag
eN
2.6
mg
L-14.
1t y
-1
Nitr
ogen
con
cent
ratio
n of
dra
inag
e w
ater
is a
ppro
xim
atel
y tw
ice
as m
uch
as ir
rigat
ion
wat
er, t
hat i
s, 2.
6 (m
g L-1
).…(1
)Th
eref
ore,
nitr
ogen
con
tent
of d
rain
age
wat
er (t
y-1)
= Q
uant
ity o
f dra
inag
e w
ater
(t y
-1) *
Tot
al n
itrog
en c
once
ntra
tion
of d
rain
age
wat
er (m
g L-1
)/1,0
00,0
00=
1,59
1,58
7 (t
y-1) *
2.6
(mg
L-1)/1
,000
,000
≒4.
1 (t
y-1)
(1) A
ssum
ptio
n ba
sed
on th
e re
sults
of su
rvey
of s
urfa
ce w
ater
qu
ality
in c
anal
in T
hai M
y V
illag
e (f
rom
201
0 to
201
2)
17
(Out
put)
Den
itrifi
catio
n
W―
―16
t y-1
Wei
ght i
s sam
e as
nitr
ogen
.―
18C
0―
0t y
-1C
arbo
n is
not
lost
by
deni
trific
atio
n.―
-
N30
%16
.3t y
-1
Den
itrifi
catio
n ra
te is
20-
50%
of n
itrog
en fe
rtiliz
atio
n ra
te.…
(1)
Ther
efor
e, a
ssum
ptio
n th
e va
lue
is 3
0%.
Ther
efor
e, d
enitr
ifica
tion
rate
(t y
-1)
= N
itrog
en c
onte
nt o
f fer
tiliz
er (k
g ha
-1 c
rop-1
) * C
ropp
ing
area
in a
yea
r (ha
y-1) *
0.3
/1,0
00=
100
(kg
ha-1 c
rop-1
) * 5
44 (h
a y-1
) * 0
.3/1
,000
≒16
.3 (t
y-1)
(1) K
yum
a K
. (20
04) :
Pad
dy so
il sc
ienc
e. K
yoto
Uni
vers
ity P
ress
, p.
151
19
(Out
put)
Am
mon
iavo
latil
izat
ion
W―
―1
t y-1
Wei
ght i
s sam
e as
am
mon
ia v
olat
iliza
tion
rate
.―
20C
0―
0t y
-1C
arbo
n is
not
lost
by
amm
onia
vol
atili
zatio
n.―
-
N1.
7%
0.9
t y-1
Nitr
ogen
loss
by
amm
onia
vol
atili
zatio
n is
1.7
% o
f nitr
ogen
ferti
lizat
ion
rate
per
cro
p at
pad
dy fi
eld
with
the
pH ra
nge
betw
een
3.4
and
6.2.
…(1
)Th
eref
ore,
nitr
ogen
loss
by
amm
onia
vol
atili
zatio
n (t
y-1)
= N
itrog
en fe
rtiliz
atio
n ra
te (k
g ha
-1 c
rop-1
) * C
ropp
ing
area
in a
yea
r (ha
y-1) *
0.0
17/1
,000
= 10
0 (k
g ha
-1 c
rop-1
) * 5
44 (h
a y-1
) * 0
.017
/1,0
00≒
0.9
(t y-1
)
(1) W
atan
abe T
. (20
09) :
Mea
sure
men
t of
am
mon
iavo
latil
izat
ion
from
flo
oded
pad
dyfie
lds i
n V
ietn
am. S
oil
Scie
nce
and
Plan
t Nut
ritio
n, 5
5, p
p.
793-
799
21
(Out
put)
Perc
olat
ion
W20
2m
m c
rop-1
1,09
8,88
0t y
-1
1) P
erco
latio
n ra
te is
202
(mm
cro
p-1).…
(1)
Ther
efor
e, p
erco
latio
n ra
te (t
y-1)
= Pe
rcol
atio
n ra
te (m
m h
a-1 c
rop-1
) * 0
.01
* C
ropp
ing
area
in a
yea
r (ha
y-1) *
1,0
00=
202
(mm
ha-1
cro
p-1) *
0.0
1 *
544
(ha
y-1) *
1,0
00=
1,09
8,88
0 (t
y-1)
(1) T
hoai
N. L
. Q e
t al.
(201
2) :
Bal
ance
of w
ater
, nitr
ogen
and
ph
osph
orus
for r
ice
crop
at a
pad
dy
field
in S
outh
ern
Viet
nam
,Pro
ceed
ings
of
Ann
ual C
onfe
renc
e fo
rSoc
iety
of
Envi
ronm
enta
l Sci
ence
2012
, Jap
an,
pp. 1
36-1
37
22
C0
kg h
a-1 c
rop-1
0t y
-1C
arbo
n lo
ss b
y pe
rcol
atio
n is
ass
umed
to b
e 0.
―-
N11
mg
L-112
.1t y
-1
Nitr
ogen
con
cent
ratio
n of
wat
er 3
0-50
cm
from
the
grou
nd su
rfac
e in
the
expe
rimen
tal fi
eld
was
app
roxi
mat
ely
11 (m
g L-1
).…(1
)Pe
rcol
atio
n ra
te is
1,0
98,8
80 (t
y-1).
Ther
efor
e, lo
ss b
y ni
trate
leac
hing
(t y
-1)
= Pe
rcol
atio
n ra
te (t
y-1) *
Nitr
ogen
con
cent
ratio
n in
wat
er (m
g L-1
)/1,0
00,0
00=
1,09
8,88
0 (t
y-1) *
11
(mg
L-1)/1
,000
,000
≒12
.1 (t
y-1)
(1) F
ield
surv
ey a
t tes
t fiel
d (f
rom
Dec
embe
r 201
3 to
Mar
ch
2014
)23
(Out
put)
Met
hane
�gas
emis
sion
W16
0kg
ha-1
y-1
87t y
-1
1) M
etha
ne g
as e
mitt
ed d
urin
g cu
ltiva
tion
of ri
ce a
t int
erm
itten
tly fl
oode
d pa
ddy
field
is a
ppro
xim
atel
y 16
g m
-2 y
-1…
(1)
= 16
0 kg
ha-1
y-1
Met
hane
gas
em
issi
on ra
te is
160
kg
ha-1 y
-1 in
the
refe
renc
e. T
he ra
te is
con
verte
d to
160
kg
ha-1 c
rop-1
for a
pplic
atio
nrat
e to
the
obje
ctiv
e vi
llage
.Th
eref
ore,
met
hane
gas
em
issi
on ra
te (t
y-1)
= M
etha
ne g
as e
mis
sion
rate
(kg
ha-1 c
rop-1
) * C
ropp
ing
area
in a
yea
r (ha
y-1)/1
,000
= 16
0 (k
g ha
-1 c
rop-1
) * 5
44 (h
a y-1
)/1,0
00≒
87 (t
y-1)
(1) M
inis
try o
f Env
ironm
ent,
Japa
n G
reen
hous
e G
as In
vent
ory
Offi
ce o
f Ja
pan
(GIO
), C
GER
, NIE
S (2
011)
: N
atio
nal G
reen
hous
e G
as In
vent
ory
Rep
ort o
f Jap
an, p
. 6-2
5
24
C―
―65
t y-1
Car
bon
cont
ent i
n m
etha
ne g
as (t
y-1)
= M
etha
ne g
as e
mis
sion
rate
(t y
-1) *
12/
16=
87 *
12/
16≒
65 (t
y-1)
Cal
cula
tion
base
d on
the
mol
ecul
ar
form
ula
of m
etha
ne25
N0
kg h
a-10
t y-1
Nitr
ogen
is n
ot lo
st b
y m
etha
ne g
as e
mis
sion
.―
-(O
utpu
t)C
arbo
n di
oxid
eem
issi
onW
――
2,95
2t y
-1C
arbo
n di
oxid
e em
issi
on ra
te (t
y-1)
= 44
/12
* C
arbo
n lo
ss ra
te in
the
form
of c
arbo
n di
oxid
e (t
y-1)
≒2,
952
(t y-1
)
Calc
ulat
ion
base
d on
the
mol
ecul
ar�
form
ula
of c
arbo
n di
oxid
e26
農研機構研究報告 農村工学研究部門 第 1 号 (平成 29 年 3 月) ORITATE Fumiko:Use of Digested Slurry from Livestock Manure in Paddy Fields and its Environmental Effect in Southeast Asia174 175
ブック 1.indb 174 2017/03/22 10:05:54

Dat
a re
quire
dC
ompo
nent
Spec
ific
valu
eTo
tal a
mou
ntPr
oces
s of c
alcu
latio
nD
ata/
info
rmat
ion
sour
ces
No.
Valu
eU
nit
Valu
eU
nit
(Out
put)
Car
bon
diox
ide
emis
sion
C87
0t y
-180
5t y
-1
Tota
l car
bon
loss
from
pad
dy fi
eld
is 4
,000
(kgC
ha-1
y-1)…
(1).
Ther
efor
e, to
tal c
arbo
n lo
ss fr
om p
addy
fiel
d (t
y-1)
= 4,
000
(kg
ha-1 y
-1) *
217
.6 (h
a)/1
000
≒87
0 (t
y-1).
Ass
umpt
ion
that
car
bon
loss
from
the
padd
y fie
ld is
in th
e fo
rm o
f met
hane
and
car
bon
diox
ide.
Ther
efor
e, c
arbo
n lo
ss in
the
form
of c
arbo
n di
oxid
e (t
y-1)
= To
tal c
arbo
n lo
ss ra
te (t
y-1) -
Car
bon
loss
rate
in th
e fo
rm o
f met
hane
(t y
-1)
= 87
0 (t
y-1) -
65
(t y-1
)=
805
(t y-1
).
(1) S
yste
miz
atio
n Su
b-te
am, B
io-
Rec
ycle
Pro
ject
ed.
(200
6) :
Des
ign
and
Eval
uatio
n of
Bio
mas
s Use
Sy
stem
, p. 3
3
27
N0
t y-1
0t y
-1N
itrog
en is
not
lost
by
carb
on d
ioxi
de e
mis
sion
s.―
-
(Out
put)
Yie
ld o
f pol
ishe
dric
e (n
orm
al)
W0.
6161
―1,
341
t y-1
Aver
age
yiel
d of
unh
ulle
d ric
e is
4 (t
ha-1
cro
p-1) w
ith a
wat
er c
onte
nt o
f 15%
.…(1
),(2)
Gen
erat
ion
rate
of p
olis
hed
rice
(nor
mal
) to
yiel
d of
unh
ulle
d ric
e is
0.6
161
with
a w
ater
con
tent
of 1
5%.…
(1)
Ther
efor
e, th
e am
ount
of p
olis
hed
rice
(nor
mal
) with
the
wat
er c
onte
nt o
f 15%
(t y
-1)
= Y
ield
of u
nhul
led
rice
with
a w
ater
con
tent
of 1
5% (t
ha-1
cro
p-1) *
Cro
ppin
g ar
ea in
a y
ear (
ha y
-1) *
Gen
erat
ion
rate
= 4
(t ha
-1 c
rop-1
) * 5
44 (h
a y-1
) * 0
.616
1≒
1,34
1 (t
y-1)
(1) F
ield
surv
ey a
t tes
t fiel
d (f
rom
D
ecem
ber 2
011
to M
arch
201
2, fr
om
May
to A
ugus
t 201
2)(2
) Int
ervi
ews o
f VPC
and
Vill
ager
s
28
C42
.5%
484
t y-1
Car
bon
conc
entra
tion
of p
olis
hed
rice
unde
r dry
con
ditio
ns is
abo
ut 4
2.5
(%).…
(1)
Ther
efor
e, c
arbo
n co
nten
t of p
olis
hed
rice
(nor
mal
)=
Am
ount
of p
olis
hed
rice
(nor
mal
) with
a w
ater
con
tent
of 1
5% (t
y-1) *
(1-w
ater
con
tent
(%))
* C
arbo
n co
ncen
tratio
n of
pol
ishe
d ric
e un
der d
ry c
ondi
tions
(%)
= 1,
341
(t y-1
) * (1
-15/
100)
* 4
2.5/
100
≒48
4 (t
y-1)
(1) F
ield
surv
ey a
t tes
t fiel
d (f
rom
M
ay to
Aug
ust 2
012,
from
D
ecem
ber 2
013
to M
arch
201
4)29
N1.
2%
13.7
t y-1
Nitr
ogen
con
cent
ratio
n of
pol
ishe
d ric
e un
der d
ry c
ondi
tions
is 1
.2 (%
).…(1
)Th
eref
ore,
nitr
ogen
con
tent
of p
olis
hed
rice
(nor
mal
)=
Am
ount
of p
olis
hed
rice
(nor
mal
) with
the
wat
er c
onte
nt o
f 15%
(t y
-1) *
(1-w
ater
con
tent
(%))
* N
itrog
enco
ncen
tratio
n of
pol
ishe
d ric
e (n
orm
al) u
nder
dry
con
ditio
ns (%
)=
1,34
1 (t
y-1) *
(1-1
5/10
0) *
1.2
/100
≒13
.7 (t
y-1)
(1) F
ield
surv
ey a
t tes
t fiel
d (f
rom
M
ay to
Aug
ust 2
012,
Dec
embe
r 20
13 to
Mar
ch 2
014)
30
(Out
put)
Yie
ld o
f pol
ishe
dric
e (b
roke
n)
W0.
0967
―21
0t y
-1
Gen
erat
ion
rate
of p
olis
hed
rice
(bro
ken)
to y
ield
of u
nhul
led
rice
is 0
.096
7 w
ith a
wat
er c
onte
nt o
f 15%
.…(1
)Th
eref
ore,
the
amou
nt o
f pol
ishe
d ric
e (b
roke
n) w
ith a
wat
er c
onte
nt o
f 15%
(t y
-1)
= Y
ield
(t h
a-1 c
rop-1
) * C
ropp
ing
area
in a
yea
r (ha
y-1) *
Gen
erat
ion
rate
= 4
(t ha
-1 c
rop-1
) * 5
44 (h
a y-1
) * 0
.096
7≒
210
(t y-1
)
(1)
Fiel
d su
rvey
at
test
fiel
d (f
rom
D
ecem
ber 2
011
to M
arch
201
2, fr
om
May
to A
ugus
t 201
2)31
C42
.5%
76t y
-1
Car
bon
conc
entra
tion
of p
olis
hed
rice
unde
r dry
con
ditio
ns is
42.
5 (%
).…(1
)Th
eref
ore,
car
bon
cont
ent o
f pol
ishe
d ric
e (b
roke
n)=
Am
ount
of p
olis
hed
rice
(bro
ken)
with
a w
ater
con
tent
of 1
5% (t
y-1) *
(1-w
ater
con
tent
(%))
* C
arbo
n co
ncen
tratio
nof
pol
ishe
d ric
e (b
roke
n) u
nder
dry
con
ditio
ns (%
)=
210
(t y-1
) * (1
-15/
100)
* 4
2.5/
100
≒76
(t y
-1)
(1)
Fiel
d su
rvey
at
test
fiel
d (f
rom
M
ay to
Aug
ust 2
012,
from
Dec
embe
r 20
13 to
Mar
ch 2
014)
32
N1.
2%
2.1
t y-1
Nitr
ogen
con
cent
ratio
n of
pol
ishe
d ric
e un
der d
ry c
ondi
tions
is 1
.2 (%
).…(1
)Th
eref
ore,
nitr
ogen
con
tent
of p
olis
hed
rice
(bro
ken)
= A
mou
nt o
f pol
ishe
d ric
e (b
roke
n) w
ith a
wat
er c
onte
nt o
f 15%
(t y
-1) *
(1-w
ater
con
tent
(%))
* N
itrog
en c
once
ntra
tion
of p
olis
hed
rice
(bro
ken)
und
er d
ry c
ondi
tions
(%)
= 21
0 (t
y-1) *
(1-1
5/10
0) *
1.2
/100
≒2.
1 (t
y-1)
(1)
Fiel
d su
rvey
at
test
fiel
d (f
rom
M
ay to
Aug
ust 2
012,
from
Dec
embe
r 20
13 to
Mar
ch 2
014)
33
(Out
put)
Yie
ld o
f ric
e hu
skW
0.19
95―
434
t y-1
Gen
erat
ion
rate
of r
ice
husk
to y
ield
of u
nhul
led
rice
is 0
.199
5 w
ith a
wat
er c
onte
nt o
f 15%
.…(1
)Th
eref
ore,
the
amou
nt o
f ric
e hu
sk w
ith a
wat
er c
onte
nt o
f 15%
(t y
-1)
= Y
ield
(t h
a-1 c
rop-1
) * C
ropp
ing
area
in a
yea
r (ha
y-1) *
Gen
erat
ion
rate
= 4
(t ha
-1 c
rop-1
) * 5
44 (h
a y-1
) * 0
.199
5≒
434
(t y-1
)
(1)
Fiel
d su
rvey
at
test
fiel
d (f
rom
D
ecem
ber 2
011
to M
arch
201
2, fr
om
May
to A
ugus
t 201
2)34
農研機構研究報告 農村工学研究部門 第 1 号 (平成 29 年 3 月) ORITATE Fumiko:Use of Digested Slurry from Livestock Manure in Paddy Fields and its Environmental Effect in Southeast Asia174 175
ブック 1.indb 175 2017/03/22 10:05:54

Dat
a re
quire
dC
ompo
nent
Spec
ific
valu
eTo
tal a
mou
ntPr
oces
s of c
alcu
latio
nD
ata/
info
rmat
ion
sour
ces
No.
Valu
eU
nit
Valu
eU
nit
(Out
put)
Yie
ld o
f ric
e hu
sk
C34
.6%
128
t y-1
Car
bon
conc
entra
tion
of ri
ce h
usk
unde
r dry
con
ditio
ns is
34.
6 (%
).…(1
)Th
eref
ore,
car
bon
cont
ent o
f ric
e hu
sk (t
y-1)
= A
mou
nt o
f ric
e hu
sk w
ith th
e w
ater
con
tent
of 1
5% (t
y-1) *
(1-w
ater
con
tent
(%))
* C
arbo
n co
ncen
tratio
n of
rice
hus
k w
ith d
ry c
ondi
tions
(%)
= 43
4 (t
y-1) *
(1-1
5/10
0) *
34.
6/10
0≒
128
(t y-1
)
(1) N
akam
ura
M. e
t al.
(200
5) :
Dev
elop
men
t of a
com
posi
tion
data
base
for v
ario
us ty
pes o
f bi
omas
s, Te
chni
cal R
epor
t of
theN
atio
nal I
nstit
ute
for R
ural
En
gine
erin
g, p
. 69
35
N0.
32%
1.2
t y-1
Nitr
ogen
con
cent
ratio
n of
rice
hus
k is
0.3
2 (%
)…(1
).Th
eref
ore,
nitr
ogen
con
tent
of r
ice
husk
(t y
-1)
= A
mou
nt o
f ric
e hu
sk w
ith a
wat
er c
onte
nt o
f 15%
(t y
-1) *
(1-w
ater
con
tent
(%))
* N
itrog
en c
once
ntra
tion
of ri
ce h
usk
with
dry
con
ditio
ns (%
)=
434
(t y-1
) * (1
-15/
100)
* 0
.32/
100
≒1.
2 (t
y-1)
(1) N
akam
ura
M. e
t al.
(200
5) :
Dev
elop
men
t of a
com
posi
tion
data
base
for v
ario
us ty
pes o
f bi
omas
s, Te
chni
cal R
epor
t of
theN
atio
nal I
nstit
ute
for R
ural
En
gine
erin
g, p
. 69
36
(Out
put)
Yie
ld o
f ric
e br
an
W0.
0877
―19
1t y
-1
Gen
erat
ion
rate
of r
ice
bran
to y
ield
of u
nhul
led
rice
with
a w
ater
con
tent
of 1
5% is
0.0
877…
(1).
Ther
efor
e, th
e am
ount
of r
ice
bran
with
a w
ater
con
tent
of 1
5% (t
y-1)
= Y
ield
with
a w
ater
con
tent
of 1
5% (t
ha-1
cro
p-1) *
Cro
ppin
g ar
ea in
a y
ear (
ha y
-1) *
Gen
erat
ion
rate
= 4
(t ha
-1 c
rop-1
) * 5
44 (h
a y-1
) * 0
.087
7≒
191
(t y-1
)
(1) F
ield
surv
ey a
t tes
t fiel
d (f
rom
D
ecem
ber 2
011
to M
arch
201
2, fr
om
May
to A
ugus
t 201
2)37
C40
.2%
65t y
-1
Car
bon
conc
entra
tion
of ri
ce b
ran
unde
r dry
con
ditio
ns is
40.
2 (%
).…(1
)Th
eref
ore,
car
bon
cont
ent o
f ric
e br
an=
Am
ount
of r
ice
bran
with
the
wat
er c
onte
nt o
f 15%
(t y
-1) *
(1-w
ater
con
tent
(%))
* C
arbo
n co
ncen
tratio
n of
rice
bra
n w
ith d
ry c
ondi
tions
(%)
= 19
1 (t
y-1) *
(1-1
5/10
0) *
40.
2/10
0≒
65 (t
y-1)
(1) N
akam
ura
M. e
t al.
(200
5) :
Dev
elop
men
t of a
com
posi
tion
data
base
for v
ario
us ty
pes o
f bi
omas
s, Te
chni
cal R
epor
t of
the
Nat
iona
l Ins
titut
e fo
r Rur
al
Engi
neer
ing,
p. 6
9
38
N1.
18%
1.9
t y-1
Nitr
ogen
con
cent
ratio
n of
rice
bra
n un
der d
ry c
ondi
tions
is 1
.18
(%).…
(1)
Ther
efor
e, n
itrog
en c
onte
nt o
f ric
e br
an=
Am
ount
of r
ice
bran
with
the
wat
er c
onte
nt o
f 15%
(t y
-1) *
(1-w
ater
con
tent
(%))
* N
itrog
en c
once
ntra
tion
of ri
ce
bran
with
dry
con
ditio
ns (%
)=
191
(t y-1
) * (1
-15/
100)
* 1
.18/
100
≒1.
9 (t
y-1)
(1) N
akam
ura
M. e
t al.
(200
5) :
Dev
elop
men
t of a
co
mpo
sitio
n da
taba
se fo
r var
ious
ty
pes o
f bio
mas
s, Te
chni
cal R
epor
t of
the
Nat
iona
l Ins
titut
e fo
r Rur
al
Engi
neer
ing,
p. 6
9
39
(Out
put)
Yie
ld o
f ric
e st
raw
(Upp
er p
art a
bove
divi
ding
poi
nt a
tha
rves
ting)
W1.
1154
―2,
427
t y-1
Gen
erat
ion
rate
of u
pper
par
t abo
ve d
ivid
ing
poin
t by
com
bine
or h
ook
at h
arve
stin
g of
rice
stra
w to
yie
ld o
f unh
ulle
dric
e is
1.1
154.
…(1
),(2)
Ther
efor
e, th
e am
ount
of r
ice
stra
w (u
pper
par
t) (t
y-1)
= Y
ield
(t h
a-1 c
rop-1
) * C
ropp
ing
area
in a
yea
r (ha
y-1) *
Gen
erat
ion
rate
= 4
(t ha
-1 c
rop-1
) * 5
44 (h
a y-1
) * 1
.115
4≒
2,42
7 (t
y-1)
(1) F
ield
surv
ey a
t tes
t fiel
d (f
rom�
Dec
embe
r 201
1 to
Mar
ch 2
012,
from
M
ay to
Aug
ust 2
012)
(2) I
nter
view
s of V
illag
ers
40
C37
.01
%76
4t y
-1
Car
bon
conc
entra
tion
of ri
ce st
raw
und
er d
ry c
ondi
tions
is 3
7.01
(%).…
(1)
Ther
efor
e, c
arbo
n co
nten
t of r
ice
stra
w (u
pper
par
t)=
Am
ount
of r
ice
stra
w (u
pper
par
t) w
ith a
wat
er c
onte
nt o
f 15%
(t y
-1) *
(1-w
ater
con
tent
(%))
* C
arbo
n co
ncen
tratio
n of
rice
stra
w u
nder
dry
con
ditio
ns (%
)=
2,42
7 (t
y-1) *
(1-1
5/10
0) *
37.
01/1
00≒
764
(t y-1
)
(1) F
ield
surv
ey a
t tes
t fiel
d (f
rom
Dec
embe
r 201
1 to
Mar
ch
2012
, fro
m M
ay to
Aug
ust 2
012)
41
N0.
66%
13.6
t y-1
Nitr
ogen
con
cent
ratio
n of
rice
stra
w u
nder
dry
con
ditio
ns is
0.6
6 (%
).…(1
)Th
eref
ore,
nitr
ogen
con
tent
of r
ice
stra
w (u
pper
par
t)=
Am
ount
of
rice
stra
w (
uppe
r pa
rt) (
t y-1)
* (1
-wat
er c
onte
nt (
%))
* N
itrog
en c
once
ntra
tion
of r
ice
stra
w u
nder
dry
co
nditi
ons (
%)
= 2,
427
(t y-1
) * (1
-15/
100)
* 0
.66/
100
≒13
.6 (t
y-1)
(1) F
ield
surv
ey a
t tes
t fiel
d (f
rom
Dec
embe
r 201
1 to
Mar
ch
2012
, fro
m M
ay to
Aug
ust 2
012)
42
(Out
put)
Yie
ld o
f ric
e st
raw
(Low
er p
art b
elow
divi
ding
poi
nt a
tha
rves
ting)
W0.
2676
―58
2t y
-1
Gen
erat
ion
rate
of l
ower
par
t bel
ow d
ivid
ing
poin
t by
com
bine
or h
ook
of ri
ce st
raw
to y
ield
of u
nhul
led
rice
is 0
.267
6.…
(1),(
2)Th
eref
ore,
the
amou
nt o
f ric
e st
raw
(low
er p
art)
(t y-1
) = Y
ield
(t h
a-1 c
rop-1
) * C
ropp
ing
area
in a
yea
r (ha
y-1) *
Gen
erat
ion
rate
= 4
(t ha
-1 c
rop-1
) * 5
44 (h
a y-1
) * 0
.267
6≒
582
(t y-1
)
(1) F
ield
surv
ey a
t tes
t fiel
d (f
rom
D
ecem
ber 2
011
to M
arch
201
2, fr
om
May
to A
ugus
t 201
2)(2
) Int
ervi
ews o
f Vill
ager
s
43
農研機構研究報告 農村工学研究部門 第 1 号 (平成 29 年 3 月) ORITATE Fumiko:Use of Digested Slurry from Livestock Manure in Paddy Fields and its Environmental Effect in Southeast Asia176 177
ブック 1.indb 176 2017/03/22 10:05:54
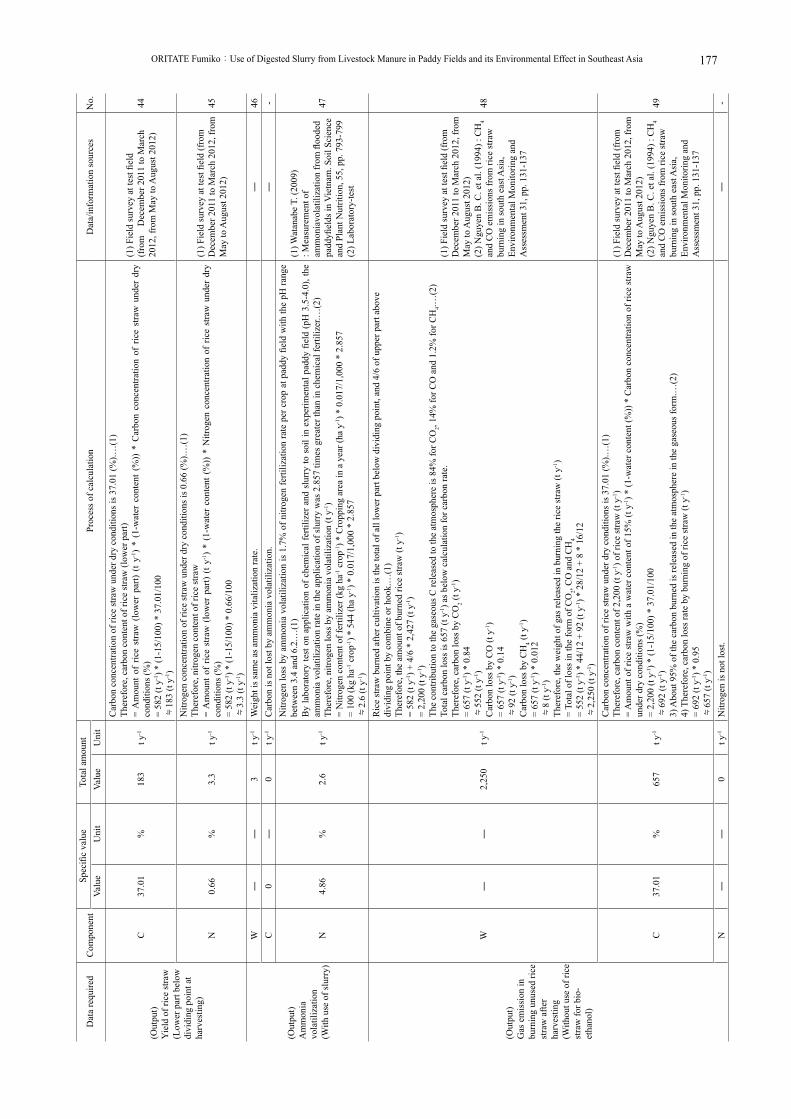
Dat
a re
quire
dC
ompo
nent
Spec
ific
valu
eTo
tal a
mou
ntPr
oces
s of c
alcu
latio
nD
ata/
info
rmat
ion
sour
ces
No.
Valu
eU
nit
Valu
eU
nit
(Out
put)
Yie
ld o
f ric
e st
raw
(Low
er p
art b
elow
divi
ding
poi
nt a
tha
rves
ting)
C37
.01
%18
3t y
-1
Car
bon
conc
entra
tion
of ri
ce st
raw
und
er d
ry c
ondi
tions
is 3
7.01
(%).…
(1)
Ther
efor
e, c
arbo
n co
nten
t of r
ice
stra
w (l
ower
par
t)=
Am
ount
of
rice
stra
w (
low
er p
art)
(t y-1
) *
(1-w
ater
con
tent
(%
)) *
Car
bon
conc
entra
tion
of r
ice
stra
w u
nder
dry
co
nditi
ons (
%)
= 58
2 (t
y-1) *
(1-1
5/10
0) *
37.
01/1
00≒
183
(t y-1
)
(1) F
ield
surv
ey a
t tes
t fiel
d (f
rom
Dec
embe
r 201
1 to
Mar
ch
2012
, fro
m M
ay to
Aug
ust 2
012)
44
N0.
66%
3.3
t y-1
Nitr
ogen
con
cent
ratio
n of
rice
stra
w u
nder
dry
con
ditio
ns is
0.6
6 (%
).…(1
)Th
eref
ore,
nitr
ogen
con
tent
of r
ice
stra
w=
Am
ount
of
rice
stra
w (
low
er p
art)
(t y-1
) *
(1-w
ater
con
tent
(%
)) *
Nitr
ogen
con
cent
ratio
n of
ric
e st
raw
und
er d
ry
cond
ition
s (%
)=
582
(t y-1
) * (1
-15/
100)
* 0
.66/
100
≒3.
3 (t
y-1)
(1) F
ield
surv
ey a
t tes
t fiel
d (f
rom
D
ecem
ber 2
011
to M
arch
201
2, fr
om
May
to A
ugus
t 201
2)45
(Out
put)
Am
mon
iavo
latil
izat
ion
(With
use
of s
lurr
y)
W―
―3
t y-1
Wei
ght i
s sam
e as
am
mon
ia v
italiz
atio
n ra
te.
―46
C0
―0
t y-1
Car
bon
is n
ot lo
st b
y am
mon
ia v
olat
iliza
tion.
―-
N4.
86%
2.6
t y-1
Nitr
ogen
loss
by
amm
onia
vol
atili
zatio
n is
1.7
% o
f nitr
ogen
ferti
lizat
ion
rate
per
cro
p at
pad
dy fi
eld
with
the
pH ra
nge
betw
een
3.4
and
6.2.
…(1
)B
y la
bora
tory
test
on
appl
icat
ion
of c
hem
ical
ferti
lizer
and
slu
rry
to s
oil i
n ex
perim
enta
l pad
dy fi
eld
(pH
3.5
-4.0
), th
e am
mon
ia v
olat
iliza
tion
rate
in th
e ap
plic
atio
n of
slur
ry w
as 2
.857
tim
es g
reat
er th
an in
che
mic
al fe
rtiliz
er.…
(2)
Ther
efor
e, n
itrog
en lo
ss b
y am
mon
ia v
olat
iliza
tion
(t y-1
)=
Nitr
ogen
con
tent
of f
ertil
izer
(kg
ha-1 c
rop-1
) * C
ropp
ing
area
in a
yea
r (ha
y-1) *
0.0
17/1
,000
* 2
.857
= 10
0 (k
g ha
-1 c
rop-1
) * 5
44 (h
a y-1
) * 0
.017
/1,0
00 *
2.8
57≒
2.6
(t y-1
)
(1) W
atan
abe
T. (2
009)
: M
easu
rem
ent o
f am
mon
iavo
latil
izat
ion
from
floo
ded
padd
yfiel
ds in
Vie
tnam
. Soi
l Sci
ence
an
d Pl
ant N
utrit
ion,
55,
pp.
793
-799
(2) L
abor
ator
y-te
st
47
(Out
put)
Gas
em
issi
on in
burn
ing
unus
ed ri
cest
raw
afte
rha
rves
ting
(With
out u
se o
f ric
est
raw
for b
io-
etha
nol)
W―
―2,
250
t y-1
Ric
e st
raw
bur
ned
afte
r cul
tivat
ion
is th
e to
tal o
f all
low
er p
art b
elow
div
idin
g po
int,
and
4/6
of u
pper
par
t abo
vedi
vidi
ng p
oint
by
com
bine
or h
ook.
…(1
)Th
eref
ore,
the
amou
nt o
f bur
ned
rice
stra
w (t
y-1)
= 58
2 (t
y-1) +
4/6
* 2
,427
(t y
-1)
= 2,
200
(t y-1
)Th
e co
ntrib
utio
n to
the
gase
ous C
rele
ased
to th
e at
mos
pher
e is
84%
for C
O2,
14%
for C
O a
nd 1
.2%
for C
H4.…
(2)
Tota
l car
bon
loss
is 6
57 (t
y-1) a
s bel
ow c
alcu
latio
n fo
r car
bon
rate
.Th
eref
ore,
car
bon
loss
by
CO
2 (t y
-1)
= 65
7 (t
y-1) *
0.8
4≒
552
(t y-1
)C
arbo
n lo
ss b
y C
O (t
y-1)
= 65
7 (t
y-1) *
0.1
4≒
92 (t
y-1)
Car
bon
loss
by
CH
4 (t y
-1)
= 65
7 (t
y-1) *
0.0
12≒
8 (t
y-1)
Ther
efor
e, th
e w
eigh
t of g
as re
leas
ed in
bur
ning
the
rice
stra
w (t
y-1)
= To
tal o
f los
s in
the
form
of C
O2,
CO
and
CH
4=
552
(t y-1
) * 4
4/12
+ 9
2 (t
y-1) *
28/
12 +
8 *
16/
12≒
2,25
0 (t
y-1)
(1) F
ield
surv
ey a
t tes
t fiel
d (f
rom
D
ecem
ber 2
011
to M
arch
201
2, fr
om
May
to A
ugus
t 201
2)(2
) Ngu
yen
B. C
. et a
l. (1
994)
: C
H4
and
CO
em
issi
ons f
rom
rice
stra
w
burn
ing
in so
uth
east
Asi
a,
Envi
ronm
enta
l Mon
itorin
g an
d A
sses
smen
t 31,
pp.
131
-137
48
C37
.01
%65
7t y
-1
Car
bon
conc
entra
tion
of ri
ce st
raw
und
er d
ry c
ondi
tions
is 3
7.01
(%).…
(1)
Ther
efor
e, c
arbo
n co
nten
t of 2
,200
(t y
-1) o
f ric
e st
raw
(t y
-1)
= A
mou
nt o
f ric
e st
raw
with
a w
ater
con
tent
of 1
5% (t
y-1) *
(1-w
ater
con
tent
(%))
* C
arbo
n co
ncen
tratio
n of
rice
stra
w
unde
r dry
con
ditio
ns (%
)=
2,20
0 (t
y-1) *
(1-1
5/10
0) *
37.
01/1
00≒
692
(t y-1
)3)
Abo
ut 9
5% o
f the
car
bon
burn
ed is
rele
ased
in th
e at
mos
pher
e in
the
gase
ous f
orm
.…(2
)4)
The
refo
re, c
arbo
n lo
ss ra
te b
y bu
rnin
g of
rice
stra
w (t
y-1)
= 69
2 (t
y-1) *
0.9
5≒
657
(t y-1
)
(1) F
ield
surv
ey a
t tes
t fiel
d (f
rom
D
ecem
ber 2
011
to M
arch
201
2, fr
om
May
to A
ugus
t 201
2)(2
) Ngu
yen
B. C
. et a
l. (1
994)
: C
H4
and
CO
em
issi
ons f
rom
rice
stra
w
burn
ing
in so
uth
east
Asi
a,
Envi
ronm
enta
l Mon
itorin
g an
d A
sses
smen
t 31,
pp.
131
-137
49
N―
―0
t y-1
Nitr
ogen
is n
ot lo
st.
―-
農研機構研究報告 農村工学研究部門 第 1 号 (平成 29 年 3 月) ORITATE Fumiko:Use of Digested Slurry from Livestock Manure in Paddy Fields and its Environmental Effect in Southeast Asia176 177
ブック 1.indb 177 2017/03/22 10:05:54

Dat
a re
quire
dC
ompo
nent
Spec
ific
valu
eTo
tal a
mou
ntPr
oces
s of c
alcu
latio
nD
ata/
info
rmat
ion
sour
ces
No.
Valu
eU
nit
Valu
eU
nit
(Out
put)
Gas
em
issi
on in
burn
ing
unus
ed ri
cest
raw
afte
rha
rves
ting
(With
use
of r
ice
stra
w fo
r bio
-et
hano
l)
W―
―59
4t y
-1
Ric
e st
raw
bur
ned
afte
r cul
tivat
ion
is th
e to
tal o
f all
low
er p
art b
elow
div
idin
g po
int.
Ther
efor
e, th
e am
ount
of b
urne
d ric
e st
raw
(t y
-1)
= 58
2 (t
y-1).…
(1)
The
cont
ribut
ion
to th
e ga
seou
s C re
leas
ed to
the
atm
osph
ere
is 8
4% fo
r CO
2, 14
% fo
r CO
and
1.2
% fo
r CH
4.…(2
)To
tal c
arbo
n lo
ss is
174
(t y
-1) a
s bel
ow c
alcu
latio
n ab
out c
arbo
n ra
te.
Ther
efor
e, c
arbo
n lo
ss b
y C
O2 (
t y-1),
CO
(t y
-1) a
nd C
H4 (
t y-1)
≒14
6 (t
y-1),
24 (t
y-1) a
nd 2
(t y
-1)
Ther
efor
e, th
e w
eigh
t of g
as re
leas
ed in
bur
ning
the
rice
stra
w (t
y-1)
= To
tal o
f los
s in
the
form
of C
O2,
CO
and
CH
4=
146
(t y-1
) * 4
4/12
+ 2
4 (t
y-1) *
28/
12 +
2 *
16/
12=
594
(t y-1
)
(1) F
ield
surv
ey a
t tes
t fiel
d (f
rom
D
ecem
ber 2
011
to M
arch
201
2, fr
om
May
to A
ugus
t 201
2)(2
) Ngu
yen
B. C
. et a
l. (1
994)
: C
H4
and
CO
em
issi
ons f
rom
rice
stra
w
burn
ing
in so
uth
east
Asi
a,
Envi
ronm
enta
l Mon
itorin
g an
d A
sses
smen
t 31,
pp.
131
-137
50
C37
.01
%17
4t y
-1
Car
bon
conc
entra
tion
of ri
ce st
raw
und
er d
ry c
ondi
tions
is 3
7.01
(%).…
(1)
Ther
efor
e, c
arbo
n co
nten
t of 5
82 (t
y-1) o
f ric
e st
raw
(t y
-1)
= A
mou
nt o
f ric
e st
raw
with
a w
ater
con
tent
of 1
5% (t
y-1) *
(1-w
ater
con
tent
(%))
* C
arbo
n co
ncen
tratio
n of
rice
stra
w
unde
r dry
con
ditio
ns (%
)=
582
(t y-1
) * (1
-15/
100)
* 3
7.01
/100
≒18
3 (t
y-1)
Abo
ut 9
5% o
f the
car
bon
burn
ed is
rele
ased
in th
e at
mos
pher
e in
the
gase
ous f
orm
.…(2
)Th
eref
ore,
car
bon
loss
rate
by
burn
ing
of ri
ce st
raw
(t y
-1)
= 18
3 (t
y-1) *
0.9
5≒
174
(t y-1
)
(1) F
ield
surv
ey a
t tes
t fiel
d (f
rom
D
ecem
ber 2
011
to M
arch
201
2, fr
om
May
to A
ugus
t 201
2)(2
) Ngu
yen
B. C
. et a
l. (1
994)
: C
H4
and
CO
em
issi
ons f
rom
rice
stra
w
burn
ing
in so
uth
east
Asi
a,
Envi
ronm
enta
l Mon
itorin
g an
d A
sses
smen
t 31,
pp.
131
-137
51
N―
―0
t y-1
Nitr
ogen
is n
ot lo
st.
―-
農研機構研究報告 農村工学研究部門 第 1 号 (平成 29 年 3 月) ORITATE Fumiko:Use of Digested Slurry from Livestock Manure in Paddy Fields and its Environmental Effect in Southeast Asia178 179
ブック 1.indb 178 2017/03/22 10:05:54
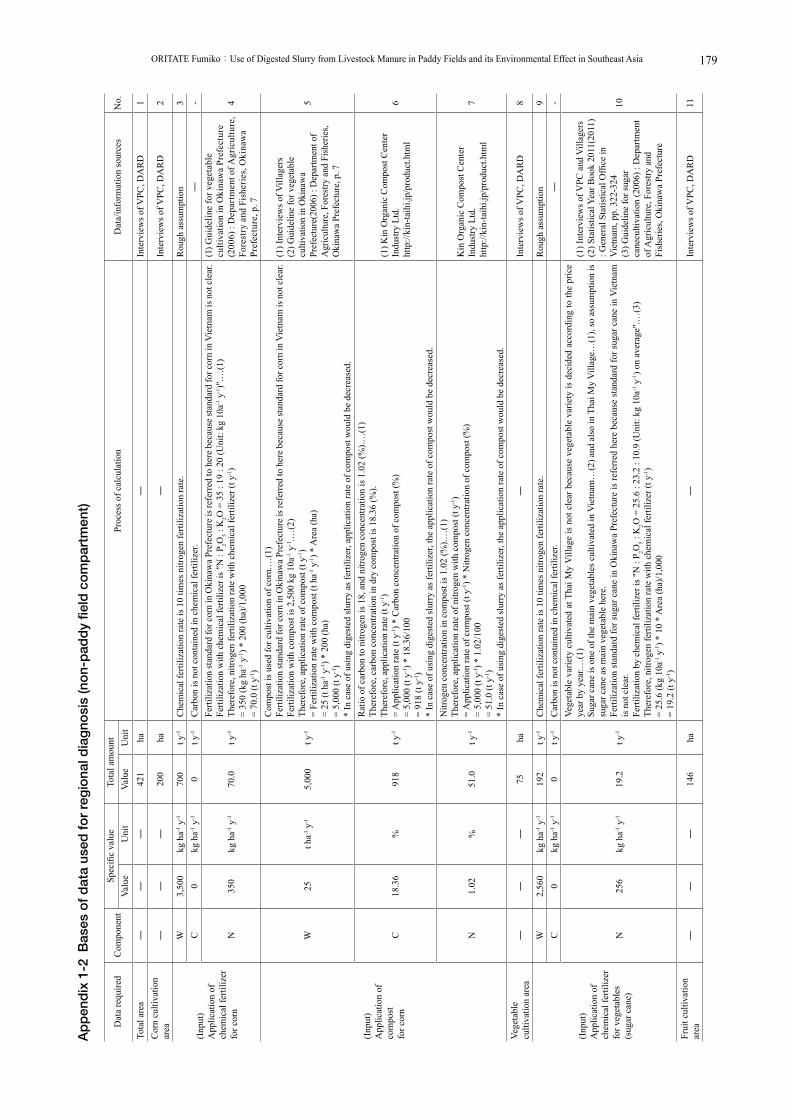
Ap
pen
dix
1-2
Bas
es o
f d
ata
used
fo
r re
gio
nal d
iag
nosi
s (n
on-
pad
dy
field
co
mp
artm
ent)
Dat
a re
quire
dC
ompo
nent
Spec
ific
valu
eTo
tal a
mou
ntPr
oces
s of c
alcu
latio
nD
ata/
info
rmat
ion
sour
ces
No.
Valu
eU
nit
Valu
eU
nit
Tota
l are
a―
――
421
ha―
Inte
rvie
ws o
f VPC
, DA
RD
1C
orn
culti
vatio
nar
ea―
――
200
ha―
Inte
rvie
ws o
f VPC
, DA
RD
2
(Inp
ut)
App
licat
ion
ofch
emic
al fe
rtiliz
erfo
r cor
n
W3,
500
kg h
a-1 y
-170
0t y
-1C
hem
ical
ferti
lizat
ion
rate
is 1
0 tim
es n
itrog
en fe
rtiliz
atio
n ra
te.
Rou
gh a
ssum
ptio
n3
C0
kg h
a-1 y
-10
t y-1
Car
bon
is n
ot c
onta
ined
in c
hem
ical
ferti
lizer
.―
-
N35
0kg
ha-1
y-1
70.0
t y-1
Ferti
lizat
ion
stan
dard
for c
orn
in O
kina
wa
Pref
ectu
re is
refe
rred
to h
ere
beca
use
stan
dard
for c
orn
in V
ietn
am is
not
cle
ar.
Ferti
lizat
ion
with
che
mic
al fe
rtiliz
er is
"N :
P 2O5 :
K2O
= 3
5 : 1
9 : 2
0 (U
nit:
kg 1
0a-1 y
-1)"
.…(1
)Th
eref
ore,
nitr
ogen
ferti
lizat
ion
rate
with
che
mic
al fe
rtiliz
er (t
y-1)
= 35
0 (k
g ha
-1 y
-1) *
200
(ha)
/1,0
00=
70.0
(t y
-1)
(1) G
uide
line
for v
eget
able
cu
ltiva
tion
in O
kina
wa
Pref
ectu
re
(200
6) :
Dep
artm
ent o
f Agr
icul
ture
, Fo
rest
ry a
nd F
ishe
ries,
Oki
naw
a Pr
efec
ture
, p. 7
4
(Inp
ut)
App
licat
ion
ofco
mpo
stfo
r cor
n
W25
t ha-1
y-1
5,00
0t y
-1
Com
post
is u
sed
for c
ultiv
atio
n of
cor
n.…
(1)
Ferti
lizat
ion
stan
dard
for c
orn
in O
kina
wa
Pref
ectu
re is
refe
rred
to h
ere
beca
use
stan
dard
for c
orn
in V
ietn
am is
not
cle
ar.
Ferti
lizat
ion
with
com
post
is 2
,500
kg
10a-1
y-1.…
(2)
Ther
efor
e, a
pplic
atio
n ra
te o
f com
post
(t y
-1)
= Fe
rtiliz
atio
n ra
te w
ith c
ompo
st (t
ha-1
y-1) *
Are
a (h
a)=
25 (t
ha-1
y-1) *
200
(ha)
= 5,
000
(t y-1
)*
In c
ase
of u
sing
dig
este
d sl
urry
as f
ertil
izer
, app
licat
ion
rate
of c
ompo
st w
ould
be
decr
ease
d.
(1) I
nter
view
s of V
illag
ers
(2) G
uide
line
for v
eget
able
cu
ltiva
tion
in O
kina
wa
Pref
ectu
re(2
006)
: D
epar
tmen
t of
Agr
icul
ture
, For
estry
and
Fish
erie
s, O
kina
wa
Pref
ectu
re, p
. 7
5
C18
.36
%91
8t y
-1
Rat
io o
f car
bon
to n
itrog
en is
18,
and
nitr
ogen
con
cent
ratio
n is
1.0
2 (%
).…(1
)Th
eref
ore,
car
bon
conc
entra
tion
in d
ry c
ompo
st is
18.
36 (%
).Th
eref
ore,
app
licat
ion
rate
(t y
-1)
= A
pplic
atio
n ra
te (t
y-1) *
Car
bon
conc
entra
tion
of c
ompo
st (%
)=
5,00
0 (t
y-1) *
18.
36/1
00=
918
(t y-1
)*
In c
ase
of u
sing
dig
este
d sl
urry
as f
ertil
izer
, the
app
licat
ion
rate
of c
ompo
st w
ould
be
decr
ease
d.
(1) K
in O
rgan
ic C
ompo
st C
ente
r In
dust
ry L
td.
http
://ki
n-ta
ihi.j
p/pr
oduc
t.htm
l6
N1.
02%
51.0
t y-1
Nitr
ogen
con
cent
ratio
n in
com
post
is 1
.02
(%).…
(1)
Ther
efor
e, a
pplic
atio
n ra
te o
f nitr
ogen
with
com
post
(t y
-1)
= A
pplic
atio
n ra
te o
f com
post
(t y
-1) *
Nitr
ogen
con
cent
ratio
n of
com
post
(%)
= 5,
000
(t y-1
) * 1
.02/
100
= 51
.0 (t
y-1)
* In
cas
e of
usi
ng d
iges
ted
slur
ry a
s fer
tiliz
er, t
he a
pplic
atio
n ra
te o
f com
post
wou
ld b
e de
crea
sed.
Kin
Org
anic
Com
post
Cen
ter
Indu
stry
Ltd
.ht
tp://
kin-
taih
i.jp/
prod
uct.h
tml
7
Vege
tabl
ecu
ltiva
tion
area
――
―75
ha―
Inte
rvie
ws o
f VPC
, DA
RD
8
(Inp
ut)
App
licat
ion
ofch
emic
al fe
rtiliz
erfo
r veg
etab
les
(sug
ar c
ane)
W2,
560
kg h
a-1 y
-119
2t y
-1C
hem
ical
ferti
lizat
ion
rate
is 1
0 tim
es n
itrog
en fe
rtiliz
atio
n ra
te.
Rou
gh a
ssum
ptio
n9
C0
kg h
a-1 y
-10
t y-1
Car
bon
is n
ot c
onta
ined
in c
hem
ical
ferti
lizer
.―
-
N25
6kg
ha-1
y-1
19.2
t y-1
Vege
tabl
e va
riety
cul
tivat
ed a
t Tha
i My
Vill
age
is n
ot c
lear
bec
ause
veg
etab
le v
arie
ty is
dec
ided
acc
ordi
ng to
the
pric
e ye
ar b
y ye
ar.…
(1)
Suga
r can
e is
one
of t
he m
ain
vege
tabl
es c
ultiv
ated
in V
ietn
am…
(2) a
nd a
lso
in T
hai M
y V
illag
e…(1
), so
ass
umpt
ion
is
suga
r can
e as
mai
n ve
geta
ble
here
.Fe
rtiliz
atio
n st
anda
rd fo
r sug
ar c
ane
in O
kina
wa
Pref
ectu
re is
refe
rred
her
e be
caus
e st
anda
rd fo
r sug
ar c
ane
in V
ietn
am
is n
ot c
lear
.Fe
rtiliz
atio
n by
che
mic
al fe
rtiliz
er is
"N :
P 2O5 :
K2O
= 2
5.6
: 23.
2 : 1
0.9
(Uni
t: kg
10a
-1 y
-1) o
n av
erag
e".…
(3)
Ther
efor
e, n
itrog
en fe
rtiliz
atio
n ra
te w
ith c
hem
ical
ferti
lizer
(t y
-1)
= 25
.6 (k
g 10
a-1 y
-1) *
10
* A
rea
(ha)
/1,0
00=
19.2
(t y
-1)
(1) I
nter
view
s of V
PC a
nd V
illag
ers
(2) S
tatis
tical
Yea
r Boo
k 20
11(2
011)
: G
ener
al S
tatis
tical
Offi
ce in
V
ietn
am, p
p. 3
22-3
24(3
) Gui
delin
e fo
r sug
ar
cane
culti
vatio
n (2
006)
: D
epar
tmen
t of
Agr
icul
ture
, For
estry
and
Fi
sher
ies,
Oki
naw
a Pr
efec
ture
10
Frui
t cul
tivat
ion
area
――
―14
6ha
―In
terv
iew
s of V
PC, D
AR
D11
農研機構研究報告 農村工学研究部門 第 1 号 (平成 29 年 3 月) ORITATE Fumiko:Use of Digested Slurry from Livestock Manure in Paddy Fields and its Environmental Effect in Southeast Asia178 179
ブック 1.indb 179 2017/03/22 10:05:54

Dat
a re
quire
dC
ompo
nent
Spec
ific
valu
eTo
tal a
mou
ntPr
oces
s of c
alcu
latio
nD
ata/
info
rmat
ion
sour
ces
No.
Valu
eU
nit
Valu
eU
nit
(Inp
ut)
App
licat
ion
ofch
emic
al fe
rtiliz
erfo
r fru
it(m
ango
)
W4,
000
kg h
a-1 y
-158
4t y
-1
Frui
t var
iety
cul
tivat
ed a
t Tha
i My
Vill
age
is n
ot c
lear
bec
ause
dec
ided
acc
ordi
ng to
the
pric
e ye
ar b
y ye
ar.…
(1)
Man
go is
one
of t
he m
ain
frui
ts c
ultiv
ated
in V
ietn
am…
(2) a
nd a
lso
in T
hai M
y V
illag
e…(1
), so
ass
umpt
ion
is m
ango
as
the
mai
n fr
uit h
ere.
Ferti
lizat
ion
stan
dard
for m
ango
(five
yea
rs a
fter s
tarti
ng c
ultiv
atio
n) in
Oki
naw
a Pr
efec
ture
is u
sed
here
bec
ause
stan
dard
for m
ango
in V
ietn
am is
not
cle
ar.
Ferti
lizat
ion
by c
hem
ical
ferti
lizer
is to
tal f
ertil
izat
ion
rate
in a
yea
r of 4
00 (k
g 10
a-1).…
(3)
Ther
efor
e, c
hem
ical
ferti
lizat
ion
rate
(t y
-1)
= Fe
rtiliz
atio
n ra
te (k
g ha
-1 y
-1) *
10
* A
rea
(ha)
/1,0
00=
4,00
0 (k
g ha
-1 y
-1) *
146
(ha)
/1,0
00=
584
(t y-1
)
(1) I
nter
view
s of V
PC a
nd V
illag
ers
(2) S
tatis
tical
Yea
r Boo
k 20
11(2
011)
: G
ener
al S
tatis
tical
Offi
ce in
V
ietn
am, p
p. 3
72-3
74(3
) Gui
delin
e fo
r fru
its c
ultiv
atio
n,
(200
3) :
Dep
artm
ent o
f Agr
icul
ture
, Fo
rest
ry a
nd F
ishe
ries,
Oki
naw
a Pr
efec
ture
, p. 1
0
12
C0
kg h
a-1 y
-10
t y-1
Car
bon
is n
ot c
onta
ined
in c
hem
ical
ferti
lizer
.―
-
N20
0kg
ha-1
y-1
29.2
t y-1
Ferti
lizat
ion
stan
dard
for m
ango
(five
yea
rs a
fter s
tarti
ng c
ultiv
atio
n) in
Oki
naw
a Pr
efec
ture
is u
sed
here
bec
ause
stan
dard
for m
ango
in V
ietn
am is
not
cle
ar.
Nitr
ogen
ferti
lizat
ion
rate
show
n in
abo
ve st
anda
rd is
20
(kg
10a-1
) in
a ye
ar.…
(1)
Ther
efor
e, n
itrog
en fe
rtiliz
atio
n ra
te o
f che
mic
al fe
rtiliz
er(t
y-1) =
Nitr
ogen
ferti
lizat
ion
rate
(kg
ha-1 y
-1) *
Are
a (h
a)/1
,000
= 20
0 (k
g ha
-1 y
-1) *
146
(ha)
/1,0
00≒
29.2
(t y
-1)
(1) G
uide
line
for f
ruits
cul
tivat
ion,
(2
003)
: D
epar
tmen
t of A
gric
ultu
re,
Fore
stry
and
Fis
herie
s, O
kina
wa
Pref
ectu
re, p
. 10
13
(Out
put)
Yie
ld o
f cor
n
W7.
5t h
a-1 y
-11,
500
t y-1
Yie
ld o
f cor
n pe
r cro
p is
6-9
(t h
a-1).…
(1),
so, t
he a
vera
ge is
7.5
(t h
a-1 c
rop-1
).C
orn
is c
ultiv
ated
onc
e a
year
, so,
7.5
(t h
a-1 c
rop-1
) = 7
.5 (t
ha-1
y-1).
Ther
efor
e, y
ield
(t y
-1)
= yi
eld
(t ha
-1 y
-1) *
Are
a (h
a)=
7.5
(t ha
-1 y
-1) *
200
(ha)
= 1,
500
(t y-1
)
(1) I
nter
view
s of V
PC a
nd V
illag
ers
14
C43
.8%
399
t y-1
Car
bon
conc
entra
tion
of c
orn
unde
r dry
con
ditio
ns is
43.
8%.…
(1)
Ass
umpt
ion
that
wat
er c
onte
nt o
f cor
n in
abo
ve y
ield
is 3
9.2%
.…(1
)Th
eref
ore,
car
bon
cont
ent w
ith a
wat
er c
onte
nt o
f 39.
2% (t
y-1)
= Y
ield
with
the
wat
er c
onte
nt o
f 39.
2% (t
y-1) *
(1-w
ater
con
tent
(%))
* C
arbo
n co
ncen
tratio
n un
der d
ry c
ondi
tions
(%)
= 1,
500
(t y-1
) * (1
-39.
2/10
0) *
43.
8/10
0≒
399
(t y-1
)
(1) N
akam
ura
M. e
t al.
(200
5) :
Dev
elop
men
t of a
com
posi
tion
data
base
for v
ario
us ty
pes o
f bi
omas
s, Te
chni
cal R
epor
t of
the
Nat
iona
l Ins
titut
e fo
r Rur
al
Engi
neer
ing,
p. 7
0
15
N2.
12%
19.3
t y-1
Nitr
ogen
con
cent
ratio
n un
der d
ry c
ondi
tions
is 2
.12%
.…(1
)A
ssum
ptio
n th
at w
ater
con
tent
of c
orn
in a
bove
yie
ld is
39.
2%.…
(1)
Ther
efor
e, n
itrog
en c
onte
nt w
ith a
wat
er c
onte
nt o
f 39.
2% (t
y-1) =
Yie
ld o
f cor
n w
ith th
e w
ater
con
tent
is 3
9.2%
(t y
-1) *
(1
-wat
er c
onte
nt (%
)) *
Nitr
ogen
con
cent
ratio
n un
der d
ry c
ondi
tions
(%)
= 1,
500
(t y-1
) * (1
-39.
2/10
0) *
2.1
2/10
0≒
19.3
(t y
-1)
(1) N
akam
ura
M. e
t al.
(200
5) :
Dev
elop
men
t of a
com
posi
tion
data
base
for v
ario
us ty
pes o
f bi
omas
s, Te
chni
cal R
epor
t of
the
Nat
iona
l Ins
titut
e fo
r Rur
al
Engi
neer
ing,
p. 7
0
16
(Out
put)
Yie
ld o
f sug
ar c
ane
W62
.95
t ha-1
y-1
4,72
1t y
-1
Yie
ld o
f sug
ar c
ane
in H
o C
hi M
inh
City
is 1
32,2
00 (t
y-1) w
hen
the
culti
vatio
n ar
ea is
2,1
00 (h
a).…
(1)
Ther
efor
e, c
alcu
latin
g as
133
,200
(t y
-1)/2
,100
(ha)
= 62
.95
(t ha
-1 y
-1).
Ther
efor
e, y
ield
of s
ugar
can
e (t
y-1)
= Y
ield
(t h
a-1 y
-1) *
Are
a (h
a)=
62.9
5 (t
ha-1 y
-1) *
75
(ha)
≒4,
721
(t y-1
)
(1) S
tatis
tical
Yea
r Boo
k 20
11(2
011)
: G
ener
al S
tatis
tical
Offi
ce in
Viet
nam
, pp
. 366
-367
17
C42
.5%
1,81
0t y
-1
Car
bon
conc
entra
tion
unde
r dry
con
ditio
ns is
42.
5%.…
(1)
Ass
umpt
ion
that
wat
er c
onte
nt o
f sug
ar c
ane
in a
bove
yie
ld is
9.8
%.…
(1)
Ther
efor
e, c
arbo
n co
nten
t with
a w
ater
con
tent
of 9
.8%
(t y
-1)
= Y
ield
of s
ugar
can
e (t
y-1) *
(1-w
ater
con
tent
(%))
* C
arbo
n co
ncen
tratio
n un
der d
ry c
ondi
tions
(%)
= 4,
721
(t y-1
) * (1
-9.8
/100
) * 4
2.5/
100
≒1,
810
(t y-1
)
(1) N
akam
ura
M. e
t al.
(200
5) :
Dev
elop
men
t of a
com
posi
tion
data
base
for v
ario
us ty
pes o
f bi
omas
s, Te
chni
cal R
epor
t of
the
Nat
iona
l Ins
titut
e fo
r Rur
al
Engi
neer
ing,
p. 7
0
18
農研機構研究報告 農村工学研究部門 第 1 号 (平成 29 年 3 月) ORITATE Fumiko:Use of Digested Slurry from Livestock Manure in Paddy Fields and its Environmental Effect in Southeast Asia180 181
ブック 1.indb 180 2017/03/22 10:05:55
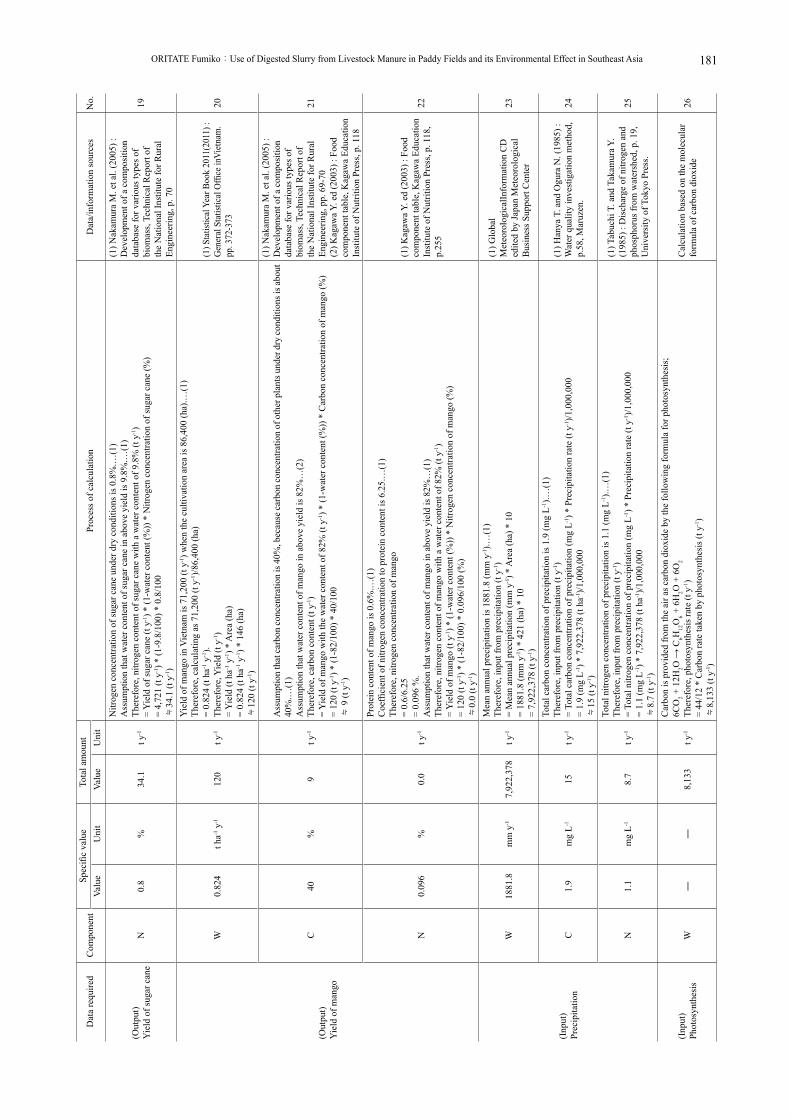
Dat
a re
quire
dC
ompo
nent
Spec
ific
valu
eTo
tal a
mou
ntPr
oces
s of c
alcu
latio
nD
ata/
info
rmat
ion
sour
ces
No.
Valu
eU
nit
Valu
eU
nit
(Out
put)
Yie
ld o
f sug
ar c
ane
N0.
8%
34.1
t y-1
Nitr
ogen
con
cent
ratio
n of
suga
r can
e un
der d
ry c
ondi
tions
is 0
.8%
.…(1
)A
ssum
ptio
n th
at w
ater
con
tent
of s
ugar
can
e in
abo
ve y
ield
is 9
.8%
.…(1
)Th
eref
ore,
nitr
ogen
con
tent
of s
ugar
can
e w
ith a
wat
er c
onte
nt o
f 9.8
% (t
y-1)
= Y
ield
of s
ugar
can
e (t
y-1) *
(1-w
ater
con
tent
(%))
* N
itrog
en c
once
ntra
tion
of su
gar c
ane
(%)
= 4,
721
(t y-1
) * (1
-9.8
/100
) * 0
.8/1
00≒
34.1
(t y
-1)
(1) N
akam
ura
M. e
t al.
(200
5) :
Dev
elop
men
t of a
com
posi
tion
data
base
for v
ario
us ty
pes o
f bi
omas
s, Te
chni
cal R
epor
t of
the
Nat
iona
l Ins
titut
e fo
r Rur
al
Engi
neer
ing,
p. 7
0
19
(Out
put)
Yie
ld o
f man
go
W0.
824
t ha-1
y-1
120
t y-1
Yie
ld o
f man
go in
Vie
tnam
is 7
1,20
0 (t
y-1) w
hen
the
culti
vatio
n ar
ea is
86,
400
(ha)
.…(1
)Th
eref
ore,
cal
cula
ting
as 7
1,20
0 (t
y-1)/8
6,40
0 (h
a)=
0.82
4 (t
ha-1 y
-1).
Ther
efor
e, Y
ield
(t y
-1)
= Y
ield
(t h
a-1 y
-1) *
Are
a (h
a)=
0.82
4 (t
ha-1 y
-1) *
146
(ha)
≒12
0 (t
y-1)
(1) S
tatis
tical
Yea
r Boo
k 20
11(2
011)
: G
ener
al S
tatis
tical
Offi
ce in
Viet
nam
. pp
. 372
-373
20
C40
%9
t y-1
Ass
umpt
ion
that
car
bon
conc
entra
tion
is 4
0%, b
ecau
se c
arbo
n co
ncen
tratio
n of
oth
er p
lant
s und
er d
ry co
nditi
ons i
s abo
ut
40%
.…(1
)A
ssum
ptio
n th
at w
ater
con
tent
of m
ango
in a
bove
yie
ld is
82%
…(2
)Th
eref
ore,
car
bon
cont
ent (
t y-1)
= Y
ield
of m
ango
with
the
wat
er c
onte
nt o
f 82%
(t y
-1) *
(1-w
ater
con
tent
(%))
* C
arbo
n co
ncen
tratio
n of
man
go (%
)=
120
(t y-1
) * (1
-82/
100)
* 4
0/10
0≒
9 (t
y-1)
(1) N
akam
ura
M. e
t al.
(200
5) :
Dev
elop
men
t of a
com
posi
tion
data
base
for v
ario
us ty
pes o
f bi
omas
s, Te
chni
cal R
epor
t of
the
Nat
iona
l Ins
titut
e fo
r Rur
al
Engi
neer
ing,
pp.
69-
70(2
) Kag
awa Y
. ed
(200
3) :
Food
co
mpo
nent
tabl
e, K
agaw
a Ed
ucat
ion
Inst
itute
of N
utrit
ion
Pres
s, p.
118
21
N0.
096
%0.
0t y
-1
Prot
ein
cont
ent o
f man
go is
0.6
%.…
(1)
Coe
ffici
ent o
f nitr
ogen
con
cent
ratio
n to
pro
tein
con
tent
is 6
.25.
…(1
)Th
eref
ore,
nitr
ogen
con
cent
ratio
n of
man
go=
0.6/
6.25
= 0.
096
%.
Ass
umpt
ion
that
wat
er c
onte
nt o
f man
go in
abo
ve y
ield
is 8
2%…
(1)
Ther
efor
e, n
itrog
en c
onte
nt o
f man
go w
ith a
wat
er c
onte
nt o
f 82%
(t y
-1)
= Y
ield
of m
ango
(t y
-1) *
(1-w
ater
con
tent
(%))
* N
itrog
en c
once
ntra
tion
of m
ango
(%)
= 12
0 (t
y-1) *
(1-8
2/10
0) *
0.0
96/1
00 (%
)≒
0.0
(t y-1
)
(1) K
agaw
a Y. e
d (2
003)
: Fo
od
com
pone
nt ta
ble,
Kag
awa
Educ
atio
n In
stitu
te o
f Nut
ritio
n Pr
ess,
p. 1
18,
p.25
5
22
(Inp
ut)
Prec
ipita
tion
W18
81.8
mm
y-1
7,92
2,37
8t y
-1
Mea
n an
nual
pre
cipi
tatio
n is
188
1.8
(mm
y-1).…
(1)
Ther
efor
e, in
put f
rom
pre
cipi
tatio
n (t
y-1)
= M
ean
annu
al p
reci
pita
tion
(mm
y-1) *
Are
a (h
a) *
10
= 18
81.8
(mm
y-1) *
421
(ha)
* 1
0=
7,92
2,37
8 (t
y-1)
(1) G
loba
l M
eteo
rolo
gica
lInfo
rmat
ion
CD
ed
ited
by Ja
pan
Met
eoro
logi
cal
Bus
ines
s Sup
port
Cen
ter
23
C1.
9m
g L-1
15t y
-1
Tota
l car
bon
conc
entra
tion
of p
reci
pita
tion
is 1
.9 (m
g L-1
).…(1
)Th
eref
ore,
inpu
t fro
m p
reci
pita
tion
(t y-1
)=
Tota
l car
bon
conc
entra
tion
of p
reci
pita
tion
(mg
L-1) *
Pre
cipi
tatio
n ra
te (t
y-1)/1
,000
,000
= 1.
9 (m
g L-1
) * 7
,922
,378
(t h
a-1)/1
,000
,000
≒15
(t y
-1)
(1) H
anya
T. a
nd O
gura
N. (
1985
) :
Wat
er q
ualit
y in
vest
igat
ion
met
hod,
p.
58, M
aruz
en.
24
N1.
1m
g L-1
8.7
t y-1
Tota
l nitr
ogen
con
cent
ratio
n of
pre
cipi
tatio
n is
1.1
(mg
L-1).…
(1)
Ther
efor
e, in
put f
rom
pre
cipi
tatio
n (t
y-1)
= To
tal n
itrog
en c
once
ntra
tion
of p
reci
pita
tion
(mg
L-1) *
Pre
cipi
tatio
n ra
te (t
y-1)/1
,000
,000
= 1.
1 (m
g L-1
) * 7
,922
,378
(t h
a-1)/1
,000
,000
≒8.
7 (t
y-1)
(1) T
abuc
hi T
. and
Tak
amur
a Y.
(198
5) :
Dis
char
ge o
f nitr
ogen
and
ph
osph
orus
from
wat
ersh
ed, p
. 19,
U
nive
rsity
of T
okyo
Pre
ss.
25
(Inp
ut)
Phot
osyn
thes
isW
――
8,13
3t y
-1
Car
bon
is p
rovi
ded
from
the
air a
s car
bon
diox
ide
by th
e fo
llow
ing
form
ula
for p
hoto
synt
hesi
s;6C
O2 +
12H
2O →
C6H
12O
6 + 6
H2O
+ 6
O2
Ther
efor
e, p
hoto
synt
hesi
s rat
e (t
y-1)
= 44
/12
* C
arbo
n ra
te ta
ken
by p
hoto
synt
hesi
s (t y
-1)
≒8,
133
(t y-1
)
Cal
cula
tion
base
d on
the
mol
ecul
ar
form
ula
of c
arbo
n di
oxid
e26
農研機構研究報告 農村工学研究部門 第 1 号 (平成 29 年 3 月) ORITATE Fumiko:Use of Digested Slurry from Livestock Manure in Paddy Fields and its Environmental Effect in Southeast Asia180 181
ブック 1.indb 181 2017/03/22 10:05:55

Dat
a re
quire
dC
ompo
nent
Spec
ific
valu
eTo
tal a
mou
ntPr
oces
s of c
alcu
latio
nD
ata/
info
rmat
ion
sour
ces
No.
Valu
eU
nit
Valu
eU
nit
(Inp
ut)
Phot
osyn
thes
isC
2,21
8t y
-12,
218
t y-1
Ass
umpt
ion
that
car
bon
cont
ent p
rovi
ded
by p
hoto
synt
hesi
s is e
qual
to th
e ca
rbon
con
tent
of h
arve
stTh
eref
ore,
2,2
18 (t
y-1)
Cal
cula
tion
by su
m o
f car
bon
cont
ent
of h
arve
sted
cor
n, su
gar c
ane
and
man
go.
27
N0
t y-1
0t y
-1N
itrog
en is
not
pro
vide
d by
pho
tosy
nthe
sis.
―-
(Inp
ut)
Nitr
ogen
fixa
tion
W―
―44
t y-1
Wei
ght i
s sam
e as
nitr
ogen
fixa
tion
rate
.―
28C
0t y
-10
t y-1
Car
bon
is n
ot p
rovi
ded
by n
itrog
en fi
xatio
n.―
-
N10
5kg
ha-1
y-1
44.2
t y-1
Nitr
ogen
fixa
tion
rate
is 1
0-20
0 (k
g ha
-1 y
-1)…
(1),
so, t
he a
vera
ge v
alue
is 1
05 (k
g ha
-1 y
-1).
Ther
efor
e, n
itrog
en fi
xatio
n ra
te (t
y-1)
= N
itrog
en fi
xatio
n ra
te (k
g ha
-1 y
-1) *
Are
a (h
a)/1
,000
= 10
5 (k
g ha
-1 y
-1) *
421
(ha)
/1,0
00≒
44.2
(t y
-1)
(1) S
yste
miz
atio
n Su
b-te
am, B
io-
Rec
ycle
Pro
ject
ed.
(200
6) :
Des
ign
and
Eval
uatio
n of
Bio
mas
s Use
Sy
stem
, pp.
30-
39
29
(Out
put)
Nitr
ogen
loss
by
emis
sion
(Bot
h am
mon
iavo
latil
izat
ion
and
deni
trific
atio
n)
W―
―8
t y-1
Wei
ght i
s alm
ost s
ame
as n
itrog
en lo
ss ra
te b
y em
issi
on.
―30
C0
t y-1
0t y
-1C
arbo
n is
not
lost
by
both
am
mon
ia v
olat
iliza
tion
and
deni
trific
atio
n.―
-
N18
kg h
a-1 y
-17.
6t y
-1
Nitr
ogen
loss
rate
by
emis
sion
is 5
-30
(kg
ha-1 y
-1)…
(1),
the
aver
age
valu
e is
18
(kg
ha-1 y
-1).
Ther
efor
e, n
itrog
en lo
ss ra
te b
y em
issi
on (t
y-1)
= N
itrog
en lo
ss ra
te b
y em
issi
on (k
g ha
-1 y
-1) *
Are
a (h
a)/1
,000
= 18
(kg
ha-1 y
-1) *
421
(ha)
/1,0
00≒
7.6
(t y-1
)
(1) S
yste
miz
atio
n Su
b-te
am,
Bio
-rec
ycle
Pro
ject
ed.
(200
6) :
Des
igna
nd E
valu
atio
n of
Bio
mas
s U
se S
yste
m, p
p. 3
0-39
31
(Out
put)
Car
bon
diox
ide
emis
sion
W―
―3,
859
t y-1
Ass
umpt
ion
that
car
bon
loss
is in
the
form
of c
arbo
n di
oxid
e.Th
eref
ore,
car
bon
diox
ide
emis
sion
(t y
-1)
= 44
/12
* C
arbo
n lo
ss (t
y-1)
≒3,
859
(t y-1
)
Cal
cula
tion
base
d on
the
mol
ecul
ar
form
ula
of c
arbo
n di
oxid
e32
C2,
500
kgC
ha-1
y-1
1,05
3t y
-1
Car
bon
loss
is 1
,500
-3,5
00 (k
gC h
a-1 y
-1)…
(1),
the
aver
age
valu
e is
2,5
00 (k
gC h
a-1 y
-1).
Ther
efor
e, c
arbo
n lo
ss (t
y-1)
= C
arbo
n lo
ss ra
te (k
g ha
-1 y
-1) *
Are
a (h
a)/1
,000
= 2,
500
(kg
ha-1 y
-1) *
421
(ha)
/1,0
00≒
1,05
3 (t
y-1)
(1) S
yste
miz
atio
n Su
b-te
am,
Bio
-rec
ycle
Pro
ject
ed.
(200
6) :
Des
igna
nd E
valu
atio
n of
Bio
mas
s U
se S
yste
m, p
p. 3
0-39
33
N0
t y-1
0t y
-1N
itrog
en is
not
lost
by
carb
on d
ioxi
de e
mis
sion
s.―
-
(Out
put)
Evap
otra
nspi
ratio
nW
――
5,54
5,66
5t y
-1
Ass
umpt
ion
that
70%
of p
reci
pita
tion
is e
vapo
trans
pira
tion,
Evap
otra
nspi
ratio
n ra
te (t
y-1)
= 0.
7 *
Prec
ipita
tion
rate
(t y
-1)
= 0.
7 *
7,92
2,37
8≒
5,54
5,66
5(t y
-1)
Rou
gh a
ssum
ptio
n34
(Out
put)
Perc
olat
ion
W―
―2,
377,
969
t y-1
Ass
umpt
ion
that
per
cola
tion
rate
(t y
-1)
= Pr
ecip
itatio
n ra
te (t
y-1) +
(App
licat
ion
rate
of d
iges
ted
slur
ry (u
sing
dig
este
d sl
urry
bec
ause
the
wat
er c
onte
nt o
fdi
gest
ed sl
urry
is g
reat
er th
an 9
8%))
- Ev
apot
rans
pira
tion
rate
(t y
-1)
≒2,
377,
969
(t y-1
)(C
ase
that
1,2
55 (t
y-1) o
f dig
este
d sl
urry
is u
sed)
Rou
gh a
ssum
ptio
n35
C0
t y-1
0t y
-1C
arbo
n is
not
lost
by
deni
trific
atio
n.―
-
N16
9.4
t y-1
50.8
t y-1
Nitr
ate
leac
hing
rate
is 2
0-40
%…
(1),
so th
e av
erag
e is
30%
.Th
eref
ore,
nitr
ate
leac
hing
rate
(t y
-1)
= N
itrog
en fe
rtiliz
atio
n ra
te (t
y-1) *
0.3
= 16
9.4
(t y-1
) * 0
.3≒
50.8
(t y
-1)
*Her
e, n
itrog
en fe
rtiliz
atio
n in
dica
tes b
y ch
emic
al fe
rtiliz
er, c
ompo
st a
nd sl
urry
.
(1) S
yste
miz
atio
n Su
b-te
am, B
io-
recy
cle
Proj
ect e
d. (2
006)
: D
esig
n an
d Ev
alua
tion
of B
iom
ass U
se
Syst
em, p
p. 3
0-39
36
農研機構研究報告 農村工学研究部門 第 1 号 (平成 29 年 3 月) ORITATE Fumiko:Use of Digested Slurry from Livestock Manure in Paddy Fields and its Environmental Effect in Southeast Asia182 183
ブック 1.indb 182 2017/03/22 10:05:55

Ap
pen
dix
1-3
Bas
es o
f d
ata
used
fo
r re
gio
nal d
iag
nosi
s (li
vest
ock
was
tes
com
par
tmen
t)
Dat
a re
quire
dC
ompo
nent
Spec
ific
valu
eTo
tal a
mou
ntPr
oces
s of c
alcu
latio
nD
ata/
info
rmat
ion
sour
ces
No.
Valu
eU
nit
Valu
eU
nit
Num
ber o
f pig
s―
――
11,0
00he
ad―
Inte
rvie
ws o
f VPC
and
Vill
ager
s1
Gen
erat
ion
rate
of
fece
s (pi
g)
W0.
73t h
ead-1
y-1
8,03
0t y
-1
Gen
erat
ion
rate
is 1
.0-3
.0 (k
g he
ad-1 d
-1)…
(1),
so th
e av
erag
e is
2.0
(kg
head
-1 d
-1)
= 0.
73 (t
hea
d-1 y
-1)
Ther
efor
e, ra
w w
eigh
t (t y
-1)
= G
ener
atio
n ra
te (t
hea
d-1 y
-1) *
Num
bers
(hea
d)
= 0.
73 *
11,
000
= 8,
030
(t y-1
)
(1) N
guye
n T.
H. L
. (19
94) :
Stu
dy
on p
ollu
tant
sin
was
tes f
rom
med
ium
-sc
ale
pig
farm
s and
app
licat
ion
of
was
te tr
eatm
ent m
etho
ds fo
r the
pi
gger
y fa
rms,
Doc
tora
l dis
serta
tion,
N
ong
Lam
Uni
vers
ity in
Ho
Chi
M
inh
City
2
C18
.68
%45
9t y
-1
Rat
io o
f car
bon
to n
itrog
en is
20-
25, a
nd n
itrog
en c
once
ntra
tion
unde
r dry
con
ditio
ns is
0.8
3 (%
).…(1
)Th
eref
ore,
car
bon
conc
entra
tion
in d
ry c
ondi
tions
is 1
8.68
(%) i
n av
erag
e.W
ater
con
tent
of r
aw fe
ces i
s 69.
4 (%
).…(2
)Th
eref
ore,
car
bon
cont
ent
= R
aw w
eigh
t (t y
-1) *
(1-w
ater
con
tent
(%))
* C
arbo
n co
ncen
tratio
n un
der d
ry c
ondi
tions
(%)
= 8,
030
(t y-1
) * (1
-69.
4/10
0) *
18.
68/1
00
≒45
9 (t
y-1)
(1) N
go K
. S. a
nd N
guye
n L.
D.
(199
7) :
Bio
gas p
rodu
ctio
n us
ing
anae
robi
c di
gest
ion,
Boo
k of
A
gric
ultu
re P
ublis
hing
Hou
se, H
o C
hi M
inh
City
(2) N
akam
ura
M. e
t al.
(200
5) :
Dev
elop
men
t of a
com
posi
tion
data
base
for v
ario
us ty
pes o
f bi
omas
s, Te
chni
cal R
epor
t of
the
Nat
iona
l Ins
titut
e fo
r Rur
al
Engi
neer
ing,
pp.
57-
80
3
N0.
83%
20.4
t y-1
Nitr
ogen
con
cent
ratio
n un
der d
ry c
ondi
tions
is 0
.83
(%)…
(1)
Wat
er c
onte
nt o
f raw
fece
s is 6
9.4
(%).…
(2)
Ther
efor
e, n
itrog
en c
onte
nt
= R
aw w
eigh
t (t y
-1) *
(1-w
ater
con
tent
(%))
* N
itrog
en c
once
ntra
tion
unde
r dry
con
ditio
ns (%
)=
8,03
0 (t
y-1) *
(1-6
9.4/
100)
* 0
.83/
100
≒20
.4 (t
y-1)
(1) N
go K
. S. a
nd N
guye
n L.
D.
(199
7) :
Bio
gas p
rodu
ctio
n us
ing
anae
robi
c di
gest
ion,
Boo
k of
A
gric
ultu
re P
ublis
hing
Hou
se, H
o C
hi M
inh
City
(2) N
akam
ura
M. e
t al.
(200
5) :
Dev
elop
men
t of a
com
posi
tion
data
base
for v
ario
us ty
pes o
f bi
omas
s, Te
chni
cal R
epor
t of
the
Nat
iona
l Ins
titut
e fo
r Rur
al
Engi
neer
ing,
pp.
57-
80
4
Gen
erat
ion
rate
of
urin
e (p
ig)
W0.
49t h
ead-1
y-1
5,39
0t y
-1
Gen
erat
ion
rate
is 0
.7-2
.0 (k
g he
ad-1 d
-1 )…(1
), so
the
aver
age
is 1
.35
(kg
head
-1 d
-1)
≒0.
49 (t
hea
d-1 y
-1).
Ther
efor
e, ra
w w
eigh
t (t y
-1)
= G
ener
atio
n ra
te (t
hea
d-1 y
-1) *
Num
bers
(hea
d)
= 0.
49 *
11,
000
= 5,
390
(t y-1
)
(1) N
guye
n T.
H. L
. (19
94) :
Stu
dy
on p
ollu
tant
sin
was
tes f
rom
med
ium
-sc
ale
pig
farm
s and
app
licat
ion
of
was
te tr
eatm
ent m
etho
ds fo
r the
pi
gger
y fa
rms,
Doc
tora
l dis
serta
tion,
N
ong
Lam
Uni
vers
ity in
Ho
Chi
M
inh
City
5
C0
―0
t y-1
Car
bon
is n
ot c
onta
ined
in u
rine.
―
N32
.5%
35.0
t y-1
Nitr
ogen
con
cent
ratio
n un
der d
ry c
ondi
tions
is 3
2.5%
, and
wat
er c
onte
nt o
f raw
urin
e is
98.
0%.…
(1)
Ther
efor
e, n
itrog
en c
onte
nt
= R
aw w
eigh
t (t y
-1) *
(1-w
ater
con
tent
(%))
* N
itrog
en c
once
ntra
tion
unde
r dry
con
ditio
ns (%
) =
5,39
0 (t
y-1) *
(1-9
8.0/
100)
* 3
2.5/
100
≒35
.0 (t
y-1)
(1) N
akam
ura
M. e
t al.
(200
5) :
Dev
elop
men
t of a
com
posi
tion
data
base
for v
ario
us ty
pes o
f bi
omas
s, Te
chni
cal R
epor
t of
the
Nat
iona
l Ins
titut
e fo
r Rur
al
Engi
neer
ing,
pp.
57-
80
6
Num
ber o
f bee
f―
――
1,65
9he
ad―
Inte
rvie
ws o
f VPC
and
Vill
ager
s7
農研機構研究報告 農村工学研究部門 第 1 号 (平成 29 年 3 月) ORITATE Fumiko:Use of Digested Slurry from Livestock Manure in Paddy Fields and its Environmental Effect in Southeast Asia182 183
ブック 1.indb 183 2017/03/22 10:05:55
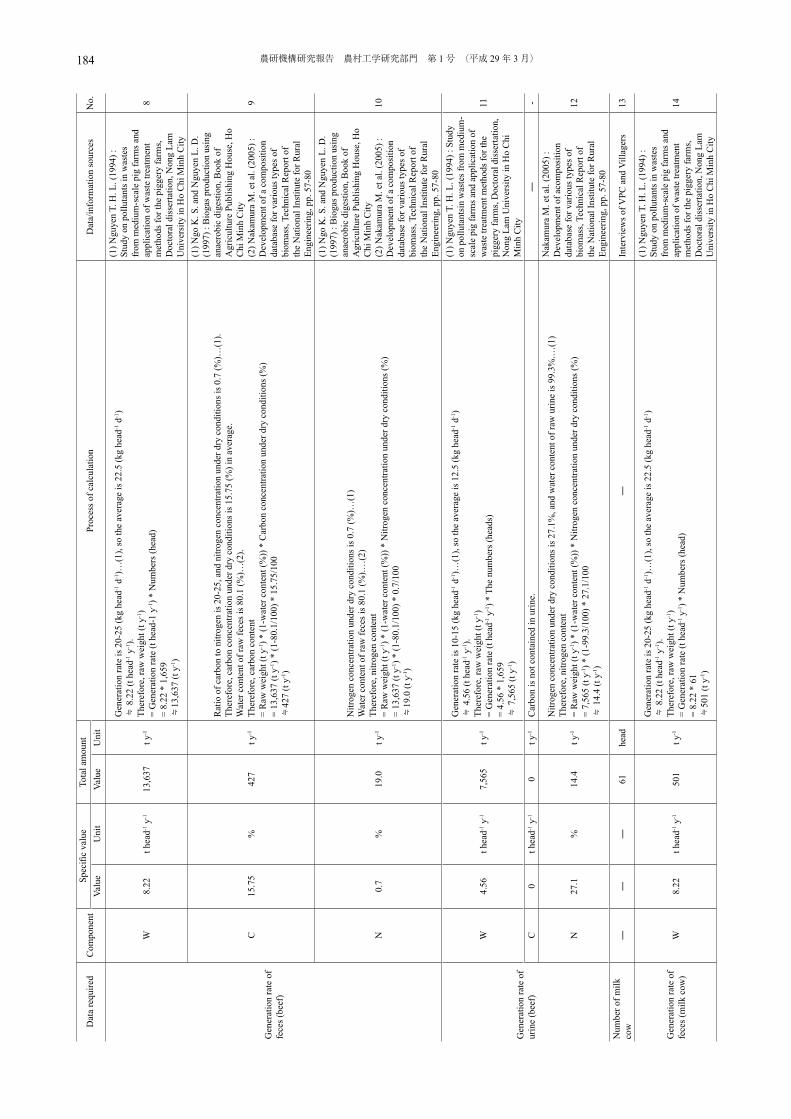
Dat
a re
quire
dC
ompo
nent
Spec
ific
valu
eTo
tal a
mou
ntPr
oces
s of c
alcu
latio
nD
ata/
info
rmat
ion
sour
ces
No.
Valu
eU
nit
Valu
eU
nit
Gen
erat
ion
rate
of
fece
s (be
ef)
W8.
22t h
ead-1
y-1
13,6
37t y
-1
Gen
erat
ion
rate
is 2
0-25
(kg
head
-1 d
-1)…
(1),
so th
e av
erag
e is
22.
5 (k
g he
ad-1 d
-1)
≒ 8
.22
(t he
ad-1 y
-1).
Ther
efor
e, ra
w w
eigh
t (t y
-1)
= G
ener
atio
n ra
te (t
hea
d-1
y-1) *
Num
bers
(hea
d)
= 8.
22 *
1,6
59≒
13,6
37 (t
y-1)
(1) N
guye
n T.
H. L
. (19
94) :
St
udy
on p
ollu
tant
s in
was
tes
from
med
ium
-sca
le p
ig fa
rms a
nd
appl
icat
ion
of w
aste
trea
tmen
t m
etho
ds fo
r the
pig
gery
farm
s, D
octo
ral d
isse
rtatio
n, N
ong
Lam
U
nive
rsity
in H
o C
hi M
inh
City
8
C15
.75
%42
7t y
-1
Rat
io o
f car
bon
to n
itrog
en is
20-
25, a
nd n
itrog
en c
once
ntra
tion
unde
r dry
con
ditio
ns is
0.7
(%)…
(1).
Ther
efor
e, c
arbo
n co
ncen
tratio
n un
der d
ry c
ondi
tions
is 1
5.75
(%) i
n av
erag
e.W
ater
con
tent
of r
aw fe
ces i
s 80.
1 (%
)…(2
).Th
eref
ore,
car
bon
cont
ent
= R
aw w
eigh
t (t y
-1) *
(1-w
ater
con
tent
(%))
* C
arbo
n co
ncen
tratio
n un
der d
ry c
ondi
tions
(%)
= 13
,637
(t y
-1) *
(1-8
0.1/
100)
* 1
5.75
/100
≒
427
(t y-1
)
(1) N
go K
. S. a
nd N
guye
n L.
D.
(199
7) :
Bio
gas p
rodu
ctio
n us
ing
anae
robi
c di
gest
ion,
Boo
k of
A
gric
ultu
re P
ublis
hing
Hou
se, H
o C
hi M
inh
City
(2) N
akam
ura
M. e
t al.
(200
5) :
Dev
elop
men
t of a
com
posi
tion
data
base
for v
ario
us ty
pes o
f bi
omas
s, Te
chni
cal R
epor
t of
the
Nat
iona
l Ins
titut
e fo
r Rur
al
Engi
neer
ing,
pp.
57-
80
9
N0.
7%
19.0
t y-1
Nitr
ogen
con
cent
ratio
n un
der d
ry c
ondi
tions
is 0
.7 (%
)…(1
)W
ater
con
tent
of r
aw fe
ces i
s 80.
1 (%
).…(2
)Th
eref
ore,
nitr
ogen
con
tent
=
Raw
wei
ght (
t y-1) *
(1-w
ater
con
tent
(%))
* N
itrog
en c
once
ntra
tion
unde
r dry
con
ditio
ns (%
) =
13,6
37 (t
y-1) *
(1-8
0.1/
100)
* 0
.7/1
00
≒19
.0 (t
y-1)
(1) N
go K
. S. a
nd N
guye
n L.
D.
(199
7) :
Bio
gas p
rodu
ctio
n us
ing
anae
robi
c di
gest
ion,
Boo
k of
A
gric
ultu
re P
ublis
hing
Hou
se, H
o C
hi M
inh
City
(2) N
akam
ura
M. e
t al.
(200
5) :
Dev
elop
men
t of a
com
posi
tion
data
base
for v
ario
us ty
pes o
f bi
omas
s, Te
chni
cal R
epor
t of
the
Nat
iona
l Ins
titut
e fo
r Rur
al
Engi
neer
ing,
pp.
57-
80
10
Gen
erat
ion
rate
of
urin
e (b
eef)
W4.
56t h
ead-1
y-1
7,56
5t y
-1
Gen
erat
ion
rate
is 1
0-15
(kg
head
-1 d
-1)…
(1),
so th
e av
erag
e is
12.
5 (k
g he
ad-1 d
-1)
≒ 4
.56
(t he
ad-1 y
-1).
Ther
efor
e, ra
w w
eigh
t (t y
-1)
= G
ener
atio
n ra
te (t
hea
d-1 y
-1) *
The
num
bers
(hea
ds)
= 4.
56 *
1,6
59
≒ 7
,565
(t y
-1)
(1) N
guye
n T.
H. L
. (19
94) :
Stu
dy
on p
ollu
tant
sin
was
tes f
rom
med
ium
-sc
ale
pig
farm
s and
app
licat
ion
of
was
te tr
eatm
ent m
etho
ds fo
r the
pi
gger
y fa
rms,
Doc
tora
l dis
serta
tion,
N
ong
Lam
Uni
vers
ity in
Ho
Chi
M
inh
City
11
C0
t hea
d-1 y
-10
t y-1
Car
bon
is n
ot c
onta
ined
in u
rine.
―-
N27
.1%
14.4
t y-1
Nitr
ogen
con
cent
ratio
n un
der d
ry c
ondi
tions
is 2
7.1%
, and
wat
er c
onte
nt o
f raw
urin
e is
99.
3%.…
(1)
Ther
efor
e, n
itrog
en c
onte
nt=
Raw
wei
ght (
t y-1) *
(1-w
ater
con
tent
(%))
* N
itrog
en c
once
ntra
tion
unde
r dry
con
ditio
ns (%
) =
7,56
5 (t
y-1) *
(1-9
9.3/
100)
* 2
7.1/
100
≒ 1
4.4
(t y-1
)
Nak
amur
a M
. et a
l. (2
005)
: D
evel
opm
ent o
f aco
mpo
sitio
n da
taba
se fo
r var
ious
type
s of
biom
ass,
Tech
nica
l Rep
ort o
f th
e N
atio
nal I
nstit
ute
for R
ural
En
gine
erin
g, p
p. 5
7-80
12
Num
ber o
f milk
co
w―
――
61he
ad―
Inte
rvie
ws o
f VPC
and
Vill
ager
s13
Gen
erat
ion
rate
of
fece
s (m
ilk c
ow)
W8.
22t h
ead-1
y-1
501
t y-1
Gen
erat
ion
rate
is 2
0-25
(kg
head
-1 d
-1)…
(1),
so th
e av
erag
e is
22.
5 (k
g he
ad-1 d
-1)
≒ 8
.22
(t he
ad-1 y
-1).
Ther
efor
e, ra
w w
eigh
t (t y
-1)
= G
ener
atio
n ra
te (t
hea
d-1 y
-1) *
Num
bers
(hea
d)
= 8.
22 *
61
≒50
1 (t
y-1)
(1) N
guye
n T.
H. L
. (19
94) :
St
udy
on p
ollu
tant
s in
was
tes
from
med
ium
-sca
le p
ig fa
rms a
nd
appl
icat
ion
of w
aste
trea
tmen
t m
etho
ds fo
r the
pig
gery
farm
s, D
octo
ral d
isse
rtatio
n, N
ong
Lam
U
nive
rsity
in H
o C
hi M
inh
City
14
農研機構研究報告 農村工学研究部門 第 1 号 (平成 29 年 3 月) ORITATE Fumiko:Use of Digested Slurry from Livestock Manure in Paddy Fields and its Environmental Effect in Southeast Asia184 185
ブック 1.indb 184 2017/03/22 10:05:55
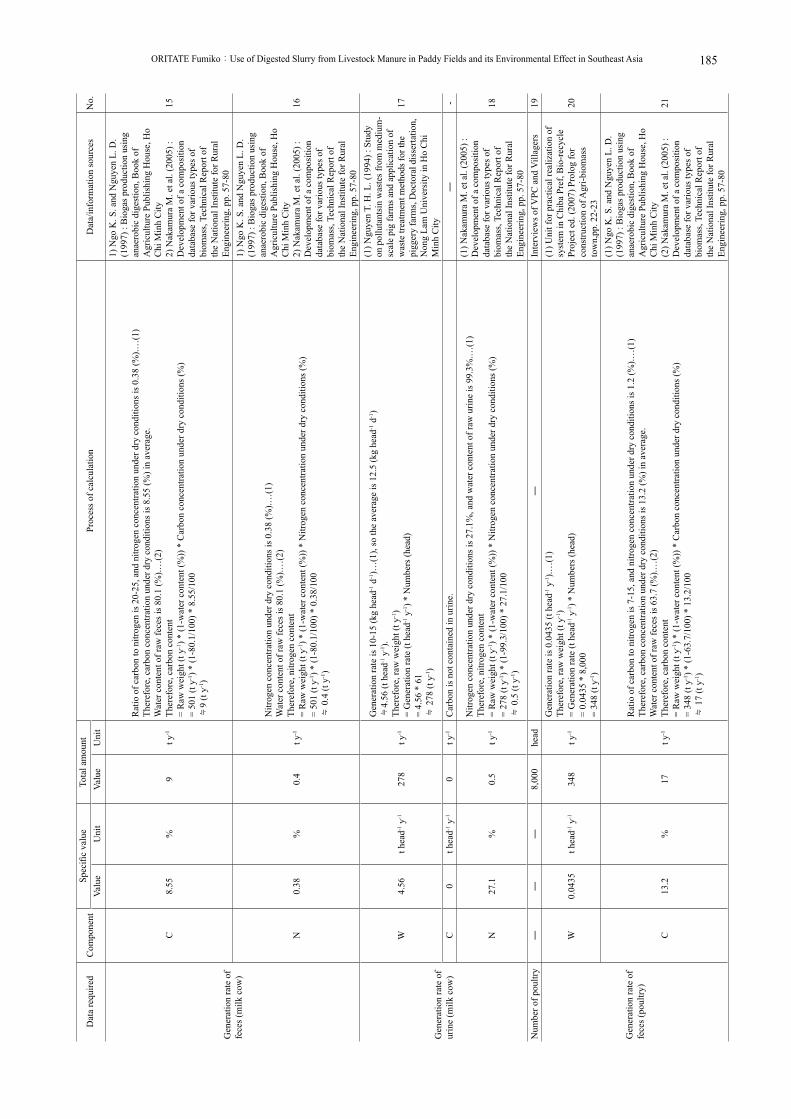
Dat
a re
quire
dC
ompo
nent
Spec
ific
valu
eTo
tal a
mou
ntPr
oces
s of c
alcu
latio
nD
ata/
info
rmat
ion
sour
ces
No.
Valu
eU
nit
Valu
eU
nit
Gen
erat
ion
rate
of
fece
s (m
ilk c
ow)
C8.
55%
9t y
-1
Rat
io o
f car
bon
to n
itrog
en is
20-
25, a
nd n
itrog
en c
once
ntra
tion
unde
r dry
con
ditio
ns is
0.3
8 (%
).…(1
)Th
eref
ore,
car
bon
conc
entra
tion
unde
r dry
con
ditio
ns is
8.5
5 (%
) in
aver
age.
Wat
er c
onte
nt o
f raw
fece
s is 8
0.1
(%).…
(2)
Ther
efor
e, c
arbo
n co
nten
t =
Raw
wei
ght (
t y-1) *
(1-w
ater
con
tent
(%))
* C
arbo
n co
ncen
tratio
n un
der d
ry c
ondi
tions
(%)
= 50
1 (t
y-1) *
(1-8
0.1/
100)
* 8
.55/
100
≒9
(t y-1
)
1) N
go K
. S. a
nd N
guye
n L.
D.
(199
7) :
Bio
gas p
rodu
ctio
n us
ing
anae
robi
c di
gest
ion,
Boo
k of
A
gric
ultu
re P
ublis
hing
Hou
se, H
o C
hi M
inh
City
2) N
akam
ura
M. e
t al.
(200
5) :
Dev
elop
men
t of a
com
posi
tion
data
base
for v
ario
us ty
pes o
f bi
omas
s, Te
chni
cal R
epor
t of
the
Nat
iona
l Ins
titut
e fo
r Rur
al
Engi
neer
ing,
pp.
57-
80
15
N0.
38%
0.4
t y-1
Nitr
ogen
con
cent
ratio
n un
der d
ry c
ondi
tions
is 0
.38
(%).…
(1)
Wat
er c
onte
nt o
f raw
fece
s is 8
0.1
(%).…
(2)
Ther
efor
e, n
itrog
en c
onte
nt
= R
aw w
eigh
t (t y
-1) *
(1-w
ater
con
tent
(%))
* N
itrog
en c
once
ntra
tion
unde
r dry
con
ditio
ns (%
) =
501
(t y-1
) * (1
-80.
1/10
0) *
0.3
8/10
0 ≒
0.4
(t y
-1)
1) N
go K
. S. a
nd N
guye
n L.
D.
(199
7) :
Bio
gas p
rodu
ctio
n us
ing
anae
robi
c di
gest
ion,
Boo
k of
A
gric
ultu
re P
ublis
hing
Hou
se, H
o C
hi M
inh
City
2) N
akam
ura
M. e
t al.
(200
5) :
Dev
elop
men
t of a
com
posi
tion
data
base
for v
ario
us ty
pes o
f bi
omas
s, Te
chni
cal R
epor
t of
the
Nat
iona
l Ins
titut
e fo
r Rur
al
Engi
neer
ing,
pp.
57-
80
16
Gen
erat
ion
rate
of
urin
e (m
ilk c
ow)
W4.
56t h
ead-1
y-1
278
t y-1
Gen
erat
ion
rate
is 1
0-15
(kg
head
-1 d
-1)…
(1),
so th
e av
erag
e is
12.
5 (k
g he
ad-1 d
-1)
≒4.
56 (t
hea
d-1 y
-1).
Ther
efor
e, ra
w w
eigh
t (t y
-1)
= G
ener
atio
n ra
te (t
hea
d-1 y
-1) *
Num
bers
(hea
d)
= 4.
56 *
61
≒ 2
78 (t
y-1)
(1) N
guye
n T.
H. L
. (19
94) :
Stu
dy
on p
ollu
tant
sin
was
tes f
rom
med
ium
-sc
ale
pig
farm
s and
app
licat
ion
of
was
te tr
eatm
ent m
etho
ds fo
r the
pi
gger
y fa
rms,
Doc
tora
l dis
serta
tion,
N
ong
Lam
Uni
vers
ity in
Ho
Chi
M
inh
City
17
C0
t hea
d-1 y
-10
t y-1
Car
bon
is n
ot c
onta
ined
in u
rine.
―-
N27
.1%
0.5
t y-1
Nitr
ogen
con
cent
ratio
n un
der d
ry c
ondi
tions
is 2
7.1%
, and
wat
er c
onte
nt o
f raw
urin
e is
99.
3%.…
(1)
Ther
efor
e, n
itrog
en c
onte
nt
= R
aw w
eigh
t (t y
-1) *
(1-w
ater
con
tent
(%))
* N
itrog
en c
once
ntra
tion
unde
r dry
con
ditio
ns (%
) =
278
(t y-1
) * (1
-99.
3/10
0) *
27.
1/10
0 ≒
0.5
(t y
-1)
(1) N
akam
ura
M. e
t al.
(200
5) :
Dev
elop
men
t of a
com
posi
tion
data
base
for v
ario
us ty
pes o
f bi
omas
s, Te
chni
cal R
epor
t of
the
Nat
iona
l Ins
titut
e fo
r Rur
al
Engi
neer
ing,
pp.
57-
80
18
Num
ber o
f pou
ltry
――
―8,
000
head
―In
terv
iew
s of V
PC a
nd V
illag
ers
19
Gen
erat
ion
rate
of
fece
s (po
ultry
)
W0.
0435
t hea
d-1 y
-134
8t y
-1
Gen
erat
ion
rate
is 0
.043
5 (t
head
-1 y
-1).…
(1)
Ther
efor
e, ra
w w
eigh
t (t y
-1)
= G
ener
atio
n ra
te (t
hea
d-1 y
-1) *
Num
bers
(hea
d)
= 0.
0435
* 8
,000
=
348
(t y-1
)
(1) U
nit f
or p
ract
ical
real
izat
ion
of
syst
em in
Chi
ba P
ref,
Bio
-rec
ycle
Pr
ojec
t ed.
(200
7) P
rolo
g fo
r co
nstru
ctio
n of
Agr
i-bio
mas
s to
wn,
pp. 2
2-23
20
C13
.2%
17t y
-1
Rat
io o
f car
bon
to n
itrog
en is
7-1
5, a
nd n
itrog
en c
once
ntra
tion
unde
r dry
con
ditio
ns is
1.2
(%).…
(1)
Ther
efor
e, c
arbo
n co
ncen
tratio
n un
der d
ry c
ondi
tions
is 1
3.2
(%) i
n av
erag
e.W
ater
con
tent
of r
aw fe
ces i
s 63.
7 (%
).…(2
)Th
eref
ore,
car
bon
cont
ent
= R
aw w
eigh
t (t y
-1) *
(1-w
ater
con
tent
(%))
* C
arbo
n co
ncen
tratio
n un
der d
ry c
ondi
tions
(%)
= 34
8 (t
y-1) *
(1-6
3.7/
100)
* 1
3.2/
100
≒ 1
7 (t
y-1)
(1) N
go K
. S. a
nd N
guye
n L.
D.
(199
7) :
Bio
gas p
rodu
ctio
n us
ing
anae
robi
c di
gest
ion,
Boo
k of
A
gric
ultu
re P
ublis
hing
Hou
se, H
o C
hi M
inh
City
(2) N
akam
ura
M. e
t al.
(200
5) :
Dev
elop
men
t of a
com
posi
tion
data
base
for v
ario
us ty
pes o
f bi
omas
s, Te
chni
cal R
epor
t of
the
Nat
iona
l Ins
titut
e fo
r Rur
al
Engi
neer
ing,
pp.
57-
80
21
農研機構研究報告 農村工学研究部門 第 1 号 (平成 29 年 3 月) ORITATE Fumiko:Use of Digested Slurry from Livestock Manure in Paddy Fields and its Environmental Effect in Southeast Asia184 185
ブック 1.indb 185 2017/03/22 10:05:55

Dat
a re
quire
dC
ompo
nent
Spec
ific
valu
eTo
tal a
mou
ntPr
oces
s of c
alcu
latio
nD
ata/
info
rmat
ion
sour
ces
No.
Valu
eU
nit
Valu
eU
nit
Gen
erat
ion
rate
of
fece
s (po
ultry
)N
1.2
%1.
5t y
-1
Nitr
ogen
con
cent
ratio
n un
der d
ry c
ondi
tions
is 1
.2 (%
).…(1
)W
ater
con
tent
of r
aw fe
ces i
s 63.
7 (%
).…(2
)Th
eref
ore,
nitr
ogen
con
tent
=
Raw
wei
ght (
t y-1) *
(1-w
ater
con
tent
(%))
* N
itrog
en c
once
ntra
tion
unde
r dry
con
ditio
ns (%
) =
348
(t y-1
) * (1
-63.
7/10
0) *
1.2
0/10
0 ≒
1.5
(t y
-1)
(1) N
go K
. S. a
nd N
guye
n L.
D.
(199
7) :
Bio
gas p
rodu
ctio
n us
ing
anae
robi
c di
gest
ion,
Boo
k of
A
gric
ultu
re P
ublis
hing
Hou
se, H
o C
hi M
inh
City
(2) N
akam
ura
M. e
t al.
(200
5) :
Dev
elop
men
t of a
com
posi
tion
data
base
for v
ario
us ty
pes o
f bi
omas
s, Te
chni
cal R
epor
t of
the
Nat
iona
l Ins
titut
e fo
r Rur
al
Engi
neer
ing,
pp.
57-
80
22
Num
ber o
f buf
falo
――
―40
0he
ad―
Inte
rvie
ws o
f VPC
and
Vill
ager
s23
Gen
erat
ion
rate
of
fece
s (bu
ffalo
)
W8.
22t h
ead-1
y-1
3,28
8t y
-1
Gen
erat
ion
rate
is 2
0-25
(kg
head
-1 d
-1)…
(1),
so th
e av
erag
e is
22.
5 (k
g he
ad-1 d
-1)
≒8.
22 (t
hea
d-1 y
-1).
Ther
efor
e, ra
w w
eigh
t (t y
-1)
= G
ener
atio
n ra
te (t
hea
d-1 y
-1) *
Num
bers
(hea
d)
= 8.
22 *
400
=
3,28
8 (t
y-1)
(1) N
guye
n T.
H. L
. (19
94) :
St
udy
on p
ollu
tant
s in
was
tes
from
med
ium
-sca
le p
ig fa
rms a
nd
appl
icat
ion
of w
aste
trea
tmen
t m
etho
ds fo
r the
pig
gery
farm
s, D
octo
ral d
isse
rtatio
n, N
ong
Lam
U
nive
rsity
in H
o C
hi M
inh
City
24
C6.
98%
46t y
-1
Rat
io o
f car
bon
to n
itrog
en is
20-
25 o
n th
e ass
umpt
ion
that
the v
alue
of b
uffa
lo is
sam
e as b
eef,
and
nitro
gen
conc
entra
tion
unde
r dry
con
ditio
ns 0
.31
(%).…
(1)
Ther
efor
e, c
arbo
n co
ncen
tratio
n un
der d
ry c
ondi
tions
is 6
.98
(%) i
n av
erag
e.W
ater
con
tent
of r
aw fe
ces i
s 80.
1 (%
).…(2
)Th
eref
ore,
car
bon
cont
ent
= R
aw w
eigh
t (t y
-1) *
(1-w
ater
con
tent
(%))
* C
arbo
n co
ncen
tratio
n un
der d
ry c
ondi
tions
(%)
= 3,
288
(t y-1
) * (1
-80.
1/10
0) *
6.9
8/10
0 ≒
46
(t y-1
)
(1) N
go K
. S. a
nd N
guye
n L.
D.
(199
7) :
Bio
gas p
rodu
ctio
n us
ing
anae
robi
c di
gest
ion,
Boo
k of
A
gric
ultu
re P
ublis
hing
Hou
se, H
o C
hi M
inh
City
(2) N
akam
ura
M. e
t al.
(200
5) :
Dev
elop
men
t of a
com
posi
tion
data
base
for v
ario
us ty
pes o
f bi
omas
s, Te
chni
cal R
epor
t of
the
Nat
iona
l Ins
titut
e fo
r Rur
al
Engi
neer
ing,
pp.
57-
80
25
N0.
31%
2.0
t y-1
Nitr
ogen
con
cent
ratio
n un
der d
ry c
ondi
tions
is 0
.31
(%).…
(1)
wat
er c
onte
nt o
f raw
fece
s is 8
0.1
(%).…
(2)
Ther
efor
e, n
itrog
en c
onte
nt
= R
aw w
eigh
t (t y
-1) *
(1-w
ater
con
tent
(%))
* N
itrog
en c
once
ntra
tion
und
cond
ition
s (%
) =
3,28
8 (t
y-1) *
(1-8
0.1/
100)
* 0
.31/
100
≒ 2
.0 (t
y-1)
(1) N
go K
. S. a
nd N
guye
n L.
D.
(199
7) :
Bio
gas p
rodu
ctio
n us
ing
anae
robi
c di
gest
ion,
Boo
k of
A
gric
ultu
re P
ublis
hing
Hou
se, H
o C
hi M
inh
City
(2) N
akam
ura
M. e
t al.
(200
5) :
Dev
elop
men
t of a
com
posi
tion
data
base
for v
ario
us ty
pes o
f bi
omas
s, Te
chni
cal R
epor
t of
the
Nat
iona
l Ins
titut
e fo
r Rur
al
Engi
neer
ing,
pp.
57-
80
26
Gen
erat
ion
rate
of
urin
e (b
uffa
lo)
W4.
56t h
ead-1
y-1
1,82
4t y
-1
Gen
erat
ion
rate
is 1
0-15
(kg
head
-1 d
-1)…
(1),
so th
e av
erag
e is
12.
5 (k
g he
ad-1 d
-1)
≒4.
56 (t
hea
d-1 y
-1).
Ther
efor
e, ra
w w
eigh
t (t y
-1)
= G
ener
atio
n ra
te (t
hea
d-1 y
-1) *
Num
bers
(hea
d)
= 4.
56 *
400
=
1,82
4 (t
y-1)
(1) N
guye
n T.
H. L
. (19
94) :
St
udy
on p
ollu
tant
s in
was
tes
from
med
ium
-sca
le p
ig fa
rms a
nd
appl
icat
ion
of w
aste
trea
tmen
t m
etho
ds fo
r the
pig
gery
farm
s, D
octo
ral d
isse
rtatio
n, N
ong
Lam
U
nive
rsity
in H
o C
hi M
inh
City
27
C0
t hea
d-1 y
-10
t y-1
Car
bon
is n
ot c
onta
ined
in u
rine.
―-
N27
.1%
3.5
t y-1
Nitr
ogen
con
cent
ratio
n un
der d
ry c
ondi
tions
is 2
7.1
(%),
and
wat
er c
onte
nt o
f raw
urin
e is
99.
3 (%
).…(1
)Th
eref
ore,
nitr
ogen
con
tent
=
Raw
wei
ght (
t y-1) *
(1-w
ater
con
tent
(%))
* N
itrog
en c
once
ntra
tion
unde
r dry
con
ditio
ns (%
)=
1,82
4 (t
y-1) *
(1-9
9.3/
100)
* 2
7.1/
100
≒ 3
.5 (t
y-1)
(1) N
akam
ura
M. e
t al.
(200
5) :
Dev
elop
men
t of a
com
posi
tion
data
base
for v
ario
us ty
pes o
f bi
omas
s, Te
chni
cal R
epor
t of
the
Nat
iona
l Ins
titut
e fo
r Rur
al
Engi
neer
ing,
pp.
57-
80
28
農研機構研究報告 農村工学研究部門 第 1 号 (平成 29 年 3 月) ORITATE Fumiko:Use of Digested Slurry from Livestock Manure in Paddy Fields and its Environmental Effect in Southeast Asia186 187
ブック 1.indb 186 2017/03/22 10:05:55

Appendix 2 Calculation procedures of cost for fertilization
Appendix 2-1 Operation costs
1. Conventional cultivation with chemical fertilizer
(1) Area: 2,500 m2
An area of 2,500 m2 was set to optimize the transportation of chemical fertilizer as shown (3) below.
(2) Weight and price of chemical fertilizera. The first additional fertilization Weight of phosphorus fertilizer: 50 g m-2 × 2,500 m2 = 125,000 g Price of phosphorus fertilizer: 125,000 g × 0.14 USD kg-1 = 17.50 USD Weight of Urea: 10 g m-2 × 2,500 m2 = 25,000 g Price of Urea: 25,000 g × 0.48 USD kg-1 = 12.00 USD Subtotal weight: 125,000 g + 25,000 g = 150,000 g Subtotal price: 17.50 USD + 12.0 USD = 29.50 USD
b. The second additional fertilization Weight of mixed fertilizer: 20 g m-2 × 2,500 m2 = 50,000g Price of mixed fertilizer: 50,000 g × 0.72 USD kg-1 = 36.00 USD
c. The third additional fertilization Weight of mixed fertilizer: 10 g m-2 × 2,500 m2 = 25,000 g Price of mixed fertilizer: 25,000 g × 0.72 USD kg-1 = 18.00 USD Weight of potash fertilizer: 4 g m-2 × 2,500 m2 = 10,000 g Price of potash fertilizer: 10,000 g × 0.50 USD kg-1 = 5.00 USD Subtotal weight: 25,000 g + 10,000 g = 35,000 g Subtotal price: 18.00 USD + 5.00 USD = 23.00 USD
Total weight: 235,000 g Total price: 88.50 USD
(3) Transportation a. The first additional fertilization 150,000 g ÷ 50 kg shuttle-1 = 3 shuttles
b. The second additional fertilization 50,000 g ÷ 50 kg shuttle-1 = 1 shuttle
c. The third additional fertilization 35,000 g ÷ 50 kg shuttle-1 = 0.7≒1 shuttle
Total: 5 shuttles Total time: 5 shuttles × 10 min shuttle-1 = 50 min Fuel consumption for a motor-cycle: 1.7 × 10⁻² (L min-1) × 50 min=0.85 L Gasoline cost: 0.85 L × 1.06 USD L-1 = 0.90 USD Labor cost: 50 min × 1.19 USD h-1 person-1 = 0.99 USD Subtotal cost: 0.90 USD + 0.99 USD = 1.89 USD
Dat
a re
quire
dC
ompo
nent
Spec
ific
valu
eTo
tal a
mou
ntPr
oces
s of c
alcu
latio
nD
ata/
info
rmat
ion
sour
ces
No.
Valu
eU
nit
Valu
eU
nit
Gen
erat
ion
rate
of
fece
s (po
ultry
)N
1.2
%1.
5t y
-1
Nitr
ogen
con
cent
ratio
n un
der d
ry c
ondi
tions
is 1
.2 (%
).…(1
)W
ater
con
tent
of r
aw fe
ces i
s 63.
7 (%
).…(2
)Th
eref
ore,
nitr
ogen
con
tent
=
Raw
wei
ght (
t y-1) *
(1-w
ater
con
tent
(%))
* N
itrog
en c
once
ntra
tion
unde
r dry
con
ditio
ns (%
) =
348
(t y-1
) * (1
-63.
7/10
0) *
1.2
0/10
0 ≒
1.5
(t y
-1)
(1) N
go K
. S. a
nd N
guye
n L.
D.
(199
7) :
Bio
gas p
rodu
ctio
n us
ing
anae
robi
c di
gest
ion,
Boo
k of
A
gric
ultu
re P
ublis
hing
Hou
se, H
o C
hi M
inh
City
(2) N
akam
ura
M. e
t al.
(200
5) :
Dev
elop
men
t of a
com
posi
tion
data
base
for v
ario
us ty
pes o
f bi
omas
s, Te
chni
cal R
epor
t of
the
Nat
iona
l Ins
titut
e fo
r Rur
al
Engi
neer
ing,
pp.
57-
80
22
Num
ber o
f buf
falo
――
―40
0he
ad―
Inte
rvie
ws o
f VPC
and
Vill
ager
s23
Gen
erat
ion
rate
of
fece
s (bu
ffalo
)
W8.
22t h
ead-1
y-1
3,28
8t y
-1
Gen
erat
ion
rate
is 2
0-25
(kg
head
-1 d
-1)…
(1),
so th
e av
erag
e is
22.
5 (k
g he
ad-1 d
-1)
≒8.
22 (t
hea
d-1 y
-1).
Ther
efor
e, ra
w w
eigh
t (t y
-1)
= G
ener
atio
n ra
te (t
hea
d-1 y
-1) *
Num
bers
(hea
d)
= 8.
22 *
400
=
3,28
8 (t
y-1)
(1) N
guye
n T.
H. L
. (19
94) :
St
udy
on p
ollu
tant
s in
was
tes
from
med
ium
-sca
le p
ig fa
rms a
nd
appl
icat
ion
of w
aste
trea
tmen
t m
etho
ds fo
r the
pig
gery
farm
s, D
octo
ral d
isse
rtatio
n, N
ong
Lam
U
nive
rsity
in H
o C
hi M
inh
City
24
C6.
98%
46t y
-1
Rat
io o
f car
bon
to n
itrog
en is
20-
25 o
n th
e ass
umpt
ion
that
the v
alue
of b
uffa
lo is
sam
e as b
eef,
and
nitro
gen
conc
entra
tion
unde
r dry
con
ditio
ns 0
.31
(%).…
(1)
Ther
efor
e, c
arbo
n co
ncen
tratio
n un
der d
ry c
ondi
tions
is 6
.98
(%) i
n av
erag
e.W
ater
con
tent
of r
aw fe
ces i
s 80.
1 (%
).…(2
)Th
eref
ore,
car
bon
cont
ent
= R
aw w
eigh
t (t y
-1) *
(1-w
ater
con
tent
(%))
* C
arbo
n co
ncen
tratio
n un
der d
ry c
ondi
tions
(%)
= 3,
288
(t y-1
) * (1
-80.
1/10
0) *
6.9
8/10
0 ≒
46
(t y-1
)
(1) N
go K
. S. a
nd N
guye
n L.
D.
(199
7) :
Bio
gas p
rodu
ctio
n us
ing
anae
robi
c di
gest
ion,
Boo
k of
A
gric
ultu
re P
ublis
hing
Hou
se, H
o C
hi M
inh
City
(2) N
akam
ura
M. e
t al.
(200
5) :
Dev
elop
men
t of a
com
posi
tion
data
base
for v
ario
us ty
pes o
f bi
omas
s, Te
chni
cal R
epor
t of
the
Nat
iona
l Ins
titut
e fo
r Rur
al
Engi
neer
ing,
pp.
57-
80
25
N0.
31%
2.0
t y-1
Nitr
ogen
con
cent
ratio
n un
der d
ry c
ondi
tions
is 0
.31
(%).…
(1)
wat
er c
onte
nt o
f raw
fece
s is 8
0.1
(%).…
(2)
Ther
efor
e, n
itrog
en c
onte
nt
= R
aw w
eigh
t (t y
-1) *
(1-w
ater
con
tent
(%))
* N
itrog
en c
once
ntra
tion
und
cond
ition
s (%
) =
3,28
8 (t
y-1) *
(1-8
0.1/
100)
* 0
.31/
100
≒ 2
.0 (t
y-1)
(1) N
go K
. S. a
nd N
guye
n L.
D.
(199
7) :
Bio
gas p
rodu
ctio
n us
ing
anae
robi
c di
gest
ion,
Boo
k of
A
gric
ultu
re P
ublis
hing
Hou
se, H
o C
hi M
inh
City
(2) N
akam
ura
M. e
t al.
(200
5) :
Dev
elop
men
t of a
com
posi
tion
data
base
for v
ario
us ty
pes o
f bi
omas
s, Te
chni
cal R
epor
t of
the
Nat
iona
l Ins
titut
e fo
r Rur
al
Engi
neer
ing,
pp.
57-
80
26
Gen
erat
ion
rate
of
urin
e (b
uffa
lo)
W4.
56t h
ead-1
y-1
1,82
4t y
-1
Gen
erat
ion
rate
is 1
0-15
(kg
head
-1 d
-1)…
(1),
so th
e av
erag
e is
12.
5 (k
g he
ad-1 d
-1)
≒4.
56 (t
hea
d-1 y
-1).
Ther
efor
e, ra
w w
eigh
t (t y
-1)
= G
ener
atio
n ra
te (t
hea
d-1 y
-1) *
Num
bers
(hea
d)
= 4.
56 *
400
=
1,82
4 (t
y-1)
(1) N
guye
n T.
H. L
. (19
94) :
St
udy
on p
ollu
tant
s in
was
tes
from
med
ium
-sca
le p
ig fa
rms a
nd
appl
icat
ion
of w
aste
trea
tmen
t m
etho
ds fo
r the
pig
gery
farm
s, D
octo
ral d
isse
rtatio
n, N
ong
Lam
U
nive
rsity
in H
o C
hi M
inh
City
27
C0
t hea
d-1 y
-10
t y-1
Car
bon
is n
ot c
onta
ined
in u
rine.
―-
N27
.1%
3.5
t y-1
Nitr
ogen
con
cent
ratio
n un
der d
ry c
ondi
tions
is 2
7.1
(%),
and
wat
er c
onte
nt o
f raw
urin
e is
99.
3 (%
).…(1
)Th
eref
ore,
nitr
ogen
con
tent
=
Raw
wei
ght (
t y-1) *
(1-w
ater
con
tent
(%))
* N
itrog
en c
once
ntra
tion
unde
r dry
con
ditio
ns (%
)=
1,82
4 (t
y-1) *
(1-9
9.3/
100)
* 2
7.1/
100
≒ 3
.5 (t
y-1)
(1) N
akam
ura
M. e
t al.
(200
5) :
Dev
elop
men
t of a
com
posi
tion
data
base
for v
ario
us ty
pes o
f bi
omas
s, Te
chni
cal R
epor
t of
the
Nat
iona
l Ins
titut
e fo
r Rur
al
Engi
neer
ing,
pp.
57-
80
28
農研機構研究報告 農村工学研究部門 第 1 号 (平成 29 年 3 月) ORITATE Fumiko:Use of Digested Slurry from Livestock Manure in Paddy Fields and its Environmental Effect in Southeast Asia186 187
ブック 1.indb 187 2017/03/22 10:05:55

(4) Application Time: 235,000 g × 6.08 × 10-2 h kg-1 person-1=14.29 h person-1
Labor cost: 14.29 h × 1.19 USD h-1 person-1 = 17.01 USD
(5) Irrigation water※Water level in paddy field was increased from 0 cm to 4 cm through irrigation to dissolve chemical fertilizer and
increase absorption by rice plants Water volume: 0.04 m × 2,500 m2 = 100 m3
Pouring time: 100 m3 ÷ 6.07 (L s-1) =16,474.46 s Fuel consumption of pump for irrigation: 16,474.46 s × 8.91 × 10-4 (L s-1) =14.68 L Gasoline cost: 14.68 L × 1.06 USD L-1 = 15.56 USD Labor working time: 16,474.46 s × 0.2 + 900 s = 4,194.89 s Labor cost for irrigation: 4,194.89 s × 1.19 USD h-1 person-1 = 1.39 USD
Subtotal cost: 15.56 USD + 1.39 USD = 16.95 USD Total cost: 16.95 USD × 3 times = 50.85 USD
Total cost 158.25 USD for 2,500 m2
= 6.33 × 10⁻² USD m-2
≒0.06 USD m-2
2. Slurry fertilization with vacuum truck
(1) Cost for one shuttlea. Collection of digested slurry Running time of pump: 5.5 m3 shuttle-1 ÷ 4.17 L s-1 = 1,318.94 s shuttle-1
Total time: 1,318.94 s shuttle-1 + 900 s shuttle-1= 2,218.94 s shuttle-1
b. Transportation of digested slurry Time: 2.5 km × 2 (one way) ÷ 0.265 km min-1 = 1,132.08 s shuttle-1
c. Pouring of digested slurry Running time of pump: 5.5 m3 shuttle-1 ÷ 2.98 L s-1 = 1,845.64 s shuttle-1
Total time: 1,845.64 s shuttle-1 + 900 s shuttle-1 = 2,745.64 s shuttle-1
d. Cost for one shuttle Time for one shuttle: 2,218.94 s + 1,132.08 s + 2,745.64 s = 6,096.66 s≒1.69 h Vacuum truck rental fee: 8.94 USD h-1 × 1.69 h = 15.11 USD shuttle-1
※Rental fee includes 2 operators and fuel cost for transportation and pump. Labor cost for one worker: 1.69 h × 1.19 USD h-1 person-1 = 2.01 USD shuttle-1
Cost for one shuttle of a vacuum truck: 15.11 + 2.01 = 17.12 USD shuttle-1
(2) Area for one shuttlea. Area for digested slurry with 400 mg L-1 of T-N The second fertilization: 400 mg L-1 × 5.5 m3 shuttle-1 ÷ 7.9 g m-2≒278.48 m2 shuttle-1
The third fertilization: 400 mg L-1 × 5.5 m3 shuttle-1 ÷ 3.1 g m-2≒709.67 m2 shuttle-1
b. Area for digested slurry with 2,000 mg L-1 of T-N
農研機構研究報告 農村工学研究部門 第 1 号 (平成 29 年 3 月) ORITATE Fumiko:Use of Digested Slurry from Livestock Manure in Paddy Fields and its Environmental Effect in Southeast Asia188 189
ブック 1.indb 188 2017/03/22 10:05:55
The second fertilization: 2,000 mg L-1 × 5.5 m3 shuttle-1 ÷ 7.9 g m-2≒1,392.40 m2 shuttle-1
The third fertilization: 2,000 mg L-1 × 5.5 m3 shuttle-1 ÷ 3.1 g m-2≒3,548.38 m2 shuttle-1
(3) Cost for irrigation※Water level in paddy field increased from 0 cm to 4 cm by irrigation and digested slurry of 5.5 m3 with one shuttle.
a. Pouring of irrigation water in case of digested slurry with 400 mg L-1 of T-N Water volume for the second fertilization: 0.04 m × 278.48 m2 -5.5 m3 =5.64 m3
Water volume for the third fertilization: 0.04 m × 709.67 m2 -5.5 m3 = 22.89 m3
Pump running time for the second fertilization: 5.64 m3 ÷ 6.07 L s-1 = 929.15 s Pump running time for the third fertilization: 22.89 m3 ÷ 6.07 L s-1 = 3,771.00 s
Fuel cost of pump for the second fertilization: 929.15 s × 8.91 × 10-4 L s-1 × 1.06 USD L-1
= 0.88 USD
Fuel cost of pump for the third fertilization: 3,771.00 s × 8.91 × 10-4 L s-1 × 1.06 USD L-1 = 3.56 USD
Labor cost for the second fertilization: (929.15 s × 0.2 + 900 s) × 1.19 USD h-1 person-1 = 0.36 USD
Labor cost for the third fertilization: (3,771.00 s × 0.2 + 900 s) × 1.19 USD h-1 person-1
= 0.55 USD
b. Pouring of irrigation water in case of digested slurry with 2,000 mg L-1 of T-N Water volume for the second fertilization: 0.04 m × 1,392.40 m2 - 5.5 m3 =50.20 m3
Water volume for the third fertilization: 0.04m × 3,548.38 m2 - 5.5 m3 = 136.44 m3
Pump running time for the second fertilization: 50.20 m3 ÷ 6.07 L s-1 = 8,270.18 s Pump running time for the third fertilization: 136.44 m3 ÷ 6.07 L s-1 = 22,477.76 s
Fuel cost of pump for the second fertilization: 8,270.18 s × 8.91 × 10-4 L s-1 × 1.06 USD L-1
= 7.81 USD
Fuel cost of pump for the third fertilization: 22,477.76 s × 8.91 × 10-4 L s-1 × 1.06 USD L-1
= 21.23 USD Labor cost for the second fertilization: (8,270.18 s × 0.2 + 900 s) × 1.19 USD h-1 person-1
= 0.84 USD
Labor cost for the third fertilization: (22,477.76 s × 0.2 + 900 s) × 1.19 USD h-1 person-1
= 1.78 USD
(4) Sum of slurry fertilization cost for vacuum trucka. T-N of 400 mg L-1 in digested slurry Cost for the second fertilization: 17.12 + 0.88 + 0.36 =18.36 USD Cost for the second fertilization per 1m2: 18.36 USD ÷ 278.48 m2≒6.59 × 10⁻² USD m-2
Cost for the third fertilization: 17.12 + 3.56 + 0.55 = 21.23 USD Cost for the third fertilization per 1m2: 21.23 USD ÷ 709.67 m2≒2.99 × 10⁻² USD m-2
農研機構研究報告 農村工学研究部門 第 1 号 (平成 29 年 3 月) ORITATE Fumiko:Use of Digested Slurry from Livestock Manure in Paddy Fields and its Environmental Effect in Southeast Asia188 189
ブック 1.indb 189 2017/03/22 10:05:55
Cost for T-N in digested slurry of 400 mg L-1 per 1m2: 6.59 × 10⁻² + 2.99 × 10-2 = 9.58 × 10⁻² USD m-2
≒0.10 USD m-2
b. T-N of 2,000 mg L-1 in digested slurry Cost for the second fertilization: 17.12 + 7.81 + 0.84 = 25.77 USD Cost for the second fertilization per 1m2: 25.77 USD ÷ 1,392.40 m2≒1.85 × 10⁻² USD m-2
Cost for the third fertilization: 17.12 + 21.23 + 1.78 = 40.13 USD Cost for the third fertilization per 1m2: 40.13 USD ÷ 3,548.38 m2≒1.13 × 10⁻² USD m-2
Cost for T-N in digested slurry of 2,000 mg L-1 per 1m2: 1.85 × 10⁻² + 1.13 × 10-2 = 2.98 × 10⁻² USD m-2≒0.03 USD m-2
3. Slurry fertilization with a prototype slurry tanker
(1) Cost for one shuttlea. Collection of digested slurry Running time for generator to drive pump: 2.7 m3 shuttle-1 ÷ 3.08 L s-1 = 876.62 s shuttle-1
Total time: 876.62 s shuttle-1 + 900 s shuttle-1 = 1,776.62 s shuttle-1
b. Transportation of digested slurry Time: 2.5 km shuttle-1 × 2 (one way) ÷ 0.265 km min-1 = 1,132.08 s
c. Pouring of digested slurry Running time for generator to drive pump: 2.7 m3 shuttle-1 ÷ 4.62 L s-1 = 584.42 s shuttle-1
Total time: 584.42 s shuttle-1 + 900 s shuttle-1 = 1,484.42 s shuttle-1
d. Cost for one shuttle Fuel cost for collection of digested slurry: 876.62 s shuttle-1 × 9.94 × 10-4 L s-1 × 1.06 USD L-1
≒0.92 USD shuttle-1
Fuel cost for pouring of digested slurry: 584.42 s shuttle-1 × 9.94 × 10-4 L s-1 × 1.06 USD L-1
≒0.62 USD shuttle-1
Fuel cost for one shuttle 0.92 USD shuttle-1+0.62 USD shuttle-1 = 1.54 USD shuttle-1
Time for one shuttle: 1,776.62 s + 1,132.08 s + 1,484.42 s = 4,393.12 s≒1.22 h Rental fee for tractor: 5.96 USD h-1 × 1.22 h shuttle-1 = 7.27 USD shuttle-1
※Rental fee includes labor cost for 1 operator and fuel cost for transportation.
Labor cost for one worker: 1.22 h × 1.19 USD h-1 person-1 = 1.45 USD shuttle-1
Cost for one shuttle with prototype slurry tanker: 1.54+7.27+1.45 = 10.26 USD shuttle-1
(2) Area for one shuttlea. Area for digested slurry with 400 mg L-1 of T-N The second fertilization: 400 mg L-1 × 2.7 m3 shuttle-1 ÷ 7.9 g m-2≒136.71 m2 shuttle-1
The third fertilization: 400 mg L-1 × 2.7 m3 shuttle-1 ÷ 3.1 g m-2≒348.39 m2 shuttle-1
b. Area for digested slurry with 2,000 mg L-1 of T-N The second fertilization: 2,000 mg L-1 × 2.7 m3 shuttle-1 ÷ 7.9 g m-2≒683.54 m2 shuttle-1
The third fertilization: 2,000 mg L-1 × 2.7 m3 shuttle-1 ÷ 3.1 g m-2≒1,741.94 m2 shuttle-1
農研機構研究報告 農村工学研究部門 第 1 号 (平成 29 年 3 月) ORITATE Fumiko:Use of Digested Slurry from Livestock Manure in Paddy Fields and its Environmental Effect in Southeast Asia190 191
ブック 1.indb 190 2017/03/22 10:05:56

(3) Cost for irrigation※Water level in paddy field was increased from 0 cm to 4 cm by irrigation and digested slurry of 2.7 m3 by one shuttle.
a. Pouring of irrigation water in case of digested slurry with 400 mg L-1 of T-N Water volume for the second fertilization: 0.04 m × 136.71 m2 - 2.7 m3≒2.77 m3
Water volume for the third fertilization: 0.04 m × 348.39 m2 - 2.7 m3≒11.24 m3
Pump running time for the second fertilization: 2.77 m3 ÷ 6.07 L s-1≒456.34 s Pump running time for the third fertilization: 11.24 m3 ÷ 6.07 L s-1≒1,851.73 s
Fuel cost of pump for the second fertilization: 456.34 s × 8.91 × 10-4 L s-1 × 1.06 USD L-1
≒0.43 USD Fuel cost of pump for the third fertilization: 1,851.73 s × 8.91 × 10-4 L s-1 × 1.06 USD L-1
≒1.75 USD
Labor cost for the second fertilization: (456.34 s × 0.2 + 900 s) × 1.19 USD h-1 person-1
≒0.33 USD Labor cost for the third fertilization: (1,851.73 s × 0.2 + 900 s) × 1.19 USD h-1 person-1
≒0.42 USD
b. Pouring of irrigation water in case of digested slurry with 2,000 mg L-1 of T-N Water volume for the second fertilization: 0.04 m × 683.54 m2 - 2.7 m3 = 24.64 m3
Water volume for the third fertilization: 0.04 m × 1,741.94 m2 - 2.7 m3 = 66.98 m3
Pump running time for the second fertilization: 24.64 m3 ÷ 6.07 L s-1 = 4,059.31 s Pump running time for the third fertilization: 66.98 m3 ÷ 6.07 L s-1 = 11,034.60 s
Fuel cost of pump for the second fertilization: 4,059.31 s × 8.91 × 10-4 L s-1 × 1.06 USD L-1
≒3.83 USD
Fuel cost of pump for the third fertilization: 11,034.60 s × 8.91 × 10-4 L s-1 × 1.06 USD L-1
≒10.42 USD
Labor cost for the second fertilization: (4,059.31 s × 0.2 + 900 s) × 1.19 USD h-1person-1
≒0.57 USD
Labor cost for the third fertilization: (11,034.60 s × 0.2 + 900 s) × 1.19 USD h-1person-1
≒1.03 USD
(4) Sum of slurry fertilization cost by the prototype slurry tankera. T-N of 400 mg L-1 in digested slurry Cost for the second fertilization: 10.26 + 0.43 + 0.33 = 11.02 USD shuttle-1
Cost for the second fertilization per 1m2: 11.02 USD shuttle-1 ÷ 136.71 m2 shuttle-1
≒8.06 × 10⁻² USD m-2
Cost for the third fertilization: 10.26 + 1.75 + 0.42 = 12.43 USD shuttle-1
Cost for the third fertilization per 1m2: 12.43 USD ÷ 348.39 m2 shuttle-1≒3.57 × 10⁻² USD m-2
Cost for T-N of 400 mg L-1 per 1m2 in digested slurry: 8.06 × 10⁻² + 3.57 × 10⁻² USD m-2
農研機構研究報告 農村工学研究部門 第 1 号 (平成 29 年 3 月) ORITATE Fumiko:Use of Digested Slurry from Livestock Manure in Paddy Fields and its Environmental Effect in Southeast Asia190 191
ブック 1.indb 191 2017/03/22 10:05:56

≒0.12 USD m-2
(Therefore, total cost for slurry fertilization with T-N of 400 mg L-1 in digested slurry is approximately 0.13 USD m-2
by adding the depreciation cost for prototype slurry tanker of 8.92×10⁻³ USD m-2 and maintenance and repair cost for prototype slurry tanker of 4.55×10⁻³ USD m-2 as mentioned in Appendix 2-2 to above operation cost of 0.12 USD m-2.)
b. T-N of 2,000 mg L-1 in digested slurry Cost for the second fertilization: 10.26 + 3.83 + 0.57 = 14.66 USD shuttle-1
Cost for the second fertilization per 1m2: 14.66 USD ÷ 683.54 m2 shuttle-1≒2.14 × 10⁻² USD m-2
Cost for the third fertilization 10.26 + 10.42 + 1.03 = 21.71 USD shuttle-1
Cost for the third fertilization per 1m2: 21.71 USD shuttle-1 ÷ 1,741.94 m2 shuttle-1
≒1.25 × 10⁻² USD m-2
Cost for T-N of 2,000 mg L-1 per 1 m2 in digested slurry: 2.14 × 10⁻² + 1.25 × 10-2 = 3.39 × 10⁻² USD m-2
(Therefore, total cost for slurry fertilization with T-N of 2,000 mg L-1 in digested slurry is approximately 0.04 USD m-2
by adding the depreciation cost for prototype slurry tanker of 2.14×10⁻³ USD m-2 and maintenance and repair cost for prototype slurry tanker of 1.09×10⁻³ USD m-2 as mentioned in Appendix 2-2 to above operation cost of 3.39 × 10⁻² USD m-2.)
Appendix 2-2 Depreciation, maintenance and repair costs of prototype slurry tanker
Depreciation costs
Initial investment cost for prototype slurry tanker (on the assumption that maximum depreciation period of 15 years)
Plastic tank: 429 USD (143 USD × 3 times) Tractor trolley: 1,670 USD Motor pump: 372 USD Generator: 1,369 USD Total: 429 + 1,670 + 372 + 1,369=3,840 USD
Maximum depreciation period of machine tools, pumps and generators are 15 years based on the Vietnamese guidelines for depreciation of fixed assets”45/2013/TT-BTC”. The maximum depreciation period of plastic tank is assumed as 5 years.
Rice is harvested twice a year in half of paddy fields, and 3 times a year in another half of paddy fields in Thai My Village.
Therefore, the depreciation cost per crop with prototype slurry tanker can be estimated as follows; 3,840 USD ÷ 15 years ÷ 2.5 crops year-1 = 102.4 USD crop-1
(According to Appendix 2-1. 3 (1), total time for a shuttle of the prototype slurry tanker can be calculated as follows;1,776.62 + 1,132.08 + 1,484.42 = 4,393.12 s shuttle-1)
(1) Area for one shuttle of prototype slurry tankerAreas for one shuttle are shown as Appendix 2-1. 3 (2).a. Area for the T-N in digested slurry of 400 mg L-1
The second fertilization: 136.71 m2 shuttle-1
b. Area for digested slurry with 2,000 mg L-1 of T-N The second fertilization: 683.54 m2 shuttle-1
農研機構研究報告 農村工学研究部門 第 1 号 (平成 29 年 3 月) ORITATE Fumiko:Use of Digested Slurry from Livestock Manure in Paddy Fields and its Environmental Effect in Southeast Asia192 193
ブック 1.indb 192 2017/03/22 10:05:56
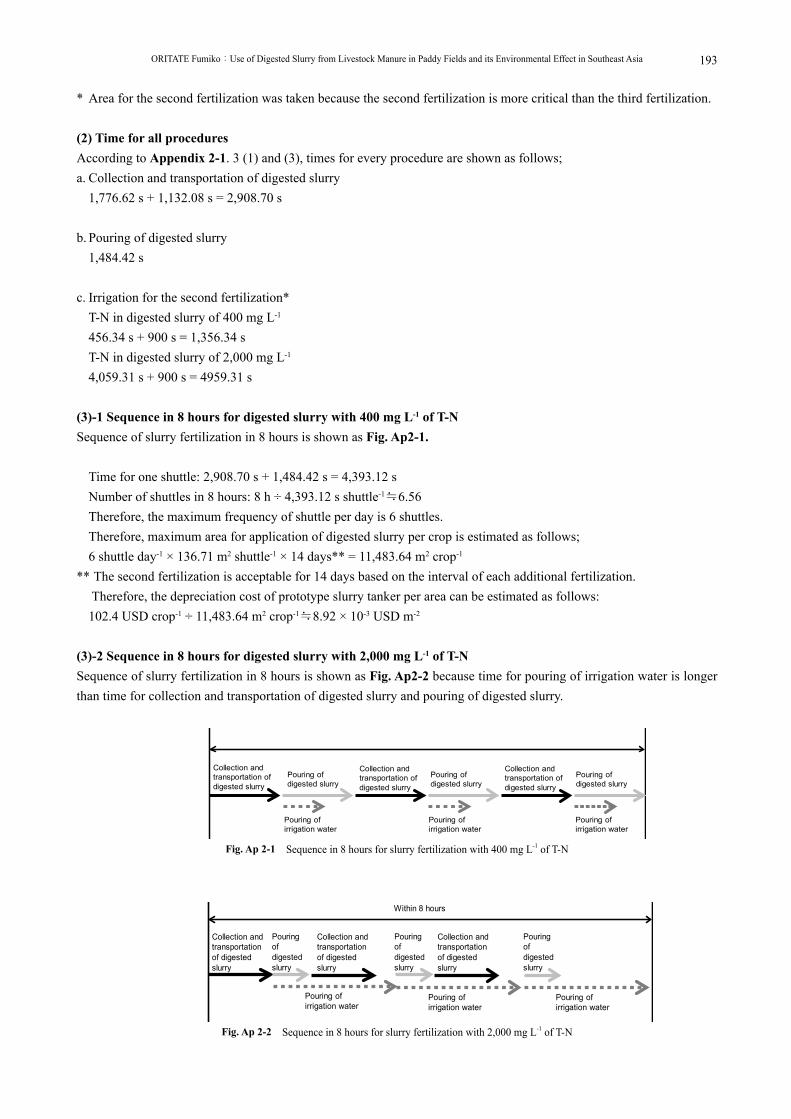
* Area for the second fertilization was taken because the second fertilization is more critical than the third fertilization.
(2) Time for all proceduresAccording to Appendix 2-1. 3 (1) and (3), times for every procedure are shown as follows;a. Collection and transportation of digested slurry 1,776.62 s + 1,132.08 s = 2,908.70 s
b. Pouring of digested slurry 1,484.42 s
c. Irrigation for the second fertilization* T-N in digested slurry of 400 mg L-1
456.34 s + 900 s = 1,356.34 s T-N in digested slurry of 2,000 mg L-1
4,059.31 s + 900 s = 4959.31 s
(3)-1 Sequence in 8 hours for digested slurry with 400 mg L-1 of T-NSequence of slurry fertilization in 8 hours is shown as Fig. Ap2-1.
Time for one shuttle: 2,908.70 s + 1,484.42 s = 4,393.12 s Number of shuttles in 8 hours: 8 h ÷ 4,393.12 s shuttle-1≒6.56 Therefore, the maximum frequency of shuttle per day is 6 shuttles. Therefore, maximum area for application of digested slurry per crop is estimated as follows; 6 shuttle day-1 × 136.71 m2 shuttle-1 × 14 days** = 11,483.64 m2 crop-1
** The second fertilization is acceptable for 14 days based on the interval of each additional fertilization. Therefore, the depreciation cost of prototype slurry tanker per area can be estimated as follows: 102.4 USD crop-1 ÷ 11,483.64 m2 crop-1≒8.92 × 10⁻³ USD m-2
(3)-2 Sequence in 8 hours for digested slurry with 2,000 mg L-1 of T-NSequence of slurry fertilization in 8 hours is shown as Fig. Ap2-2 because time for pouring of irrigation water is longer than time for collection and transportation of digested slurry and pouring of digested slurry.
Collection and transportation of digested slurry
Pouring of irrigation water
Pouring of irrigation water
Pouring of irrigation water
Collection and transportation of digested slurry
Collection and transportation of digested slurry
Pouring of digested slurry digested slurry
Pouring of digested slurry
Pouring of
Collection and transportation of digested slurry
Collection and transportation of digested slurry
Pouring of irrigation water
Pouring of digested slurry
Pouring of digested slurry
Collection and transportation of digested slurry
Pouring of digested slurry
Pouring of irrigation water
Pouring of irrigation water
Within 8 hours
Fig. Ap 2-1 Sequence in 8 hours for slurry fertilization with 400 mg L-1 of T-N
Fig. Ap 2-2 Sequence in 8 hours for slurry fertilization with 2,000 mg L-1 of T-N
農研機構研究報告 農村工学研究部門 第 1 号 (平成 29 年 3 月) ORITATE Fumiko:Use of Digested Slurry from Livestock Manure in Paddy Fields and its Environmental Effect in Southeast Asia192 193
ブック 1.indb 193 2017/03/22 10:05:56

Number of shuttles in 8 hours, “n” is indicated by the following equation.2,908.70 s shuttle-1 + 4959.31 s shuttle-1 × n < 8 h n < 5.22Maximum shuttles for one day is 5 shuttles. Maximum area for application of digested slurry per crop is as follows;5 shuttle day-1 × 683.54 m2 shuttle-1 × 14 days = 47,847.80 m2 crop-1
Therefore, the depreciation costs of prototype slurry tanker per area can be estimated as follows:102.4 USD crop-1 ÷ 47,847.80 m2 crop-1 = 2.14 x 10⁻³ USD m-2
Maintenance and repair costMaintenance and repair cost of generator to drive motor pump corresponds to the maintenance and repair cost of the
prototype slurry tanker.Here, regarding “maintenance and repair cost” as Cmr
(1) Cmr for a day in use* = Cin × Rmr Here, Cin; Initial investment cost for power unit of prototype slurry tanker Rmr; Maintenance and repair cost rate for equivalent value with use for one day
* Ministry of Agriculture, Forestry and Fisheries (2014) Estimation standards for land improvement (for machine cost), p. 3
(1)-1 Cin here is assumed as initial investment cost for total of motor pump and generator =372 USD + 1,369 USD = 1,741 USD
(1)-2 Rmr = (Cd + Rmr + Ram × Yst) ÷ (Dst × Yst) Here, Cd; Depreciation cost (Cd was neglected because calculated as shown in former part in Appendix 2-2.) Rmr; Maintenance and repair cost rate** = 120 % of Cin Ram; Annual management cost rate**= 7 % of Cin Yst; Standard years in use = 15 years*** Dst; Annual standard days in use = 14 days**** (Faf in a crop)-1 × (2 times of Af) crop-1 × 2.5 crop year-1 = 70 days Here, Faf; Frequency of additional fertilization Af; Additional fertilization
** Ministry of Agriculture, Forestry and Fisheries (2014) Estimation standards for land improvement (for machine cost), p. 182
*** Maximum depreciation period of pumps and generators is 15 years based on the Vietnamese guidelines about depreciation of fixed assets”45/2013/TT-BTC”.
**** Maximum days for application of digested slurry is assumed as 14 days for each fertilization based on the interval of each additional fertilization.
In this case, Cd can be neglected because it was calculated in another category in this study.
Therefore,
農研機構研究報告 農村工学研究部門 第 1 号 (平成 29 年 3 月) ORITATE Fumiko:Use of Digested Slurry from Livestock Manure in Paddy Fields and its Environmental Effect in Southeast Asia194 195
ブック 1.indb 194 2017/03/22 10:05:57

Cmr for a day in use≒3.73 USD day-1
(2) Area for one shuttleAreas for one shuttle are shown as Appendix 2-1. 3 (2)
a. Area for the T-N in digested slurry of 400 mg L-1
The second fertilization: 136.71 m2 shuttle-1
b. Area for digested slurry with of 2,000 mg L-1 of T-N The second fertilization: 683.54 m2 shuttle-1
(3) Cmr for prototype slurry tanker per area T-N of 400 mg L-1 in digested slurry: Cmr per area =3.73 USD day-1 ÷ (136.71 m2 shuttle-1 × 6 shuttle day-1) =4.55 × 10⁻³ USD m-2
T-N of 2,000 mg L-1 in digested slurry: Cmr per area =3.73 USD day-1 ÷ (683.54 m2 shuttle-1 × 5 shuttle day-1) =1.09 × 10⁻³ USD m-2
Appendix 3 Calculation procedures of the number of milk cow in Southeast Asia
1) Data of the number of dairy cattle (=mentioned as “milk cow” in this study) of the following Southeast Asian Countries is not shown in statistical data: Brunei Darussalam, Cambodia, Lao PDR, Malaysia, Philippines, Singapore, Thailand and Timor-Leste.
2) Therefore, these data were estimated by the average ratio of dairy cattle to cattle of Indonesia, Myanmar and Vietnam.3) The numbers and ratio of dairy cattle to cattle in Indonesia, Myanmar and Vietnam are as following table.
4) As shown in above table, average ratio of dairy cattle to cattle in existed data is calculated at 3.36%.5) 49,271,938 heads of cattle**** in Southeast Asian Countries multiplied by 3.36% of ratio estimated 1,655,537 heads of
dairy cattle in Southeast Asian Countries.
* The number of cattle and dairy cattle in Indonesia for 2013, FAO-GLIPHA, http://kids.fao.org/glipha/. Accessed 19 November 2015
** The number of cattle and dairy cattle in Myanmar for 2002, FAO-GLIPHA, http://kids.fao.org/glipha/. Accessed 19 November 2015
*** The number of cattle and dairy cattle for 2013, Viet Nam News http://vietnamnews.vn/economy/248720/dairy-sector-looks-to-triple-cattle-population.html Accessed 19 November 2015
**** FAO (2013a) Live Animals in 2013. In: FAOSTAT. http://faostat3.fao.org/download/Q/QA/E. Accessed 26 November 2015
The number of dairy cattle
The number of cattle
Ratio of dairy cattle
to cattle
Data for year
heads heads % yearIndonesia 411,213 12,740,690 3.23 2013Myanmar 394,135 11,313,425 3.48 2002Vietnam 174,000 5,156,727 3.37 2013Average - - 3.36 -
農研機構研究報告 農村工学研究部門 第 1 号 (平成 29 年 3 月) ORITATE Fumiko:Use of Digested Slurry from Livestock Manure in Paddy Fields and its Environmental Effect in Southeast Asia194 195
ブック 1.indb 195 2017/03/22 10:05:57
REFERENCES
AQUASTAT (2015) (accessed 2015.11.26): Total Renewable Water Resources in 2014. In: AQUASTAT Main Database, Food and Agriculture Organization of the United Nations. (online), <http://www.fao.org/nr/water/aquastat/ data/query/index.html?lang=en.>
Adiarso G., Murti W. and Priyanto U. (2013): Utilization of biomass for energy: prospect, challenge and industrialization strategy in Indonesia. J. Jpn. Inst. Energy, 92, 89-98.
Brunner P.H. and Rechberger H. (2004): Practical Handbook of Material Flow Analysis. Lewis Publishers.Bunthoeun P., Saoleng L. and Chetra S. (2013): Biodigester development to ensure sustainable agriculture and mitigate greenhouse gas emissions in
Cambodia. JIRCAS Working Report, 79, 65-68.Chen D., Jiang L., Huang H., Toyota K., Dahlgren R.A. and Lu J. (2013): Nitrogen dynamics of anaerobically digested slurry used to fertilize paddy
fields. Biol. Fertil. Soils, 49, 647-659.Do T.N., Kazama F., Sakamoto Y. and Nishida K. (2013): Application of material flow analysis in assessing nutrient fluxes in Day-Nhue River basin,
Vietnam. Southeast Asian Water Environment 5. IWA Publishing.Elauria J.C. and Elauria M.M. (2013): Biomass situation in the Philippines. J. Jpn. Inst. Energy, 92, 83-88.FAOSTAT (2015a) (accessed 2015.11.19): Download data – Production - Annual Production. In: FAOSTAT. Food and Agricultural Organization of the
United Nations Statistics Division. <http://faostat3.fao.org/ download/O/OA/E.>FAOSTAT (2015b) (accessed 2015.11.26): Download data – Production – Live Animals. In: FAOSTAT. Food and Agricultural Organization of the
United Nations Statistics Division. <http://faostat3.fao.org/download/Q/QA/E.>FAOSTAT (2015c) (accessed 2015.11.26): Download data – Production – Crops. In: FAOSTAT. Food and Agricultural Organization of the United
Nations Statistics Division. <http://faostat3.fao.org/download/Q/QC/E.>Fujita H., Qian Q., Fujii T., Mochidzuki K. and Sakoda A. (2011): Isolation of ethanol from its aqueous solution by liquid phase adsorption and gas phase
desorption using molecular sieving carbon. Adsorption, 17, 869-879.General Statistics Office Vietnam (2011): Statistical Yearbook of Vietnam 2011, Statistical Publishing House, HanoiGeneral Statistics Office Vietnam (2013): Statistical Yearbook of Vietnam 2013, Statistical Publishing House, HanoiHayashi K., Nishimura S. and Yagi K. (2008): Ammonia volatilization from a paddy field following applications of urea: rice plants are both an absorber
and an emitter for atmospheric ammonia. Sci. Total Environ., 390, 485-494.Hidaka N. (1997): Soil Chemistry-Nitrogen. In: Committee of Soil Environment Analysis (ed). Methods for soil environment analysis. Hakuyu-sha,
Tokyo. Japan. (in Japanese)Huong L.Q., Madsen H., Anh L.X., Ngoc P.T. and Dalsgard A. (2014): Hygienic aspects of livestock manure management and biogas systems operated
by small-scale pig farmers in Vietnam. Sci. Total Environ., 470-471, 53-57.IEA (2013) (accessed 2015.9.14): Southeast Asia energy outlook. World Energy Outlook Special Report. <http://www.iea.org/publications/
freepublications/publication/SoutheastAsiaEnergyOutlook_WEO2013SpecialReport.pdf.>IPCC (2006a) (accessed 2015.11.26): 2006 IPCC Guidelines for National Greenhouse Gas Inventories, Volume 2 Energy, Chapter 1, p. 1.19, <http://
www.ipcc-nggip.iges.or.jp/public/2006gl/vol2.html.>IPCC (2006b) (accessed 2015.11.26): 2006 IPCC Guidelines for National Greenhouse Gas Inventories, Volume 2 Energy, Chapter 1, p. 1.23, <http://
www.ipcc-nggip.iges.or.jp/public/2006gl/vol2.html.> Igarashi Y. (2008): Overview of bioethanol. In: Igarashi Y and Saiki T (eds) Bio-ethanol production from rice straw. JARUS, Tokyo, Japan (in Japanese)Iida M., Ohdoi K., Ryu C. and Umeda M. (2009): Basal application of methane fermentation digested liquid using a slurry injector. J. Jpn. Soci. Agr.
Mach., 71(2), 81-87. (in Japanese with English abstract)Inomura K., Yuge K., Anan M. and Shinogi Y. (2010): Numerical analysis of anaerobically digested slurry with irrigation water in rice paddy. J. Fac.
Agr, Kyushu Univ., 55(2), 357-363.Ishii S., Ikeda S., Minamisawa K. and Sendo K. (2011): Nitrogen cycling in rice paddy environments: past achievements and future challenges.
Microbes Environ., 26(4), 282-292.Iwashita K., Fukushi K., Sugita H., Yuge K., Tanaka M. and Nakano Y. (2008): Establishment of rural resource recycling through the effective application
of digested slurry from methane fermentation system to paddy and upland fields. Res. Inst. Resour. Circ., Jpn. Soc. Irrig. Drain. Rural Eng., 4, 55-70 (in Japanese with English abstract)
Izumi T., Matsubara E. and Iizumi Y. (2013): Registration of clean development mechanism project in Viet Nam. Water, Land and Environ. Eng., 81(3), 207-210. (in Japanese)
Kamioka H. and Kamewada K. (2011): Effect of anaerobically digested cattle slurry as basal application on paddy rice Koshihikari. Jpn. J. Soil Sci. Plant Nutr., 82, 31-40. (in Japanese with English abstract)
Kihou N. (1997): Instrumental Analysis-Ion chromatograph method. In: Committee of Soil Environment Analysis (ed). Methods for soil environment analysis. Hakuyu-sha, Tokyo. Japan. (in Japanese)
Kobayashi H., Khai L.T.L., Phan T.T., Yamasaki S., Akiba M., Hata E. and Taniguchi T. (2007): Prevalence and characteristics of pathogenic Escherichia coli in a swine breeding environment in Can Tho Province. JIRCAS Working Report, 55, 35-40.
農研機構研究報告 農村工学研究部門 第 1 号 (平成 29 年 3 月) ORITATE Fumiko:Use of Digested Slurry from Livestock Manure in Paddy Fields and its Environmental Effect in Southeast Asia196 197
ブック 1.indb 196 2017/03/22 10:05:57
Koga Y., Matsuo M., Terao H., Ogawa T., Hiyoshi K., Kagehigashi S., Kurogi Y. and Nishiwaki A. (2010): Effects of anaerobically digested slurry to the growth and yield of rice (Oryza sativa L.). Bull. Fac. Agric., Univ. Miyazaki, 56, 15-27 (in Japanese with English abstract)
Kunimitsu Y. and Ueda T. (2013): Economic and environmental effects of rice-straw bioethanol production in Vietnam. Paddy Water Environ., 11, 411-421.
Kyaw, K.M., Toyoya K., Okazaki M., Motobayashi T. and Tanaka H. (2005): Nitrogen balance in a paddy field planted with whole crop rice (Oryza sativa cv. Kusahonami) during two rice-growing seasons. Biol. Fertil. Soils, 42, 72-82.
Li K.Z., Inamura T. and Umeda M. (2003): Growth and nitrogen uptake of paddy rice as influenced by fermented manure liquid and squeezed manure liquid. Soil Sci. Plant Nutr., 49(3), 463-467.
Li Y.Y. (2005): Toward the holistic use of biomass resources (3)-methane fermentation technology-. Jour. JSIDRE, 73(8), 739-744. (in Japanese)Mara D.D. and Cairncross S. (1989): Guidelines for the safe use of wastewater and excreta in agriculture and aquaculture. World Health Organization,
Geneva.Matsubara E., Izumi T., Nguyen H.C. and Nguyen H.T. (2014): Emission reduction and financial feasibility evaluation of a household biogas CDM
project in Viet Nam. IDRE Journal, 294, 55-64. (in Japanese with English abstract)Matsumoto N. (2000): Development of estimation method and evaluation of nitrogen flow in regional areas. Bull. Nat. Inst. Agro-Environ. Sci., 18,
81-152. (in Japanese with English abstract)Matsunaka T., Naruse M. and Kumai M. (2002): Change in nutrients content and some other properties of dairy cattle slurry following anaerobic
digestion. Jpn. J. Soil Sci. Plant Nutr., 73(3), 297-300. (in Japanese)Matsuno Y., Hatcho N., Ieshima A. and Shinogi Y. (2006): Material cycle in peri-urban area: estimation of nitrogen flow in the Yamato River Basin in
Nara City. Environ. Sci., 19(6), 495-506. (in Japanese with English abstract)Mihara M., Hyakutake C., Ijichi T. and Mori N. (2011): Fertilizer use of digestive fluids from biogas-plant in rice cultivation. Rep. Kyushu Br. Crop Sci.
Japan, 77, 15-18. (in Japanese)Miho Y., Tojo S. and Watanabe K. (2004): Utilization in cultivation and its environmental load of digested slurry from biogas plant. J. Jpn. Soci. Agri.
Mach., 66(3), 77-83. (in Japanese with English abstract)Ministry of Agriculture, Forestry and Fisheries of Japan. (2014) (accessed 2015.11.26): <http://www.maff.go.jp/j/council/seisaku/syokuryo/140326/
pdf/sankou_siryo2-4.pdf.>Mochidzuki K., Biomass town for sustainable local community, Prep. 4th Symposium of JICA-JST Bio-mass Project in Vietnam, 51-63, Dec. 12 2013,
Ho Chi Minh City, VietnamNakamura M. and Yuyama Y. (2005): Development of a composition database for various types of biomass. Tech. Rep. Nat. Inst. Rural Eng., 203, 57-80.
(in Japanese with English abstract)Nakamura M., Yuyama Y., Yamaoka M., Oritate F. and Fujikawa T. (2012): Method for utilization of methane fermented digested slurry as a liquid
fertilizer to minimize negative environmental impacts. Res. Inst. Resour. Circ., Jpn. Soc. Irrig. Drain. Rural Eng., 8, 11-30 (in Japanese with English abstract)
Nguyen K.T., Nguyen H.H., Doan T.H. and Tran D.M. (2013): Biomass potentials in Vietnam; current status and prospects for biofuel development. J. Jpn. Inst. Energy, 92, 99-105.
Nguyen Q.C. (2005): Dairy cattle development: environmental consequence and pollution control option in Hanoi province, North Vietnam. Research Report No. 2005-RR2006. Published by the Economy and Environment Program for Southeast Asia (EEPSEA), Singapore
Nguyen V.C.N., Phan T.H. and Vo H.N. (2012): Review on the most popular anaerobic digester models in the Mekong Delta. J. Viet. Env., 2(1), 8-19.Nicholson F.A., Groves S.J. and Chambers B.J. (2005): Pathogen survival during livestock manure storage and following land application. Bioresour.
Technol., 96, 135-143.Nishikawa T., Li K., Inoue H., Umeda M., Hirooka H. and Inamura T. (2012): Effects of the long-term application of anaerobically-digested cattle
manure on growth, yield and nitrogen uptake of paddy rice (Oryza sativa L.), and soil fertility in warmer region of Japan. Plant Prod. Sci., 15(4), 284-292.
Noike T. (2009): Methane fermentation. Gihodo Shuppan, Tokyo. Japan (in Japanese)Ogi T. (2002): Definition and classification of biomass. In: Japan Institute of Energy (ed) Biomass Handbook, Ohm-sha, Tokyo. Japan (in Japanese)Ohtomo R., Minato K. and Saito M. (2004): Survival of Escherichia coli in a field amended with cow feces slurry. Soil Sci. Plant Nutr., 50(4), 575-581.Oki M., Osawa T., Tanaka M. and Chihara H. (1994): Chemical dictionary. Tokyo Kagakudojin, Tokyo, Japan p. 165 (in Japanese)Oritate F., Nakamura M., Kitagawa I., Nguyen P.D., Dang V.B.H., Nguyen D.K., Yuyama Y., Yamaoka M. and Sakoda S., Condition for use of digested
slurry in paddy fields in Southern Vietnam-Effects on rice growth, rice yield, surface water quality and soil in the field by different application timing and application rates-, Prep. Annual Meeting, Japanese Society of Soil Science and Plant Nutrition, P8-1-20, Sep. 9-11, 2014, Tokyo, Japan (in Japanese)
Oritate F., Nakamura M., Yamaoka M., Yuyama Y., Nguyen P.D., Dang V.B.H., Nguyen D.K. and Sakoda S. (2013a): Fertilization effect and nitrogen load in use of methane fermentation digested slurry as fertilizer at paddy field in Vietnam. J. Environ. Conserv. Eng., 42(12), 23-27. (in Japanese)
Oritate F., Nakamura M., Yamaoka M., Yuyama Y., Nguyen P.D., Dang V.B.H., Nguyen D.K. and Sakoda S. (2013b): Trial use of methane fermentation digested slurry at paddy field in Southern Vietnam-evaluation from fecal contamination, nitrogen load and fertilization effect-. J. Sci. Technol., Vietnam, 51(5C), 649-655.
農研機構研究報告 農村工学研究部門 第 1 号 (平成 29 年 3 月) ORITATE Fumiko:Use of Digested Slurry from Livestock Manure in Paddy Fields and its Environmental Effect in Southeast Asia196 197
ブック 1.indb 197 2017/03/22 10:05:57

Oritate F., Yuyama Y., Nakamura M. and Yamaoka M., Evaluation of energy, cost and environment effect in use of digested slurry at paddy field in Southern Vietnam, Prep. 10th Conference on Biomass Science, O-34, Jan. 14-15, 2015, Tsukuba (in Japanese)
Oritate F., Yuyama Y., Nakamura M., Yamaoka M., Nguyen P.D., Dang V.B.H., Mochidzuki K. and Sakoda A. (2015): Regional diagnosis of biomass use in suburban village in Southern Vietnam. J. Jpn. Inst. Energy, 94, 805-829.
Pham K.T., Nguyen M.B. and Nguyen H.D. (2011): Energy, supply, demand, and policy in Vietnam, with future projections. Energy Policy, 39, 6814-6826.
Pham Q.H., Mike M. and Ingrid O. (2006): Nutrient recycling for sustainable agriculture in Viet Nam. In Food and Agriculture Organization of the United Nations, regional office for Asia and the Pacific (ed) Improving plant nutrient management better farmer livelihoods, food security and environmental sustainability, Proceedings of a Regional Workshop. FAO, Bangkok, Thailand.
Phayom W., Iwashita K., Iwata M. and Tanaka M. (2012): Study of a slurry irrigation system by methane fermentation digestion for wet rice cultivation. EAEF, 5(2), 57-64.
QCVN08: 2008/BTNMT (accessed 2014.11.10), <https://www.env.go.jp/air/tech/ine/asia/vietnam/files/law/V33.pdf.>QCVN09: 2008/BTNMT (accessed 2014.11.10), <https://www.env.go.jp/air/tech/ine/asia/vietnam/files/pollution/pollution.pdf.>Rajendran K., Aslanzadeh S. and Taherzadeh M.J. (2012): Household biogas digesters-A review. Energies, 5, 2911-2942.SNV (2013) (accessed 2013.8.20): Biogas program for the animal husbandry sector in Vietnam.<http://www.biogas.org.vn/ english/Home.aspx.>Sakata S. (2013): Agriculture and rural areas in Vietnam under the rapid economic growth-“New stage” of development for agriculture and rural are
in Vietnam-. In: Sakata S (ed) Development of agriculture and rural area in Vietnam under the rapid economic growth. IDE-JETRO Institute of Developing Economies, Chiba, Japan (in Japanese)
Sakoda A., Mochidzuki K. and Yuyama Y. (2006): Toward the holistic use of biomass resources (8)-future prospects for biomass utilization system-. Jour. JSIDRE, 74(1), 53-58. (in Japanese)
Samantha O. and Milou B. (2010) (accessed 2015.9.14): Deploying renewables in Southeast Asia-Executive summary. IEA Working paper. <https://www.iea.org/publications/freepublications/publication/Renew_SEAsia.pdf.>
Sasada Y., Win K.T., Nonaka R., Win A.T., Toyota K., Motobayashi T., Hosomi M., Dingjiang C. and Lu J. (2011): Methane and N2O emissions, nitrate concentrations of drainage water, and zinc and copper uptake by rice fertilized with anaerobically digested cattle or pig slurry. Biol Fertil. Soils, 47, 949-956.
Sunaga K., Yoshimura N., Hou H., Win K.T., Tanaka H., Yoshikawa M., Watanabe H., Motobayashi T., Kato M., Nishimura T., Toyota K. and Hosomi M. (2009): Impacts of heavy application of anaerobically digested slurry to whole crop rice cultivation in paddy environment on water, air and soil qualities. Jpn. J. Soil Sci. Plant Nutr., 80, 596-605. (in Japanese with English abstract)
Thang N.T., Phuong B.T.M., Dang V.B.H., Nguen P.D., Le T.K.P., Phan D.T., Yuyama Y., Oritate F., Mochidzuki K. and Sakoda A. (2011): Evaluation of the material flows of utilization of husbandry wastes to produce biogas in Thai My Village, Cu Chi District, 8th Biomass-Asia Workshop, Hanoi, Vietnam
The Prime Minister of Vietnam (2011a): Decision No. 2139/QD-TTg, National strategy on climate changeThe Prime Minister of Vietnam (2011b): Decision No. 1208/2011/QD-TTg, Approving the national master plan for power development in the 2011-
2020 period, with considerations to 2030The Prime Minister of Vietnam (2012): Decision No. 1216/QD-TTg, The National Strategy on Environment Protection to 2020, with Visions to 2030The World Bank (2015) (accessed 2015.11.19): Data – Agriculture, value added (% of GDP). The World Bank Group. <http://data.worldbank.org/
indicator/NV.AGR.TOTL.ZS/countries.> Thu C.T.T., Cuong P.H., Hang L.T., Chao N.V., Anh L.X., Trach N.X. and Sommer S.G. (2012): Manure management practices on biogas and non-
biogas pig farmers in developing countries-using livestock farms in Vietnam as an example. J. Cleaner Prod., 27, 64-71.Tran U.P.N., Vu K.L.V., Nguyen Q.D., Le P.T.K., Phan T.D., Mochidzuki K., Kobayashi S., Seo D.J. and Sakoda A. (2013): Energy balance of small-
scale biorefinery system. Environ. Sci., 26(6), 489-496.UNFCCC (2012) (accessed 2015.12.1): Small-scale programme of activities design document ‘Vietnam national biogas programme’ version 8.1, Reference 5816.
United Nations Framework Convention on Climate Change. <https://cdm.unfccc.int/filestorage/Y/U/9/YU9OIQDNPBCXAWT035HJR1LVMEK7GF/ PoA_DD_Vietnam%20Biogas.pdf?t=MTV8bnlvMnQ0fDB5_I6ALkYoZT-jCSoqpsWH.>
UNFCCC (2015) (accessed 2015.11.26): Clean Development Mechanism (CDM). United Nations Framework Convention on Climate Change.<http://cdm.unfccc.int/.>USDA (2010): Keys to soil taxonomy –Eleventh Edition 2010, US Government Printing Office, p. 167Ueda T., Ishida K., Hata K. and Matsumori K. (2003): Fate of indicator microorganisms in wastewater reuse for paddy field irrigation. Proceedings of
the IWA Asia-Pacific Regional Conference, 489, Bangkok, Thailand, October 2003.Ueno N., Ishii T. and Hanagata T. (2011): Effect of protein content of brown rice on eating quality of rice. Bull. Kanto Branch Crop Sci. Soc. Jpn., 26,
46-47. (in Japanese)Vietnam Livestock Production Department MARD and Netherlands Development Organization SNV (2013) (accessed 2013.8.20): Biogas program for
the animal husbandry sector in Vietnam. <http://www.biogas.org.vn/ english/Home.aspx.>Vision Tech Inc. (2011): Report of work for creating the database for agricultural facilities
農研機構研究報告 農村工学研究部門 第 1 号 (平成 29 年 3 月) ORITATE Fumiko:Use of Digested Slurry from Livestock Manure in Paddy Fields and its Environmental Effect in Southeast Asia198 199
ブック 1.indb 198 2017/03/22 10:05:57

Vu L.V.K., Tran P.N.U., Le T.K.P., Seo D.J., Nguyen D.Q., Mochidzuki K. and Phan D.T. (2013): Agriculture residues as alternative supplemental nutrients for bioethanol fermentation process from rice straw. J. Sci. and Technol., Vietnam, 51(5B), 32-36.
Vu T.K.V., Tran M.T. and Dang T.T.S. (2007): A survey of manure management on pig farms in Northern Vietnam. Livest. Sci., 112, 288-297.Vu Q.D., Tran T.M., Nguyen P.D., Vu C.C., Vu V.T.K. and Jensen L.S. (2012): Effect of biogas technology on nutrient flows for small and medium scale
pig farms in Vietnam. Nutr. Cycl. Agroecosyst., 94, 1-13.Watanabe S., Nakamura K., Ryu C.S., Iida M. and Kawashima S. (2011): Effects of different application methods of methane fermentation digested
liquid into the paddy plot on soil nitrogen behavior and rice yield. IDRE Journal, 79(4), 265-274. (in Japanese with English abstract)Watanabe T., Son T.T., Hung N.N., Truong N.V., Giau T.Q., Hayashi K. and Ito O. (2009): Measurement of ammonia volatilization from flooded paddy
fields in Vietnam. Soil. Sci. Plant Nutr., 55, 793-799.Win K.T., Toyota K., Motobayashi T. and Hosomi M. (2009): Suppression of ammonia volatilization from a paddy soil fertilized with anaerobically
digested cattle slurry by wood vinegar application and floodwater management. Soil. Sci. Plant Nutr., 55, 190-202.Win K.T., Toyota K., Nonaka R., Toyota K., Motobayashi T. and Hosomi M. (2010): Effects of option mitigating ammonia volatilization on CH4 and
N2O emissions from a paddy field fertilized with anaerobically digested cattle slurry. Biol. Fertil. Soils, 46, 589-595.Yamada R. (2008): Diagnosis, design and evaluation of diversified farming in the Mekong Delta of Vietnam: Based on the farming systems research
approach. Association of Agriculture and Forestry Statistics. Tokyo. Japan (in Japanese)Yamaoka M., Yuyama Y., Nakamura M., Shimizu N. and Oritate F. (2009): A planning model for transportation and land application of digested liquid to
farmland and an example calculation with the model. Res. Inst. Resour. Circ., Jpn. Soc. Irrig. Drain. Rural Eng., 5, 41-55. (in Japanese with English abstract)
Yamaoka M., Nakamura M., Aihara H., Shimizu N. and Yuyama Y. (2011): Development of a model for planning transportation and application of digested slurry to farmlands. IDRE Journal, 79(3), 89-96. (in Japanese with English abstract)
Yamaoka M., Yuyama Y., Nakamura M. and Oritate F. (2012): Enhancement of a model for planning transportation and application of digested slurry to farmlands -utilization of plural vacuum trucks and intermediate tanks-. IDRE Journal, 80(4), 53-61. (in Japanese with English abstract)
Yuge K., Maeda H., Tanaka M., Anan M. and Shinogi Y. (2014): Spatial-uniform application method of methane fermentation digested slurry with irrigation water in the rice paddy field. Paddy Water Environ., 12, 335-342.
Yuyama Y. (2004): Developing strategy on Diagnosis Model for Biomass Resources Circulative Use. Jour. JSIDRE, 72(12), 1037-1040. (in Japanese)Yuyama Y. (2005): Toward the holistic use of biomass resources (1)-Region-based diagnosis for the holistic use of biomass resources-. Jour. JSIDRE,
73(6), 501-506. (in Japanese)Yuyama Y., Nakamura M. and Yamaoka M. (2007): Technologies to use the digested liquid produced by methane fermentation. Trans. of JSIDRE, 247,
119-129. (in Japanese with English abstract)Zenmyo T., Yamakawa T. and Kikuchi M. (2009): Effect on rice growth of the different application of liquid phase of digested organic waste. Sci. Bull.
Fac. Agr., Kyushu Univ., 64(1), 1-5. (in Japanese with English abstract)
Received: 1 November 2016
農研機構研究報告 農村工学研究部門 第 1 号 (平成 29 年 3 月) ORITATE Fumiko:Use of Digested Slurry from Livestock Manure in Paddy Fields and its Environmental Effect in Southeast Asia198 199
ブック 1.indb 199 2017/03/22 10:05:57

東南アジアにおける家畜ふん尿消化液の水田における液肥利用とそれに伴う環境影響
折立文子 *
* 地域資源工学研究領域地域エネルギーユニット
要 旨
東南アジアにおける持続可能な地域バイオマス利用システムの構築を目指して,地域診断と現地圃場試験にもとづき,東南アジアの水田における家畜ふん尿消化液の液肥利用とその環境影響について検討した。稲作と畜産がさかんなベトナム南部の都市近郊農村を対象に,バイオマス利用に関する現状を分析し,家畜ふん尿や消化液の垂れ流しによる水域への窒素負荷状況とこれらのバイオガス生産への利用意義および消化液の水田液肥としての利用可能性を示した。また,現地の水田において,消化液の肥効や消化液施用後の田面水中の窒素および衛生指標菌の動態を調査し,施肥に伴う下流水域汚染は,消化液施用後に表面流出を一定期間生じないようにすることで防げることを示した。さらに,消化液の液肥利用を行う場合の施肥コストを試算し,消化液の濃度を現在の 5 倍にすることで,慣行栽培より施肥コストを下げることが可能であることを示した。今後の家畜ふん尿利用戦略に資するため,家畜ふん尿のバイオガスへの利用と消化液の水田への液肥利用を,東南アジア全体に導入した場合の水域への窒素負荷削減効果ならびに温室効果ガス削減効果について推定評価した。
キーワード: 東南アジア,地域バイオマス利用,バイオガスダイジェスター,水田,消化液,温室効果ガス
農研機構研究報告 農村工学研究部門 第 1 号 (平成 29 年 3 月) ORITATE Fumiko:Use of Digested Slurry from Livestock Manure in Paddy Fields and its Environmental Effect in Southeast Asia200 PB
ブック 1.indb 200 2017/03/22 10:05:57