use of mahoney tables in nigeria - sdngnet.comsdngnet.com/files/lectures/futa-arc-810 applied...
TRANSCRIPT

1
Topic;
Use of Mahoney tables in Nigeria
PREPARED BY
UKAONU CHIGOZIE EUSEBIUS
ARC/05 /5645
SUMMITED TO THE
DEPARTMENT OF ARCHITECTURE
FEDERAL UNIVERSITY OF TECHNOLOGY AKURE.
Sept, 2011.
2
Use of Mahoney Tables in Nigeria
Abstract The use of Mahoney tables in Nigeria cannot be overemphasised especially as it concerns architectural designs and development. This is true because its use enhances the architectural performances and integrity of the country, through its conscious integration of climatic conditions and variables in the pre- design stages that guarantees thermal comfort and the efficient use of energy and material resources, a hallmark of sustainable architecture. Mahoney table consist of the simultaneous investigation and scrutiny of the effects of climate variables such as air temperature, humidity, rainfall which aid in the prediction of the climatic reality of a particular location.
However the use of Mahoney tables in architectural designs have been under –utilized due ignorance of how it is used by some architects who show little effort in its use, since little or no remuneration is paid for the effort. Thus, this paper is aimed to review and analyze the use of the Mahoney table as a design guide lines, rather, as an evaluation tool, which provide design recommendations on the building design using climatic data used in the pre-design stages of architectural development to optimize its benefits in Nigeria.
Key words: Climatic Analysis, Thermal Comfort, Architectural Designs, Sustainability, Climatic Zones.
1.0 Introduction
Climate and environmental conditions are very important in the building design because buildings are created to improve and regulate the natural atmosphere to achieve human comfort. Comfort according to Givoni, (1976) is defined as the sensation of the complete physical and mental wellbeing of a person within a built environment. Moreover, the use of Mahoney tables have become crucial as an evaluative tool that provide sufficient design guide lines that attempts to integrate climatic considerations in the proposals of architectural solutions in the different climatic zones of Nigeria which reduce occurrences of environmental problems. Thus its use is proposed as an intrinsic aspect of the processes of architectural proposals in order to maintain necessary balance in both the interior and exterior atmosphere (comfort) via effective use of materials in the formation of building elements. Hence, architects are challenged to incorporate the use of this tool.
1.1 State of the Problem
Climatic considerations have been ignored or forgotten by architects in last few decades in architectural design decision making process especially in Nigeria. This is evident in the rate of building deterioration and misfit of materials in their designs and developments. The increased discomfort experienced in buildings, and the alarming rate of environment problems as a result of negligence of the climate, has provoked the need to integrate climate conditions in architectural designs and developmental processes. This can be achieved via the use of Mahoney tables which reveals how to assimilate bioclimatic approach in the practice of architectural design in the contemporary architecture.

3
1.2 Aim of Mahoney Tables.
The tables provide design guidelines for climatic responsive and effective architectural designs and developments by the use of climatic analysis and simple calculations of the sequential climatic data of air temperature, humidity and rainfall.
1.3 Definition of Mahoney Tables
The Mahoney tables are a set of reference tables used in architecture, as a guide to climate-appropriate design( Wikipedia, the free encyclopedia). Mahoney tables provide result of thermal comfort analysis using primarily temperature and humility data and recommendations of redesigns guidelines. (JAABE, vol. 5. no 1. 2006.)
Mahoney tables, as an evaluation tool, which provide design recommendations on the building design using climatic data [that enhances the acclimatisation of architectural designs and developments that reduces natural thermal stress in an environment or locations].
2.0 Brief History
Mahoney tables are named after architect Carl Mahoney, who worked on them together with John Martin Evans, and Otto Königsberger. They were first published in 1971 by the United Nations Department of Economic and Social Affairs. The concept developed by Mahoney (1968) in Nigeria provided the basis of the Mahoney Tables, later developed by Königsberger, Mahoney and Evans (1970), published by the United Nations in English, French and Spanish, with large sections included in the widely distributed publication by Königsberger et al. (1978). The Mahoney Tables (Evans, 1999; Evans, 2001) proposed a climate analysis sequence that starts with the basic and widely available monthly climatic data of temperature, humidity and rainfall, such as that found in HMSO (1958) and Pearce and Smith (1990), or data published by national meteorological services, for example SMN (1995). Today, the data for most major cities can be downloaded directly from the Internet from sites such as; (http://www.wunderground.com/global/AG.html, 2006). —John Martin Evans, the Comfort Triangles. However these data should be verified from localized authority to certify its validity.
2.1 Outline of Mahoney Tables.
The tables use readily-available climate data and simple calculations to give design guidelines, in a manner similar to a spreadsheet, as opposed to detailed thermal analysis or simulation. There are six tables; four are used for entering climatic data, for comparison with the requirements for thermal comfort; and two for reading off appropriate design criteria. A rough outline of the table usage is:
1. Air Temperatures. The max, min, and mean temperatures for each month are entered into this table.
2. Humidity, Precipitation, and Wind. The max, min, and mean figures for each month are entered into this table, and the conditions for each month classified into a humidity group.
3. Comparison of Comfort Conditions and Climate. The desired max/min temperatures are entered, and compared to the climatic values from table 1. A note is made if the conditions create heat stress or cold stress (i.e. the building will be too hot or cold).
4. Indicators (of humid or arid conditions). Rules are provided for combining the stress (table 3) and humidity groups (table 2) to check a box classifying the humidity and
4
aridity for each month. For each of six possible indicators, the number of months where that indicator was checked is added up, giving a yearly total.
5. Schematic Design Recommendations. The yearly totals in table 4 correspond to rows in this table, listing schematic design recommendations, e.g. 'buildings oriented on east-west axis to reduce sun exposure', 'medium sized openings, 20%-40% of wall area'.
6. Design Development Recommendations. Again the yearly totals from table 4 are used to read off recommendations, e.g. 'roofs should be high-mass and well insulated'. ( Source Wikipedia, the free encyclopedia)
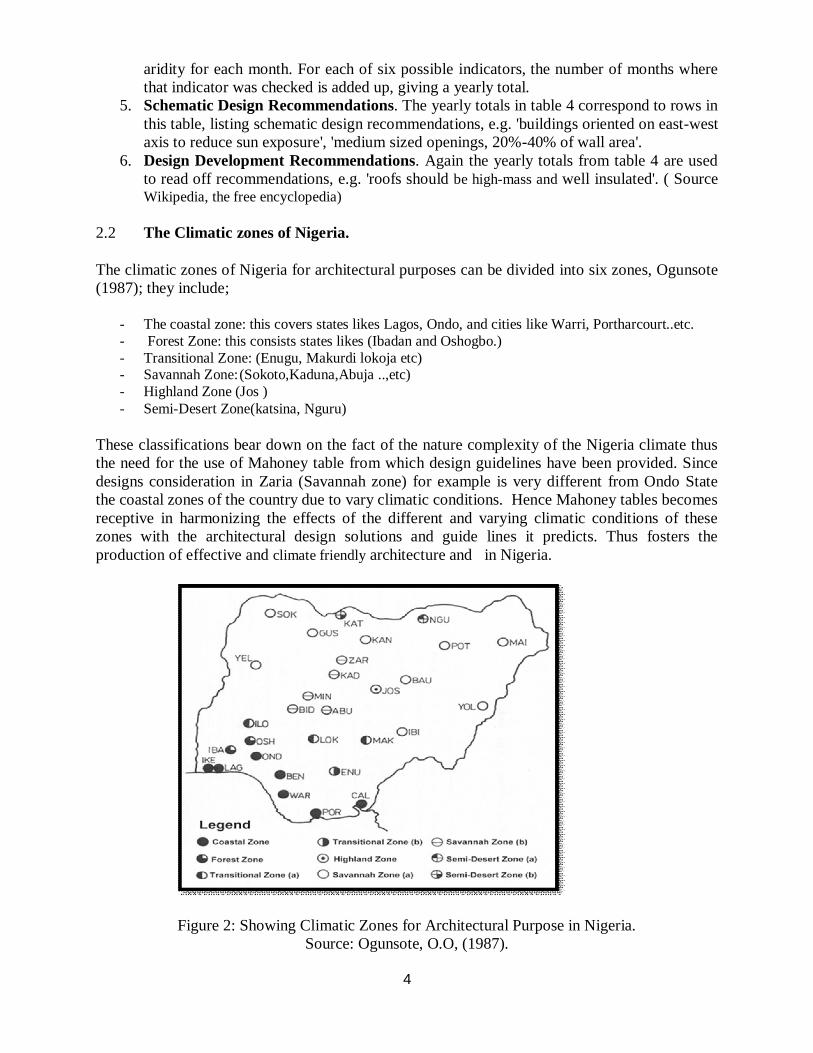
2.2 The Climatic zones of Nigeria.
The climatic zones of Nigeria for architectural purposes can be divided into six zones, Ogunsote (1987); they include;
- The coastal zone: this covers states likes Lagos, Ondo, and cities like Warri, Portharcourt..etc. - Forest Zone: this consists states likes (Ibadan and Oshogbo.) - Transitional Zone: (Enugu, Makurdi lokoja etc) - Savannah Zone: (Sokoto,Kaduna,Abuja ..,etc) - Highland Zone (Jos ) - Semi-Desert Zone(katsina, Nguru)
These classifications bear down on the fact of the nature complexity of the Nigeria climate thus the need for the use of Mahoney table from which design guidelines have been provided. Since designs consideration in Zaria (Savannah zone) for example is very different from Ondo State the coastal zones of the country due to vary climatic conditions. Hence Mahoney tables becomes receptive in harmonizing the effects of the different and varying climatic conditions of these zones with the architectural design solutions and guide lines it predicts. Thus fosters the production of effective and climate friendly architecture and in Nigeria.
Figure 2: Showing Climatic Zones for Architectural Purpose in Nigeria. Source: Ogunsote, O.O, (1987).
5
2.3 Use of Mahoney Tables in Relation to Thermal Comfort
Architects or environmental engineers should provide comfort in the buildings they design or develop. This can be achieved through the use of Mahoney tables since studies have shown that the occupant’s most important consideration is thermal comfort.
Thermal comfort according to ASHRAE is defined as that state of mind which expresses satisfaction with the thermal environment. How to ensure that buildings will be thermally comfortable for their occupants depends on the provision the "right" temperature for comfort of which Ogunsote refers to as the limits within which people are likely to feel comfortable. Knowledge of these limits will be used to determine the degree of discomfort and the conditions such as the humidity and the temperature range, which are experienced simultaneously with uncomfortable or hot temperatures.
One problem with this is that the "right" temperature or temperature will vary from person to person and from time to time depending on people's thermal experience.
Another problem is that other things effect how hot or cold we feel, in particular the humidity and the air movement in the space, how much clothing people are wearing and their metabolic rate (how hard one works).Irrespective of these difficulties it is better to attempt providing thermal comfort for a relatively larger people of which Ogunsote asserts to be 50 -70 % as compare to special few cases.
Nevertheless, the first result of the Adaptive Principle is that people are comfortable at the mean (over time) of the thermal conditions they experience. This means that if they can take adequate adaptive actions to make them comfortable and if these actions are not restricted by the circumstances, then they will make themselves comfortable. Examples of actions which people might take to make them comfortable in a given environment are the addition of removal of clothing, adjustments of posture or changes of activity.
A greater adaptive opportunity allows occupants to remain comfortable in variable conditions (Baker 1995). Hence the conditions which people consider "usual" will vary with their climate, season, activity, and their culture. The likely effects of these factors on people’s expectations are more fully considered to enable architects and engineers to create buildings which are comfortable.
6
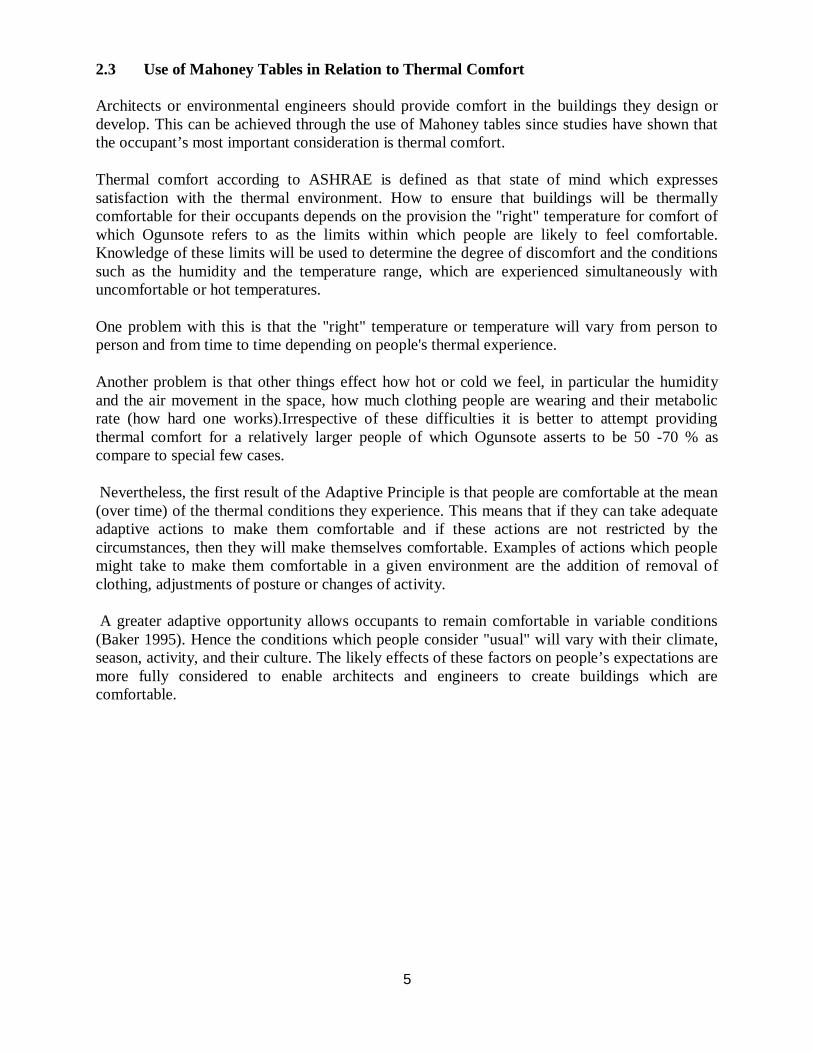
Figure 2: Showing a Model of Thermal Comfort via Heat Balance.
Source: (Max Fordham)
2.4 Mahoney Tables as a Tool of Architectural Sustainability.
Mahoney tables are used as a tool for sustainable development since its predictions and recommendations aims at reduced energy consumptions and efficient use of materials. According to Brundtland report of 1987, he defined sustainable development as “a development that meets the present needs without jeopardising the ability of future generation to meet their own need.
However proposals of building designs and developments that are eco- friendly and climate responsive is sustainable but this cannot be achieved accurately without the use of Mahoney tables that analyzes the climatic data supplied by the location and provides design guide lines in the preliminary stages of the design and developments.
2.5 Prospects of the use of Mahoney tables in Nigeria.
The prospects of the use of Mahoney tables is not stable as no reward is pledged to it as earlier conferred but current environmental problems and climatic harshness such as land slide ,flooding , and failed buildings have provoked its renaissance by hardworking and proactive architects who have devoted ample time and effort in its use (without special reward) and have encouraged its use as a tool to attain the global trend of sustainable development, green architecture , and climate change of which Nigeria is not an exception.
3.0 Description of the Use of the Mahoney Table.
The Mahoney tables are divided into four compartment of which includes the following:
Data collection. Thermal stress. Remedial actions. Design Recommendation. (Ogunsote ,1978)
7
3.0.1 Data collection
This include the collection of the mean data about air temperature, humidity and rainfall are required for the Mahoney tables. The monthly mean minima and maxima of the air temperature.
The monthly mean and maxima of the relative humidity and the monthly mean rainfall are obtained and entered in table 1 of the Mahoney table.
The monthly mean range of temperature is obtained by subtracting the minimum from the maximum monthly temperature. The annual mean temperature (AMT) is the average of the highest monthly mean maximum and the lowest monthly mean minimum temperature.
The annual mean range (AMR) is the difference between the highest monthly mean maximum temperature and the lowest monthly mean minimum temperature.
The monthly mean relatively humidity is obtained by subtracting the minimum from the maximum relative humidity. This average is used to determine the humidity group with the aid of table 2.
3.0.2 Thermal Stress
The thermal stress both for the day and night is obtained for each month of the year. To do this, the comfort limits for each month must be determined from the table.tit is note worthy to assert tht the annual mean temperature for Nigeria cities is usually 20 degree Celsius and is used in first column of the table. The humidity group for the months is used to determined the lower limits for the day and night and these are entered in the table.
The thermal stress is obtained by comparing the temperature with the comfort limits. The maximum temperature is compared with the day comfort limits while the minimum temperature is compared with the night comfort limits. When the temperature is higher than the upper limits there is hot discomfort (H) while there is cold discomfort (C) when the temperature is lower than the lower comfort limit. Temperatures falling between the comfort limits are comfortable (O).
3.0.3 Remedial Actions The thermal stress gives an indication of the remedial actions; the architect can take to achieve comfort. It can be [diagnosed], how many months of the year there is need for ventilation, rain penetration and protection and thermal storage. This is specified by the humid and arid indicators.
The humidity indicators show whether the air movement is essential or only desirable .this is influenced but the thermal stress for the day, the humidity group and the range of temperature .the need for the rain protection depends on the amount of rainfall in a particular month.
The arid indicators deal with the thermal aspects of design. The need for thermal storages arises when there are hot days and cold nights. Uncomfortable night temperatures suggest outdoor sleeping while special treatment is required in cold climates. The total number of months when preventive action needs to be taken is recorded.

8
3.0.4 Design Recommendations The design recommendations are made on the basis of the remedial actions needed to be taken to alleviate thermal distress.hey deal with separate aspects of design.
Layout: the layout reduces the exposure to the sun when the heat is a problem while compact court yard planning is used when thermal storage is needed.
Spacing: the spacing ensures good ventilation in hot and humid climates and reduces breeze penetration in colder climates.
Air movement: The decision to use single or double banking is made on the basis of the need for ventilation and the thermal storage.
Size of openings; affects the ventilation rate. Large windows are recommended for hot and humid regions while small windows should be used when high insulation is required.
Position of openings: this affects the ventilation required from body cooling especially in hot and humid climates.
Protections of openings: from the direct sunlight and rainfall depend on the amount of excess heat and rainfall.
Walls and floors: this may be light or heavy depending on the need for insulation and thermal storage. Roofs: this may be in form of heavy, and light and well insulated or light with reflective surface and cavity.
Outdoors sleeping: this is provided when comfortable conditions cannot be maintained indoors at certain periods of the year.
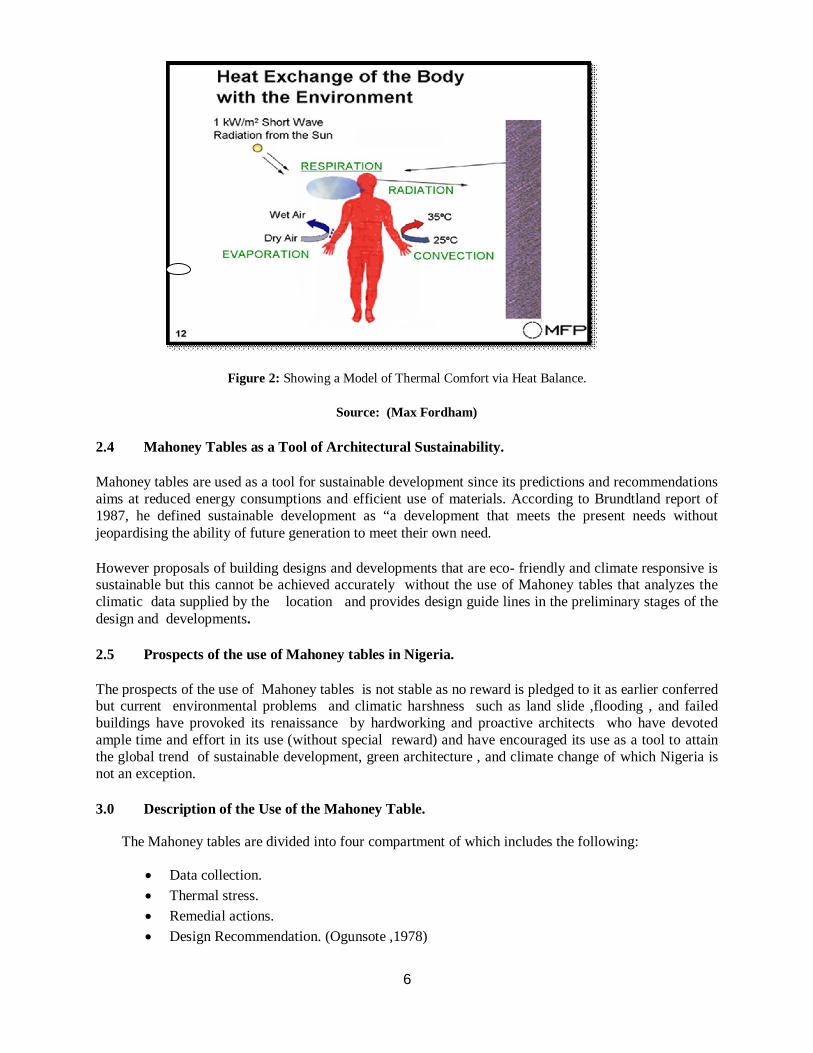
Jan Feb Mar Apr May Jun Jul Aug Sep Oct Nov
Dec
Mean Monthly Max. DBT(oC) Mean Monthly Min. Range Mean Monthly Max.
(RH %) Mean Monthly Min.
Average Humidity Group Mean Monthly Rainfall (mm)
Day Comfort Limits Min. Max.
Location Year Longitude Latitude Altitude Highest DBT Lowest DBT
AMT AMR
9
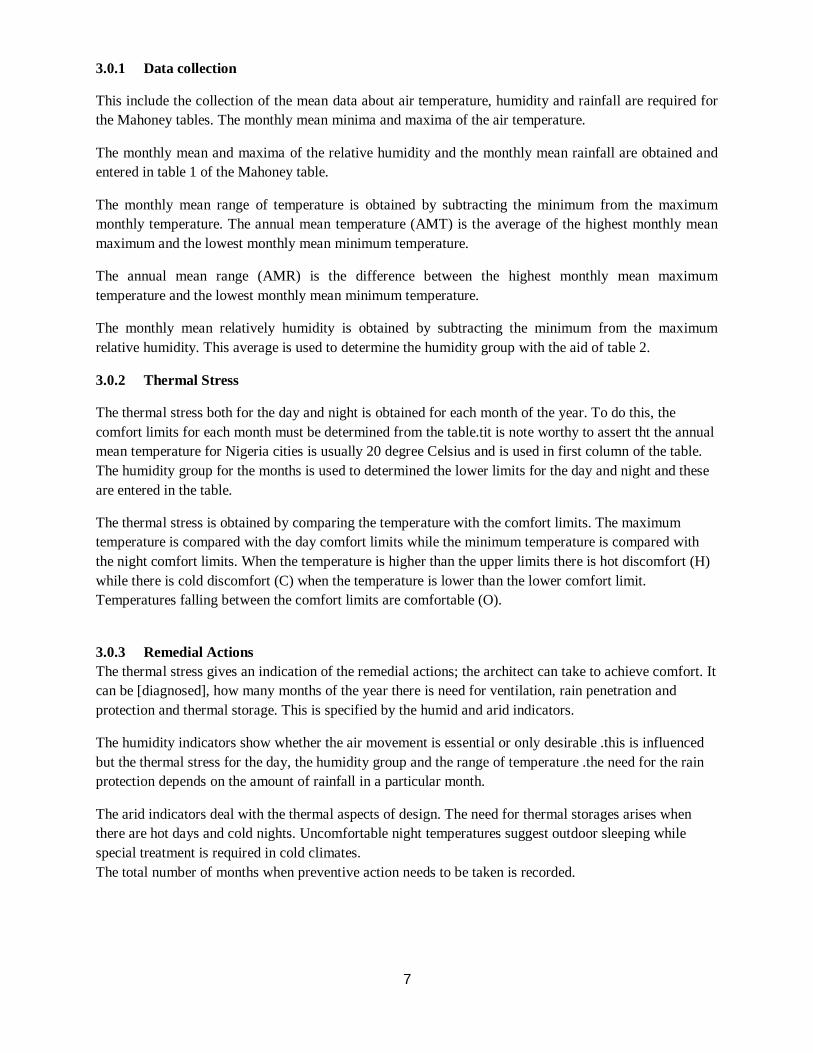
Night Comfort Limits Min. Max. Thermal Stress Day Night
Air Movement Essentials H1 Air Movement Desirable H2 Rain protection H3 Thermal Storage A1 Outdoor Sleeping A2 Cold-Season Problems A3
Figure 3: A Typical Mahoney Table: Data Collection and Analysis Table. Source: Ogunsote, O.O (1986).
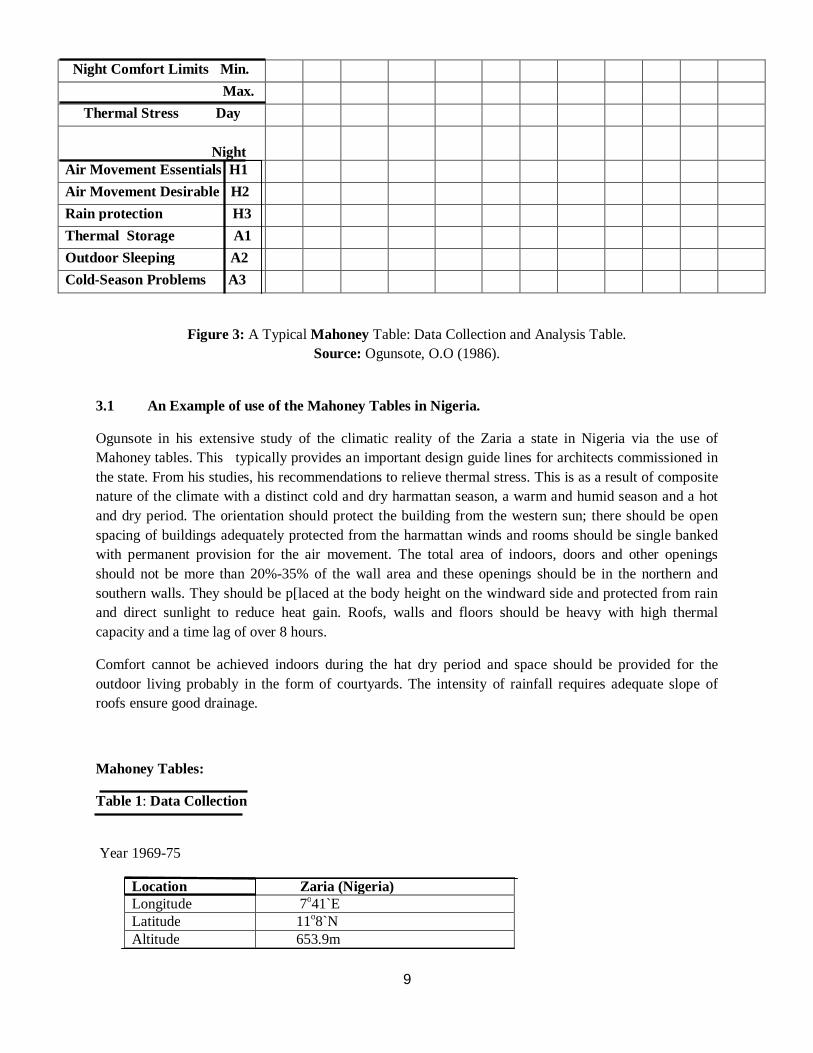
3.1 An Example of use of the Mahoney Tables in Nigeria.
Ogunsote in his extensive study of the climatic reality of the Zaria a state in Nigeria via the use of Mahoney tables. This typically provides an important design guide lines for architects commissioned in the state. From his studies, his recommendations to relieve thermal stress. This is as a result of composite nature of the climate with a distinct cold and dry harmattan season, a warm and humid season and a hot and dry period. The orientation should protect the building from the western sun; there should be open spacing of buildings adequately protected from the harmattan winds and rooms should be single banked with permanent provision for the air movement. The total area of indoors, doors and other openings should not be more than 20%-35% of the wall area and these openings should be in the northern and southern walls. They should be p[laced at the body height on the windward side and protected from rain and direct sunlight to reduce heat gain. Roofs, walls and floors should be heavy with high thermal capacity and a time lag of over 8 hours.
Comfort cannot be achieved indoors during the hat dry period and space should be provided for the outdoor living probably in the form of courtyards. The intensity of rainfall requires adequate slope of roofs ensure good drainage.
Mahoney Tables:
Table 1: Data Collection
Year 1969-75
Location Zaria (Nigeria) Longitude 7o41`E Latitude 11o8`N Altitude 653.9m
10
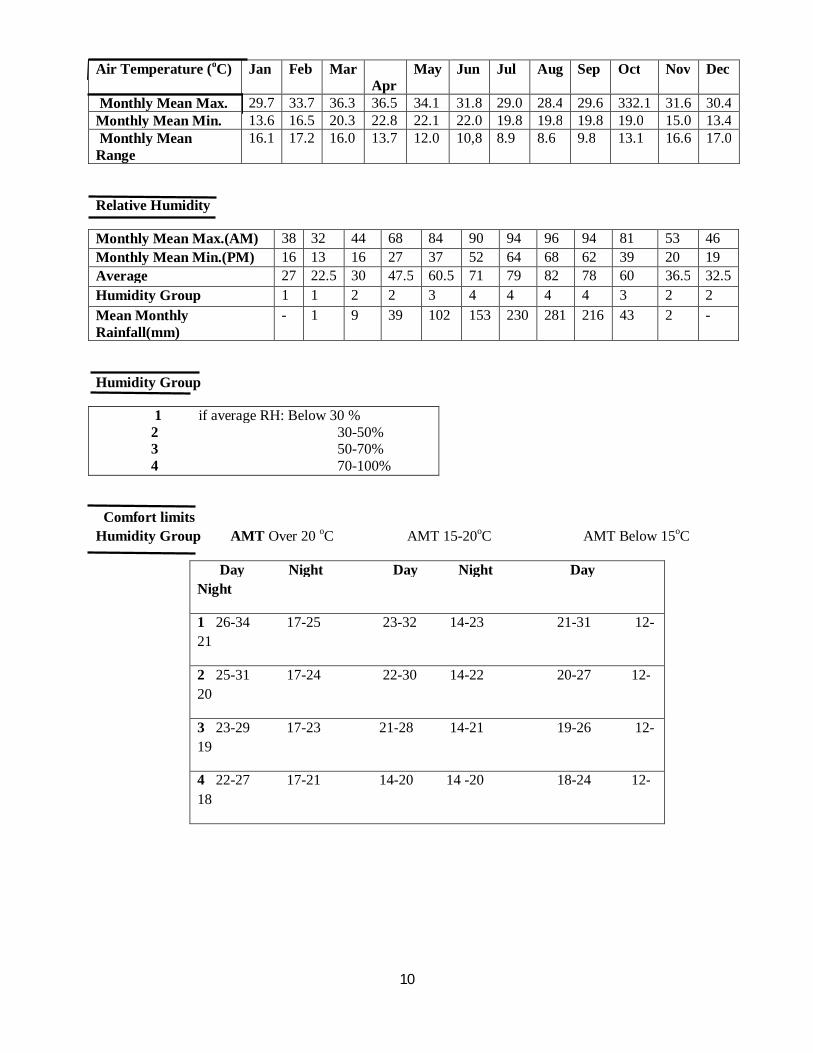
Air Temperature (oC) Jan Feb Mar Apr
May Jun Jul Aug Sep Oct Nov Dec
Monthly Mean Max. 29.7 33.7 36.3 36.5 34.1 31.8 29.0 28.4 29.6 332.1 31.6 30.4 Monthly Mean Min. 13.6 16.5 20.3 22.8 22.1 22.0 19.8 19.8 19.8 19.0 15.0 13.4 Monthly Mean Range
16.1 17.2 16.0 13.7 12.0 10,8 8.9 8.6 9.8 13.1 16.6 17.0
Relative Humidity
Monthly Mean Max.(AM) 38 32 44 68 84 90 94 96 94 81 53 46 Monthly Mean Min.(PM) 16 13 16 27 37 52 64 68 62 39 20 19 Average 27 22.5 30 47.5 60.5 71 79 82 78 60 36.5 32.5 Humidity Group 1 1 2 2 3 4 4 4 4 3 2 2 Mean Monthly Rainfall(mm)
- 1 9 39 102 153 230 281 216 43 2 -
Humidity Group
1 if average RH: Below 30 % 2 30-50% 3 50-70% 4 70-100%
Comfort limits Humidity Group AMT Over 20 oC AMT 15-20oC AMT Below 15oC
Day Night Day Night Day Night
1 26-34 17-25 23-32 14-23 21-31 12-21
2 25-31 17-24 22-30 14-22 20-27 12-20
3 23-29 17-23 21-28 14-21 19-26 12-19
4 22-27 17-21 14-20 14 -20 18-24 12-18
11
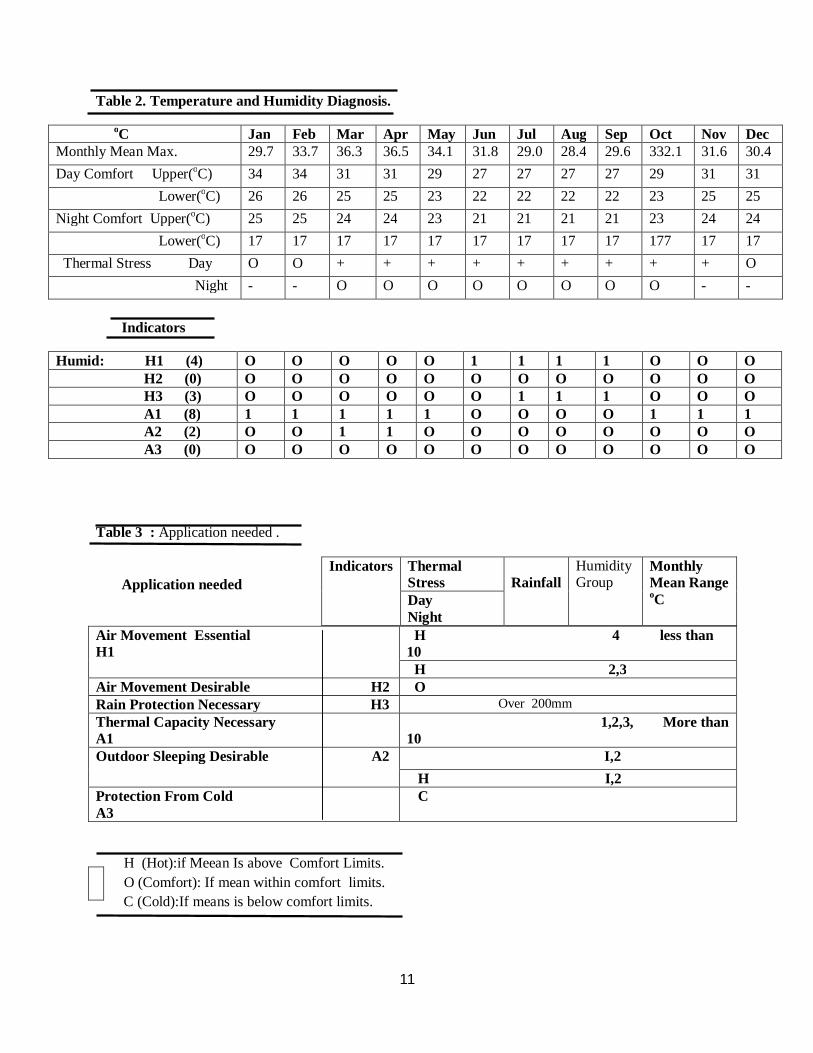
Table 2. Temperature and Humidity Diagnosis.
oC Jan Feb Mar Apr May Jun Jul Aug Sep Oct Nov Dec Monthly Mean Max. 29.7 33.7 36.3 36.5 34.1 31.8 29.0 28.4 29.6 332.1 31.6 30.4 Day Comfort Upper(oC) 34 34 31 31 29 27 27 27 27 29 31 31 Lower(oC) 26 26 25 25 23 22 22 22 22 23 25 25 Night Comfort Upper(oC) 25 25 24 24 23 21 21 21 21 23 24 24 Lower(oC) 17 17 17 17 17 17 17 17 17 177 17 17 Thermal Stress Day O O + + + + + + + + + O Night - - O O O O O O O O - -
Indicators
Humid: H1 (4) O O O O O 1 1 1 1 O O O H2 (0) O O O O O O O O O O O O H3 (3) O O O O O O 1 1 1 O O O A1 (8) 1 1 1 1 1 O O O O 1 1 1 A2 (2) O O 1 1 O O O O O O O O A3 (0) O O O O O O O O O O O O
Table 3 : Application needed .
Application needed
Air Movement Essential H1
H 4 less than 10 H 2,3
Air Movement Desirable H2 O Rain Protection Necessary H3 Over 200mm Thermal Capacity Necessary A1
1,2,3, More than 10
Outdoor Sleeping Desirable A2 I,2 H I,2
Protection From Cold A3
C
H (Hot):if Meean Is above Comfort Limits. O (Comfort): If mean within comfort limits. C (Cold):If means is below comfort limits.
Indicators Thermal Stress
Rainfall
Humidity Group
Monthly Mean Range oC Day
Night
12
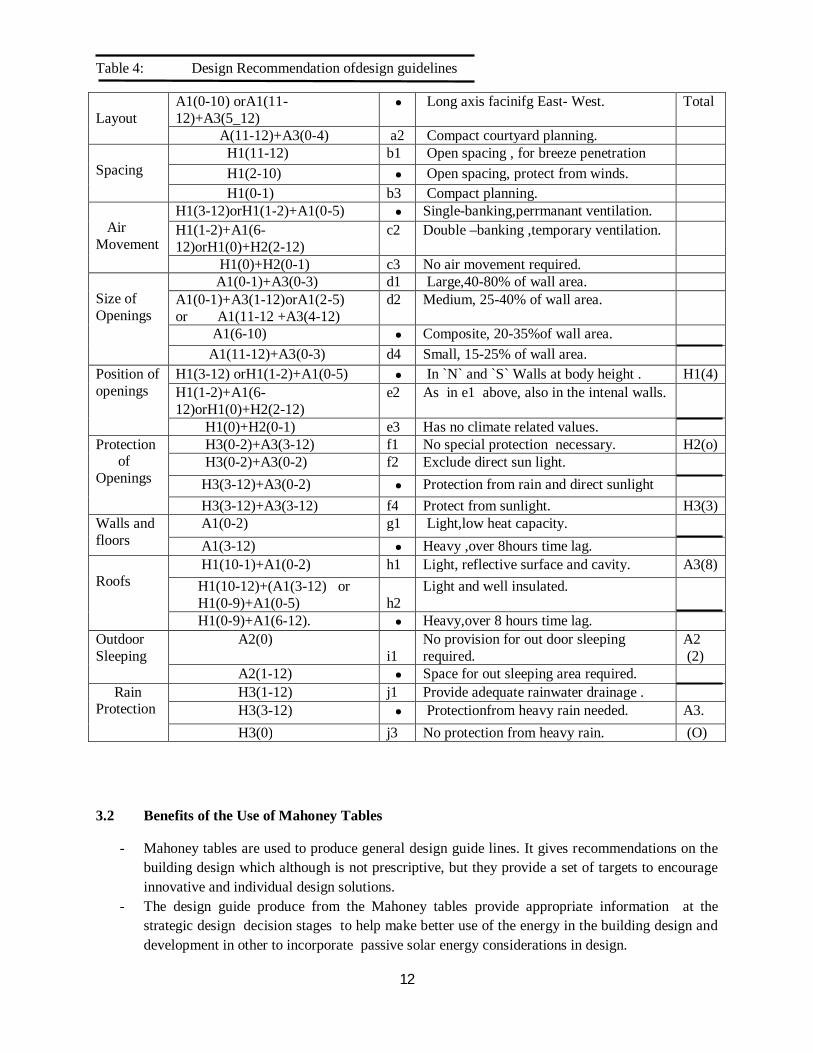
Table 4: Design Recommendation ofdesign guidelines
Layout
A1(0-10) orA1(11-12)+A3(5_12)
Long axis facinifg East- West. Total
A(11-12)+A3(0-4) a2 Compact courtyard planning. Spacing
H1(11-12) b1 Open spacing , for breeze penetration H1(2-10) Open spacing, protect from winds. H1(0-1) b3 Compact planning.
Air Movement
H1(3-12)orH1(1-2)+A1(0-5) Single-banking,perrmanant ventilation. H1(1-2)+A1(6-12)orH1(0)+H2(2-12)
c2 Double –banking ,temporary ventilation.
H1(0)+H2(0-1) c3 No air movement required. Size of Openings
A1(0-1)+A3(0-3) d1 Large,40-80% of wall area. A1(0-1)+A3(1-12)orA1(2-5) or A1(11-12 +A3(4-12)
d2 Medium, 25-40% of wall area.
A1(6-10) Composite, 20-35%of wall area. A1(11-12)+A3(0-3) d4 Small, 15-25% of wall area.
Position of openings
H1(3-12) orH1(1-2)+A1(0-5) In `N` and `S` Walls at body height . H1(4) H1(1-2)+A1(6-12)orH1(0)+H2(2-12)
e2 As in e1 above, also in the intenal walls.
H1(0)+H2(0-1) e3 Has no climate related values. Protection of Openings
H3(0-2)+A3(3-12) f1 No special protection necessary. H2(o) H3(0-2)+A3(0-2) f2 Exclude direct sun light. H3(3-12)+A3(0-2) Protection from rain and direct sunlight H3(3-12)+A3(3-12) f4 Protect from sunlight. H3(3)
Walls and floors
A1(0-2) g1 Light,low heat capacity. A1(3-12) Heavy ,over 8hours time lag.
Roofs
H1(10-1)+A1(0-2) h1 Light, reflective surface and cavity. A3(8) H1(10-12)+(A1(3-12) or H1(0-9)+A1(0-5)
h2
Light and well insulated.
H1(0-9)+A1(6-12). Heavy,over 8 hours time lag. Outdoor Sleeping
A2(0) i1
No provision for out door sleeping required.
A2 (2)
A2(1-12) Space for out sleeping area required. Rain Protection
H3(1-12) j1 Provide adequate rainwater drainage . H3(3-12) Protectionfrom heavy rain needed. A3. H3(0) j3 No protection from heavy rain. (O)
3.2 Benefits of the Use of Mahoney Tables
- Mahoney tables are used to produce general design guide lines. It gives recommendations on the building design which although is not prescriptive, but they provide a set of targets to encourage innovative and individual design solutions.
- The design guide produce from the Mahoney tables provide appropriate information at the strategic design decision stages to help make better use of the energy in the building design and development in other to incorporate passive solar energy considerations in design.
13
- Use of Mahoney tables promotes thermal comfort by the reduction of thermal stress which is predicted by the tool and the possible recommendations capable of reducing the thermal stress to a minimum.
- It provides vital climatic data that gives direction to design decision and also provides developments that reduces occurrences of environmental hazards like flooding and collapse of building, hence a tool of sustainable architecture.
- It conserves and promotes traditional and vernacular architectural benefits and promotes innovative indigenous design and development that is indigenous, creative and climatically responsive and functional.
- It promotes socio- economic growth by ensuring the efficient use of materials and energy resources (solar) that are readily available and usually are cheaper than their imported counterparts.
- It ensures appropriateness of the built environment thus resulting to architectural vistas that is capable of attracting tourist that improve inter and intra relationships.
- Also the use of Mahoney tables improve the health sector of the nation of any location via use of materials that are not hazardous in building development, since the buildings recommendations have been made via prediction Mahoney tables that guarantees its harmony with nature and how to use natural forces in a way that they could achieve a comfortable living condition in their dwellings in secured manner.
3.3 Obstacles of the Use of Mahoney Tables in Nigeria.
The obstacles of the use of Mahoney tables in Nigeria are unfortunate and its consequences evident in the deviances observed in the current developments from nature and climate characteristics of the climatic zones of the country. Some of the obstacles include;
• Insufficient records, updates and accessibility of climatic data for the use in the Mahoney analysis n the country.
• Lack of efficient use of the tables (ignorance) by building professionals and urban planners, thus its effect is neglected and tagged unimportant.
• Insufficient popularisation of the Mahoney tables and poor propaganda of its effectiveness in design and formation.
• Non application of its use due to Poor remuneration received in the application of Mahoney tables in the design processes.
• Poor support from the planning authorities in the formation of policies that will regulate and indent designs that does not sue the climatic conditions of a location.
• No reward mechanism that will encourage architects to be engaged in the practice of tits use in Nigeria.
• Increased Patronage of quackery has brought about professional anxiety for architects thus ‘prey’ for commissions without proper investigation of or carrying out preliminary research.

14
4.0 Recommendations on the Use of Mahoney Tables.
Climate responsive design strategies were used in traditional buildings while contemporary buildings do not follow these strategies (Opadhayay, 2006). Another study in turkey also shows that traditional buildings were better than contemporary buildings in terms of climatic design and thermal comfort. Hence traditional techniques is ignored or misunderstood. However use of Mahoney table serves as a rescue that can responsively inculcate traditional building techniques into the contemporary designs and developments to achieve dual benefits of both techniques.
Use of Mahoney tables suggest the buildings in harmony with the nature and how to use natural forces in a way that they could achieve a comfortable living condition in the dwellings. Architects can improve the living qualities by following some simple rules in architectural and urban design and integrate and relate them to the climate via use of the Mahoney table.
Government should do well to improve the remuneration of architects, this will help boost effort in their proposals of sustainable designs in divorce to the environmental problems (flooding and collapse buildings, etc) experienced as a direct result of the built environment
A crucial need for climatic data bank of the Nigeria n climate is emphasized; hence conscious records of the data is expected by the planning and metrological departments of the country and should be easily accessible by all sundry. Also, effective monitoring and supervisory teams are expected to regulate and enforce findings that are decisive to sustainable development.
Climatic education is decisive at this period of incessant climatic harshness (intense precipitation) and environmental problems (flooding) and the likes, this will instil caution in the activities of the populace and encourage the incorporation of climate conditions in their development of which Mahoney tables improvise.
The use of Mahoney tables should be introduced in all institutions and schools of architecture .this will acculturate its applications in design processes and developments in the practice of the young architects.
5.0 Conclusion.
In this paper, the use of Mahoney tables has been revealed and its pivotal role of integrating the climatic conditions of localities in the design formation of the building proposals has been noted vis –a-vis its prediction of design guides that fosters the efficient use of materials thus the production of eco-freindly develoments. However,somes obstacles impedes the use of the tables of which includes shear ignorance of its eixtence by some architect professionals who are further discouraged by the poor remuneration recieved by the of few architects who endeavour to incopertae this knowlegde their designs.Nevertheless ,with the curent alarming rate of climate disturbances intesnse precipipations that results to environmental decadancde such as flooding , the prospects of its use is imperative to supply provide vital climatic information in the design proceses that are percussive and capable of arresting negative environmental and climatic impacts on architectural developments.
Moreover , the use of the Mahoney tables have been shown capable of improving the socio-economic and health sectors of the country through its suggestion of efficient designs via effective material and energy use hence presuposes sustainability .Thus, Mahoney tables are sustainable tools that should be used and encouraged in design analysis.
15
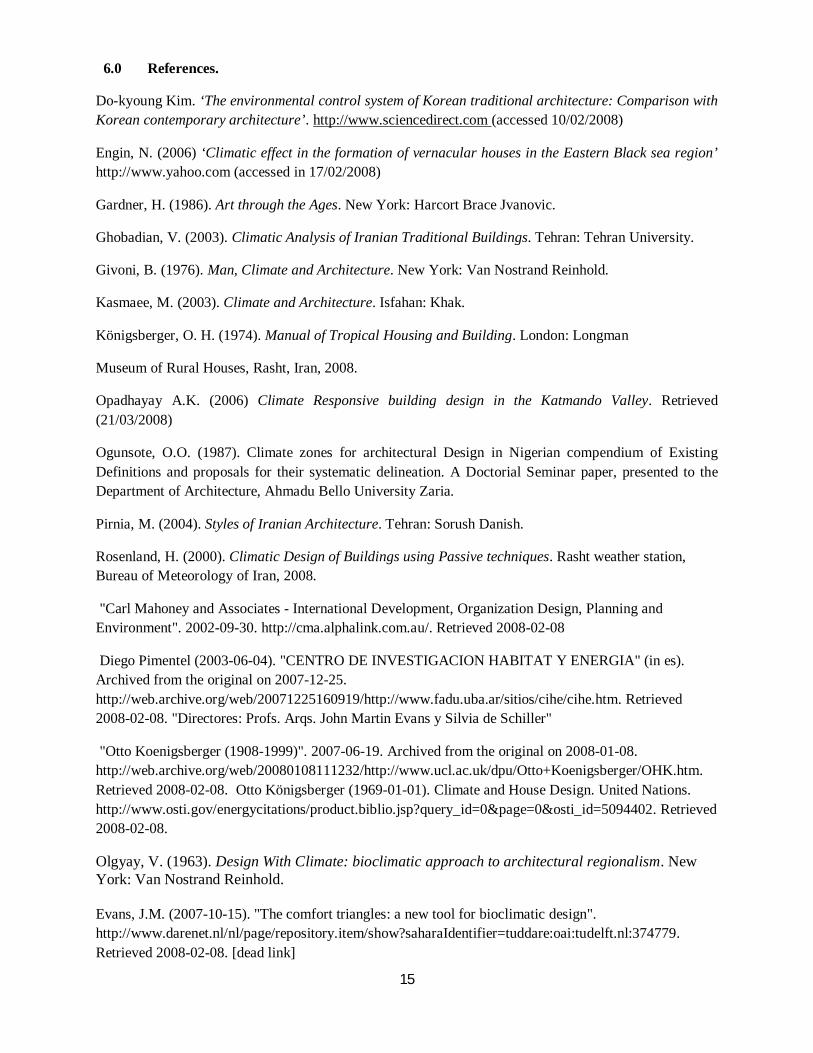
6.0 References.
Do-kyoung Kim. ‘The environmental control system of Korean traditional architecture: Comparison with Korean contemporary architecture’. http://www.sciencedirect.com (accessed 10/02/2008)
Engin, N. (2006) ‘Climatic effect in the formation of vernacular houses in the Eastern Black sea region’ http://www.yahoo.com (accessed in 17/02/2008)
Gardner, H. (1986). Art through the Ages. New York: Harcort Brace Jvanovic.
Ghobadian, V. (2003). Climatic Analysis of Iranian Traditional Buildings. Tehran: Tehran University.
Givoni, B. (1976). Man, Climate and Architecture. New York: Van Nostrand Reinhold.
Kasmaee, M. (2003). Climate and Architecture. Isfahan: Khak.
Königsberger, O. H. (1974). Manual of Tropical Housing and Building. London: Longman
Museum of Rural Houses, Rasht, Iran, 2008.
Opadhayay A.K. (2006) Climate Responsive building design in the Katmando Valley. Retrieved (21/03/2008)
Ogunsote, O.O. (1987). Climate zones for architectural Design in Nigerian compendium of Existing Definitions and proposals for their systematic delineation. A Doctorial Seminar paper, presented to the Department of Architecture, Ahmadu Bello University Zaria.
Pirnia, M. (2004). Styles of Iranian Architecture. Tehran: Sorush Danish.
Rosenland, H. (2000). Climatic Design of Buildings using Passive techniques. Rasht weather station, Bureau of Meteorology of Iran, 2008.
"Carl Mahoney and Associates - International Development, Organization Design, Planning and Environment". 2002-09-30. http://cma.alphalink.com.au/. Retrieved 2008-02-08
Diego Pimentel (2003-06-04). "CENTRO DE INVESTIGACION HABITAT Y ENERGIA" (in es). Archived from the original on 2007-12-25. http://web.archive.org/web/20071225160919/http://www.fadu.uba.ar/sitios/cihe/cihe.htm. Retrieved 2008-02-08. "Directores: Profs. Arqs. John Martin Evans y Silvia de Schiller"
"Otto Koenigsberger (1908-1999)". 2007-06-19. Archived from the original on 2008-01-08. http://web.archive.org/web/20080108111232/http://www.ucl.ac.uk/dpu/Otto+Koenigsberger/OHK.htm. Retrieved 2008-02-08. Otto Königsberger (1969-01-01). Climate and House Design. United Nations. http://www.osti.gov/energycitations/product.biblio.jsp?query_id=0&page=0&osti_id=5094402. Retrieved 2008-02-08.
Olgyay, V. (1963). Design With Climate: bioclimatic approach to architectural regionalism. New York: Van Nostrand Reinhold. Evans, J.M. (2007-10-15). "The comfort triangles: a new tool for bioclimatic design". http://www.darenet.nl/nl/page/repository.item/show?saharaIdentifier=tuddare:oai:tudelft.nl:374779. Retrieved 2008-02-08. [dead link]

16
Dean Heerwagen (2003). Passive and Active Environmental Controls. McGraw-Hill Professional. ISBN 0072922281.
http://books.google.co.uk/books?id=jt8BvpULmK8C&dq=%22using+the+mahoney+tables%22&as_brr=3. Retrieved 2008-02-08 (Table 7).
Appendix
Pic. 1. Flooding situation in Ibadan, Oyo State Nigeria.
Source: Sahara Reporters, 2011.
Pic 1. Flooding situation in Ibadan, Oyo State Nigeria. Emphasis on Collapsed structures.
Source: Sahara Reporters, 2011.
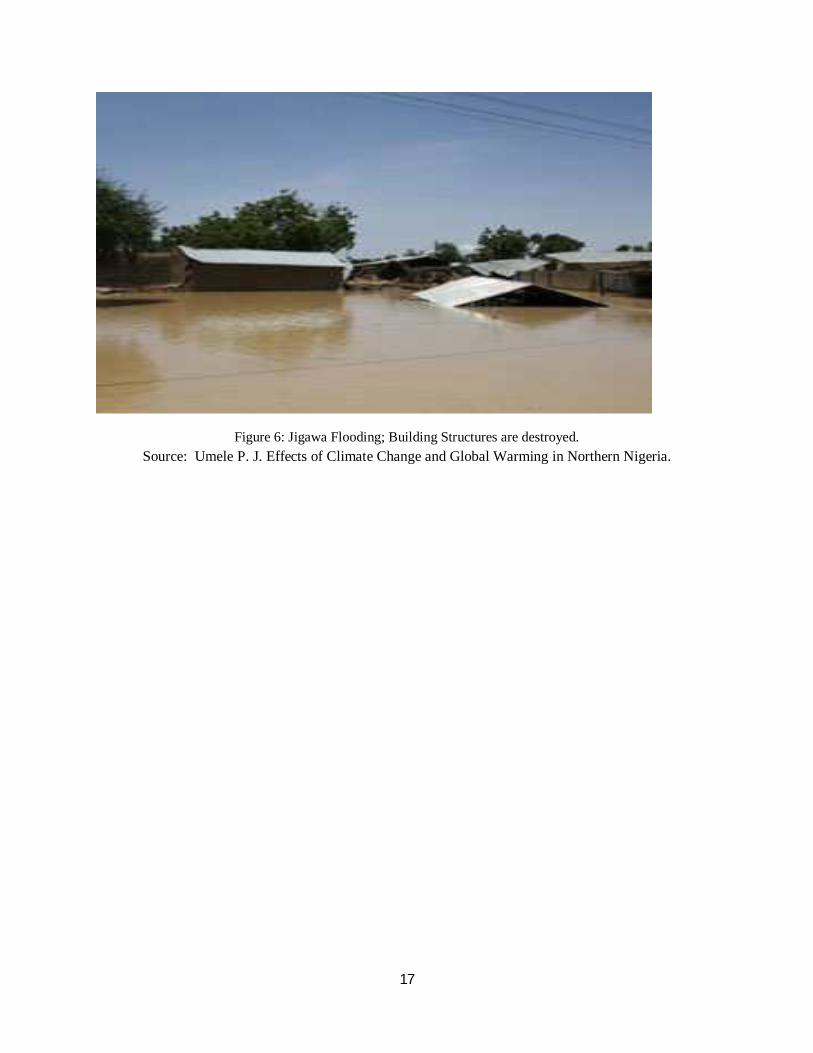
17
Figure 6: Jigawa Flooding; Building Structures are destroyed. Source: Umele P. J. Effects of Climate Change and Global Warming in Northern Nigeria.