use of microseismic monitoring data as an aid to rock ... · the fraser morgan mine is a blasthole...
TRANSCRIPT

1. INTRODUCTION
Glencore’s Sudbury Integrated Nickel Operations
includes three underground operations, the Nickel Rim
South Mine, Fraser Copper Mine, and Fraser Morgan
Mine, all located near Sudbury, Ontario, Canada (Figure
1).
Fig. 1. Simplified plan view of the Sudbury Basin. The Fraser
Complex is located near the village of Onaping, and the
Nickel Rim South Mine is located just past the municipal
airport near the village of Skead.
Fraser Morgan is a nickel deposit accessed via the Fraser
Copper Mine infrastructure. Close to 2 million tonnes
per year of ore are mined underground from all
operations, with Nickel Rim South providing the
majority of the material at 1.3 Mt/year.
All three operations are hard rock mines, with excellent
rockmass quality. The depth of mining is sufficient to
develop pervasive stress fracturing around most
openings (Figure 2).
Mining induced seismicity occasionally causes stability
problems in the form of rockbursting or seismically
induced falls of ground. Although the incidents are rare,
the potential safety impact can be large. Seismic
monitoring has become the main geomechanical tool to
track and understand the rockmass response to mining,
and to provide short term feedback for blasting and large
seismic events.
All three mines deploy seismic monitoring systems
provided by Engineering Seismology Group Canada Inc.
(ESG), based in Kingston, Ontario, Canada. The gradual
expansion of mining is managed by incremental
additions/improvements to each of the seismic arrays.
ARMA 15-374
Use of Microseismic Monitoring Data as an Aid to Rock
Mechanics Decision Making and Mine Design Verification
Simser, B.
Sudbury Integrated Nickel Operations, A Glencore Company, Sudbury, ON, Canada
Deredin, R., and Jalbout, A.
Sudbury Integrated Nickel Operations, A Glencore Company, Sudbury, ON, Canada
Butler, T.
Engineering Seismology Group (ESG), Canada Inc., Kingston, ON, Canada
Copyright 2015 ARMA, American Rock Mechanics Association
This paper was prepared for presentation at the 49th US Rock Mechanics / Geomechanics Symposium held in San Francisco, CA, USA, 28 June-
1 July 2015.
This paper was selected for presentation at the symposium by an ARMA Technical Program Committee based on a technical and critical review of the paper by a minimum of two technical reviewers. The material, as presented, does not necessarily reflect any position of ARMA, its officers, or members. Electronic reproduction, distribution, or storage of any part of this paper for commercial purposes without the written consent of ARMA is prohibited. Permission to reproduce in print is restricted to an abstract of not more than 200 words; illustrations may not be copied. The abstract must contain conspicuous acknowledgement of where and by whom the paper was presented.
ABSTRACT: Case studies are presented from Glencores’ Fraser Copper, Fraser Morgan and Nickel Rim South Mines showing
how microseismic monitoring data can be used as an aid to rock mechanics decision making and design verification. At Nickel Rim
South and Fraser Morgan, examples of how recorded development blasts can be used to quickly evaluate source location accuracy
and infer the state of rockmass conditions are given. Examples are given as to how network sensitivity can enhance the
understanding of the rockmass response to mining are also presented and a case is made for 3D velocity models and recognizing
the impact of waveform attenuation from raypath effects, and yielded rockmass conditions. At Fraser Copper, a case history shows
how seismic information was useful for evaluating the performance of a successful longhole destress blast that was performed
when face-bursting was encountered during a planned underhand extraction of a highly stressed remnant.

Fig. 2. (a) Example of stress fracturing caused by high stress revealed after extending an opening from 10m to 16m, 1480m below
surface. A section view schematic indicating fractures visible in sidewall is shown in the top right corner. (b) Stress fractures
visible when benching the floor of an excavation.

The different states of the seismic systems installed at
each mine provide an opportunity to show the value
added from different levels of data quality, and the
improvements made by deploying dense arrays with
wide dynamic range. Some thoughts on improving future
seismic system installations to get better spatial coverage
earlier in the life of a mine are discussed.
1.1. Nickel Rim South Mine Nickel Rim South Mine is a primary/secondary blasthole
mine which is relatively deep (1100 to 1710m below
surface) with horizontal stresses approximately 1.6x
vertical. The mine has a complex system of faulting and
variable geology, but generally high quality rock.
Nickel Rim South Mine has the inherent advantage of
being a relatively new mine (first stoping in 2009) where
the seismic system was planned from the early stages.
For example, fibre optic communications were
established at every electrical substation from the initial
project phase. As a result, a very dense microseismic
array was installed early in the mine life, providing
useful information for ground control engineers to
evaluate the rock mass response to mining. A short case
history is provided showing how recorded development
blasts are used to gauge rockmass conditions.
1.2. Fraser Copper Mine The Fraser Copper Mine is a narrow vein deposit mined
using a mixture of mining methods. Most of the historic
production has been mined with overhand cut and fill.
The vein orientation can be erratic with an overall dip of
45° with local rolls going from horizontal to vertical.
The steeper veins are usually extracted with blasthole
methods, especially in sill pillar areas. Flat veins are
mined with drift and fill methods The Fraser Copper
Zone is below the historic Strathcona Mine which
operated in the late 1960’s until the late 1980’s, with the
narrow vein mining starting in the early 1980’s. The
seismic communication infrastructure has been more of a
challenge, with fibre optic only being made available for
seismic monitoring in the last few years. The original
backbone of the system was via copper cable to surface.
High stress remnant extraction of intermediate dipping
veins has proven to be a significant challenge at Fraser
Copper. The squat nature of the narrow vein sill pillar
can hold very high stress until the very late stages of
extraction. A case history showing the performance of a
planned underhand extraction of a highly stressed
remnant is given. Face bursting necessitated a change
from the mining plan and a successful long hole destress
blast was conducted. The performance of the destress
blast, as well as the overall rockmass response to mining
in this area is presented using microseismic data and
underground observations.
1.3. Fraser Morgan Mine The Fraser Morgan Mine is a blasthole nickel mine
offset a few kilometers from the narrow vein Fraser
copper mining and is accessed via the same shaft system.
It has a separate seismic array which monitors activity
from two distinct mining zones between 1000 and
1500m below surface. The array first started recording
events in May 2013, and has been incrementally
expanded as mine development has progressed. In
essence, the mine seismic coverage varies considerably
due to practical implementation and logistical issues.
Areas of poor coverage are gradually being addressed,
but uniform coverage across the three mines is not
currently possible. A short case history is shown using
recorded development blasts to gauge rockmass
conditions in a similar fashion to the analysis performed
on Nickel Rim South data.
2. NICKEL RIM SOUTH MINE
Nickel Rim South Mine started stoping operations in
May 2009, and the early version of the seismic
monitoring program started in January 2009. The
seismic array includes a mixture of uniaxial
accelerometers and 15 Hz triaxial geophones. The
geophones were incrementally added starting in 2010 to
provide improved dynamic range. The uniaxial
accelerometer array quantifies seismic moment
accurately from moment magnitude -2.0 to -0.5. For
events with magnitude > -0.5, the calculated energy and
moment are known to be underestimated due to the lack
of low frequency response from this specific type of
accelerometer (Figure 3). Data from 2010 for the
blended sensor array is shown in Figure 4. The overall
linearity of the power law distribution (Gutenberg-
Richter relation) is improved above moment magnitude
-0.5. The 15 Hz geophones capture lower frequency
information which significantly contributes to the
moment magnitude estimate for larger seismic events.
Although there may be other possible explanations for
the deviation from linearity when plotting the log
cumulative number of events versus magnitude, the
assumption is that deviations are due mainly to
inadequate seismic moment estimates. Recorded
blasting events will, for example, deviate from the power
law distribution relative to rock fracturing or structural
slip type events.
The Nickel Rim South seismic array has the benefit of
both hangingwall and footwall access (Figure 5). In
2014 there were a total of 44 sensors with an average
sensor spacing of 120m. Some bias towards the west
flank of the orebody exists for sensor location as this is
where most of the development was in the early days of
the mining (2007 to 2009) and development access was
conducive towards fast deployment of the seismic array.

Fig. 3. Seismic data from 2009 collected with uniaxial
accelerometers only. The drop off from linearity in the larger
magnitude range is due to limited low frequency response of
the sensor type. Recorded events above moment magnitude -
0.5 are underestimated in magnitude as a result of sensor type.
Fig. 4. Seismic data from 2010 collected with a blended array
using both 15 Hz geophones and uniaxial accelerometers.
Above moment magnitude -0.5, the recorded geophone signals
contribute significantly towards the calculated moment
magnitude resulting in a more linear relationship to moment
magnitude 1.0.
Fig. 5. Nickel Rim South longitudinal and section views of the mine openings and sensor locations are shown. The green
cylindrical shapes represent accelerometer locations with red indicating geophones. Level names are in meters below surface. The
scale bar is 0 to 800m for reference. Mined out stopes are shown in blue. Typical tunnels are 5x5m in dimension and are indicated
in various colours. A total of 44 sensors consisting of 28 uniaxial accelerometers, 2 uniaxial 15 Hz geophones and 14 triaxial 15
Hz geophones monitor a volume of approximately 350m North/South by 375m East/West by 585m vertical. The average sensor
spacing is 120m.

The system has been incrementally upgraded since 2009,
including the addition of 14 triaxial geophones with
average 3D position spacing of 175m. These sensors
improve the dynamic range of the system in the lower
frequency range, and despite sometimes being in the
“near” field of seismic events, give reasonable
magnitude estimates to approximately moment
magnitude 1.0 (see Figure 4). For magnitudes above 1.0,
the moment magnitude is underestimated slightly. 4.5
Hz geophones placed in the far field are used for large
event magnitude estimates as well as for correlation to
the Sudbury Regional Seismic Network [1].
2.1. Development Blasting as a Source for Seismic
Data Analysis Typical development drives are excavated as a 5.5m
high by 5m wide tunnel in 4m advances. Each blast is
drilled with a two-boom jumbo and loaded with 250-270
kg of ANFO or emulsion string loading.
The seismic system records continuous data which is
then parsed out into triggered seismic event files. A
triggered event is recorded in a preset time window, with
the actual window depending on the local array. To
capture high event rates after blasting and to avoid
multiple events per time window, a short 200
millisecond window per event is used for triggering.
This short time window works well for the small
monitoring volume at Nickel Rim South. The monitoring
volume is approximately 350m North/South by 375m
East/West by 585m vertical. The short source to sensor
distances allows most of the P and S wave energy to
arrive within the 200ms. A consequence of the short
time window is that a typical development blast that
occurs over several seconds gets recorded as a series of
seismic events. Automatic blast flagging is performed
by comparing the time between events (rapid succession
for blasting) and the magnitude (blasts are always above
a minimum threshold). More sophisticated filtering is
possible, but manual intervention eliminates the
occasional incorrectly flagged blast.
The recorded blasts offer a quick location accuracy
check/calibration for the system as seen in Figure 6. The
seismic coverage and subsequent results will vary within
typical seismic arrays based on sensor location and
density. The heart of the Nickel Rim South array
generally has location accuracy within +/-5m of the
seismic source. The first shot of the development round
can be approximated as a point source as the cut is fired
near the centroid of the round. The known location of
the blast compared to the system location provides an
accurate +/-1m check on the absolute location error of
the system. In other portions of the array, seismic
coverage is not as good and location errors can be larger.
Figure 7 shows the upper eastern mining which has
predominantly hangingwall sensors and sensors below.
Location accuracy can be offset as much as 10 to 15m
due to raypaths bending around mining, longer sensor to
source distances, and a less ideal 3D array.
Another way development blasting can be used as a
source of information about the rockmass is to compare
recorded source parameter information from the blasts.
In theory, each P and S-wave pair represents a
development hole being fired. The development blast
provides a relatively consistent seismic source.
Fig. 6. Nickel Rim South seismicity and development blast “events” around a crosscut access recorded from February to May
2012. In area “A” the plan view tracking of the blasts with the crosscut survey is very good, while the vertical coordinate is offset
about 5m. Area “B” has better vertical location control as it is ideally located between the footwall and hangingwall sensors of the
seismic array. The yellow/red symbols represent blast events, the green spheres are recorded seismic events.

Fig. 7. Nickel Rim South Mine. Two crosscuts (“A” and “B”) in the upper eastern portion of the mine are indicated. The
yellow/red stars should track the mine survey if the event location accuracy is 100%. The “smearing” at the end of crosscut “A” is
a reflection of slower actual travel time as the raypath travels around the mined out area or through more heavily fractured ground
or backfill. A constant velocity model is currently used in the location algorithm and the result is an offset in event location.
Some wave amplification occurs as multiple shots are
going off within the blast, and there may be some
variation in the recordings due to the state of the
rockmass in which the shots are fired, but overall the
seismic source is the “same” for each shot. It is believed
that significant changes in the source parameter
characteristics of development blasts can be attributable
to the medium or raypath attenuation effects.
The primary/secondary mining method deliberately
creates pillars (secondary stopes) between the primary
mining stopes. These pillars yield as they are formed
and the seismic records can be used to demonstrate this
[2]. A noted feature is the lack of seismic activity when
the stope access is driven into a pillar that is in a post
yielded state. Development blasts are still routinely
recorded and a characteristic high frequency stripping is
obvious from the recorded waveforms. Locations of
development blast events recorded with high frequency
stripping tend to be more poorly located than events
generated from development blast events that contain
higher frequencies.
In the ESG system visualization package SeisVis, the
best way to visualize the corner frequency deduced from
spectral analysis of recorded seismic events is to use the
calculated seismic source radius. The corner frequency
in the theoretical far-field displacement spectra is
inversely related to the source radius of a circular fault
plane by the following equation:
R = vs Kp/s / 2π fcp/s (1)
vs is the shear-wave velocity in km/s, fcp/s is the corner
frequency of the P or S waves, respectively, in Hz. Kp
and Ks are model related constants. In the ESG system
these values are 2.01 and 1.32 after the Madariaga [3]
model. It is understood that the circular fault plane
model used to estimate the source radius in no way
represents the actual mechanism generated from a
development blast. The actual values are not truly
relevant for the purpose of this analysis. The calculated

source radius is used simply as a means to represent
differences in frequency content of seismic recordings. It
is the relative differences in calculated source radius
values that are important for this analysis.
Figure 8 shows development blasts (shots) recorded at
Nickel Rim South over a 15 month period (December
25, 2012 to March 27, 2013). Figure 9 shows a plan
view of the development blasts recorded in this period in
the stope secondary access area circled in red in Figure
8. Calculated source radius values are scaled in colour
from dark green (low) to red (high) and range between
approximately 2.5m to 36m during this period.
The seismic source itself (blasting) does not vary
considerably between rounds. Each event plotted in
Figure 9 represents an individual shot within a
development blast. Figure 10 shows the variation of
source radius of development blast recordings over time
as the development heading advanced. The variation in
source radius for each specific blast can be seen by the
vertical spread of each specific blast date (calculated
source radius range of approximately 2.5m to 36m). The
red and green lines represent when the core of the pillar
was entered and exited respectively, indicating the time
period when the seismic raypaths would be expected to
be travelling through more heavily fractured ground. A
clear increasing trend in calculated source radius due to
decreasing corner frequencies of the blasting records is
indicated as the seismic waves generated from the blasts
travel through the fractured core of the pillar.
Although each development blast is assumed to be
identical, it is possible that shots taken in a more heavily
fractured rockmass could result in lower frequency
recordings. Energy could be absorbed within pre-
existing fractures and with movement along these
fractures during the blasting process. This could
contribute somewhat to the higher calculated source
radius for development blasts, but each individual blast
shot affects a relatively small portion of the rockmass
compared to the distance of waveform travel from
source to sensor. Also, the blasts located within the
fractured ground tend to have a distinct location offset
that would not be observed if blasting in more heavily
fractured ground was the only contribution to the
observed differences from blasts recorded in more solid
ground. The geometry of the blast location offsets in
secondary developments observed in several areas of the
mine indicates that the system velocity used for location
is higher than the actual velocity of the medium through
which the waves are travelling. The observed location
offset coupled with the difference in the recorded source
parameter information is interpreted as resulting mostly
from raypath effects with the fractured rock in the pillar
and surrounding backfill from the primary stopes
attenuating higher frequencies from the seismic waves,
rather than from variation of the blasting process or the
immediate rockmass condition around each shot.
All aspects of the observed differences in the recorded
waveforms indicate that development ends for secondary
stope mining are being driven in more heavily
fractured/failed ground that does not generate much
induced seismicity. This is one of the main goals of the
planned mining method and sequencing as it
significantly reduces risk to underground workers,
machinery, and mine production output.
Fig. 8. Nickel Rim South development blasts recorded mine-wide between December 25, 2012 and March 27, 2013. The time
frame of plotted seismic events and blast records coincides with the time of driving a secondary stope access through a yielded
pillar in the red circled area. The layout of a typical arched back development drill pattern is shown in the upper right corner. The
total development round consists of 250-270 kg of ANFO or emulsion string loading. Blast recordings in the ESG system are
saved for each shot in the total development round.

Fig. 9. Nickel Rim South development blasts recorded in a stope secondary access at 1595m below surface. The lower calculated
source radius events (green) occur in the footwall and far hangingwall. The larger source radius events (red) locate in the core of
the pillar. The loss of high frequency content for waveforms moving through the pillar core is interpreted as indicating that the
pillar core was heavily fractured during primary stope mining and the secondary access is being driven through fractured ground.
Fig. 10. Nickel Rim South. The calculated source radius for the secondary pillar development blasts is plotted against time from
December 22 to Mar 22, 2013. The vertical red line represents when the pillar core was entered by the stope access. Prior to
entering the destressed pillar, no high frequency stripping of the waveforms occurs and a low seismic source radius (high corner
frequency) from the development blasts is calculated. Within the pillar core, seismic waves generated from the blast are travelling
through heavily fractured ground and backfilled areas resulting in attenuation of high frequency signals. The vertical green line on
the right represents when the development end went beyond the core of the pillar area. Calculated source radius values return to
values comparable to those recorded from blast events from before entering the pillar core, indicating that raypaths are once again
travelling through more solid ground.
Entering pillar core Exiting pillar core
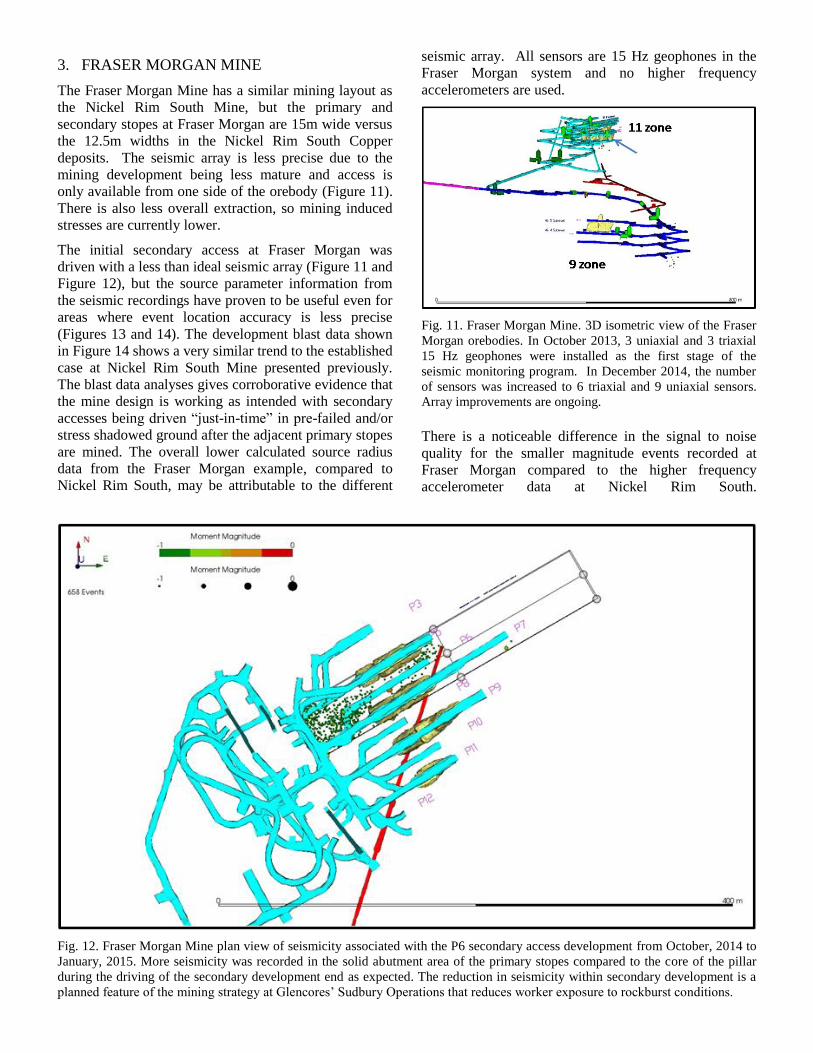
3. FRASER MORGAN MINE
The Fraser Morgan Mine has a similar mining layout as
the Nickel Rim South Mine, but the primary and
secondary stopes at Fraser Morgan are 15m wide versus
the 12.5m widths in the Nickel Rim South Copper
deposits. The seismic array is less precise due to the
mining development being less mature and access is
only available from one side of the orebody (Figure 11).
There is also less overall extraction, so mining induced
stresses are currently lower.
The initial secondary access at Fraser Morgan was
driven with a less than ideal seismic array (Figure 11 and
Figure 12), but the source parameter information from
the seismic recordings have proven to be useful even for
areas where event location accuracy is less precise
(Figures 13 and 14). The development blast data shown
in Figure 14 shows a very similar trend to the established
case at Nickel Rim South Mine presented previously.
The blast data analyses gives corroborative evidence that
the mine design is working as intended with secondary
accesses being driven “just-in-time” in pre-failed and/or
stress shadowed ground after the adjacent primary stopes
are mined. The overall lower calculated source radius
data from the Fraser Morgan example, compared to
Nickel Rim South, may be attributable to the different
seismic array. All sensors are 15 Hz geophones in the
Fraser Morgan system and no higher frequency
accelerometers are used.
Fig. 11. Fraser Morgan Mine. 3D isometric view of the Fraser
Morgan orebodies. In October 2013, 3 uniaxial and 3 triaxial
15 Hz geophones were installed as the first stage of the
seismic monitoring program. In December 2014, the number
of sensors was increased to 6 triaxial and 9 uniaxial sensors.
Array improvements are ongoing.
There is a noticeable difference in the signal to noise
quality for the smaller magnitude events recorded at
Fraser Morgan compared to the higher frequency
accelerometer data at Nickel Rim South.
Fig. 12. Fraser Morgan Mine plan view of seismicity associated with the P6 secondary access development from October, 2014 to
January, 2015. More seismicity was recorded in the solid abutment area of the primary stopes compared to the core of the pillar
during the driving of the secondary development end as expected. The reduction in seismicity within secondary development is a
planned feature of the mining strategy at Glencores’ Sudbury Operations that reduces worker exposure to rockburst conditions.

Fig. 13. Fraser Morgan Mine plan view of development blasts recorded in the pillar during the same time frame indicated in Figure
12. Calculated source radius details of each blast are presented in Figure 14 showing higher calculated source radius (lower corner
frequency) in the core (red circles) indicating that seismic waves are travelling through a more fractured rock mass.
Fig. 14. Fraser Morgan Mine. Calculated source radius of the developments blasts from October 2014 to January 2015 showing a
similar trend to that indicated in Figure 10 at Nickel Rim South. A relatively clear delineation of changing rockmass conditions is
evident when examining the source radius/corner frequency of development blasts as development proceeds into a rockmass that
has been exposed to nearby mining and is expected to be in a destressed condition.
Entering pillar core Exiting pillar core

The lack of accelerometer data at Fraser Morgan is most
likely responsible for the lower overall calculated source
radius values compared to Nickel Rim South. However,
the trend of increasing calculated source radius in the
core of the pillar is the same. Again, the actual seismic
source, development blasts, is assumed to be relatively
constant with the variation in source parameters being
attributable to changes in the rockmass.
4. FRASER COPPER MINE
The Fraser Copper zone has been mined since the early
1980’s, predominantly with narrow vein cut and fill
methods. A common issue with this type of mining
occurs when two mining fronts converge to form highly
stressed sill pillars. In some cases the mining direction
is switched from overhand (mining upward with solid
rock above head) to underhand (mining below reinforced
backfill). This change reduces risk by keeping high
stresses below the operating level and the gravity
component of potential rock falls is reduced. However,
floor heave rockbursting is a risk and face bursting from
high stresses ahead of the advancing cut is also a
concern.
Figures 15 and 16 show quarterly seismic plots of an
underhand mining sequence in the 580 area of Fraser
Copper located at a depth of approximately 4600 ft.
(1,400 m) below surface. Extensive mining above and
below the working area existed forming a highly stressed
sill pillar. Mining was stopped due to face bursting
issues after two small bursts occurred with each resulting
in less than 5 tonnes of rock ejected. Several mitigation
methods were in place at the time, including attempts at
jumbo destressing and face screening. There were two
3x3m cuts remaining and to further improve safety while
extracting this ground, it was decided to trial a long
multi-hole destress blast to “push” the high stress further
ahead of the man entry area. The observed seismicity
was predominantly in front of, and close to, the mining
face, with seismicity also observed in the footwall ahead
of the face. The seismicity, coupled with underground
observation, indicated that the ground for the underlying
last cut was becoming fractured. This is the norm for sill
pillar mining observed at Fraser Copper. Numerical
modelling also predicted yielding of the second cut in
these mining conditions.
It was felt that the failed second cut ground on the floor
of the area provided a safe area to create a drill cut-out
for the longhole pattern. The details of the jumbo
destress blast are shown in Figure 17 along with the
immediate 24 hour seismic response of the rockmass.
Seismic monitoring in this portion of the mine consisted
of uniaxial accelerometers (limited dynamic range up to
about -0.5 moment magnitude) in a relatively well
covered part of the array. Source location accuracies
were in the 5 to 10m range. A characteristic of yielded
ground in deep mining is the change of seismicity for a
specific volume of rock over time. Areas that were once
seismically active and become “quiet” are typically
yielded or stress shadowed. Higher event rates typically
relate to higher potential bursting risk. Energy Index
(EI) [5] is a relative measure of energy release for a
given amount of co-seismic deformation and is
calculated from the seismic waveform information.
Areas showing higher energy index values generally
indicate relative high stress areas or periods.
A brief description of the destress blast example is
provided by Collins et al., [4]. A more detailed version is
presented in this paper. In the destress blast analysis, the
time period corresponding to the highest face bursting
risk had the highest average event rate and the highest
overall EI (Figure 18). The use of the EI concept to
gauge the effectiveness of the destress blast requires
high spatial resolution of the seismic system. In
hindsight, it is postulated that the blast effectively
destressed approximately 10m of the rockmass along the
strike length of the vein and two cuts (6m) vertically.
The term “destress” refers to a local volume, as the stress
is actually redistributed forward into the adjacent solid
rock. If too large a volume of rock is selected for the EI
analysis, or if the location accuracy is too dispersed, the
dataset could contain events unrelated to the destress
blast. In this case, the destress area was quite isolated
from other mining and it is assumed that all events used
in the analysis are related to the destress blast and
subsequent rock mass response. Figure 19 shows the EI
history of seismic events recorded within the volume
thought to be impacted by the longhole blast.
The average EI did show the expected drop in value after
post longhole destress blast mining resumed. However,
it was not clear immediately after the blast how far
ahead the newly stressed region was located. Of concern
was at what point mining would reenter a stressed
rockmass. After four advances of 2.5m each, the last
blast triggered three larger magnitude events ahead of
the face of moment magnitude 0.8, 0.8, and 0.9. The
overall event rate increased once again, with the events
showing an increase in average EI as shown in Figure
20. Underground observations showed that the face area
had a visible “dished” shape, indicative of face spalling
and high stress. For safety reasons, mining was halted
and the entire first cut was filled to allow underhand
mining of the final cut which was believed to be in a
yielded state. Figure 21 shows the recorded seismicity
after mining approximately 80m of the last cut (Nov.
2014 to Feb. 2015). Virtually no seismic activity other
than recorded blasts occurred in the plane of the vein,
indicating low seismic risk. This seems to confirm the
earlier conclusion from the seismic data that the
rockmass in the second cut had indeed been destressed
by the mining of the highly stressed first cut above.

Fig. 15. Fraser Copper Mine long section view from the footwall side of the 6m vertical sill pillar. Quarterly seismic plots of the
underhand mining area are shown (Q2 and Q3, 2012). The copper vein was believed to be too flat for conventional blasthole
mining. The mining sequence for the first (top) underhand cut is from left to right. Most recorded seismicity locates in the “solid”
second cut (below) indicating that this solid ground is fracturing. Second cut yielding is indicated by numerical modelling.
Fig. 16. Fraser Copper Mine 580 first cut mining. Quarterly plots of seismicity for Q4, 2012 and Q1, 2013. The circled area clearly
highlights a non-seismic zone that was previously active as indicated in Figure 15. Areas that previously recorded relatively high
micro-seismic activity and become “quiet” over time are characteristic of a failed rockmass. Mining sequence is from left to right.

Fig. 17. Fraser Copper Mine 580 destress blast area. Image depicts the same area as Figures 15 and 16 viewed from the
hangingwall side. The longhole destress blast pattern and short term 24-hour seismic response of the blast is shown.
Fig. 18. Average Energy Index (red) and Cumulative Number of Events (blue) are plotted vs. Time for the volume of rock around
the 580 destress blast. EI values above 1.0 indicate higher stress than the average for the volume of concern. The Energy-Moment
relation for events deemed to be associated with the 580 first cut mining is shown in the bottom right. The high event rate period
(dashed red box) corresponded with observed daily rock noise, ground working, and eventually a small face burst at the time of
highest overall EI. The flat time periods on the cumulative events plot correspond to mining inactivity. After the April 8 destress
blast, the event rate remained low for the next 3 blasts (2.5m advances), increasing after the fourth blast. This is one indication that
mining had reached the “end” of the effective destress curtain. Underground observation confirmed that a decision had to be made
whether to continue mining in the higher stressed ground, perform another destress blast or stop mining the first cut.

Fig. 19. EI and cumulative number of events just before and after the April 8, 2014 destress blast showing a clear drop in average
EI after the blast. Along with underground observations, this analysis provides corroborating evidence that the destress blast was
effective in “shedding” stress away from the working face.
Fig. 20. EI and the cumulative number of events plotted before and after the destress blast showing an increase to pre-destress blast
EI levels. This indicates that the mining had advanced to the end of the effective destressed area and face bursting would be at an
elevated risk level once again. Mining of the first cut was stopped at this stage and plans were developed to mine the “yielded”
underlying second cut.

Fig. 21. Mining of the last “yielded” cut from November 2014 to February 2015 had proceeded to approximately 10m from the
edge of the longhole destress blast region at the time of writing. Minimal seismicity was recorded in the plane of the vein, with
only some sporadic activity in the footwall. The last cut is indicated with mining above hidden from view for clarity.
5. CONCLUSIONS AND DISCUSSION
Waveforms generated from development blasts that are
recorded by seismic monitoring systems can provide a
rapid assessment/calibration of seismic monitoring array
location accuracy. The blast locations should closely
track the mine survey if seismic velocities used by the
system are accurate. Areas that have significant location
offsets (e.g. Figure 7 area “A”) may be due to poor array
configuration or convoluted raypath effects. The
constant velocity model used for source location
algorithms works well for dense seismic arrays where
the source to sensor distances are small. However, as
mining progresses, the raypaths are progressively
impacted by mined out areas. Mining may result in voids
that may or may not be backfilled. Waveforms may
travel through heavily fractured rock whose rockmass
properties (reflected as seismic velocities) may differ
considerably from their original condition. Seismic
source location accuracy will deteriorate with time
unless additional seismic sensors are continually added.
CAMIRO Mining Division is coordinating industry
funded research with ESG Solutions to create improved
3D velocity models which can be incorporated into real
time seismic processing algorithms. An early example of
how seismic source locations can be improved with the
use of 3D velocity models is presented by Collins et. al.,
[6] for the New Afton block caving mine in British
Columbia, Canada. The CAMIRO project plans to
further develop these methods to improve seismic event
source location accuracy for mines utilizing their
systems.
Seismic records of development blasts can be used to
infer existing rockmass conditions. High frequency
stripping of the recorded signal occurs as the raypaths
traverse fractured ground and/or backfilled areas.
Seismic source parameters such as calculated seismic
source radius, which is inversely related to the corner
frequency of the seismic events, can be used to show this
effect. The development blasts have very similar source
characteristics, using the same blasthole patterns with
the same amount of explosives. Large variations in the
nature of the recorded seismic waveforms are believed to
be related to differences in the rockmass or raypath
rather than the any differences in seismic source itself.
However, this is an area where further study is required.
In the Fraser Morgan example, location accuracy was
less than ideal when the seismic array was still in the
early stages. However, the development blasts have
known locations (mine survey data) and the trends of
calculated seismic source radius versus time can be used
to infer yielded rockmass conditions (secondary stope
development) despite the spatial variance of the recorded
seismic data. This provides evidence that planned
mining strategies are performing as envisioned and
exposure to high stress rockbursting conditions are being
managed and minimized for underground workers.
The Nickel Rim South mine array clearly benefits from
having both hangingwall and footwall development,
offering improved 3D seismic sensor coverage. The
mine also had the benefit of very early seismic
monitoring coverage. ESG developments for seismic
monitoring in the oil and gas sector include the
deployment of long strings of sensors in relatively deep
holes. The use of this technology for mining provides an
opportunity to improve 3D coverage of arrays without
having to add, or wait for, expensive mine development
for seismic sensor deployment. The first stage in using
this technology at Glencore has been implemented
successfully at the Nickel Rim South mine. Longhole
sensors have been installed in sub-horizontal geological

“scout” holes at over 400m distance to monitor a ramp
drive as it passes through a known geological fault.
Glencore Sudbury Operations plan to utilize longhole
sensor installations, including multi-sensor strings for
new mining areas, to get early seismic coverage and
improved long term 3D seismic coverage for high spatial
resolution of seismicity associated with ramp
development and early ore body development tunnels.
High spatial resolution seismic data can clearly
contribute to an improved understanding of the rockmass
response to mining. In the Fraser Copper destress blast
case study, inferences of rockmass conditions in the
order of a few tens of meters was important to manage
risk in a narrow vein remnant extraction. The Energy
Index concept showed the inferred stress state clearly;
high EI before the blast, lower EI after the blast, and
higher EI again after mining proceeded to the edge of the
destressed zone. The seismic data recorded by the ESG
system also indicated that the underlying second cut was
being destressed due to mining of the first cut. This
evidence from the seismic data coincides with numerical
modelling results that indicated that the second cut
would indeed yield with mining of the overlying first
cut. This is an important factor for ground control
engineers as it provides some comfort that the models
being used for mine design seem to be realistic as borne
out by actual rockmass measurements recorded during
the mining process.
The use of the types of seismic analyses shown in this
paper will only improve our understanding of our rock
mass and contribute to improved safe mining and ground
control strategies for Glencore. The experience gained
during the Fraser Copper 580 destress project will
benefit future mining in similar situations and will help
ensure the safety of workers. These methods will also
reduce the likelihood of loss of equipment or loss of ore
reserves that can occur due to rockbursts when mining
sill pillars.
REFERENCES
1. Hudyma, M.R. and D.L. Beneteau, (2010), The
Sudbury Regional Seismic Network. CIM Maintenance
Engineering and Mine Operations Conference,
Sudbury, Ontario.
2. Simser B. and A. Jalbout. 2014. Rock mechanics tools
for mining in high stress ground conditions at Nickel
Rim South Mine. In Proceedings of the Seventh
International Conference on Deep and High Stress
Mining, Sudbury, 16 – 18 September 2014, eds. M.
Hudyma and Y. Potvin, 189–208. Australian Centre for
Geomechanics.
3. Madariaga, R. 1976. Dynamics of an Expanding
Circular Fault. In Bull. Seism. Soc. Am., 66, 639-666.
4. Collins D.S., V. Shumila, T. Butler, Z. Hosseini, and
C.I. Trifu. 2015. Microseismic Real Time and
Advanced Analysis in Mines. In Proceedings of the
13th International ISRM Congress: Canadian Institute
of Mining, Metallurgy and Petroleum, Montreal, PQ. 8
p.
5. Van Aswegen G. and A.G. Butler. 1993. Applications
of quantitative seismology in South African gold mines.
In Proceedings of the 3rd
International Symposium on
Rockburts and Seismicity in Mines, Kingston, 16 - 18
August 1993, ed. R.P. Young, R.P., 261-266.
Rotterdam, Balkema.
6. Collins, D.S., I. Pinnock, V. Shumila, C.-I. Trifu, C.
Kamp, A. Davies, and A. Chan. 2013. Optimizing
microseismic source event location by applying a
variable velocity model to a complex geological and
mining setting at the New Gold New Afton Block
Cave. In Proceedings of the 23rd World Mining
Congress on Advances in Mining Engineering,
Montreal, 11-15 August 2013, PDF Paper 674.