use of morpho-agronomic traits and dna profiling for … · profiling for classification of genetic...
TRANSCRIPT

©FUNPEC-RP www.funpecrp.com.brGenetics and Molecular Research 12 (4): 6646-6663 (2013)
Use of morpho-agronomic traits and DNA profiling for classification of genetic diversity in papaya
O.N. de Jesus, J.P.X. de Freitas, J.L.L. Dantas and E.J. de Oliveira
Embrapa Mandioca e Fruticultura, Cruz das Almas, BA, Brasil
Corresponding author: E.J. de OliveiraE-mail: [email protected]
Genet. Mol. Res. 12 (4): 6646-6663 (2013)Received July 18, 2012Accepted November 30, 2012Published March 11, 2013DOI http://dx.doi.org/10.4238/2013.July.11.8
ABSTRACT. We examined the genetic diversity of papaya (Carica papaya) based on morpho-agronomic and molecular data. Twenty-seven genotypes grown in Brazil were analyzed with 11 AFLP primer combinations, 23 ISSR markers, 22 qualitative, and 30 quantitative descriptors. For the joint analyses, we used the Gower algorithm (Joint Gower) and the average value of the individual dissimilarity matrix for each type of data (Average-Joint Gower); 359 AFLP and 52 ISSR polymorphic bands were found. Approximately 29.2 and 7.7% of the AFLP and ISSR bands, respectively, were genotype-specific and may therefore be used for papaya variety protection. Although there was a significant correlation between the qualitative and quantitative descriptor dissimilarity matrices (r = 0.43), the morpho-agronomic data were not highly correlated with the molecular data. Moreover, correlation between AFLP and ISSR dissimilarity matrices was nearly null (r = -0.01). Joint Gower analysis of all data showed high correlations, especially for AFLP markers, most likely due to the larger number of bands, generating

©FUNPEC-RP www.funpecrp.com.brGenetics and Molecular Research 12 (4): 6646-6663 (2013)
Germplasm characterization of papaya 6647
a strong bias in the diversity estimates. The Average-Joint Gower analysis allowed a better balance between the correlations for the continuous and the discrete variables. The results generated by clustering analysis distinguished 5 genetically distinct groups. While we found that papaya genotypes are significantly variable for many traits, we observed that Average-Joint Gower analysis allowed for genotype clustering based on the most widely used criterion for classifying papaya genotypes, which is fruit type (‘Formosa’ or ‘Solo’). This information helps provide an accurate estimate of the genetic diversity and structure of papaya germplasm, which will be used for further breeding strategies.
Key words: Genetic variability; Carica papaya L.; Gower algorithm; Genetic resources; Breeding
INTRODUCTION
Papaya (Carica papaya L.) is a polygamous dicot tree that is cultivated in large areas of the tropics and subtropics (Santos et al., 2009; Devitt et al., 2010). Crop production occurs throughout practically the entire year, generates employment and contributes to placing people out in the field. In 2010, Brazil had 34,700 ha under cultivation, ranking second in world production, with approximately 1.87 million tons produced. Currently, India is the largest pro-ducer, with 3.9 million tons but with average yields of 38.12 t/ha compared with Brazil (53.90 t/ha) (Instituto Brasileiro de Geografia e Estatística, 2011).
Despite its preeminent position, Brazil’s production is hampered by the limited number of varieties available and by the low genetic variability in commercial planta-tions (Oliveira et al., 2010a). However, the germplasm of papaya has considerable genetic variability for several important agronomic traits, such as fruit size and shape, skin color, flavor and sweetness, duration of juvenile period, and plant height (Kim et al., 2002; Dias et al., 2011). Exploitation of this genetic variability may strengthen the genetic basis of this crop through the development of new lines and hybrids, given that the reproductive system of papaya enables crosses and that the absence of inbreeding depression makes it possible to obtain lines with high vigor (Oliveira et al., 2010a). Knowledge of genetic variability is very useful for identifying the best combinations between genotypes with the potential to maximize the genetic gains made by hybridization (Máric et al., 2004; Bertan et al., 2009).
Genetic variability can be assessed using both morpho-agronomic descriptors (dis-crete and continuous variables) and molecular data. Morpho-agronomic descriptors are useful tools for a preliminary assessment because they allow rapid insight into the range of diversity available (Raghu et al., 2007). Furthermore, discrete variables, represented by qualitative descriptors, have a simple genetic nature and allow reliable inferences about germplasm accessions, but their number is limited, and requires a scale previously es-tablished. In contrast, quantitative or continuous variables are important descriptors, es-pecially when used to evaluate the agronomic potential of a new cultivar or germplasm accession. However, quantitative variables show a complex genetic nature and suffer from

©FUNPEC-RP www.funpecrp.com.brGenetics and Molecular Research 12 (4): 6646-6663 (2013)
O.N. de Jesus et al. 6648
many environmental influences. Therefore, when used alone, they show some restrictions for diversity studies. In contrast, DNA molecular markers can reveal differences between genotypes more efficiently because the markers characterize the genome of the organism directly, where they are not influenced by the environment (Lefebvre et al., 2001; Kim et al., 2002). However, as disadvantages DNA markers access the entire genome instead of only the regions responsible for the manifestation of the traits of interest (Franco et al., 2006).
Due to their many advantages, especially high polymorphism, reproducibility and wide genomic coverage in many species, amplified fragment length polymorphism (AFLP) markers have been used to characterize molecular diversity and to establish fingerprinting in various species (Kim et al., 2002, Rodríguez et al., 2010). Inter-simple sequence repeat (ISSR) markers constitute another PCR-based technique useful for genome studies. Their polymorphisms are generated by inducing variations in the numerous microsatellite regions using primers that may be anchored with one or two nucleotides on either the 5'- or 3'-end of a repeat region and extend into the flanking region. This method is widely applicable because it is rapid and inexpensive, does not require prior knowledge of the DNA sequence, and allows rapid genotyping on agarose gels (Santos et al., 2011).
The study of both phenotypic and genetic diversity is important in conservation ef-forts, in the evaluation and utilization of genetic resources, in the study of germplasm diversi-ty, in pre-breeding programs, and in the determination of phenotypic distinctions of genotypes (Franco et al., 2001). The quantification of genetic diversity for various descriptors has been performed separately (Crossa and Franco, 2004). However, the use of the Gower algorithm (Gower, 1971) has allowed the construction of a single distance matrix with information con-cerning both discrete traits (qualitative and molecular) and continuous (quantitative) traits. The combination of these variables is an interesting alternative for breeders and germplasm bank curators, because it may quantify the entire genetic variability of a species and enable a better understanding of germplasm accessions (Gonçalves et al., 2009). Alternatively, Cruz et al. (2011) reported other methodologies based on the averages of the individual matrices. The objective of this study was to evaluate the discriminatory capacity and genetic diversity of pa-paya genotypes using both morpho-agronomic descriptors and molecular data and to analyze the joint behavior of these descriptors to support the goals of germplasm conservation and use as well as strategies for papaya breeding.
MATERIAL AND METHODS
The study was undertaken at Embrapa Mandioca e Fruticultura, located in the city of Cruz das Almas, BA (12°48ꞌ38ꞌꞌS and 39°06ꞌ26ꞌꞌW, altitude of 220 m), in July 2009. The weather conditions were as follows: average annual temperature of 24.5°C, average annual rainfall of 1240 mm, and average relative humidity of 82%. Twenty-seven genotypes were evaluated (7 inbred lines, 4 landraces, 6 improved varieties, 5 cultivars, and 5 obsolete germ-plasms) (Table 1). The experiment was performed using 24 uncommon and 3 common treat-ments, with augmented design distributed into 8 blocks, with plots of 8 plants each. Planting was carried out with a spacing of 2.0 x 2.0 m and followed all the recommended practices (Martins and Costa, 2003). As only hermaphrodite plants were evaluated, female plants were removed when they were four months old.
©FUNPEC-RP www.funpecrp.com.brGenetics and Molecular Research 12 (4): 6646-6663 (2013)
Germplasm characterization of papaya 6649
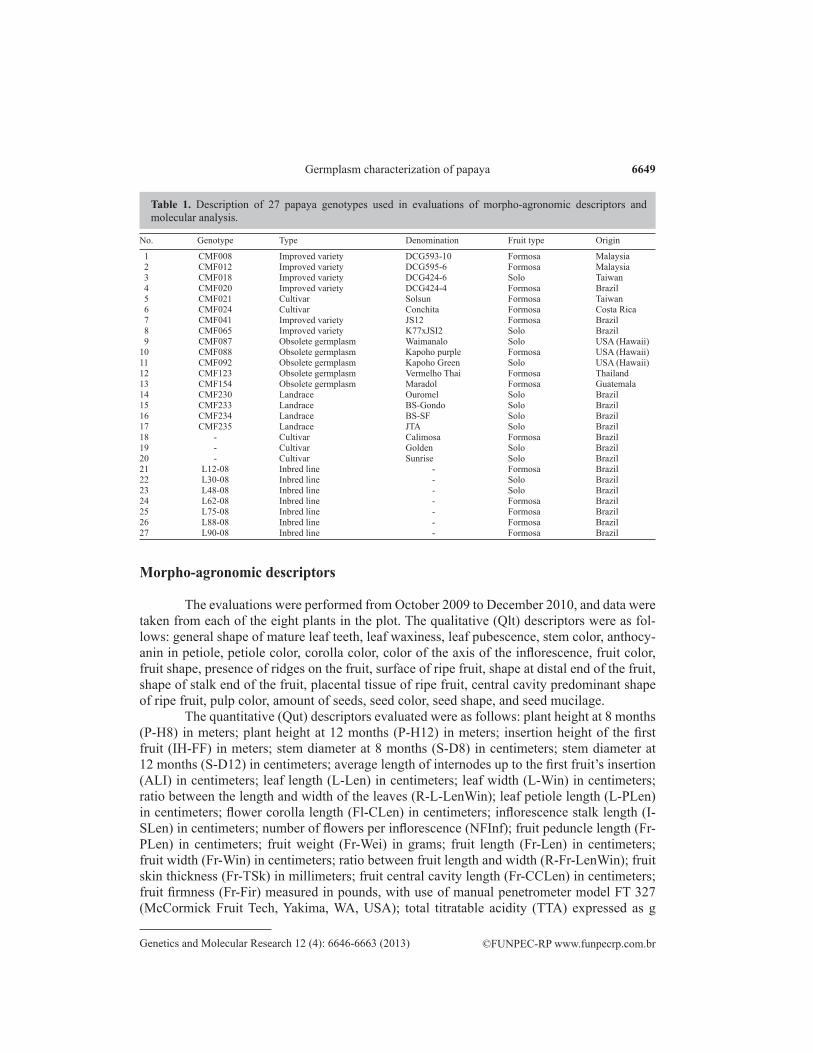
No. Genotype Type Denomination Fruit type Origin
1 CMF008 Improved variety DCG593-10 Formosa Malaysia 2 CMF012 Improved variety DCG595-6 Formosa Malaysia 3 CMF018 Improved variety DCG424-6 Solo Taiwan 4 CMF020 Improved variety DCG424-4 Formosa Brazil 5 CMF021 Cultivar Solsun Formosa Taiwan 6 CMF024 Cultivar Conchita Formosa Costa Rica 7 CMF041 Improved variety JS12 Formosa Brazil 8 CMF065 Improved variety K77xJSI2 Solo Brazil 9 CMF087 Obsolete germplasm Waimanalo Solo USA (Hawaii)10 CMF088 Obsolete germplasm Kapoho purple Formosa USA (Hawaii)11 CMF092 Obsolete germplasm Kapoho Green Solo USA (Hawaii)12 CMF123 Obsolete germplasm Vermelho Thai Formosa Thailand13 CMF154 Obsolete germplasm Maradol Formosa Guatemala14 CMF230 Landrace Ouromel Solo Brazil 15 CMF233 Landrace BS-Gondo Solo Brazil 16 CMF234 Landrace BS-SF Solo Brazil 17 CMF235 Landrace JTA Solo Brazil 18 - Cultivar Calimosa Formosa Brazil 19 - Cultivar Golden Solo Brazil 20 - Cultivar Sunrise Solo Brazil 21 L12-08 Inbred line - Formosa Brazil 22 L30-08 Inbred line - Solo Brazil 23 L48-08 Inbred line - Solo Brazil 24 L62-08 Inbred line - Formosa Brazil 25 L75-08 Inbred line - Formosa Brazil 26 L88-08 Inbred line - Formosa Brazil 27 L90-08 Inbred line - Formosa Brazil
Table 1. Description of 27 papaya genotypes used in evaluations of morpho-agronomic descriptors and molecular analysis.
Morpho-agronomic descriptors
The evaluations were performed from October 2009 to December 2010, and data were taken from each of the eight plants in the plot. The qualitative (Qlt) descriptors were as fol-lows: general shape of mature leaf teeth, leaf waxiness, leaf pubescence, stem color, anthocy-anin in petiole, petiole color, corolla color, color of the axis of the inflorescence, fruit color, fruit shape, presence of ridges on the fruit, surface of ripe fruit, shape at distal end of the fruit, shape of stalk end of the fruit, placental tissue of ripe fruit, central cavity predominant shape of ripe fruit, pulp color, amount of seeds, seed color, seed shape, and seed mucilage.
The quantitative (Qut) descriptors evaluated were as follows: plant height at 8 months (P-H8) in meters; plant height at 12 months (P-H12) in meters; insertion height of the first fruit (IH-FF) in meters; stem diameter at 8 months (S-D8) in centimeters; stem diameter at 12 months (S-D12) in centimeters; average length of internodes up to the first fruit’s insertion (ALI) in centimeters; leaf length (L-Len) in centimeters; leaf width (L-Win) in centimeters; ratio between the length and width of the leaves (R-L-LenWin); leaf petiole length (L-PLen) in centimeters; flower corolla length (Fl-CLen) in centimeters; inflorescence stalk length (I-SLen) in centimeters; number of flowers per inflorescence (NFInf); fruit peduncle length (Fr-PLen) in centimeters; fruit weight (Fr-Wei) in grams; fruit length (Fr-Len) in centimeters; fruit width (Fr-Win) in centimeters; ratio between fruit length and width (R-Fr-LenWin); fruit skin thickness (Fr-TSk) in millimeters; fruit central cavity length (Fr-CCLen) in centimeters; fruit firmness (Fr-Fir) measured in pounds, with use of manual penetrometer model FT 327 (McCormick Fruit Tech, Yakima, WA, USA); total titratable acidity (TTA) expressed as g

©FUNPEC-RP www.funpecrp.com.brGenetics and Molecular Research 12 (4): 6646-6663 (2013)
O.N. de Jesus et al. 6650
citric acid per 100 g juice; total soluble solids (TSS) measured in °Brix; ratio between total titratable acidity and soluble solids content (R-TTATSS); fruit pH (Fr-pH); seed fresh weight (Se-FWei) in grams; seed dry weight (Se-DWei) in grams; seed length (Se-Len) in centime-ters; seed width (Se-Win) in centimeters; and ratio between the length and width of the seed (R-Se-LenWin). All descriptors were evaluated according to standards of the International Plant Genetic Resources Institute (1998).
The genotypic values of accessions for the quantitative traits evaluated were predicted by best linear unbiased prediction and used to calculate the genetic distance. The Selegen soft-ware (Resende, 2007) was used for the statistical analyses.
AFLP and ISSR markers
Young papaya leaves were harvested and stored at -80°C for long-term storage. Ge-nomic DNA was extracted using the procedure described by Doyle and Doyle (1990). DNA quantification was carried out on an agarose gel (1.0% w/v) by comparing the fluorescent intensity of the sample stained with ethidium bromide (1.0 mg/mL) with a dilution series of lambda DNA (Invitrogen, Carlsbad, CA, USA) as the standard of known concentration.
AFLP genotyping was performed using the protocol described by Vos et al. (1995), with some modifications. Briefly, 350 ng genomic DNA was digested using a combination of a rare (EcoRI) and a frequent (MseI) cutting enzyme (New England Biolabs, Beverly, MA, USA) at 37°C for 16 h. The enzymes were then inactivated at 70°C for 15 min. Following di-gestion, double-stranded adaptors were ligated to the ends of the DNA fragments and diluted 1:5, generating template DNA for subsequent PCR amplification (pre-amplification followed by a selective amplification step). Afterwards, DNA was pre-amplified using the following com bination as the selective basis: E-A + M-C, where E = EcoRI adapter, M = MseI adapter, and A = adenine, C = cytosine. The pre-amplified DNA was diluted 1:50 and amplified using primers with three selective bases for both rare (E-ACT, E-AAC) and frequent cutting en-zymes (M-CAA, M-CAC, M-CAT, M-CTA, M-CTC, M-CTG, and M-CTT), where T = thy-mine and G = guanine. Eleven AFLP primer combina tions were evaluated (E-ACT+M-CAA, E-ACT+M-CAC, E-ACT+M-CAT, E-ACT+M-CTA, E-ACT+M-CTC, E-ACT+M-CTG, E-ACT+M-CTT, E-AAC+M-CAA, E-AAC+M-CAC, E-AAC+M-CAG, and E-AAC+M-CAT).
Each PCR mixture contained the following: 20 ng DNA template, 1.5 mM MgCl2, 0.1 mM dNTPs, 0.3 μM of each primer, and 1.0 U Taq DNA polymerase, 10 mM Tris-HCl buffer, pH 8.8, 50 mM KCl, and 0.08% Nonidet P-40 (Fermentas, Hanover, MD, USA). PCR cycling consisted of 94°C for 4 min, followed by 35 cycles of 94°C for 40 s, 50°C for 1 min, and 72°C for 1 min, with a final extension at 72°C for 7 min, on a PTC-100 thermal cycler (MJ Research, Inc., Watertown, MA, USA). The fragments were electrophoresed on a 6% (w/v) denaturing polyacrylamide gel in a Hoefer SQ3 DNA gel electrophoresis sequencer (Pharmacia Biotech Inc., San Francisco, CA, USA) at 70 W for 2.5 h. The gels were silver stained according to Creste et al. (2001). The 50-bp ladder (New England Biolabs, Inc.) was used as a molecular weight standard to estimate the size of the AFLP loci.
For ISSR genotyping, 23 primers were used (Table 2). Amplification was performed in a 15-µL reaction mixture containing 10 ng DNA template, 20 mM Tris-HCl, pH 8.4, 50 mM KCl, 2.0 mM MgCl2, 0.2 mM dNTP, 0.3 µM of each primer, and 1 U Taq DNA polymerase (Fermentas). PCR cycling consisted of 94°C for 5 min, followed by 35 cycles of 94°C for 40
©FUNPEC-RP www.funpecrp.com.brGenetics and Molecular Research 12 (4): 6646-6663 (2013)
Germplasm characterization of papaya 6651
s, 45 or 48°C for 40 s, and 72°C for 1 min, with a final extension at 72°C for 5 min, on a Veriti thermal cycler (Applied Biosystems, Foster City, CA, USA).
The fragments were electrophoresed on a 2% (w/v) agarose gel at 120 V for 2.0 h and stained with 1.0 mg/mL ethidium bromide. A 100-bp ladder (New England Biolabs) was used as a molecular weight standard to estimate the size of the ISSR loci.
Data analysis
The amplified fragments from the AFLP and ISSR methods were recorded as present (1) or absent (0) to construct a binary matrix. Only reproducible bands were considered for analysis. The discriminatory power of AFLP and ISSR markers was evaluated by polymorphic information content (PIC) parameters, as proposed by Roldán-Ruiz et al. (2000):
PICi = 2fi (1 - fi) (Equation 1)
where PICi is the polymorphic information content of the marker i, fi is the frequency of the marker bands present, and (1 - fi) is the frequency of the absent marker bands.
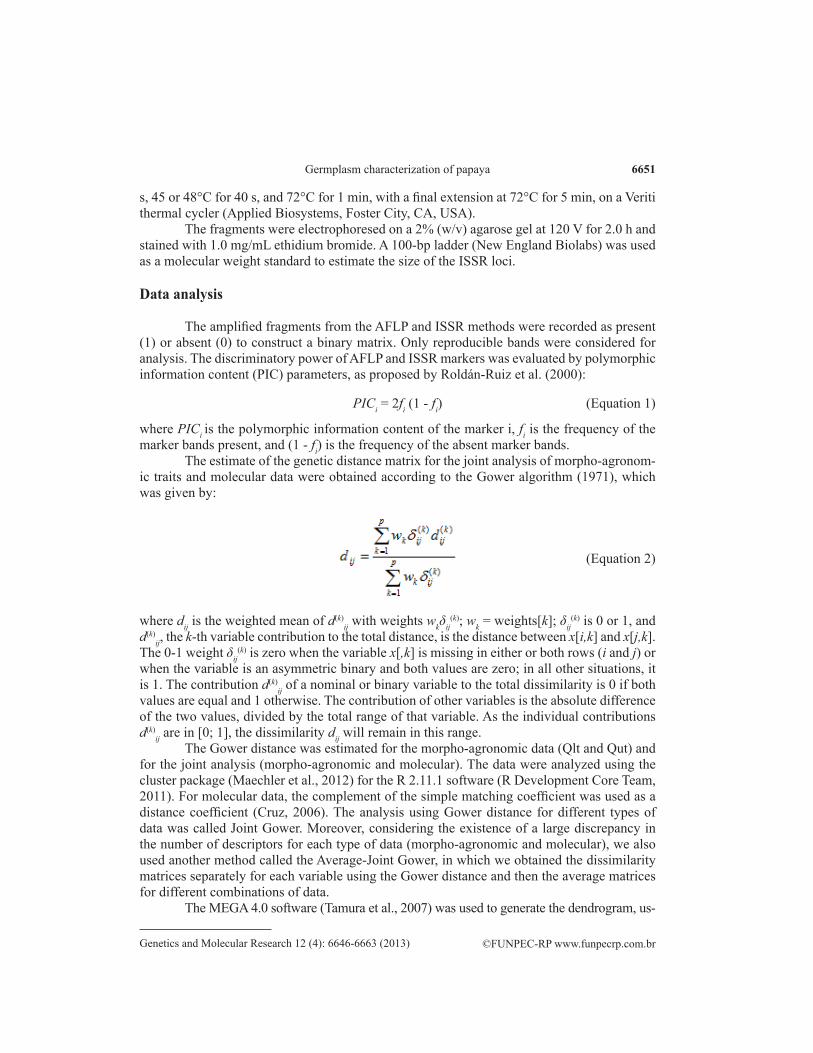
The estimate of the genetic distance matrix for the joint analysis of morpho-agronom-ic traits and molecular data were ob tained according to the Gower algorithm (1971), which was given by:
(Equation 2)
where dij is the weighted mean of d(k)ij with weights wkδij
(k); wk = weights[k]; δij(k) is 0 or 1, and
d(k)ij, the k-th variable contribution to the total distance, is the distance between x[i,k] and x[j,k].
The 0-1 weight δij(k) is zero when the variable x[,k] is missing in either or both rows (i and j) or
when the variable is an asymmetric binary and both values are zero; in all other situations, it is 1. The contribution d(k)
ij of a nominal or binary variable to the total dissimilarity is 0 if both values are equal and 1 otherwise. The contribution of other variables is the absolute difference of the two values, divided by the total range of that variable. As the individual contributions d(k)
ij are in [0; 1], the dissimilarity dij will remain in this range.The Gower distance was estimated for the morpho-agronomic data (Qlt and Qut) and
for the joint analysis (morpho-agronomic and molecular). The data were analyzed using the cluster package (Maechler et al., 2012) for the R 2.11.1 software (R Development Core Team, 2011). For molecular data, the complement of the simple matching coefficient was used as a distance coefficient (Cruz, 2006). The analysis using Gower distance for different types of data was called Joint Gower. Moreover, considering the existence of a large discrepancy in the number of descriptors for each type of data (morpho-agronomic and molecular), we also used another method called the Average-Joint Gower, in which we obtained the dissimilarity matrices separately for each variable using the Gower distance and then the average matrices for different combinations of data.
The MEGA 4.0 software (Tamura et al., 2007) was used to generate the dendrogram, us-

©FUNPEC-RP www.funpecrp.com.brGenetics and Molecular Research 12 (4): 6646-6663 (2013)
O.N. de Jesus et al. 6652
ing the unweighted pair group method with arithmetic mean (UPGMA) for clustering. The corre-lation between the matrices was checked by an analysis of correlations and their significance was assessed with the Mantel t test with 1000 permutations, using the Genes program (Cruz, 2006).
RESULTS AND DISCUSSION
Characterization with ISSR markers
The 23 ISSR primers produced 177 bands, of which 52 (29.19%) were polymorphic. Of the total number of polymorphic bands, 23 (44.2%) were shared by more than 50% of the accessions. The percentage of polymorphic bands varied between different ISSR primers, from 10.00% (ISSR50) to 55.56% (ISSR2). This type of marker showed low efficiency in accurately discriminating between most of the papaya genotypes evaluated, because only 3 markers (4 bands) had a single fingerprinting. PIC ranged from 0.07 (ISSR76 and ISSR50) to 0.50 (ISSR03 and ISSR13) and 0.29 in average (Table 2).
ISSR Sequencea TNB NPB Pol (%) NUB NB50G PIC
ISSR02 CACACACACACACACAG 9 5 55.56 - 1 0.28ISSR03 CACACACACACACACARG 7 1 14.29 - - 0.50ISSR07 CYCACACACACACACACA 11 3 27.27 2 1 0.21ISSR13 GAGAGAGAGAGAGAGAT 4 1 25.00 - - 0.50ISSR15 CGAGAGAGAGAGAGAGA 8 2 25.00 - - 0.32ISSR16 CRGAGAGAGAGAGAGAGA 10 4 40.00 - 1 0.27ISSR18 TGAGAGAGAGAGAGAGA 9 3 33.33 - 1 0.33ISSR21 GTGTGTGTGTGTGTGTC 6 2 33.33 - 2 0.29ISSR23 GTGTGTGTGTGTGTGTYG 4 2 50.00 - 1 0.39ISSR27 CYGTGTGTGTGTGTGTGT 5 1 20.00 - - 0.35ISSR29 CACCACCACCACCACRC 10 4 40.00 1 1 0.38ISSR30 CACCACCACCACCACYC 8 3 37.50 - - 0.27ISSR31 CYCACCACCACCACCAC 11 3 27.27 - 3 0.46ISSR35 CAGCAGCAGCAGCAGRC 8 1 12.50 - 1 0.25ISSR40 GTGGTGGTGGTGGTGYC 7 2 28.57 - 2 0.33ISSR45 TGTTGTTGTTGTTGTYC 4 1 25.00 - 1 0.17ISSR50 AAGAAGAAGAAGAAGRC 10 1 10.00 - 1 0.07ISSR55 ACAACAACAACAACARC 8 3 37.50 - 2 0.27ISSR57 ACCACCACCACCACCRC 8 2 25.00 - 1 0.24ISSR59 AGAAGAAGAAGAAGARC 9 4 44.44 - 2 0.36ISSR61 AGCAGCAGCAGCAGCRC 4 1 25.00 - 1 0.19ISSR76 TGGTGGTGGTGGTGGRC 6 1 16.67 - 1 0.07ISSR93 GAGGAGGAGGAGGAGRC 11 2 18.18 1 - 0.16Mean 7.70 2.26 29.19 1.30 1.40 0.29
Table 2. Characteristics of ISSR markers used in the evaluation of 27 papaya genotypes.
TNB = total number of amplified bands; NPB = number of polymorphic bands; Pol (%) = percentage of polymorphisms per marker; NUB = number of unique bands; NB50G = number of bands in more than 50% of the genotypes; PIC = polymorphism information content. aPrimer sequence of ISSR markers, and R = A, G; Y = C, T.
ISSR markers have been used for studies of genetic diversity in wild species of C. papaya, such as Vasconcellea pubescens. Recently, Carrasco et al. (2009) used 7 ISSR primers to study the genetic diversity of 333 samples of V. pubescens, for which 114 bands were gener-ated and 63 proved to be polymorphic (55.3%). In C. papaya, there have been few reports con-cerning the use of ISSR markers. However, ISSR has been used to evaluate genetic distances between papaya backcross progeny (Ramos et al., 2012). Twenty ISSR primers generated

©FUNPEC-RP www.funpecrp.com.brGenetics and Molecular Research 12 (4): 6646-6663 (2013)
Germplasm characterization of papaya 6653
98 bands, 18 of which were polymorphic (18.36%). This low genetic variability between the progeny evaluated was expected because the progeny derived from BC1S3, BC2S2, and BC3S1 had an average of 90.62, 84.38, and 71.88% endogamy, respectively.
Characterization with AFLP markers
The 11 AFLP primer combinations produced 524 bands, with 359 (69.58%) poly-morphic and an average of 32.64 bands per primer (Table 3). The percentage of polymor-phism for each AFLP combination ranged from 57.81% (E-ACT+M-CTT) to 84.21% (E-ACT+M-CAC). The number of polymorphic bands ranged from 26 for the combination E-ACT+M-CTC to 43 for E-AAC+M-CAT (Table 3). The polymorphisms obtained from the analysis of these genotypes of C. papaya were more numerous than the 186 polymorphisms found by Kim et al. (2002), when analyzing 63 papaya accessions with this same type of molecular marker. Moreover, Rodríguez et al. (2010) reported only 45 polymorphic bands using nine RAPD primers when assessing the genetic diversity of the species Vasconcellea cubensis and C. papaya.
Primer combinationa TNB NPB Pol (%) NUB NB50G PIC
E-ACT+M-CAA 36 27 75.00 1 - 0.31E-ACT+M-CAC 38 32 84.21 2 3 0.26E-ACT+M-CAT 29 20 68.97 4 1 0.24E-ACT+M-CTA 39 30 76.92 5 - 0.20E-ACT+M-CTC 37 26 70.27 2 - 0.22E-ACT+M-CTG 54 33 61.11 10 5 0.24E-ACT+M-CTT 64 37 57.81 12 1 0.20E-AAC+M-CAA 57 36 63.16 15 1 0.17E-AAC+M-CAC 53 35 66.04 15 3 0.19E-AAC+M-CAG 58 40 68.97 22 1 0.18E-AAC+M-CAT 59 43 72.88 17 1 0.19Mean 47.64 32.64 69.58 9.55 2.00 0.22
Table 3. Characteristics of AFLP markers used in the evaluation of 27 papaya genotypes.
TNB = total number of amplified bands; NPB = number of polymorphic bands; Pol (%) = percentage of polymorphisms per marker; NUB = number of unique bands; NB50G = number of bands in more than 50% of the genotypes; PIC = polymorphism information content. aThe core sequences of primers for the selective amplification were as follows: E- = 5ꞌ-GACTGCGTACCAATTTC-3ꞌ for EcoRI prim ers; M- = 5ꞌ-GATGAGTCCTGAGTAA-3ꞌ for MseI primers. Each primer contained 3 selective nucleotides at the 3ꞌ-end.
For biallelic markers, PIC ranged from 0.0 for monomorphic markers to 0.50 for markers present in 50% of the individuals and absent in the other 50% (Roldan-Ruiz et al., 2000). In papaya, the average PIC for 359 polymorphic bands ranged from 0.17 (E-AAC+M-CAA) to 0.31 (E-ACT+M-CAA), with a mean of 0.22.
The informative quality of AFLP markers is of great importance when aiming to iden-tify specific bands for use in protocols intended for protecting plant varieties. Of 359 polymor-phic bands, 105 (29.2%) corresponded to bands present in only one accession (specific bands), while 85 and 35 bands were shared by two and three accessions, respectively (Figure 1). The combination E-AAC+M-CAG was the largest contributor to the detection of unique bands, with 22 bands detected (Table 3).

©FUNPEC-RP www.funpecrp.com.brGenetics and Molecular Research 12 (4): 6646-6663 (2013)
O.N. de Jesus et al. 6654
In general, the accessions had four specific bands each, on average. In addition, CMF021 and CMF233 showed the largest number of specific bands (12 marks), followed by inbred line L88-08 with eight specific bands. Moreover, accessions CMF088 and CMF020 did not show any specific bands (Figure 2). Considering that the genotypes CMF021, CMF233, and L88-08 are characterized as a cultivar, landrace, and inbred line, respectively, a large num-ber of shared alleles may have been expected. However, the large number of unique bands in these genotypes indicated that they are derived from specific genetic backgrounds.
Figure 1. Number of shared bands per accession from the AFLP markers.
Figure 2. Molecular profile from AFLP markers that characterize each papaya accession. Upper graph refers to the number of specific bands per accession, along with its molecular fingerprinting (bottom).
©FUNPEC-RP www.funpecrp.com.brGenetics and Molecular Research 12 (4): 6646-6663 (2013)
Germplasm characterization of papaya 6655
The cloning of these unique bands and their transformation into specific genotypic markers could be useful for the registry and protection of papaya varieties in the future. In addition, these unique bands are very useful for breeding programs because they allow the selection of different genotypes for increasing variability, for exploiting heterosis by cross-ing contrasting individuals (Pecina-Quintero et al., 2011) or for developing markers linked to important agronomic characteristics (Dekkers and Hospital, 2002).
Despite the usefulness of unique bands, fragments common to genotypes also play an important role in aiming to establish, and in understanding the genetic relationships in the germplasm, and finally, in deducing the geographical origin of unknown accessions (Prevost and Wilkinson, 1999). However, a few bands, 16 (4.54%), frequently appeared in over 50% (up to 14 accessions), especially the combinations E-ACT+M-CTG with five bands and E-ACT+M-CAC and E-AAC+M-CAC with three bands (Table 3).
Analysis of diversity using morpho-agronomic descriptors and molecular data (AFLP and ISSR)
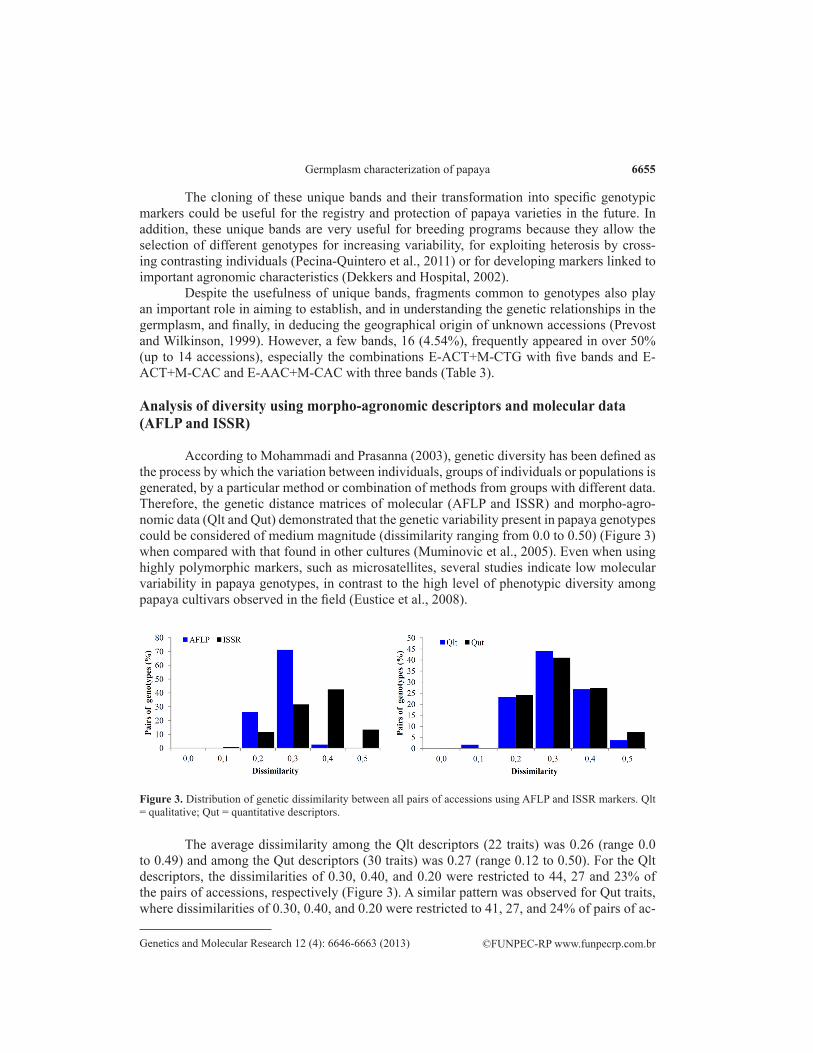
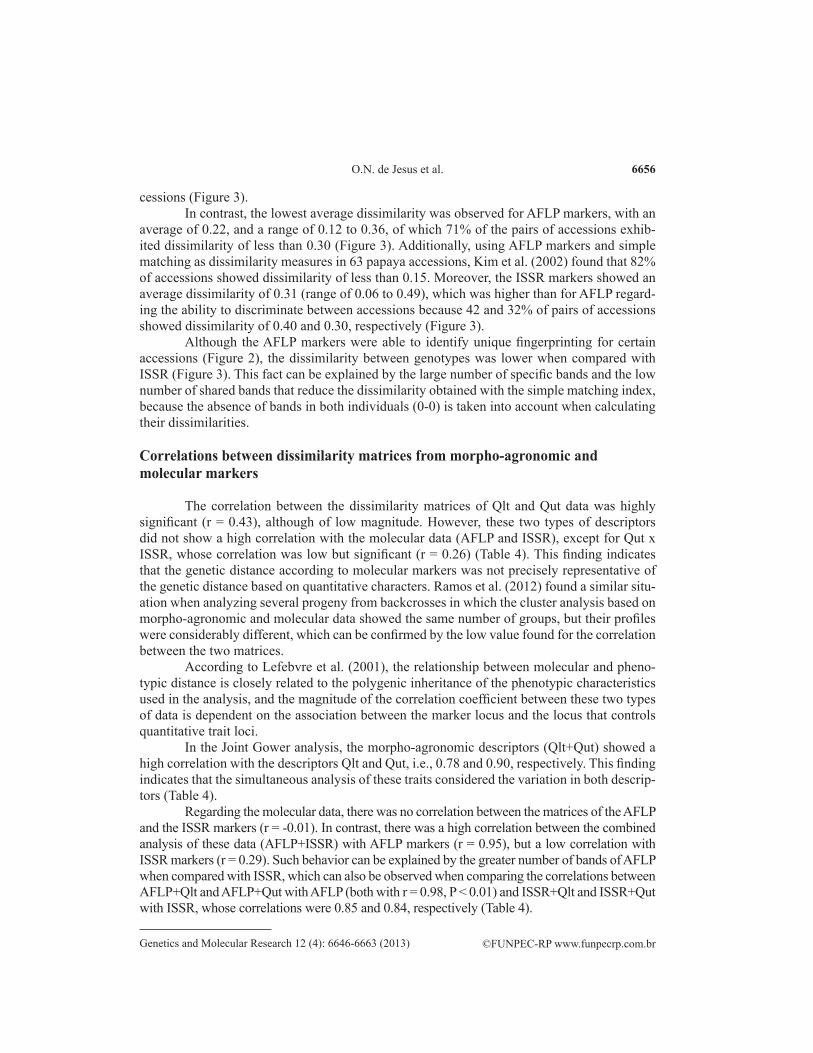
According to Mohammadi and Prasanna (2003), genetic diversity has been defined as the process by which the variation between individuals, groups of individuals or populations is generated, by a particular method or combination of methods from groups with different data. Therefore, the genetic distance matrices of molecular (AFLP and ISSR) and morpho-agro-nomic data (Qlt and Qut) demonstrated that the genetic variability present in papaya genotypes could be considered of medium magnitude (dissimilarity ranging from 0.0 to 0.50) (Figure 3) when compared with that found in other cultures (Muminovic et al., 2005). Even when using highly polymorphic markers, such as microsatellites, several studies indicate low molecular variability in papaya genotypes, in contrast to the high level of phenotypic diversity among papaya cultivars observed in the field (Eustice et al., 2008).
Figure 3. Distribution of genetic dissimilarity between all pairs of accessions using AFLP and ISSR markers. Qlt = qualitative; Qut = quantitative descriptors.
The average dissimilarity among the Qlt descriptors (22 traits) was 0.26 (range 0.0 to 0.49) and among the Qut descriptors (30 traits) was 0.27 (range 0.12 to 0.50). For the Qlt descriptors, the dissimilarities of 0.30, 0.40, and 0.20 were restricted to 44, 27 and 23% of the pairs of accessions, respectively (Figure 3). A similar pattern was observed for Qut traits, where dissimilarities of 0.30, 0.40, and 0.20 were restricted to 41, 27, and 24% of pairs of ac-
©FUNPEC-RP www.funpecrp.com.brGenetics and Molecular Research 12 (4): 6646-6663 (2013)
O.N. de Jesus et al. 6656
cessions (Figure 3). In contrast, the lowest average dissimilarity was observed for AFLP markers, with an
average of 0.22, and a range of 0.12 to 0.36, of which 71% of the pairs of accessions exhib-ited dissimilarity of less than 0.30 (Figure 3). Additionally, using AFLP markers and simple matching as dissimilarity measures in 63 papaya accessions, Kim et al. (2002) found that 82% of accessions showed dissimilarity of less than 0.15. Moreover, the ISSR markers showed an average dissimilarity of 0.31 (range of 0.06 to 0.49), which was higher than for AFLP regard-ing the ability to discriminate between accessions because 42 and 32% of pairs of accessions showed dissimilarity of 0.40 and 0.30, respectively (Figure 3).
Although the AFLP markers were able to identify unique fingerprinting for certain accessions (Figure 2), the dissimilarity between genotypes was lower when compared with ISSR (Figure 3). This fact can be explained by the large number of specific bands and the low number of shared bands that reduce the dissimilarity obtained with the simple matching index, because the absence of bands in both individuals (0-0) is taken into account when calculating their dissimilarities.
Correlations between dissimilarity matrices from morpho-agronomic andmolecular markers
The correlation between the dissimilarity matrices of Qlt and Qut data was highly significant (r = 0.43), although of low magnitude. However, these two types of descriptors did not show a high correlation with the molecular data (AFLP and ISSR), except for Qut x ISSR, whose correlation was low but significant (r = 0.26) (Table 4). This finding indicates that the genetic distance according to molecular markers was not precisely representative of the genetic distance based on quantita tive characters. Ramos et al. (2012) found a similar situ-ation when analyzing several progeny from backcrosses in which the cluster analysis based on morpho-agronomic and molecular data showed the same number of groups, but their profiles were considerably different, which can be confirmed by the low value found for the correlation between the two matrices.
According to Lefebvre et al. (2001), the relationship between molecular and pheno-typic distance is closely related to the polygenic inheritance of the phenotypic characteristics used in the analysis, and the magnitude of the correlation coefficient between these two types of data is dependent on the association between the marker locus and the locus that controls quantitative trait loci.
In the Joint Gower analysis, the morpho-agronomic descriptors (Qlt+Qut) showed a high correlation with the descriptors Qlt and Qut, i.e., 0.78 and 0.90, respectively. This finding indicates that the simultaneous analysis of these traits considered the variation in both descrip-tors (Table 4).
Regarding the molecular data, there was no correlation between the matrices of the AFLP and the ISSR markers (r = -0.01). In contrast, there was a high correlation between the combined analysis of these data (AFLP+ISSR) with AFLP markers (r = 0.95), but a low correlation with ISSR markers (r = 0.29). Such behavior can be explained by the greater number of bands of AFLP when compared with ISSR, which can also be observed when comparing the correlations between AFLP+Qlt and AFLP+Qut with AFLP (both with r = 0.98, P < 0.01) and ISSR+Qlt and ISSR+Qut with ISSR, whose correlations were 0.85 and 0.84, respectively (Table 4).

©FUNPEC-RP www.funpecrp.com.brGenetics and Molecular Research 12 (4): 6646-6663 (2013)
Germplasm characterization of papaya 6657
Dat
a
V
aria
bles
Join
t Gow
er
Ave
rage
-Joi
nt G
ower
A
FLP
ISSR
Q
lt Q
ut
Qlt+
Qut
A
FLP+
A
FLP+
A
FLP+
IS
SR+
ISSR
+ C
omb-
Q
lt+
AFL
P+
AFL
P+ A
FLP+
IS
SR+
ISSR
+ C
omb-
ISSR
Q
lt Q
ut
Qlt
Qut
JG
Q
ut
ISSR
Q
lt Q
ut
Qlt
Qut
A
JG
Varia
bles
AFL
P
-
ISSR
-0
.01
-
Q
lt -0
.01
0.06
-
Qut
0.
09
0.26
**
0.43
**
-
Aver
age-
Join
t Gow
er (A
JG)
Q
lt+Q
ut
0.05
0.
21**
0.
78**
0.
90**
-
AFL
P+IS
SR
0.95
**
0.29
**
0.01
0.
16**
0.
12**
-
AFL
P+Q
lt 0.
98**
0.
04
0.07
0.
27**
0.
22**
0.
95**
-
AFL
P+Q
ut
0.98
**
0.04
0.
07
0.27
**
0.22
**
0.95
**
1.00
**
-
IS
SR+Q
lt 0.
01
0.85
**
0.47
**
0.34
**
0.46
**
0.26
**
0.07
0.
07
-
IS
SR+Q
ut
0.05
0.
84**
0.
27**
0.
66**
0.
58**
0.
30**
0.
17**
0.
17**
0.
88**
-
Com
b-JG
0.
92**
0.
28**
0.
20**
0.
35**
0.
34**
0.
97**
0.
96**
0.
96**
0.
36**
0.
42**
-Jo
int G
ower
(JG
)
Qlt+
Qut
0.
05
0.19
**
0.84
**
0.86
**
1.00
**
0.10
**
0.20
**
0.20
**
0.48
**
0.55
**
0.33
**
-
A
FLP+
ISSR
0.
40**
0.
91**
0.
05
0.27
**
0.21
**
0.66
**
0.44
**
0.44
**
0.78
**
0.79
**
0.64
**
0.20
**
-
A
FLP+
Qlt
0.41
**
0.06
0.
91**
0.
43**
0.
73**
0.
41**
0.
48**
0.
48**
0.
43**
0.
27**
0.
57**
0.
78**
0.
22**
A
FLP+
Qut
0.
47**
0.
23**
0.
38**
0.
92**
0.
82**
0.
51**
0.
62**
0.
62**
0.
30**
0.
60**
0.
67**
0.
78**
0.
40**
IS
SR+Q
lt -0
.01
0.74
**
0.72
**
0.47
**
0.67
**
0.21
**
0.08
0.
08
0.91
**
0.77
**
0.33
**
0.70
**
0.67
**
ISSR
+Qut
0.
05
0.79
**
0.32
**
0.80
**
0.70
**
0.29
**
0.20
**
0.20
**
0.75
**
0.94
**
0.40
**
0.66
**
0.74
**
0.31
**
0.73
**
0.76
**
-
Com
b-A
JG
0.24
**
0.61
**
0.67
**
0.80
**
0.88
**
0.41
**
0.38
**
0.38
**
0.76
**
0.83
**
0.57
**
0.87
**
0.65
**
0.71
**
0.80
**
0.88
**
0.89
**
-
Tabl
e 4.
Cor
rela
tions
bet
wee
n di
ssim
ilarit
y m
atric
es u
sing
qua
litat
ive
(Qlt)
and
qua
ntita
tive
(Qut
) de
scrip
tors
, and
mol
ecul
ar m
arke
rs (
AFL
P an
d IS
SR),
sepa
rate
ly a
nd u
sing
join
t ana
lysi
s.
**Si
gnifi
cant
at 1
% o
f pro
babi
lity
by th
e M
ante
l t-te
st w
ith 1
000
perm
utat
ions
. Com
b-JG
= a
naly
sis o
f all
type
s of d
ata
sim
ulta
neou
sly
usin
g G
ower
dis
tanc
e;
Com
b-A
JG =
ana
lysi
s of a
ll ty
pes o
f dat
a ba
sed
on th
e av
erag
e of
dis
sim
ilarit
y m
atric
es c
alcu
late
d w
ith G
ower
dis
tanc
e.

©FUNPEC-RP www.funpecrp.com.brGenetics and Molecular Research 12 (4): 6646-6663 (2013)
O.N. de Jesus et al. 6658
The combined analysis using all types of descriptors (Comb-JG) showed significant correlations for all combinations evaluated, but with medium magnitudes for ISSR, Qlt, Qut, Qlt+Qut, ISSR+Qlt, and ISSR+Qut, and high (> 0.92) magnitudes for AFLP data in all combi-nations (AFLP, AFLP+ISSR, AFLP+Qlt and AFLP+Qut) (Table 4). It is likely that the larger number of bands (359) compared with only 52 morpho-agronomic traits (22 Qlt and 30 Qut) contributed to this result.
The strong influence of the descriptors, which were the most abundant in the dissimilar-ity matrix, was also observed by Bertan et al. (2009), while studying genetic diversity in wheat. These authors observed a low correlation (r = 0.05) between the morphological and molecular data (AFLP) but a high correlation (r = 0.65) between combined (morpho-agronomic and molec-ular) and molecular data. Therefore, the results showed a greater influence of more frequent data on the estimates of genetic divergence, leading to an overestimation of this association due to the larger number of molecular markers than morpho-agronomic variables (Franco et al., 2001).
Máric et al. (2004) also observed a low correlation (r = 0.12) between genetic dissimilarity based on 14 polymorphic RAPD primers and 12 morphological traits in wheat. This low correlation can be explained by the different mathematical properties used in calculating the indices of dissimilarity, which could lead to a greater bias in the estimates. However, the use of the same dissimilarity index for all types of descriptors in papaya (except AFLP and ISSR) was unable to reduce the bias to facilitate a better association between the morpho-agronomic traits and the molecular data. Therefore, the polymorphism, detectable using molecular markers, may be assessed in genomic regions that have little influence on phenotypic traits.
For effective use in a breeding program, these descriptors should produce additional in-formation about accessions of interest. The Joint Gower analysis was not very effective at in-corporating the information from all descriptors when studying the phenotypic and genetic rela-tionships between papaya accessions. An alternative to using the Gower distance unweighted in relation to the number of specific markers is joint analysis based on the average of the matrices of several descriptors (Cruz et al., 2011), here referred to as the Average-Joint Gower. Accord-ing to this analysis, it was observed that although the magnitude of the correlation between the AFLP markers versus the average of different combinations of data (AFLP+ISSR, AFLP+Qlt, and AFLP+Qut) was reduced when compared with the separate use of Gower distance (range 0.40 to 0.47), that correlation was still significant (Table 4) and had an intermediate magnitude.
Furthermore, the correlation between all data based on the average of dissimilarity matrices (Comb-AJG) and AFLP data was significant but of low magnitude (r = 0.24). In con-trast, there was a better distribution in the values of the correlations (0.61 to 0.80) with other descriptors evaluated separately and a high correlation between the Joint Gower and Average-Joint Gower analyses, when using different combinations of data (0.38 to 0.88) (Table 4).
The Average-Joint Gower analysis had a more favorable balance between the correla-tions of different variables. In this type of analysis, the joint dissimilarities do not have much influence on the number of markers, because matrices are obtained separately for each data type and are then combined with the average of the matrices. In this process, it is important to standardize the measurements and use dissimilarity indices of similar magnitudes, such as the Gower distance, which provides a semi-positive definite matrix with values between 0 and 1. Thus, considering that the analysis of all types of descriptors combined can better represent the genetic variability in papaya, we chose to represent the cluster analysis based only on Comb-AJG.

©FUNPEC-RP www.funpecrp.com.brGenetics and Molecular Research 12 (4): 6646-6663 (2013)
Germplasm characterization of papaya 6659
Cluster analysis
Cluster analysis based on the Comb-AJG analysis divided the data into five main groups, whose average dissimilarity ranged from 0.19 for Cluster 1 to 0.23 for Cluster 2 and Cluster 3, and 0.27 for Cluster 4 (Figure 4). Cluster 5 was represented only by the CMF008 accession, which was the most divergent (dissimilarity of 0.32). In Cluster 1, eight genotypes from the ‘Solo’ group were aggregated, consisting of two obsolete germplasms (CMF087 and CMF092), four landraces (CMF230, CMF233, CMF234, and CMF235), and two cultivars (Golden and Sunrise). The main traits of this group included higher values for plant height (P-H8 and P-H12), IH-FF, stem diameter (S-D8 and S-D12), Fr-TSk, TSS, and R-TTATSS. In contrast, these genotypes demonstrated lower values of I-SLen, Fr-PLen, Fr-Wei, Fr-Len, Fr-Win, Fr-CCLen, TTA, Se-FWei, Se-DWei, Se-Len, and Se-Win (Table 5).
Figure 4. Dendrogram of the relationships among papaya accessions using morpho-agronomic descriptors and molecular data. Green (Cluster 1), brown (Cluster 2), blue (Cluster 3), red (Cluster 4), and pink (Cluster 5). The histogram of the distribution, in proportion, of the dissimilarity matrix (x-axis) between pairs of accessions (y-axis) is shown next to the clusters. AD = average dissimilarity per group.

©FUNPEC-RP www.funpecrp.com.brGenetics and Molecular Research 12 (4): 6646-6663 (2013)
O.N. de Jesus et al. 6660
Traits Units Clustersa
1 2 3 4 5
Plant height at 8 months (P-H8) m 2.30 2.14 1.89 2.19 1.24Plant height at 12 months (P-H12) m 2.89 2.79 2.52 2.73 1.63Insertion height of the first fruit (IH-FF) m 1.37 1.07 1.25 1.33 0.60Stem diameter at 8 months (S-D8) cm 11.40 11.28 10.82 10.90 6.21Stem diameter at 12 months (S-D12) cm 12.27 12.39 12.06 11.38 7.90Average length of internodes until the first fruit’s insertion (ALI) cm 2.44 2.39 2.78 2.97 2.21Leaf length (L-Len) cm 40.77 43.41 48.21 44.94 37.46Leaf width (L-Win) cm 61.66 67.12 75.18 68.97 54.69Ratio between the length and width of the leaves (R-L-LenWin) - 0.66 0.65 0.64 0.65 0.68Leaf petiole length (L-PLen) cm 80.46 79.02 95.45 82.72 63.85Flower corolla length (Fl-CLen) cm 3.50 3.74 3.33 4.19 4.80Inflorescence stalk length (I-SLen) cm 1.61 2.04 1.89 1.86 2.48Number of flowers per inflorescence (NFInf) - 5.67 5.12 7.48 1.99 11.16Fruit peduncle length (Fr-PLen) cm 4.28 7.02 5.60 6.80 4.94Fruit weight (Fr-Wei) g 460.27 702.81 928.89 1421.25 1309.40Fruit length (Fr-Len) cm 13.51 16.70 19.77 18.83 19.75Fruit width (Fr-Win) cm 8.37 9.29 9.78 13.29 11.85Ratio between fruit length and width (R-Fr-LenWin) - 1.63 1.80 2.04 1.45 1.71Fruit thickness of skin (Fr-TSk) mm 1.19 1.12 1.15 1.11 1.03Fruit central cavity length (Fr-CCLen) cm 4.74 5.05 5.06 8.71 6.87Fruit firmness (Fr-Fir) lb 1.41 1.42 1.39 1.52 1.85Total titratable acidity (TTA) % 0.07 0.07 0.07 0.08 0.14Total soluble solids (TSS) ºBrix 10.08 9.92 9.64 9.10 8.53Ratio between total titratable acidity and soluble solids content (R-TTATSS) - 150.86 148.47 139.64 120.42 61.00Fruit pH (Fr-pH) - 5.46 5.42 5.44 5.49 5.44Seed fresh weight (Se-FWei) g 26.71 33.00 38.51 86.21 58.88Seed dry weight (Se-DWei) g 6.45 7.47 7.73 17.05 9.49Seed length (Se-Len) cm 0.55 0.57 0.59 0.58 0.64Seed width (Se-Win) cm 0.39 0.42 0.44 0.39 0.51Ratio between the length and width of the seed (R-Se-LenWin) - 1.41 1.38 1.36 1.50 1.26
Table 5. Mean values of the agronomic traits for the five clusters identified by clustering analysis.
aAccording to Figure 4.
Regarding Cluster 2, three improved varieties and one obsolete germplasm were grouped, of which two genotypes belonged to the ‘Solo’ type (CMF018 and CMF065) and two belonged to the ‘Formosa’ type (CMF020 and CMF088). This cluster was distinguished by greater S-D12, greater Fr-PLen, and a higher R-TTATSS.
Cluster 3 was composed largely of genotypes of the ‘Formosa’ type (CMF123, L12-08, L62-08, L75-08, L88-08, L90-08, and the cultivar Calimosa) and two genotypes of the ‘Solo’ type (L30-08 and L48-08). Except for CMF123, which is an obsolete germplasm, the remaining genotypes represented a genetic background with some degree of improvement, mostly inbred lines with a high degree of endogamy. The most salient traits of this group were the higher L-Len, L-Win, L-PLen, Fr-Len, and R-Fr-LenWin as well as the lower R-L-LenWin, Fl-CLen, and Fr-Fir (Table 5).
Cluster 4 was composed primarily of genotypes of the ‘Formosa’ type, of which two are improved varieties (CMF012 and CMF041), two are cultivars (CMF021 and CMF024) and one is an obsolete germplasm (CMF154). The genotypes of this group demonstrated high values of ALI, Fr-PLen, Fr-Wei, Fr-Win, Fr-CCLen, Fr-pH, Se-FWei, Se-DWei, and R-Se-LenWin, and low values of NFInf, R-Fr-LenWin, and Se-Win (Table 5). This finding indicates that the genotypes of this group tended to produce larger fruit with many seeds, and fewer fruits per bunch.
Finally, the CMF008 accession (improved variety) was most dissimilar to the other

©FUNPEC-RP www.funpecrp.com.brGenetics and Molecular Research 12 (4): 6646-6663 (2013)
Germplasm characterization of papaya 6661
groups, and was therefore treated separately. This genotype showed the highest values for the following traits: Fl-CLen, I-SLen, NFInf, Fr-Len, Fr-Fir, TTA, Se-Len, and Se-Win. However, CMF008 showed low values for traits related to size and plant vigor (P-H8, P-H12, IH-FF, S-D8, S-D12, and ALI), photosynthetic capacity (L-Len, L-Win and L-PLen) and some fruit characteristics, such as Fr-TSk, TSS and R-TTATSS, which certainly contributed to its separa-tion from other genotypes.
Currently, the classification of papaya fruits is based on the ‘Formosa’ and ‘Solo’ types. The ‘Solo’ type produces small-sized, red-fleshed fruits weighing 300-650 g, whereas the ‘Formosa’ type bears red-fleshed, medium-sized fruits (1000-1300 g). Although not easily understood or completely refined and clear, this classification using the concept of fruit type for papaya (‘Formosa’ and ‘Solo’) is still in use.
Cluster 1 was composed exclusively of genotypes of the ‘Solo’ type, with an average fruit weight of 460.27 g, whereas Clusters 4 and 5 were composed exclusively of accessions from the ‘Formosa’ type, with average fruit weights of 1421.25 and 1309.40 g, respectively. Therefore, using several other agronomic traits and molecular data for clustering, a perfect classification of these genotypes based on fruit type was not expected. Thus, Clusters 2 and 3 were formed from both types of genotypes, with average fruit weights of 702.81 and 928.89 g, respectively.
According to Ramos et al. (2012), the traits related to fruit size (average weight, length, and diameter), as well as plant vigor and low fruit firmness, clearly contributed to the distinctiveness of 26 papaya progeny, allocating the fruits to seven main groups. In the present study, the fruit traits demonstrated high significance for classifying the genotypes, as did other plant traits, such as height, vigor, and flowering.
Considering that phenotypic data are strongly influenced by en vironmental condi-tions, genetic studies based on morpho-agronomic characteristics have been thought to be of low accuracy (Vieira et al., 2007). In contrast, in recent years, there has been a significant in-crease in the application of molecular genetic methods to assess genetic relationships between papaya and related wild species (Kim et al. 2002; Van Droogenbroeck et al. 2004; Carrasco et al. 2009; Oliveira et al., 2010b). Molecular markers offer numerous advantages over phe-notype-based alternatives because the former are not confounded by environmental, pleiotro-pic, and epistatic effects. However, molecular markers may not correlate with the phenotypic expression of a genomic trait, which can be demonstrated by the low correlation between the Qut data and molecular markers, where correlations were 0.09 and 0.26 for AFLP and ISSR, respectively (Table 4). In addition, the separate analyses of morpho-agronomic and molecular data can result in fragmented and often inaccurate inferences, making it difficult to understand the genetic relationships between the relevant germplasms (Ramos et al., 2012). In general, the matrix of dissimilarities and the dendrogram generated based on the average of morpho-agronomic and molecular data present a more balanced view of the genetic variability found in inbred lines, varieties, cultivars, and papaya hybrids. We showed that an analysis of all catego-ries of data analyzed simultaneously, after being weighted by the number of markers, allowed for the creation of more coherent groups describing the genetic diversity found in papaya. This study demonstrated the advantages of using the average of the dissimilarity matrix, instead of the Gower algorithm for all data together, in the clustering of papaya genotypes using discrete and continuous variables simultaneously, since the results obtained were more weighted and balanced for both types of data.

©FUNPEC-RP www.funpecrp.com.brGenetics and Molecular Research 12 (4): 6646-6663 (2013)
O.N. de Jesus et al. 6662
ACKNOWLEDGMENTS
Research supported by Coordenação de Aperfeiçoamento de Pessoal de Nível Supe-rior (CAPES), Conselho Nacional de Desenvolvimento Científico e Tecnológico (CNPq), and Fundação de Amparo à Pesquisa do Estado da Bahia (FAPESB), including fellowships.
REFERENCES
Bertan I, Carvalho FIF, Oliveira AC, Benin G, et al. (2009). Morphological, pedigree, and molecular distances and their association with hybrid wheat performance. Pesq. Agropec. Bras. 44: 155-163.
Carrasco B, Avila P, Perez-Diaz J, Muñoz P, et al. (2009). Genetic structure of highland papayas (Vasconcellea pubescens (Lenné et C Koch) Badillo) cultivated along a geographic gradient in Chile as revealed by Inter Simple Sequence Repeats (ISSR). Genet. Resour. Crop Evol. 56: 339-337.
Creste S, Tulmann-Neto A and Figueira A (2001). Detection of single sequence repeat polymorphisms in denaturing polyacrylamide sequencing gels by silver staining. Plant Mol. Biol. Rep. 19: 299-306.
Crossa J and Franco J (2004). Statistical methods for classifying genotypes. Euphytica 137: 19-37.Cruz CD (2006). Programa Genes: Análise Multivariada e Simulação. Editora UFV, Viçosa.Cruz CD, Ferreira FM and Pessoni LA (2011). Biometria Aplicada ao Estudo da Diversidade Genética. Suprema, Visconde
do Rio Branco.Dekkers JC and Hospital F (2002). The use of molecular genetics in the improvement of agricultural populations. Nat.
Rev. Genet. 3: 22-32.Devitt LC, Fanning K, Dietzgen RG and Holton TA (2010). Isolation and functional characterization of a lycopene beta-
cyclase gene that controls fruit colour of papaya (Carica papaya L.). J. Exp. Bot. 61: 33-39.Dias NLP, Oliveira EJ and Dantas JLL (2011). Avaliação de genótipos de mamoeiro com uso de descritores agronômicos
e estimação de parâmetros genéticos. Pesq. Agropec. Bras. 46: 1471-1479.Doyle JJ and Doyle JL (1990). Isolation of plant DNA from fresh tissue. Focus 12: 13-15.Eustice M, Yu Q, Lai CW, Hou S, et al. (2008). Development and application of microsatellite markers for genomic
analysis of papaya. Tree Genet. Genomes 4: 333-341.Franco J, Crossa J, Ribaut JM, Betran J, et al. (2001). A method for combining molecular markers and phenotypic attributes
for classifying plant genotypes. Theor. Appl. Genet. 103: 944-952.Franco J, Crossa J, Warburton ML and Taba S (2006). Sampling strategies for conserving maize diversity when forming
core subsets using genetic markers. Crop Sci. 46: 854-864.Gonçalves LS, Rodrigues R, do Amaral Junior AT, Karasawa M, et al. (2009). Heirloom tomato gene bank: assessing
genetic divergence based on morphological, agronomic and molecular data using a Ward-modified location model. Genet. Mol. Res. 8: 364-374.
Gower JC (1971). A general coefficient of similarity and some of its properties. Biometrics 27: 871.Instituto Brasileiro de Geografia e Estatística (2011). Sistema IBGE de Recuperação Automática - SIDRA. Available at
[http://www.ibge.go br]. Accessed April 23, 2011. International Plant Genetic Resources Institute (1998). Descriptor List for Papaya. IPGRI, Rome.Kim MS, Moore PH, Zee F, Fitch MM, et al. (2002). Genetic diversity of Carica papaya as revealed by AFLP markers.
Genome 45: 503-512.Lefebvre V, Goffinet B, Chauvet JC, Caromel B, et al. (2001). Evaluation of genetic distances between pepper inbred
lines for cultivar protection purposes: comparison of AFLP, RAPD and phenotypic data. Theor. Appl. Genet. 102: 741-750.
Maechler M, Rousseeuw P, Struyf A and Hubert M (2012). Cluster Analysis Basics and Extensions. R Package Version 1.14.2, Available at [http://CRAN.R-project.org/package=cluster]. Accessed April 4, 2012.
Martins DS and Costa AFS (2003). A Cultura do Mamoeiro: Tecnologias de Produção. Incaper, Vitória.Máric S, Bolaric S, Martincic J, Pejic I, et al. (2004). Genetic diversity of hexaploid wheat cultivars estimated by RAPD
markers, morphological traits and coefficients of parentage. Plant Breed. 123: 366-369.Mohammadi SA and Prasanna BM (2003). Analyses of genetic diversity in crop plants - Salient statistical tools and
considerations. Crop Sci. 43: 1235-1248.Muminovic J, Merz A and Melchinger AE (2005). Genetic structure and diversity among radish varieties as inferred from
AFLP and ISSR analyses. J. Amer. Soc. Hort. Sci. 130: 79-87.Oliveira EJ, Lima DS, Lucena RS, Motta TBN, et al. (2010a). Correlações genéticas e análise de trilha para número de

©FUNPEC-RP www.funpecrp.com.brGenetics and Molecular Research 12 (4): 6646-6663 (2013)
Germplasm characterization of papaya 6663
frutos comerciais por planta em mamoeiro. Pesq. Agropec. Bras. 45: 855-862.Oliveira EJ, Amorim VBO, Matos ELS, Costa JL, et al. (2010b). Polymorphism of microsatellite markers in papaya
(Carica papaya L.). Plant Mol. Biol. Rep. 28: 519-530.Pecina-Quintero V, Anaya-López JL, Colmenero AZ, Garcia NM, et al. (2011). Molecular characterization of Jatropha
curcas L. genetic resources from Chiapas, México through AFLP markers. Biomas Bioenergy 35: 1897-1905.Prevost A and Wilkinson MJ (1999). A new system of comparing PCR primers applied to ISSR fingerprinting of potato
cultivars. Theor. Appl. Genet. 98: 107-112.R Development Core Team (2011). R: A language and environment for statistical computing. R Foundation for Statistical
Computing. Available at [http://www.R-project.org/]. Accessed January 26, 2010.Raghu D, Senthil N, Saraswathi T, Reveendran M, et al. (2007). Morphological and simple sequence repeats (SSR) based
fingerprinting of South Indian cassava germplasm. Int. J. Integr. Biol. 1: 141-148.Ramos HC, Pereira MG, Goncalves LS, Berilli AP, et al. (2012). Multivariate analysis to determine the genetic distance
among backcross papaya (Carica papaya) progenies. Genet. Mol. Res. 11: 1280-1295.Resende MDV (2007). Software Selegen - REML/BLUP: Sistema Estatístico e Seleção Computadorizada Via Modelos
Mistos. Embrapa Floresta, Colombo.Rodríguez J, Rodríguez P, González M and Martínez-Gómez P (2010). Molecular characterization of Cuban endemism
Carica cubensis Solms using random amplified polymorphic DNA (RAPD) markers. J. Agric. Sci. 1: 95-101.Roldán-Ruiz I, Dendauw J, Van Bockstaele E, Depicker A, et al. (2000). AFLP markers reveal high polymorphic rates in
ryegrasses (Lolium spp.). Mol. Breed. 6: 125-134.Santos LF, de Oliveira EJ, dos Santos SA, de Carvalho FM, et al. (2011). ISSR markers as a tool for the assessment of
genetic diversity in Passiflora. Biochem. Genet. 49: 540-554. Santos SA, Silva RF, Pereira MG, Alves E, et al. (2009). Estudos morfo-anatômicos de sementes de dois genótipos de
mamão (Carica papaya L.). Rev. Bras. Sementes 31: 116-122.Tamura K, Dudley J, Nei M and Kumar S (2007). MEGA4: Molecular Evolutionary Genetics Analysis (MEGA) software
version 4.0. Mol. Biol. Evol. 24: 1596-1599.Van Droogenbroeck B, Kyndt T, Maertens I, Romeijn-Peeters E, et al. (2004). Phylogenetic analysis of the highland
papayas (Vasconcellea) and allied genera (Caricaceae) using PCR-RFLP. Theor. Appl. Genet. 108: 1473-1486.Vieira EA, Carvalho FIF, Bertan I, Koop MM, et al. (2007). Association between genetic distances in wheat (Triticum
aestivum L.) as estimated by AFLP and morphological markers. Genet. Mol. Biol. 30: 392-399.Vos P, Hogers R, Bleeker M, Reijans M, et al. (1995). AFLP: a new technique for DNA fingerprinting. Nucleic Acids Res.
23: 4407-4414.