use of receiver operating characteristic curve to evaluate
TRANSCRIPT

Received September 7, 2021, accepted October 13, 2021, date of publication October 21, 2021, date of current version October 29, 2021.
Digital Object Identifier 10.1109/ACCESS.2021.3121669
Use of Receiver Operating Characteristic Curve toEvaluate a Street Lighting Control SystemJOSE-LUIS POZA-LUJAN 1, (Member, IEEE),JUAN-JOSÉ SÁENZ-PEÑAFIEL 2, JUAN-LUIS POSADAS-YAGÜE 1, J. ALBERTO CONEJERO 3,AND JUAN-CARLOS CANO 4, (Senior Member, IEEE)1Institute of Control Systems and Industrial Computing (ai2), Universitat Politècnica de València (UPV), 46022 Valencia, Spain2Dirección de Investigación, Universidad de Cuenca, Cuenca 010107, Ecuador3Instituto Universitario de Matemática Pura y Aplicada, Universitat Politècnica de València (UPV), 46022 València, Spain4Grupo de Redes de Computadores, Universitat Politècnica de València (UPV), 46022 València, Spain
Corresponding author: Jose-Luis Poza-Lujan ([email protected])
This work was supported in part by the Spanish Science and Innovation Ministry (MICINN): Interministerial Commission on Science andTechnology (CICYT) project Predictable and dependable computer systems for Industry 4.0 (PRECON-I4) with codeTIN2017-86520-C3-1-R.
ABSTRACT Intelligent control of public lighting is nowadays one of the most challenging issues insmart city deployment. Lighting optimization entails a compromise between comfort, safety, and powerconsumption, affecting both vehicles and pedestrians. Smart solutions must estimate their characteristics totrade-off users’ needs and energy requirements. This paper proposes an intelligent street lighting controlsystem and the Receiver Operating Characteristic (ROC) curve method to evaluate the best number of streetlamps to achieve a balance between public road user comfort and system power consumption. The controlsystem is based on the detection of users, mainly pedestrians, using presence sensors. From the detection ofa pedestrian by two or more consecutive street lamps it is possible to determine their speed. Knowing thepedestrian speed, allows the system to anticipate and adjust the light intensity of the remaining street lamps,and provide a comfortable view of the street. Using the ROC curve, we evaluate the control algorithm interms of the number of previous street lamps used. We have tested the system and the method in a modelof pedestrians walking down a street. The obtained results show that ROC analysis used to control streetlighting allows measuring the whole control system’s efficiency by providing a concrete number of previousstreet lamps.
INDEX TERMS Distributed computing, distributed control, networked control systems, sensor systems andapplications, intelligent systems, lighting control, ROC curve, smart cities.
I. INTRODUCTIONThe Sustainable Development Goals (SDGs) are consideredpart of the basis of the research in Smart Cities [1]. Thechallenge of smart cities is in continuous review and transfor-mation [2] since it has to consider different actors, initiatives,goals, and applications [3]. However, most authors agreethat technology must be ubiquitously integrated into the cityenvironment to improve citizens’ quality of life and simul-taneously progressing towards achieving the SDGs. Its usecovers broad technology fields: from the use of informationrelated to Big Data systems [4], to the use of technologyembedded in the everyday objects [5]. The extension of the
The associate editor coordinating the review of this manuscript andapproving it for publication was Yilun Shang.
technology gives rise to different challenges from the man-agement of routine aspects, such as intelligent traffic [6],energy management [7], and roads management [8]; to othersthat may involve risks, such as cybersecurity [9]. Smart citiesinclude a large number of potential smart sensors such astemperature detectors, ambient sound levels, air quality, andtraffic density.With this information, lots of elements interactwith the environment to improve the livability of cities. Bothcity elements and citizens can be considered from an atomicpoint of view as elements of a system because they share thesame environment and interact with them.
Public space lighting, mainly in the streets, is one of the toppower consumption sources in any city. Energy managementbased on worst-case scenarios does not control energy con-sumption. For instance, in a public road shared by pedestrians
144660 This work is licensed under a Creative Commons Attribution 4.0 License. For more information, see https://creativecommons.org/licenses/by/4.0/ VOLUME 9, 2021

J.-L. Poza-Lujan et al.: Use of ROC Curve to Evaluate Street Lighting Control System
and bicycles uses a control policy based on the worst-case(bikes), more energy will be spent without improving usercomfort. Smart cities can be endowed with intelligent controlsystems of light management that would permit to reducepower consumption without reducing users’ comfort [10].These control services are based on the analysis of dataprovided by sensors and its subsequent processing to considerusers’ needs and power consumption [11]. As a solution,we can conceive a smart street lighting system as a distributedsystem with several devices to be controlled, such as thelighting of every lamp in a street or a set of traffic lights in aroundabout.
There are many ways to control these distributed systems,from centralized control, through a cluster-based control,to each system device’s autonomous control. The controlaction evaluation of a distributed system is a complex task.Control actions that are effective for a single element mightnot be efficient from an overall perspective or vice versa.For example, a traffic light can prioritize vehicles’ crossingto clear a street, but this action will cause a traffic jam inthe following streets. Another point to be addressed is ifsharing valuable information between system componentscould increase overall control action performance. So, oneof the aspects to decide is the scope of the information forcontrol management. For example, if the data provided bya brightness sensor from a street lamp could be practiced tocontrol a neighboring street lamp’s lamp lighting or on theother side of the city.
Measure the control action’s efficiency on a single compo-nent is simple.We only need to consider sensors and actuatorsinvolved in the same control loop. In this case, the scope ofthe information is limited to its component. Depending onthe system, the scope of the information may be different.For example, in an urban environment, the information cor-responding to vehicles’ detection by a streetlight can be usedin the next streetlight to optimize lighting. This informationcan also be used at a traffic light at the end of the street tooptimize traffic. Based on these premises, measure the wholesystem efficiency is one of the main points to be addressed ina distributed intelligent control system.
The starting point to measure is the extraction of systemoptimization indicators to evaluate how optimal the controlpolicy is applied in the complete system. This step involvessensors that can gather physical parameters and the additionaldifficulty of determining citizens’ needs in each particularcontext. Intelligent control systems use sensory informationto determine the optimal action to do. In a street lightingsystem, optimal action provides a more comfortable envi-ronment with less power consumption. We have to detectthe service offered to street or road users and the powerconsumption to know if the control action is optimal. Powerconsumption is easy tomeasure in each device because only itis necessary to add the corresponding electronics. However,measuring the service offered is complicated because users
have different requirements due to aspects because of thespeed of movement or their lighting, as bikes have.
There are many ways to measure the optimal action ina control system. Simple control loops based on periodicsampling, with one input and one output, are usually eval-uated through the error between the action provided, out-put value, and the action expected or reference value [12].In smart cities, due to the uncertainly of the users’ behavior,and the multiple inputs and outputs to manage, the event-based control is a convenient approach instead of the periodicsampling control approach. When the control is event-basedand distributed, measure the optimal action is difficult due tothe result depends on the multiple outputs [13]. For example,to diagnose lighting needs on the street, it is necessary toknow the light intensity at different points, the street users’needs at these points, and how they expect to evolve as timegoes by.
In this paper, we propose the use of the Receiver OperatingCharacteristics (ROC) curves [14] to evaluate the perfor-mance of control methods applied to develop a distributedsmart street lighting system. A ROC curve is a statisticalmethod used to illustrate the diagnostic ability of a binaryclassifier. Based on this premise, we are interested in howROC curves can be used to evaluate how optimal the controlis applied in a smart street lighting system. ROC curves willallow us to evaluate different protocols for controlling thelight intensity of luminaries.
The main contribution of the article is a technique ofevaluating the efficiency of a distributed intelligent dynamiccontrol system. The technique uses the parameters of theROC curves, considering the control action calculated as adiagnostic of the user’s needs. In this way, it is possibleto minimize the amount of information or data required,in the proposed case defined by the number of streetlightsneeded to provide enough information to save energy with-out decrease the user’s comfort. The techniques to controldynamically street lighting are nowadays a hot topic whoseimpact is especially relevant in the economic and ecologicalrealm [15].
The rest of this paper is organized as follows: Section IIpresents further details of smart cities’ environments and howthey can be smartly controlled. Citizens’ needs and move-ments are analyzed, emphasizing how they influence streetusers’ comfort. We also discuss streets and light source (LS)characteristics and considerations for the lighting control pro-posed in this paper. In the III section, we briefly discuss ROCcurves and evaluate the control of the components presentedin the previous section using the ROC curves. In the IVsection, we describe the evaluation of different control strate-gies. We also analyze the impact on the efficiency of thesystem when different source lights communicate betweenthem. Finally, in the Conclusions and Future Work section,we report the main findings and future challenges to beaddressed.
VOLUME 9, 2021 144661
J.-L. Poza-Lujan et al.: Use of ROC Curve to Evaluate Street Lighting Control System
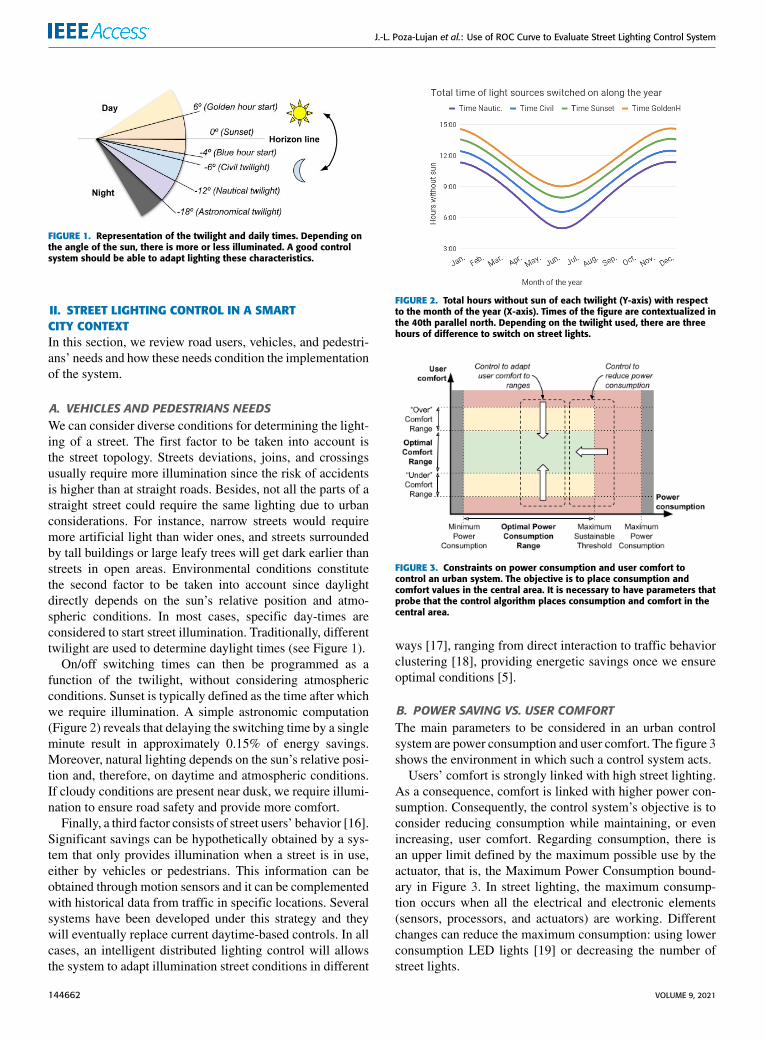
FIGURE 1. Representation of the twilight and daily times. Depending onthe angle of the sun, there is more or less illuminated. A good controlsystem should be able to adapt lighting these characteristics.
II. STREET LIGHTING CONTROL IN A SMARTCITY CONTEXTIn this section, we review road users, vehicles, and pedestri-ans’ needs and how these needs condition the implementationof the system.
A. VEHICLES AND PEDESTRIANS NEEDSWe can consider diverse conditions for determining the light-ing of a street. The first factor to be taken into account isthe street topology. Streets deviations, joins, and crossingsusually require more illumination since the risk of accidentsis higher than at straight roads. Besides, not all the parts of astraight street could require the same lighting due to urbanconsiderations. For instance, narrow streets would requiremore artificial light than wider ones, and streets surroundedby tall buildings or large leafy trees will get dark earlier thanstreets in open areas. Environmental conditions constitutethe second factor to be taken into account since daylightdirectly depends on the sun’s relative position and atmo-spheric conditions. In most cases, specific day-times areconsidered to start street illumination. Traditionally, differenttwilight are used to determine daylight times (see Figure 1).
On/off switching times can then be programmed as afunction of the twilight, without considering atmosphericconditions. Sunset is typically defined as the time after whichwe require illumination. A simple astronomic computation(Figure 2) reveals that delaying the switching time by a singleminute result in approximately 0.15% of energy savings.Moreover, natural lighting depends on the sun’s relative posi-tion and, therefore, on daytime and atmospheric conditions.If cloudy conditions are present near dusk, we require illumi-nation to ensure road safety and provide more comfort.
Finally, a third factor consists of street users’ behavior [16].Significant savings can be hypothetically obtained by a sys-tem that only provides illumination when a street is in use,either by vehicles or pedestrians. This information can beobtained through motion sensors and it can be complementedwith historical data from traffic in specific locations. Severalsystems have been developed under this strategy and theywill eventually replace current daytime-based controls. In allcases, an intelligent distributed lighting control will allowsthe system to adapt illumination street conditions in different
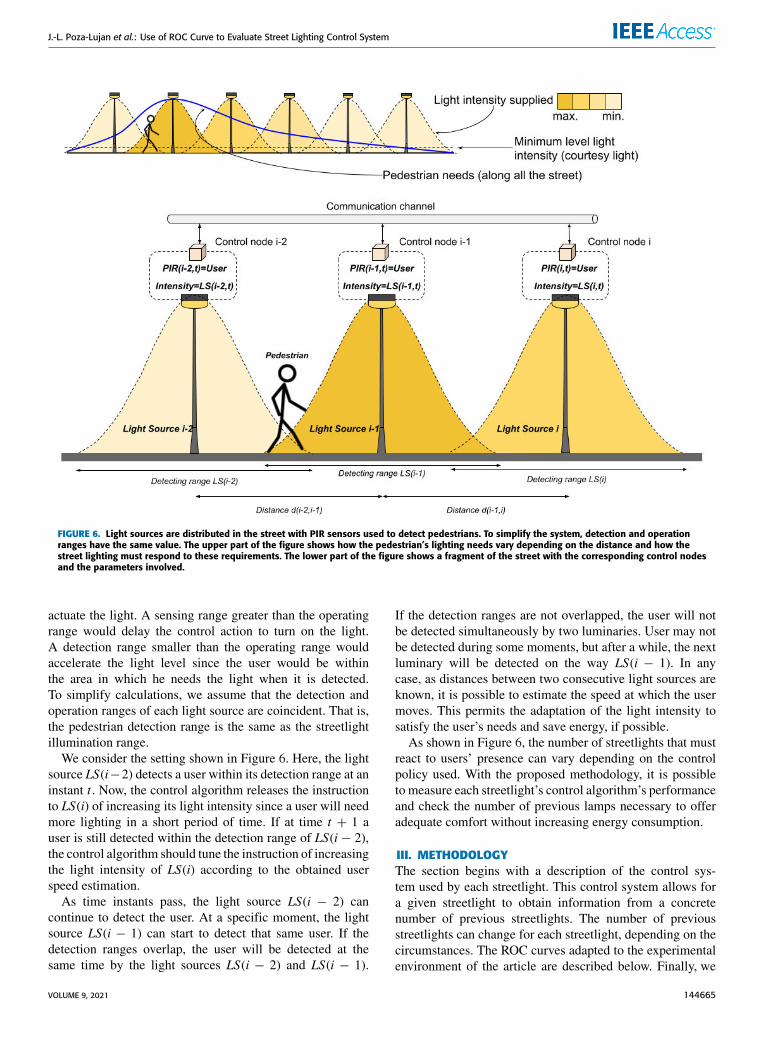
FIGURE 2. Total hours without sun of each twilight (Y-axis) with respectto the month of the year (X-axis). Times of the figure are contextualized inthe 40th parallel north. Depending on the twilight used, there are threehours of difference to switch on street lights.
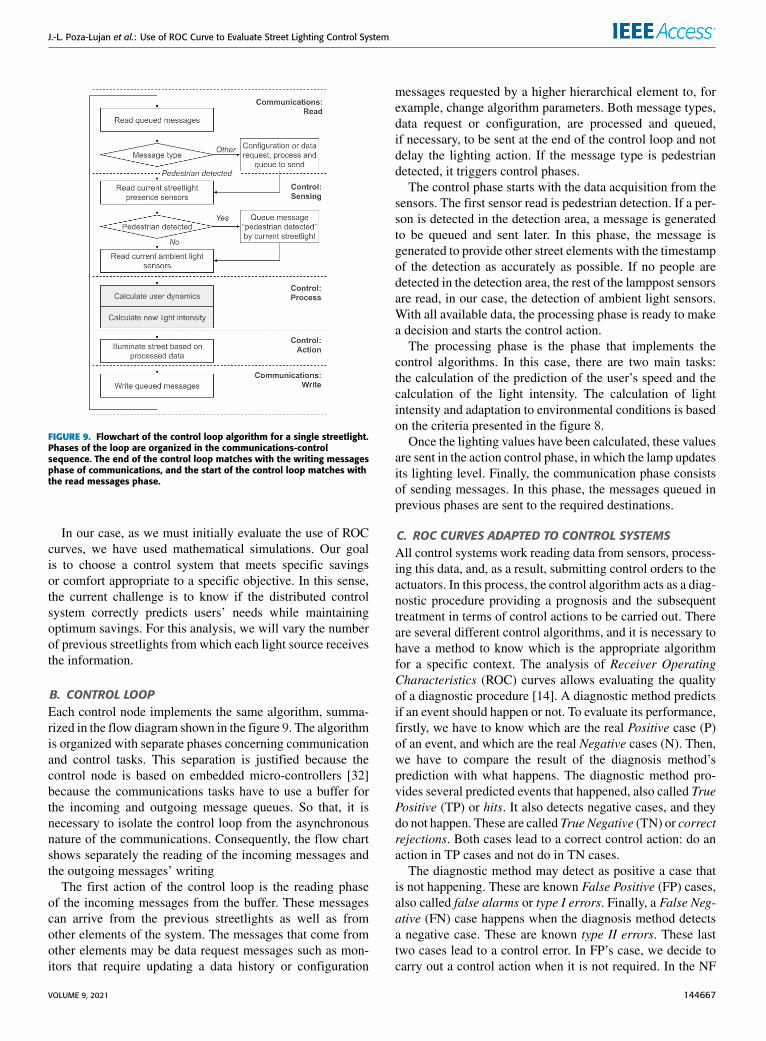
FIGURE 3. Constraints on power consumption and user comfort tocontrol an urban system. The objective is to place consumption andcomfort values in the central area. It is necessary to have parameters thatprobe that the control algorithm places consumption and comfort in thecentral area.
ways [17], ranging from direct interaction to traffic behaviorclustering [18], providing energetic savings once we ensureoptimal conditions [5].
B. POWER SAVING VS. USER COMFORTThe main parameters to be considered in an urban controlsystem are power consumption and user comfort. The figure 3shows the environment in which such a control system acts.
Users’ comfort is strongly linked with high street lighting.As a consequence, comfort is linked with higher power con-sumption. Consequently, the control system’s objective is toconsider reducing consumption while maintaining, or evenincreasing, user comfort. Regarding consumption, there isan upper limit defined by the maximum possible use by theactuator, that is, the Maximum Power Consumption bound-ary in Figure 3. In street lighting, the maximum consump-tion occurs when all the electrical and electronic elements(sensors, processors, and actuators) are working. Differentchanges can reduce the maximum consumption: using lowerconsumption LED lights [19] or decreasing the number ofstreet lights.
144662 VOLUME 9, 2021

J.-L. Poza-Lujan et al.: Use of ROC Curve to Evaluate Street Lighting Control System
When the maximum consumption cannot be reduced withhardware modifications, it is still possible to offer light onlywhen users need it and modulate the light intensity withinuser comfort limits. The energy sustainability of a systemimplies that the consumption of the services offered must notexceed the energy resources available [20]. So that, theMaxi-mum Sustainability Threshold is determined by the availableenergy. Authorities define this threshold, and it depends onavailable renewable energy sources. Power generation is themain cause of climate change, so the concept of sustainabilitythreshold goes beyond available energy and is defined asavailable energy that does not generate climate change [21].Despite the recommended reduction in energy consumption,user comfort needs must be achieved.
The user comfort measurement is problematic because itdepends on subjective perception [22]. As shown in Figure 3,the upper and lower thresholds do not have a specific valueand therefore are in a range. In this case, average comfort isthe goal, but it seems more appropriate to focus on an areawithin which most users have an acceptable comfort level.We represent it in Figure 3 and we have called it OptimalComfort Range. Based on previous conditions, the controlsystem’s objective is twofold since it must minimize energyconsumption, but focus on maintaining the Optimal ComfortRange. This subjective aspect implies that personal percep-tion follows a normal distribution [23]. Measuring the errorbetween the provided light and the subjective needs of a useris difficult to do. Consequently, it is necessary to have amethod to verify that a control strategy is adequate accordingto the distribution above.
The problem increases in complexity when several controlelements must provide comfort to a user, as is the case of var-ious streetlights in the street. The overall system’s efficiencymust be measured in terms of the set of components to becontrolled. Consequently, for both individual and collectiveelements, the control strategy is a crucial aspect to achieveoptimization objectives. In the next subsection, we presentdifferent control strategies used in urban lighting systems.
C. CONTROL STRATEGIES IN LIGHTING SYSTEMSThere are many smart street lighting systems managed withdifferent control methods [24]. Usually, the architecture iscentralized since the current electrical-based infrastructureis centralized, too. However, there is a current trend to dis-tribute control actions to adapt the system to specific areas.Consequently, in most cases, the control method is basedon the Distributed Control System (DCS) paradigm and itsimplications on system performance. A DCS can cover froma small number of nodes up to a significant amount. We showdifferent distributed system control paradigms applied to astreet lighting environment in Figure 4.In Option 1, each streetlight controls its operation area.
In other words, the light turns on, and its intensity is regu-lated based on the conditions detected only by its sensors.In Option 2, street lights are considered within a commoncontrol shared space for the users, like a street or a junction.
FIGURE 4. Distributed system control paradigms applied to a streetlighting environment. The point is where the control nodes are locatedand the scope of these nodes’ connections.
This option allows streetlights to share information toincrease control optimization. Option 3 is an extension ofOption 2, where two control areas share information toincrease, if possible, the optimization of their actions. A ded-icated control node can control this last option, or one of thecontrol nodes in the system, assuming an additional load ofthe communication channel and the control processing cost.In Option 4, a set of streetlights is controlled from a singlecontrol node, generally in the same neighborhood, while inOption 5, the entire system, the city, is controlled from asingle node. Options 4 and 5 are centralized and, currently,the most commonly implemented in urban environments.This last option is no longer in use due to the advantages of adistributed control for different clusters.
In this work, we configure the control system based onOption 2 since it is the current trend for control systems.Nevertheless, regardless of the option selected, it is necessaryto characterize both the user’s lighting needs and the lightingprovided. We review this aspect in the next section.
D. CHARACTERIZATION OF ONE STREET LIGHTPOINT VS USER NEEDSAn intelligent control system must consider that each lightsource is an entity with its behavior but conditioned to theenvironment. Because the system focuses on control devices,we have considered naming the elements Light Source (LS)to distinguish it from the urban element Street Light. Figure 5shows theminimumworking environment, which will consistof a light source and a single user.
When carrying out the user’s detection and the correspond-ing street lighting control, there are more constraints thanthe detection and control actions. The light must remain inon state during a suitable time period to transit within thelight source operating range. Besides, since a light source’sintensity can vary, it is possible to optimize the users’ service.
VOLUME 9, 2021 144663

J.-L. Poza-Lujan et al.: Use of ROC Curve to Evaluate Street Lighting Control System
FIGURE 5. Characterization of the user operating range and a single lightsource detection and operating range. Ranges can be modeled as anormal distribution, centered on the user’s next steps and the lightsource, respectively.
In the case of a single light source, the next characteristicswill be used in the control strategy: a range of user detection,a range of environmental condition detection, and an operat-ing range that does not need to coincide.When referring to thedetection range, we implicitly refer to the type of detection.A binary detection provides the simplest one: user presentand user not present. A step forward will be to consider auser’s speed to achieve a more customized light service. Thisservice can also be more accurate if environmental conditionsare also taken into account. With this information, we canalso define each user’s operating range and how it shouldevolve with time. This is relevant because the user, usually,needs more light intensity ahead of the point where he/she islocated. Nevertheless, how much ahead is needed depends onthe factors above and conditions.
The level of Lumens required by the user should be deter-mined at every point. Therefore, the control system has todetect, at least, when the user enters into the zone that isilluminated by the luminary under consideration (see thepedestrian in Figure 5). To detect a user, a presence sensoror a motion detector is enough. Of course, these sensors candetect when a user enters the detection zone, and so adaptingthe light, but using only one of these types of sensors is notpossible to estimate the user speed. To overcome this issue,we can estimate the average user speed, considering howthe sensors of other luminaries located already detected theuser. These calculations are accurate when there is only oneuser on the street, but if more than one user is present, thesesensors cannot correctly distinguish which user it is detectedor the direction in which she moves. To partially overcomethis limitation, we can place barrier sensors that know whena user passes by a certain point. These sensors have the dis-advantage of being installed outside the light source, whichimplies additional costs. We will consider sensors in the samelocation as the light source in the rest of our work.
To know the user speed and, thus, to predict when the lightshould increase at some point, we need at least one distancesensor. It must have enough range to take two measures thatpermit the calculation of the user speed. Besides, it should beplaced at a location that would permit the system to react byincreasing the luminaries’ light intensity under consideration.
From the state-of-art technology, the current low-cost ultra-sound technology does not allow detecting objects at morethan 5 meters distance, which is an insufficient detectionrange in the context of this problem since only people walk-ing at moderate speeds of 3 or less m/s would be detected.Some ultrasound sensors permit to deal with long distances,but the price is high to provide one sensor per street light.The infrared laser technology itself allows objects to bedetected at distances higher than 100 meters. However, thistechnology is costly and can even be harmful in the case ofnear-infrared. Finally, in some systems, video cameras allowdetecting movements and speeds through image analysis.These devices have the advantage of being able to detectseveral users simultaneously, calculating speeds and sense ofmovement, see for instance [25]–[27]. In addition to thoseconcerning personal protection laws, the cameras’ problemwould require the support of infrared bulbs. So, we havediscarded such technology for the design of the system.
E. EXTENDING STREET LIGHT AND USER NEEDSTO ONE STREETWhen we consider several streetlights the amount of infor-mation, that has to be considered to design an intelligentdistributed system, increases according to the system’s com-plexity. Currently, city’s streetlights are usually clustered intozones, and it can be understood as a centralized or clustereddistributed control system. In these types of systems, anysingle streetlight cannot make its own decisions. However,we suppose each light source could regulate its light inten-sity to the environmental and usage conditions. In that case,the system could be optimized for power consumption anduser safety (providing suitable light brightness). When a largenumber of light sources are available, each one of the lumi-nary’s sensors can be used to get extra information or improvethe existing one [28].
In the case of a street, we expect that a user can traverse itwith a suitable amount of light intensity along the way. Here,the system can consider just information from streetlightsunder consideration and other light sources. Let us list thelight sources by LS(i), with 1 ≤ i ≤ M . If LS(i) has infor-mation about forthcoming users before their sensors detectsuch presence, it can better adapt the light intensity provided.We show a basic example in Figure 6, where we illustrate thebasic context of a street where each light source has a passiveinfrared sensor (PIR). Each PIR has an electronic sensor thatmeasures infrared (IR) light radiating from objects. Such sen-sors are frequently used to detect motions or object movementwithin its detection range.
The difference in size between the sensing range andthe operating range affects only the instant the control will
144664 VOLUME 9, 2021
J.-L. Poza-Lujan et al.: Use of ROC Curve to Evaluate Street Lighting Control System
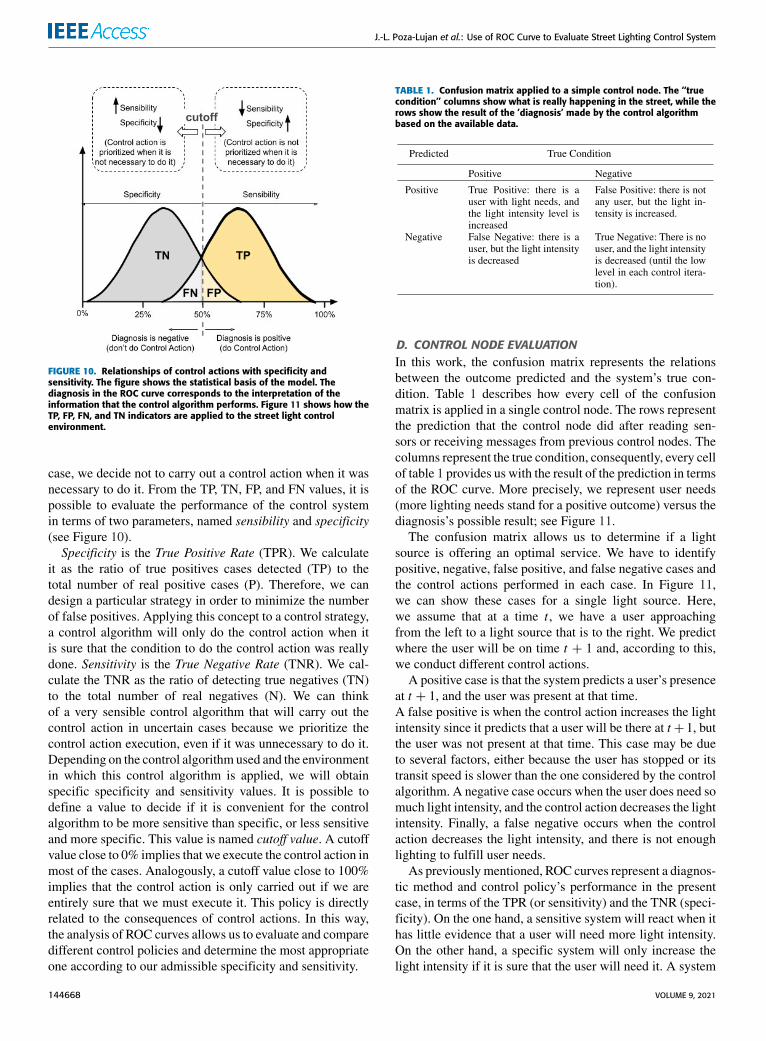
FIGURE 6. Light sources are distributed in the street with PIR sensors used to detect pedestrians. To simplify the system, detection and operationranges have the same value. The upper part of the figure shows how the pedestrian’s lighting needs vary depending on the distance and how thestreet lighting must respond to these requirements. The lower part of the figure shows a fragment of the street with the corresponding control nodesand the parameters involved.
actuate the light. A sensing range greater than the operatingrange would delay the control action to turn on the light.A detection range smaller than the operating range wouldaccelerate the light level since the user would be withinthe area in which he needs the light when it is detected.To simplify calculations, we assume that the detection andoperation ranges of each light source are coincident. That is,the pedestrian detection range is the same as the streetlightillumination range.
We consider the setting shown in Figure 6. Here, the lightsource LS(i−2) detects a user within its detection range at aninstant t . Now, the control algorithm releases the instructionto LS(i) of increasing its light intensity since a user will needmore lighting in a short period of time. If at time t + 1 auser is still detected within the detection range of LS(i − 2),the control algorithm should tune the instruction of increasingthe light intensity of LS(i) according to the obtained userspeed estimation.
As time instants pass, the light source LS(i − 2) cancontinue to detect the user. At a specific moment, the lightsource LS(i − 1) can start to detect that same user. If thedetection ranges overlap, the user will be detected at thesame time by the light sources LS(i − 2) and LS(i − 1).
If the detection ranges are not overlapped, the user will notbe detected simultaneously by two luminaries. User may notbe detected during some moments, but after a while, the nextluminary will be detected on the way LS(i − 1). In anycase, as distances between two consecutive light sources areknown, it is possible to estimate the speed at which the usermoves. This permits the adaptation of the light intensity tosatisfy the user’s needs and save energy, if possible.
As shown in Figure 6, the number of streetlights that mustreact to users’ presence can vary depending on the controlpolicy used. With the proposed methodology, it is possibleto measure each streetlight’s control algorithm’s performanceand check the number of previous lamps necessary to offeradequate comfort without increasing energy consumption.
III. METHODOLOGYThe section begins with a description of the control sys-tem used by each streetlight. This control system allows fora given streetlight to obtain information from a concretenumber of previous streetlights. The number of previousstreetlights can change for each streetlight, depending on thecircumstances. The ROC curves adapted to the experimentalenvironment of the article are described below. Finally, we
VOLUME 9, 2021 144665

J.-L. Poza-Lujan et al.: Use of ROC Curve to Evaluate Street Lighting Control System
FIGURE 7. Control node block diagram. We obtain inputs from externalsensors (PIR signal from neighboring LS), internal sensors (PIR sensors),or configuration parameters (i.e., LS distance). Learning control algorithmscan also use data history. The outputs will be the control action (LSIntensity) and the signals to other LS interested in the current LS data.
explain the confusion matrix’s use to check the control algo-rithm’s prediction’s correctness.
A. CHARACTERIZATION OF THE STREETLIGHT CONTROLTo design the control system, we start from the basic casewhen the pedestrian traffic happens on one-way. It is possibleto extend the control model to several pedestrians travelingin one direction or to several pedestrians traveling in twodirections. In these cases, each control element must considerseveral sources and decide to act according to the closestlamppost. We selected one pedestrian and one-way modebecause our interest is to check how the ROC curves allowus to select the optimal number of information sources.
We can consider a spatial window of N preceding lightsources or a time window of J velocity measurements forthe control strategy. In any case, to implement the controlstrategies, it is necessary to have a control node at each lightsource in our proposal. Each of them must have internalinputs, outputs, and internal data. An example is illustratedin Figure 7.
Basically, the control node of the light source LS(i) hasinternal inputs at time t and the outcome of the motion sensorPIR(i). If allowed, it can also have N additional externalinputs of the PIR sensors of the N preceding light sourcesat the corresponding instant t when the PIR detection eventis produced. As outputs, we have the light intensity and thePIR sensors outcome of other light sources. As internal data,we can consider the distances of the near light sources fromwhich we obtain the information provided by their sensorsPIR(i− l), with l = 1, . . . , i− 1.The control node has to develop a policy to determine the
control action on the light intensity regulation based on theuser speed estimation. The use of information from otherlight sources can improve the results; see Figure 8, wherethe control action (modulation of the light intensity in themaximum intensity percentage) also considers informationfrom previous light sources whose data is already known.
FIGURE 8. Control policies (actions to regulate light intensity) based onthe information of previous LS. (a) Example of intensity dynamics of justthe single LS. Here, the space window is of length 0 since we do notconsider any information from the previous LS. (b) Intensity dynamics ofan LS, with a space window of length 1 and (c) of length 2.
Information from previous light sources provides advan-tages to optimize control. With the distance between LS(i)and LS(i − 1), it is possible to know the user’s speed sincethe user’s instant is detected. With two previous light sources,it is possible to know the acceleration and make a betterprediction since a user may change their speed going fasteror slower. A consideration is that for each light source thatsends a message to another, one implies one extra message tobe processed in each control network node.
Therefore, we will evaluate the number of previous lightsources we need to offer adequate lighting without unnec-essarily increasing the communications load and the controlload through the sensitivity and specificity parameters. Con-sequently, we will determine the optimal number of previouslight sources that allow a more efficient light adaptation.
Figure 8(a) shows the control action on a single lightsource’s light intensity using only its own information andusing average human speed. We refer to [29] for furtherinformation on human dynamics and crowd science. In thiscase, light intensity suddenly changes when it notices the userpresence. In this case, user comfort is very limited since itonly considers a few meters ahead.
Figure 8(b) corresponds to the control in which the pre-vious node can provide information regarding if a user ispresent or not. In this case, the light intensity can increaseprogressively, and the user will have a better feeling of streetlighting than in case (a).
Finally, in Figure 8(c) we refer to a control based on theusers’ detection information from previous nodes. With thisinformation, we can implement a smoother light intensitycontrol that will increase users’ comfort. We consider a per-formance analysis to determine which policy provides thebest trade between energy consumption and comfort. Tomea-sure the performance of a control policy, we can simulate thecontrol algorithm from the sensory level [30] to the level ofsimulated behavior of intelligent agents [31].
144666 VOLUME 9, 2021
J.-L. Poza-Lujan et al.: Use of ROC Curve to Evaluate Street Lighting Control System
FIGURE 9. Flowchart of the control loop algorithm for a single streetlight.Phases of the loop are organized in the communications-controlsequence. The end of the control loop matches with the writing messagesphase of communications, and the start of the control loop matches withthe read messages phase.
In our case, as we must initially evaluate the use of ROCcurves, we have used mathematical simulations. Our goalis to choose a control system that meets specific savingsor comfort appropriate to a specific objective. In this sense,the current challenge is to know if the distributed controlsystem correctly predicts users’ needs while maintainingoptimum savings. For this analysis, we will vary the numberof previous streetlights from which each light source receivesthe information.
B. CONTROL LOOPEach control node implements the same algorithm, summa-rized in the flow diagram shown in the figure 9. The algorithmis organized with separate phases concerning communicationand control tasks. This separation is justified because thecontrol node is based on embedded micro-controllers [32]because the communications tasks have to use a buffer forthe incoming and outgoing message queues. So that, it isnecessary to isolate the control loop from the asynchronousnature of the communications. Consequently, the flow chartshows separately the reading of the incoming messages andthe outgoing messages’ writing
The first action of the control loop is the reading phaseof the incoming messages from the buffer. These messagescan arrive from the previous streetlights as well as fromother elements of the system. The messages that come fromother elements may be data request messages such as mon-itors that require updating a data history or configuration
messages requested by a higher hierarchical element to, forexample, change algorithm parameters. Both message types,data request or configuration, are processed and queued,if necessary, to be sent at the end of the control loop and notdelay the lighting action. If the message type is pedestriandetected, it triggers control phases.
The control phase starts with the data acquisition from thesensors. The first sensor read is pedestrian detection. If a per-son is detected in the detection area, a message is generatedto be queued and sent later. In this phase, the message isgenerated to provide other street elements with the timestampof the detection as accurately as possible. If no people aredetected in the detection area, the rest of the lamppost sensorsare read, in our case, the detection of ambient light sensors.With all available data, the processing phase is ready to makea decision and starts the control action.
The processing phase is the phase that implements thecontrol algorithms. In this case, there are two main tasks:the calculation of the prediction of the user’s speed and thecalculation of the light intensity. The calculation of lightintensity and adaptation to environmental conditions is basedon the criteria presented in the figure 8.
Once the lighting values have been calculated, these valuesare sent in the action control phase, in which the lamp updatesits lighting level. Finally, the communication phase consistsof sending messages. In this phase, the messages queued inprevious phases are sent to the required destinations.
C. ROC CURVES ADAPTED TO CONTROL SYSTEMSAll control systems work reading data from sensors, process-ing this data, and, as a result, submitting control orders to theactuators. In this process, the control algorithm acts as a diag-nostic procedure providing a prognosis and the subsequenttreatment in terms of control actions to be carried out. Thereare several different control algorithms, and it is necessary tohave a method to know which is the appropriate algorithmfor a specific context. The analysis of Receiver OperatingCharacteristics (ROC) curves allows evaluating the qualityof a diagnostic procedure [14]. A diagnostic method predictsif an event should happen or not. To evaluate its performance,firstly, we have to know which are the real Positive case (P)of an event, and which are the real Negative cases (N). Then,we have to compare the result of the diagnosis method’sprediction with what happens. The diagnostic method pro-vides several predicted events that happened, also called TruePositive (TP) or hits. It also detects negative cases, and theydo not happen. These are called True Negative (TN) or correctrejections. Both cases lead to a correct control action: do anaction in TP cases and not do in TN cases.
The diagnostic method may detect as positive a case thatis not happening. These are known False Positive (FP) cases,also called false alarms or type I errors. Finally, a False Neg-ative (FN) case happens when the diagnosis method detectsa negative case. These are known type II errors. These lasttwo cases lead to a control error. In FP’s case, we decide tocarry out a control action when it is not required. In the NF
VOLUME 9, 2021 144667
J.-L. Poza-Lujan et al.: Use of ROC Curve to Evaluate Street Lighting Control System
FIGURE 10. Relationships of control actions with specificity andsensitivity. The figure shows the statistical basis of the model. Thediagnosis in the ROC curve corresponds to the interpretation of theinformation that the control algorithm performs. Figure 11 shows how theTP, FP, FN, and TN indicators are applied to the street light controlenvironment.
case, we decide not to carry out a control action when it wasnecessary to do it. From the TP, TN, FP, and FN values, it ispossible to evaluate the performance of the control systemin terms of two parameters, named sensibility and specificity(see Figure 10).Specificity is the True Positive Rate (TPR). We calculate
it as the ratio of true positives cases detected (TP) to thetotal number of real positive cases (P). Therefore, we candesign a particular strategy in order to minimize the numberof false positives. Applying this concept to a control strategy,a control algorithm will only do the control action when itis sure that the condition to do the control action was reallydone. Sensitivity is the True Negative Rate (TNR). We cal-culate the TNR as the ratio of detecting true negatives (TN)to the total number of real negatives (N). We can thinkof a very sensible control algorithm that will carry out thecontrol action in uncertain cases because we prioritize thecontrol action execution, even if it was unnecessary to do it.Depending on the control algorithm used and the environmentin which this control algorithm is applied, we will obtainspecific specificity and sensitivity values. It is possible todefine a value to decide if it is convenient for the controlalgorithm to be more sensitive than specific, or less sensitiveand more specific. This value is named cutoff value. A cutoffvalue close to 0% implies that we execute the control action inmost of the cases. Analogously, a cutoff value close to 100%implies that the control action is only carried out if we areentirely sure that we must execute it. This policy is directlyrelated to the consequences of control actions. In this way,the analysis of ROC curves allows us to evaluate and comparedifferent control policies and determine the most appropriateone according to our admissible specificity and sensitivity.
TABLE 1. Confusion matrix applied to a simple control node. The ‘‘truecondition’’ columns show what is really happening in the street, while therows show the result of the ’diagnosis’ made by the control algorithmbased on the available data.
D. CONTROL NODE EVALUATIONIn this work, the confusion matrix represents the relationsbetween the outcome predicted and the system’s true con-dition. Table 1 describes how every cell of the confusionmatrix is applied in a single control node. The rows representthe prediction that the control node did after reading sen-sors or receiving messages from previous control nodes. Thecolumns represent the true condition, consequently, every cellof table 1 provides us with the result of the prediction in termsof the ROC curve. More precisely, we represent user needs(more lighting needs stand for a positive outcome) versus thediagnosis’s possible result; see Figure 11.
The confusion matrix allows us to determine if a lightsource is offering an optimal service. We have to identifypositive, negative, false positive, and false negative cases andthe control actions performed in each case. In Figure 11,we can show these cases for a single light source. Here,we assume that at a time t , we have a user approachingfrom the left to a light source that is to the right. We predictwhere the user will be on time t + 1 and, according to this,we conduct different control actions.
A positive case is that the system predicts a user’s presenceat t + 1, and the user was present at that time.A false positive is when the control action increases the lightintensity since it predicts that a user will be there at t + 1, butthe user was not present at that time. This case may be dueto several factors, either because the user has stopped or itstransit speed is slower than the one considered by the controlalgorithm. A negative case occurs when the user does need somuch light intensity, and the control action decreases the lightintensity. Finally, a false negative occurs when the controlaction decreases the light intensity, and there is not enoughlighting to fulfill user needs.
As previously mentioned, ROC curves represent a diagnos-tic method and control policy’s performance in the presentcase, in terms of the TPR (or sensitivity) and the TNR (speci-ficity). On the one hand, a sensitive system will react when ithas little evidence that a user will need more light intensity.On the other hand, a specific system will only increase thelight intensity if it is sure that the user will need it. A system
144668 VOLUME 9, 2021

J.-L. Poza-Lujan et al.: Use of ROC Curve to Evaluate Street Lighting Control System
FIGURE 11. Interpretation of the control action in terms of the confusionmatrix. The control action is carried out at time t + 1 from the dataavailable at time t.
with low sensitivity and high specificity will save prettymuch energy. However, it may not satisfy users’ light needs.A high sensitive, and low specific, system may increaseenergy consumptionmore thanwhat was needed to fulfill userlight needs. In essence, an optimal control system would bethe one with 100% sensitivity (no false positives) and 100%specificity (no false negatives).
IV. EXPERIMENTAL RESULTSA. SIMULATION ALGORITHMThe simulation carried out is based on the algorithm 1,programmed in Python [33]. The algorithm showed a sin-gle pedestrian’s case, although the algorithm can be calledthe number of times necessary depending on the numberof pedestrians to simulate. Subsequently, it is necessary tocreate the necessary arrays to perform the calculations ofconsumption, comfort, and the ROC analysis parameters (TP,FP, FN, and TN). For each pedestrian, a specific speed iscalculated within the normal distribution margins based on astandard pedestrian’s average speed. Once the data has beeninitialized, the simulation loop is executed. The simulationloop runs as long as the pedestrian’s position is within thestreet length.
For each simulation step, the updatePedNeeds() functioncalculates the pedestrian needs, along the street conditionedon their position on the street. The values of the pedestrian’lighting needs are calculated for each of the perpendicu-lar points of the streetlights and are stored in the vectorpedNeeds. The function to obtain the needs is shown in the
Algorithm 1 Simulation Algorithm to Calculate the Effi-ciency of the Different Control Systems
/* Simulation variables */1 const integer numLS = 10;2 array real pedNeeds[numLS];3 real pedComf = 0;4 array real lightSupplied[numLS];5 real powCons=0;6 array real currentDif[numLS];7 real deltaROC = 1.0;8 array real rocValues[T][4];9 integer t=0;10 real pedSpeed = calcPSpeed(1.14,0.305);/* Simulation loop */
11 while pedPos < streetLenght do12 pedNeeds = updatePedNeeds(pedPos,pedSpeed);13 for LS = 0 to numLS do14 if pedestrianDetected(LS) then15 lightSupplied = controlStreetLights(LS);16 break;17 end18 end
/* Results update */19 powCons = updatePowerCons(lightSupplied);20 currentDif = pedNeeds - lightSupplied;21 pedComf = UpdatePedComf(currentDif);22 rocValues = updateROC(currentDif,deltaROC);
/* Next simulation step */23 t=t+1;24 pedPos = updatePedestrianPos(t,pedPos,pedSpeed);25 end
equation 1. This equation is modeled as a descent linearfunction from a maximum need at the point of the pedestrianposition and with a horizon of 0 Lux in the point dMax.
pedNeed(d) = MaxNeed(d
dMax+ 1) (1)
The variable MaxNeed is obtained from the random func-tion that provides a value within the range PedNeedAVG ±PedNeedSTD in order to simulate different pedestrian needs.The variable dMax changes depending on the concrete speedof each pedestrian. This speed is obtained from the ran-dom function that provides a value within the range definedby PedSpeedAVG ± PedSpeedSTD in order to simulate dif-ferent pedestrian needs depending on the pedestrian speed.Subsequently, all the streetlights are evaluated to checkwhich of them detects the pedestrian. The streetlight thatdetects the pedestrian launches the control algorithm and,depending on the algorithm implemented, will cause thechange of the light supplied of every streetlight. The functioncontrolStreetLights() implements the control algorithm foreach streetlight. This means that calculates the different lightintensity that every streetlight must have in the corresponding
VOLUME 9, 2021 144669
J.-L. Poza-Lujan et al.: Use of ROC Curve to Evaluate Street Lighting Control System
simulation iteration. Additionally, the function stores the cor-responding intensity value of each streetlight in the arrayof streetlights (lightSuplied). It is possible to calculate thevalues of power consumption equations, pedestrian comfort,and ROC parameters at this stage. Power consumption is cal-culatedwith the time interval and the sum of the array’s valueslightSuplied . Regarding power consumption, the formula tocalculate is directly obtained by the different light intensitiesprovided each time interval (equation 2). For each of the timeintervals, the street consumption will consume the intensitywith which each street light is lighting the street (equation 3).The constant maxLight is the value of the consumption ofthe maximum Lux provided by a street light. The result isaccumulated in the variable powCom.
powerCons(T ) =∫ T
t=0lightSup(t) dt (2)
lightSup(t) =numLS∑i=1
maxLight ∗ lightSup(i, t) (3)
Comfort is calculated as the accumulated value of thedifference between the needs of the pedestrian and the lightprovided by each of the streetlights; see equation (4).
pedConf (t) =numLS∑i=1
lightSup(i, t)− pedNeed(i, t) (4)
These values are stored in the array currentDif in order tocalculate the weighted comfort average of the correspondingiteration. The value of pedCom is calculated by updating theaverage of the following array values for each simulation step.
Next, the algorithm calculates the ROC parameter, takinginto account the difference between the pedestrian’s lightingneeds and the provided light level, and considering a per-centage margin of goodness δ configured at the beginningof the simulation. Basically, in this step, we calculate thenumber of TP, FP, FN, and TN for each street lamp in theway described in figure 11. Values are stored in the arrayrocValues, a bi-dimensional array with several rows depend-ing on the time simulation steps, and one column to TP,FP, FN, and TN values. This bi-dimensional array offers thevalues to a post calculation of the different cutoff values’sensitivity and specificity.
As a final step, the simulation time is increased in thedefined time interval, and the pedestrian’s position is updated.
B. SIMULATION PARAMETERSWe present the mathematical analysis using the simulation’sdata and analyzed by Apps Script with Google Sheets [34].Concerning the street configuration, we have considered thatall street lights have the same equipment. We consider thata PIR sensor carries out the detection with a detection rangeof 20 meters. We have considered that the light sources canemit a maximum of 400 Lux in the lamp’s perpendicularpoint, which offers an active range of 20 meters. The dis-tance between two consecutive light sources has been fixed
at 20 meters. Consequently, the complete path to simulaterepresents a street about 220 meters.
We have just considered the case of a single pedestrianwalking down the street. A single pedestrian allows checkingif the set of streetlights reacts appropriately, without tak-ing into account the action due to serving several pedes-trians simultaneously. It is not easy to determine a fixedwalking pedestrian speed [35]. To define the pedestrianbehavior, we have considered data speeds from a set ofrandom 30 pedestrians observed at the university campus.They had a speed average of 1.14 m/s and a standard devi-ation of 0.305 m/s; these values are considered to simu-late the pedestrians. In the analysis presented, we generated100 pedestrians with a random speed between the minimumvalue of 0.835m/s (average - standard deviation) and themaximum value of 1.445 (average + standard deviation),considering a normal distribution of pedestrians. In order toensure that only one pedestrian is walking down the street,the time between two consecutive pedestrians has been set upin 250 seconds.
The pedestrians’ needs depend mainly on the correspond-ing pedestrian speed. For each simulated pedestrian, the com-fort condition is calculated based on a maximum valueof 400 Lux in the perpendicular of the next street light. Thisvalue will make it possible to compare whether the street-lights to which the pedestrian approaches have been turned onwith the minimum value on time when the pedestrian arrivesto the street light operating range. From this point, we cal-culate the lighting needs for the pedestrian in the followingstreetlights. The values of these needs, produce a Pedestrianneed’s array that we comparewith the array of light intensitiesproduced by the different streetlights. The difference betweenpedestrians’ lighting needs and light provided by street lightsestablish if the control algorithm result is classified as a TP,TN, FP, or FN.
The first control algorithm to evaluate the performanceof the service offered by a single streetlight. Since we donot consider the previous streetlight information, the controlalgorithm assumes a constant user’s speed. In this case, singlestreetlight, we tested three different pedestrians’ speeds, andwe use the ROC curves to check which speed estimation ismore appropriate in the control algorithm. Next, we evalu-ate how each streetlight’s control algorithm improves, usinginformation from one, two, until nine previous streetlights.
C. TWILIGHT EVALUATIONAs described in Figure 6, there is a minimum of light toprovide. This minimum is called courtesy light and has themain function to show the pedestrian’s complete path. Previ-ous to a detailed analysis, we assessed the relevance of thetwilight to the pedestrian’s needs. The question to answer inthis previous analysis is to know this minimum threshold ofthe light required to cover each twilight’s needs. This willlead us to be able to determine under what conditions thecontrol algorithms can be evaluated. Pedestrian needs havebeen fixed in 400 Lux on the floor in the space of 1 meter in
144670 VOLUME 9, 2021
J.-L. Poza-Lujan et al.: Use of ROC Curve to Evaluate Street Lighting Control System
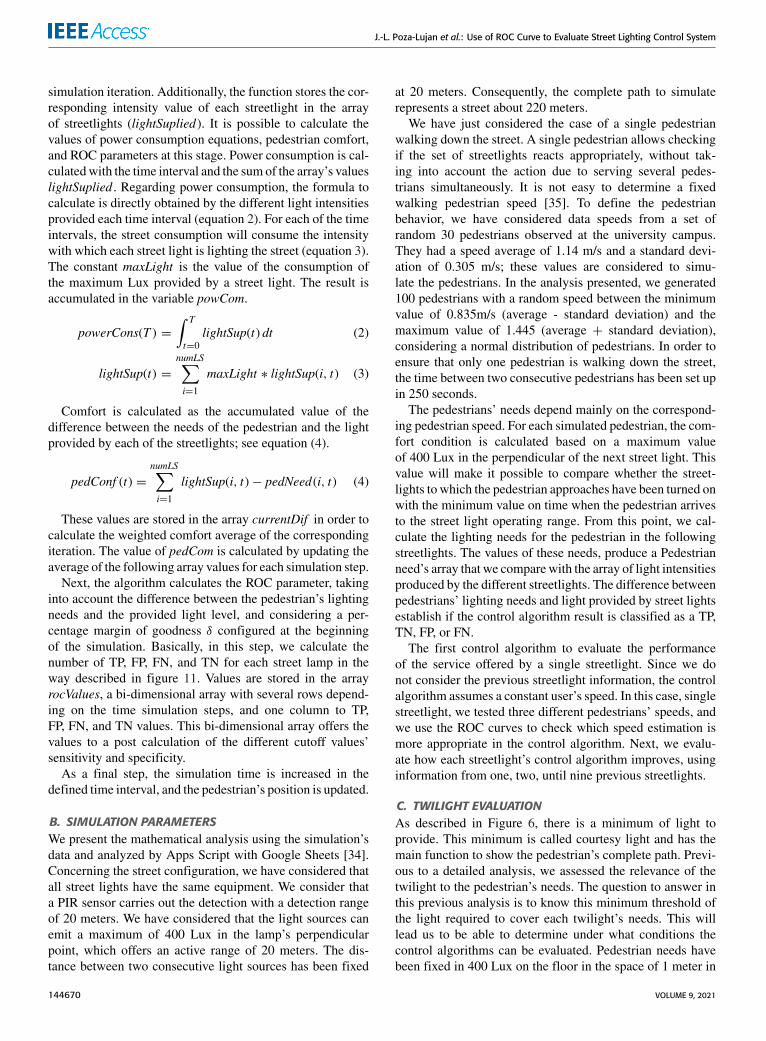
TABLE 2. Results obtained from a single LS model with three differentcontrol policies. Ctrl_MAX expects that pedestrian is coming at a speedwith the standard deviation above average, Ctrl_AVG expects thatpedestrian is coming with the average speed, and Ctrl_MIN expects thatpedestrian is walking the standard deviation lower than the average.Thefigure 12 shows the corresponding ROC curve.
front [36]. The average of the Lux measured by the authorsin the university campus was 320 Lux when the golden hourstarts, 210 Lux in the sunset, and 92 Lux in the civil twilight.Consequently, to simplify, we determine the courtesy light as100 Lux in each street light’s measured on the ground fromevery perpendicular point.
D. SINGLE LIGHT SOURCE CONTROL POLICY EVALUATIONBased on the twilight results, we first consider a single lightsource control during night conditions. The control of theaction is related to the average speed of the pedestrians. Thereis no method to know exactly the real user speed until the userleaves the operating range.We can only estimate it by lookingat the time in which the PIR is active. For the control design,we have considered three predetermined speeds.• Control with minimum speed (Ctrl MIN): we assumethat the user is going slower than the user’s averagespeed. The predicted speed is the historical averagecalculated minus the standard deviation.
• Control with average speed (Ctrl AVG): we assume thatthe user walks at the average speed calculated with thehistorical data.
• Control with a maximum speed (Ctrl MAX): we assumethat the user is going faster than the user’s average speed.The predicted speed is the historical average calculatedplus the standard deviation.
Table 2 shows the results obtained from a single LS nodewith the control policies based on the three previous criteriapresented.
We show the results through ROC curves in Figure 12.We can find the main differences in the center of the graph.The faster that the user goes, the better user service is pro-vided by the control algorithm.
We also notice that with a single light source, we havesharp changes in the specificity values of 40% and 75%(X-axis). These changes indicate that groups of users withsimilar behavior coincide with human behavior models.Some of them go much faster than others.
FIGURE 12. ROC curves of a single source light with three differentcontrol policies. CTRL_MIN and CTRL_MAX policies assume that thepedestrian speed is lower or higher, respectively, by the standarddeviation from the average speed (CTRL_AVG). Sensitivity is representedon the Y-axis and Specificity on the X-Axis.
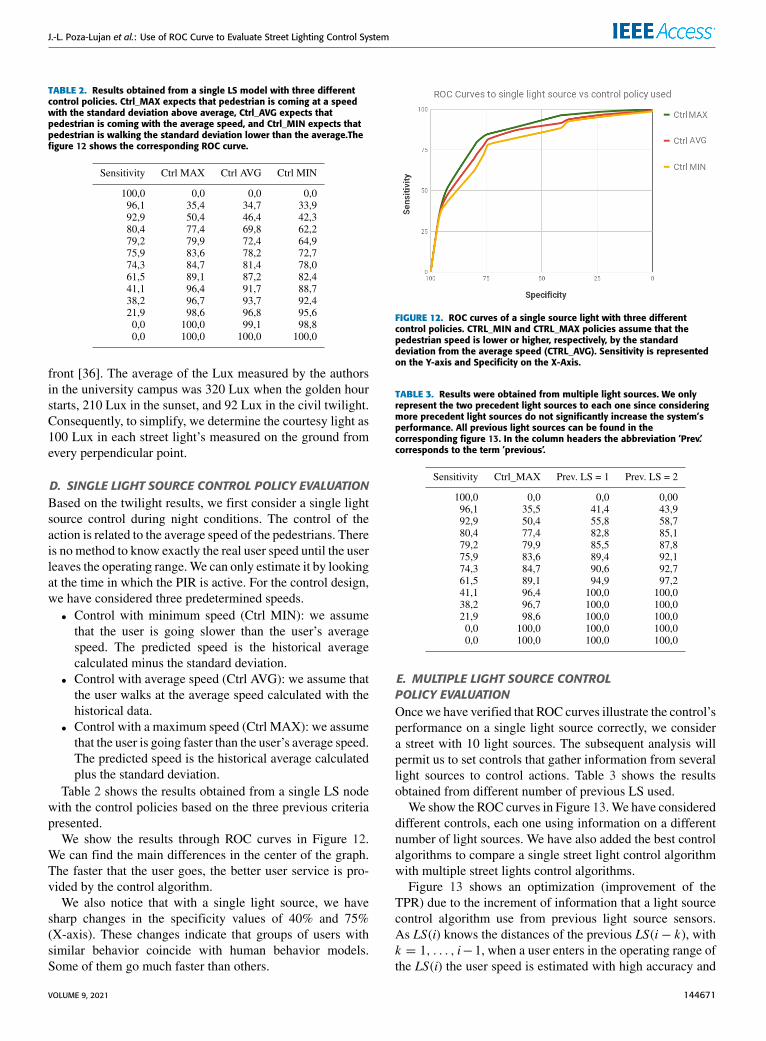
TABLE 3. Results were obtained from multiple light sources. We onlyrepresent the two precedent light sources to each one since consideringmore precedent light sources do not significantly increase the system’sperformance. All previous light sources can be found in thecorresponding figure 13. In the column headers the abbreviation ’Prev.’corresponds to the term ’previous’.
E. MULTIPLE LIGHT SOURCE CONTROLPOLICY EVALUATIONOnce we have verified that ROC curves illustrate the control’sperformance on a single light source correctly, we considera street with 10 light sources. The subsequent analysis willpermit us to set controls that gather information from severallight sources to control actions. Table 3 shows the resultsobtained from different number of previous LS used.
We show the ROC curves in Figure 13.We have considereddifferent controls, each one using information on a differentnumber of light sources. We have also added the best controlalgorithms to compare a single street light control algorithmwith multiple street lights control algorithms.
Figure 13 shows an optimization (improvement of theTPR) due to the increment of information that a light sourcecontrol algorithm use from previous light source sensors.As LS(i) knows the distances of the previous LS(i− k), withk = 1, . . . , i−1, when a user enters in the operating range ofthe LS(i) the user speed is estimated with high accuracy and
VOLUME 9, 2021 144671

J.-L. Poza-Lujan et al.: Use of ROC Curve to Evaluate Street Lighting Control System
FIGURE 13. ROC curves of a control policy considering previous lightsources to estimate users’ speed. The most optimal curve from theprevious experiment (CTRL_MAX) is used to compare the optimizationproduced by the inclusion of information from previous streetlights.Sensitivity is represented on the Y-axis and Specificity on the X-Axis.
not only estimated. We also see that adding information frommore than one preceding light source increases the TPR, butthe LS control action improvement is minimal.
F. OPTIMIZATION EVALUATIONTo find out the optimization obtained from using the informa-tion provided by the different number of streetlights, we usethe parameter Area Under the Curve (AUC). The closer toone is the AUC value, the more optimal is the predictionmade by the control algorithm [37]. Table 4 shows all the datainvolved to know if AUC can be used as a suitable parameterthat joins power consumption and user comfort. The firstcolumn shows the different control strategies based on theprevious light sources’ information (LS). The second column(Pow. Con.), provides the proportional value of the powerconsumption. This value is calculated as the percentage ofconsumption related to the maximum consumption of thestreet. The maximum possible consumption is calculated asall the street lamps emit the maximum light when the pedes-trian is crossing the street. The third column is obtained asan average of the difference between the Luxes needed andprovided. If Conf .diff . contains negative values, this meansthat the light provided is less than necessary. As the controlperformed is oriented to reduce the light provided to saveenergy, all values are negative. The fourth column showsthe values obtained from the AUC for each case in whicha different number of previous streetlights are considered inthe control algorithm (first column). The last column showsthe calculation of the optimization obtained when compar-ing the AUC of a specific number of streetlights with theprevious one.
We notice that the more sources of information (streetlamps) we have, the more comfort is provided. However, asexpected, both energy savings and pedestrian comfort fromseveral street lights hardly have not appreciable variations.As the results show, the improvement of AUC obtained byincluding only the previous lamppost to adapt the control
TABLE 4. Overall data obtained. Power consumption (Pow. con.) iscalculated as the rate between the maximum consumption and theconsumption when the control is applied. Pedestrian comfort (Ped. comf.)is calculated as the average of the difference between the pedestrianneeds and the light intensity provided. The Area Under the Curve (AUC)shows the values for each number of previous light sources and theimprovement percentage. The improvement is calculated as the quotientof the AUC of the next streetlight by the AUC of the current streetlight andexpressing the result as a percentage. In the column header theabbreviation ’Prev.’ corresponds to the term ’previous’.
action to pedestrian speed (LS = 1) is 4.19%. This previousinformation allows the streetlight to know the pedestrian’sspeed in an approximate way, which makes it possible todispense with the speculation carried out in the algorithmwithout prior information. The inclusion of the previousinformation of a second lamppost, LS = 2, implies anincrease in the optimization of 1.32% with respect to theuse of the information of a single previous lamppost. Wheninformation from the third previous lamppost is added to thecontrol algorithm, the increase is less than 1%. Althoughit depends on the design requirements, considering a valueof LS = 2 or LS = 3 seems the most appropriate tonot overload the message communications network nor toincrease so much the extra processing control time.
Table 4 shows that there is no option to improve onevariable, power consumption, without decrease the other,user comfort, and vice-versa. Consequently, we have a multi-objective problem: minimize consumption and maximizecomfort. One method to optimize a multi-objective systemis to use the Pareto Front Approximations [38] usually usedto optimize a system [39]. With this method, it is possibleto determine a region when power consumption and usercomfort values can be accepted. In [40], the ROC variablesare used to obtain a Pareto Front using the TP, FN, FP, and TNvalues. Specifically, the variables False Negative Rate (FNR)and False Positive Rate (FPR) are used, shown respectivelyin the equations 5 and 6.
FNR =FN
(TP+ FN )(5)
FPR =FP
(TN + FP)(6)
Representing FNR in the y-axis, and FPR in the x-axis,the ROC curve is represented in terms of errors.
Figure 14, shows the curve obtained from the simulationsdone. As shown in this figure, it is possible to select apoint, or a range, when the FNR and FPR rates are minimal.
144672 VOLUME 9, 2021

J.-L. Poza-Lujan et al.: Use of ROC Curve to Evaluate Street Lighting Control System
FIGURE 14. ROC curve in terms of errors using the False NegativeRate (FNR) and False Positive Rate (FPR). With this curve, it is possible toselect a range or operating point when power consumption andpedestrian comfort values can be considered optimal. The closer an FNRor FPR value is to zero, the more efficient there is in the controlalgorithm. In this case, the value LS = 3 minimizes both distances.
This point coincides with the LS value of 3; that is, the ROCcurve allows adjusting the distributed control system config-uration’s value. The ROC curve, in terms of errors, provideuseful information. A high FPR implies a high number ofstreet lights switched on, and consequently a high powerconsumption. As the number of streetlights to be considereddecreases, the false-negative rate increases due to the fact thatthere are streetlights, which are not considered, this is largelydue to the road is not illuminated, and only the courtesy lightis provided.
V. CONCLUSION AND FUTURE WORKIn this article, we have presented how it is possible to useROC analysis to evaluate which control policy is the mostappropriate to a specific context and requirements. We havemodeled a street with several luminaries as light sourcesand with a pedestrian walking down it. We have studied theconfusion matrix based on different types of control actionssimulated in this environment.
The confusion matrix is suitable as a method to character-ize the control action’s efficiency, especially if this controlaction is based on predictions, as in the case of pedestrianspeed. Instead of absolute and relative error, in this case,we use the confusion matrix to determine whether the controlaction has planned the pedestrian’s positionwell.We considerthat a control action is good when the number of TP and TNis significantly higher than the number of FP and FN. Theconcept of ’significant’ in this case refers to a change in theAUC parameter. Thus, when the sensitivity and specificityvalues approach 1, we know that the control action is closeto optimal. In addition, it is possible to tune the algorithm ofa control system by deciding whether to be conservative in theaction, for example, to illuminate in case of doubt; or specificin the control action, for example, to illuminate only when itis certain that the pedestrian is going to be in the streetlampaction range.
We have tested several control strategies: one, in whichlight sources respond independently, and another one inwhich light sources take actions according to the informationprovided by previous street lamps. We have seen how thecommunication between several light sources improves theirperformance. Moreover, other methods can be included thatdetermine if the light bulb is working correctly. When somefailure will be expected soon [41], the control system canincorporate a control part for adjusting the behavior of closedlight sources.
Initially, we used the ROC curves with a single lamppostto check which control criterion was more suitable to offera better service. We have tested as a conservative criterion,assuming that the pedestrian’s speed is high, it is more effi-cient by providing more sensitivity. This result is as expectedsince the conservative criteria illuminate earlier, which doesnot affect lighting comfort. The second control strategy testedimplies that the control action considers the speed calculatedfrom the pedestrian’s detection in an increasing number ofprevious streetlights. Since the pedestrian is detected earlier,it is possible to calculate the speed with better precision and,consequently, the specificity increases and the optimizationof the service. The results show that the more previous street-lights algorithm considers, the higher is the resulting AUC.
The use of ROC curves, where the success of the controldepends on both the successes and the errors, is especiallyuseful in the design of distributed control systems to deter-mine the connections between nodes that are not in motion.In the case presented in the article, the technique is usefulfor Infrastructure to Infrastructure (I2I) networks. However,it remains to be studied whether if when control nodes aremoving, i.e.: in the case of the vehicles, the use of the parame-ters of both success (TP, TN) and failure (FP, FN) can bemoreefficient than current adaptive control methods. This aspect isrelevant, especially for theVehicle toVehicle (V2V) networksor the Vehicle to Infrastructure (V2I) networks.
In this work, we have located light sources along the sameline. In the future, we want to study the influence of otherphysical topology, such as crossroads and roundabouts. Theaimwill be to study how the environment topology influencesthe number of necessary connections between light sources.Finally, we also want to study how the ROC curves can deter-mine a control algorithm’s optimal parameters. In this way,given the characteristics of an environment, as the distancebetween light sources, type, traffic of pedestrians, and soon, the ROC curves can be used to decide the best controlalgorithm to be used in each case.
REFERENCES
[1] J. M. Klopp and D. L. Petretta, ‘‘The urban sustainable development goal:Indicators, complexity and the politics of measuring cities,’’Cities, vol. 63,pp. 92–97, Mar. 2017.
[2] V. Albino, U. Berardi, and R. M. Dangelico, ‘‘Smart cities: Definitions,dimensions, performance, and initiatives,’’ J. Urban Technol., vol. 22,no. 1, pp. 3–21, 2015.
[3] R. P. Dameri, ‘‘Searching for smart city definition: A comprehensiveproposal,’’ Int. J. Comput. Technol., vol. 11, no. 5, pp. 2544–2551, 2013.
VOLUME 9, 2021 144673

J.-L. Poza-Lujan et al.: Use of ROC Curve to Evaluate Street Lighting Control System
[4] E. Al Nuaimi, H. Al Neyadi, N. Mohamed, and J. Al-Jaroodi, ‘‘Applica-tions of big data to smart cities,’’ J. Internet Services Appl., vol. 6, no. 1,p. 25, Dec. 2015.
[5] O. Z. Andrzej adowicz and J. Grela, ‘‘Energy saving in the street light-ing control system—A new approach based on the EN-15232 standard,’’Energy Efficiency, vol. 10, no. 3, pp. 563–576, 2017.
[6] A. Das, P. Dash, and B. K. Mishra, ‘‘An innovation model for smarttraffic management system using Internet of Things (IoT),’’ in CognitiveComputing for Big Data Systems Over IoT. Cham, Switzerland: Springer,2018, pp. 355–370.
[7] H. Su, E. Zio, J. Zhang, L. Chi, X. Li, and Z. Zhang, ‘‘A systematicdata-driven demand side management method for smart natural gas supplysystems,’’ Energy Convers. Manage., vol. 185, pp. 368–383, Apr. 2019.
[8] A. H. Alavi, H. Hasni, N. Lajnef, and K. Chatti, ‘‘Continuous health mon-itoring of pavement systems using smart sensing technology,’’ Construct.Building Mater., vol. 114, pp. 719–736, Jul. 2016.
[9] Z. A. Baig, P. Szewczyk, C. Valli, P. Rabadia, P. Hannay,M. Chernyshev, M. Johnstone, P. Kerai, A. Ibrahim, N. Syed, N. Peacock,and K. Sansurooah, ‘‘Future challenges for smart cities: Cyber-securityand digital forensics,’’ Digit. Invest., vol. 22, pp. 3–13, Sep. 2017.
[10] M. Ryu, J. Yun, T. Miao, I.-Y. Ahn, S.-C. Choi, and J. Kim, ‘‘Design andimplementation of a connected farm for smart farming system,’’ in Proc.IEEE SENSORS, Nov. 2015, pp. 1–4.
[11] A. Haans and Y. A. W. de Kort, ‘‘Light distribution in dynamic streetlighting: Two experimental studies on its effects on perceived safety,prospect, concealment, and escape,’’ J. Environ. Psychol., vol. 32, no. 4,pp. 342–352, Dec. 2012.
[12] B. Chachuat, B. Srinivasan, and D. Bonvin, ‘‘Adaptation strategies for real-time optimization,’’ Comput. Chem. Eng., vol. 33, no. 10, pp. 1557–1567,Oct. 2009.
[13] F.-L. Lian, J. Moyne, and D. Tilbury, ‘‘Network design consideration fordistributed control systems,’’ IEEE Trans. Control Syst. Technol., vol. 10,no. 2, pp. 297–307, Mar. 2002.
[14] T. Fawcett, ‘‘An introduction to ROC analysis,’’ Pattern Recognit. Lett.,vol. 27, no. 8, pp. 861–874, Jun. 2006.
[15] P. Chiradeja, S. Yoomak, and A. Ngaopitakkul, ‘‘Economic analysis ofimproving the energy efficiency of nanogrid solar road lighting usingadaptive lighting control,’’ IEEE Access, vol. 8, pp. 202623–202638,2020.
[16] V. Mehta, ‘‘Walkable streets: Pedestrian behavior, perceptions and atti-tudes,’’ J. Urbanism, vol. 1, no. 3, pp. 217–245, Nov. 2008.
[17] M. Mahoor, F. R. Salmasi, and T. A. Najafabadi, ‘‘A hierarchical smartstreet lighting systemwith brute-force energy optimization,’’ IEEE SensorsJ., vol. 17, no. 9, pp. 2871–2879, May 2017.
[18] J. F. De Paz, J. Bajo, S. Rodríguez, G. Villarrubia, and J. M. Corchado,‘‘Intelligent system for lighting control in smart cities,’’ Inf. Sci., vol. 372,pp. 241–255, Dec. 2016.
[19] D. Alarcón, E. Balvís, R. Bendaña, A. Conejero, D. Fernández, J. Higón,J. Isidro, and H. Michinelc, ‘‘Mathematical modeling and numerical sim-ulation of heat dissipation in led bulbs,’’ Thermal Sci., vol. 24, no. 3,pp. 1877–1884, 2020.
[20] D. Griggs, M. Stafford-Smith, O. N. Gaffney, J. N. Rockström,M. C. Öhman, P. Shyamsundar, W. Steffen, G. Glaser, N. Kanie, andI. Noble, ‘‘Sustainable development goals for people and planet,’’ Nature,vol. 495, no. 7441, pp. 305–307, 2013.
[21] S. Chu, Y. Cui, and N. Liu, ‘‘The path towards sustainable energy,’’ NatureMater., vol. 16, no. 1, pp. 16–22, Jan. 2017.
[22] M. Frontczak and P. Wargocki, ‘‘Literature survey on how different factorsinfluence human comfort in indoor environments,’’ Building Environ.,vol. 46, no. 4, pp. 922–937, 2011.
[23] C. Villa and R. Labayrade, ‘‘Energy efficiency vs subjective comfort:A multiobjective optimisation method under uncertainty,’’ in Proc. Build-ing Simulation Conf., Sydney, NSW, Australia, 2011, pp. 1905–1912.
[24] A. Gharaibeh, M. A. Salahuddin, S. J. Hussini, A. Khreishah, I. Khalil,M. Guizani, and A. Al-Fuqaha, ‘‘Smart cities: A survey on data manage-ment, security, and enabling technologies,’’ IEEE Commun. Surveys Tuts.,vol. 19, no. 4, pp. 2456–2501, 4th Quart., 2017.
[25] X.-B. Cao, H. Qiao, and J. Keane, ‘‘A low-cost pedestrian-detection systemwith a single optical camera,’’ IEEE Trans. Intell. Transp. Syst., vol. 9,no. 1, pp. 58–67, Mar. 2008.
[26] S. Hwang, J. Park, N. Kim, Y. Choi, and I. S. Kweon, ‘‘Multispectralpedestrian detection: Benchmark dataset and baseline,’’ in Proc. IEEEConf. Comput. Vis. Pattern Recognit. (CVPR), Jun. 2015, pp. 1037–1045.
[27] S. Gomez, B. Ivorra, and A.M. Ramos, ‘‘Designing optimal trajectories fora skimmer ship to clean, recover and prevent the oil spilled on the sea fromreaching the coast,’’ Appl. Math. Nonlinear Sci., vol. 3, no. 2, pp. 553–570,Dec. 2018.
[28] N. Yoshiura, Y. Fujii, and N. Ohta, ‘‘Smart street light system looking likeusual street lights based on sensor networks,’’ in Proc. 13th Int. Symp.Commun. Inf. Technol. (ISCIT), Sep. 2013, pp. 633–637.
[29] G. K. Still, Introduction to Crowd Science. Boca Raton, FL, USA:CRC Press, 2014.
[30] R. Fujdiak, P. Mlynek, J. Misurec, and J. Slacik, ‘‘Simulation of intelligentpublic light system in smart city,’’ in Proc. Prog. Electromagn. Res. Symp.-Spring (PIERS), 2017, pp. 2515–2519.
[31] J. A. Rincon, J.-L. Poza-Lujan, V. Julian, J.-L. Posadas-Yagüe, andC. Carrascosa, ‘‘Extending MAM5meta-model and JaCalIV E frameworkto integrate smart devices from real environments,’’ PLoS ONE, vol. 11,no. 2, Feb. 2016, Art. no. e0149665.
[32] D. Hristu-Varsakelis, W. S. Levine, R. Alur, K. E. Arzen, J. Baillieul, andT. A. Henzinger, Handbook of Networked and Embedded Control Systems(Control Engineering). Basel, Switzerland: Birkhäuser, 2005.
[33] T. E. Oliphant, ‘‘Python for scientific computing,’’ Comput. Sci. Eng.,vol. 9, no. 3, pp. 10–20, May 2007.
[34] J. Ferreira, Google Apps Script:Web Application Development Essentials.Sebastopol, CA, USA: O’Reilly Media, 2014.
[35] E. Papadimitriou, G. Yannis, and J. Golias, ‘‘A critical assessment ofpedestrian behaviour models,’’ Transp. Res. F: Traffic Psychol. Behav.,vol. 12, no. 3, pp. 242–255, 2009.
[36] S. Fotios, J. Unwin, and S. Farrall, ‘‘Road lighting and pedestrian reas-surance after dark: A review,’’ Lighting Res. Technol., vol. 47, no. 4,pp. 449–469, Jun. 2015.
[37] J. A. Hanley and B. J. McNeil, ‘‘The meaning and use of the area under areceiver operating characteristic (ROC) curve,’’ Radiology, vol. 143, no. 1,pp. 29–36, 1982.
[38] T. Tušar and B. Filipič, ‘‘Visualization of Pareto front approxima-tions in evolutionary multiobjective optimization: A critical review andthe prosection method,’’ IEEE Trans. Evol. Comput., vol. 19, no. 2,pp. 225–245, Apr. 2015.
[39] L. Torralba-Morales, G. Reynoso-Meza, and J. Carrillo-Ahumada, ‘‘Tun-ing and comparison of design concepts applying Pareto optimality. a casestudy of cholette bioreactor,’’ Revista Iberoamericana de Automática eInform. Ind., vol. 17, no. 2, pp. 190–201, 2020.
[40] R. Aler, J. Handl, and J. D. Knowles, ‘‘Comparing multi-objective andthreshold-moving ROC curve generation for a prototype-based classifier,’’in Proc. 15th Annu. Conf. Genetic Evol. Comput. Conf. (GECCO), 2013,pp. 1029–1036.
[41] W. Zhao, T. Shi, and L. Wang, ‘‘Fault diagnosis and prognosis of bearingbased on hidden Markov model with multi-features,’’ Appl. Math. Nonlin-ear Sci., vol. 5, no. 1, pp. 71–84, Jan. 2020.
JOSE-LUIS POZA-LUJAN (Member, IEEE) wasborn in València, Spain, in 1969. He received theB.S. degree in science and mathematics educa-tion from the Universitat de València, Valencia,in 1990, and the B.S. degree in systems and com-puting and the Ph.D. degree in computer sci-ence from the Universitat Politècnica de València,Valencia, in 1999 and 2012, respectively.
Since 2002, he has been a Lecturer and aResearcher at the UPV. He is currently the Vice-
Dean of Communication and Promotion of the School of Informatics, UPV.He is responsible of the master’s subjects soft skills and agile project man-agement. He has led more than 100 final degree projects. He has participatedin different stays in HVA (The Netherlands), TUAS (Finland), and Telecom(France). He has published 13 articles in indexed journals, two books, twobook chapters, and 107 articles in congresses. He has participated in 22 tech-nological projects and in 11 projects of educational innovation. He has beenthe Project Co-ordinator of a university project of education innovationfocused on the cross-curricular competencies in the ICT degree. He hasbeen the Main Researcher and Project Co-ordinator of the CoSki21 Project,and a Technical Co-ordinator of a European Project of the H2020 Program.His research interests include distributed systems architectures, intelligentdevices, project management, and soft skills. He received the prizing forteaching excellence of the Schools of Informatics in 2007. He received thePrize for Teaching Excellence, recognized by the National Spanish Agencyin 2013.
144674 VOLUME 9, 2021

J.-L. Poza-Lujan et al.: Use of ROC Curve to Evaluate Street Lighting Control System
JUAN-JOSÉ SÁENZ-PEÑAFIEL was born inCuenca, Ecuador, in 1989. He received the degreein systems engineering from the Universidad deCuenca, Ecuador, in 2014, and the M.Sc. degree incomputer engineering and networks from the Uni-versitat Politècnica de València, Spain, in 2018,where he is currently pursuing the Ph.D. degree.He is also a Data Analyst and a Journals Adminis-trator at Research Direction of the Universidad deCuenca, Ecuador. He has participated in research
projects, since 2015, as a Research Assistant at the University of Cuenca.He has published one article in an indexed journal articles and four papersin conferences. He is also responsible for research data at the Universityof Cuenca. His research interests include distributed systems and artificialintelligence.
JUAN-LUIS POSADAS-YAGÜE received theM.Sc. and Ph.D. degrees in computer engineer-ing from the Universitat Politècnica de València,Spain, in 1996 and 2003, respectively. He hastaught computer architecture at the School ofEngineering in Computer Science, since 1997.He is currently an Associate Professor with theDepartment of Computer Engineering, UniversitatPolitècnica de València. He is also the Directorresponsible of the teaching management with the
Department of Computer Engineering. His research interests include dis-tributed systems, real-time mobile robot control and coordination, codedelegation, multi-agent systems, and embedded systems.
J. ALBERTO CONEJERO received the degreein mathematics from the Universitat de Valèn-cia (UV), and the Ph.D. degree from the Uni-versitat Politècnica de València (UPV), Spain,in 2004, receiving the Outstanding Disserta-tion Award. Since 2009, he has been an Asso-ciate Professor at UPV. He has been an InvitedResearcher of Bowling Green St. University(USA), Kent St. University (USA), Università delSalento (Italy), Universität Tübingen (Germany),
and Czech Academy of Sciences (Czech Republic). He has been awardedwith the Teaching Excellence Prize of UPV in 2014. He is currently theDirector of the Department of Applied Mathematics, UPV, and responsibleof the M.Sc. Program on Mathematics Research at UPV. He is the author ofmore than 60 articles in international journals. His research interests includedynamical systems, partial differential equations, graph theory, and the mul-tidisciplinary applications of mathematics to computer science, engineering,and biotechnology.
JUAN-CARLOS CANO (Senior Member, IEEE)received the M.Sc. and Ph.D. degrees in computerscience from the Polytechnic University of Valen-cia (UPV), Spain, in 1994 and 2002, respectively.From 1995 to 1997, he worked as a ProgrammingAnalyst at the IBM’s Manufacturing Division,Valencia. He is currently a Full Professor withthe Department of Computer Engineering, UPV.His current research interests include vehicularnetworks, mobile ad hoc networks, and pervasivecomputing.
VOLUME 9, 2021 144675