use of satellite in forecasting storm … of satellite in forecasting storm phailin in indian ocean...
TRANSCRIPT
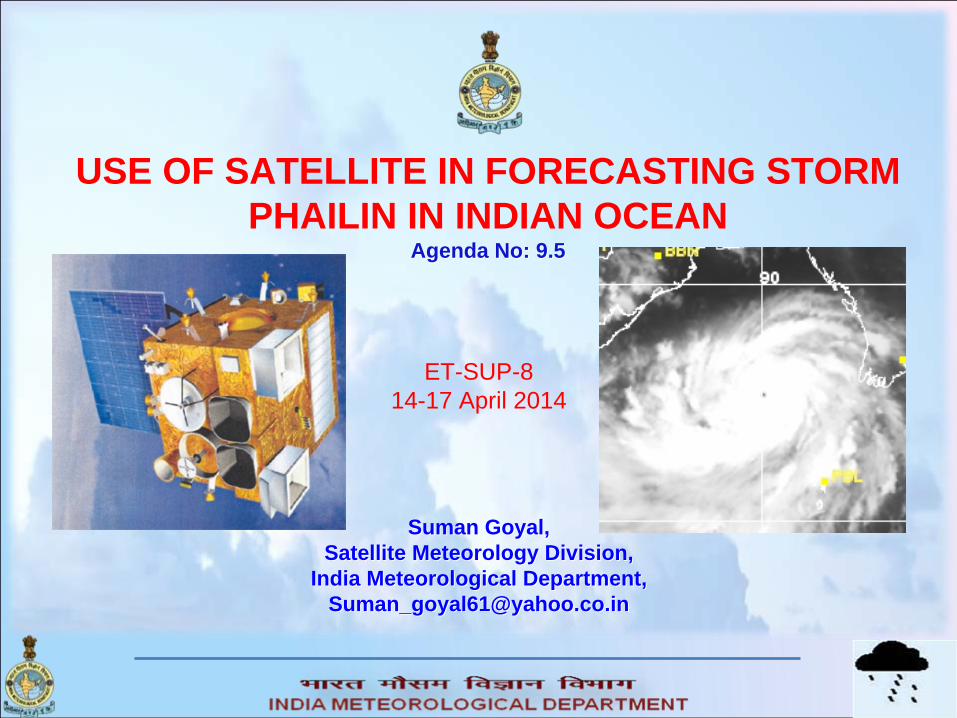
USE OF SATELLITE IN FORECASTING STORM PHAILIN IN INDIAN OCEAN
Agenda No: 9.5Agenda No: 9.5
Suman Goyal,Suman Goyal,Satellite Meteorology Division,Satellite Meteorology Division,
India Meteorological Department,India Meteorological Department,[email protected][email protected]
ET-SUP-814-17 April 2014

Overview
1 Introduction2 Genesis3 Intensification4 Landfall5 Measurement of Intensity

SOME FACTS ABOUT CYCLONES
Out of 80 global annual number - four form over Bay of Bengal – two / three intensify to severe ones
Minimum No. of cyclones in a year - One (1949)
Maximum No. of cyclones in a year –
Ten (1893,1926,1930,1976)
Out of total disturbances - 35% intensify to Cyclones
16 % intensify to SCS
7% intensify to VSCS
Peak activity – November followed by May
Ratio of TCS between Bay of Bengal and Arabian Sea – 4:1
Year to year variation - Quite large

Local variations to Dvorak (1984)T.No./C.I No. Wind Speed in Knots (Atlantic) Wind Speed in Knots (IMD)
T1.0 25 <17T1.5 25 25T2.0 30 30T2.5 35 35T3.0 45 45T3.5 55 55T4.0 65 65T4.5 77 77T5.0 90 90T5.5 102 102T6.0 115 115T6.5 127 127T7.0 140 140T7.5 155 155T8.0 170 170

Wind pressure relationship with Intensity
T.No. dP ( hPa) Wind Speed (knots)
T2.0 4.5 30
T2.5 6.1 35
T3.0 10.0 45
T3.5 15.0 55
T4.0 20.9 65
T4.5 29.4 77
T5.0 40.2 90
T5.5 51.6 102
T6.0 65.6 115
T6.5 80.0 127
T7.0 97.2 140
T7.5 119.1 155
T8.0 143.3 170

VERY SEVERE CYCLONIC STORM PHAILIN
The cyclonic circulation lay as a low pressure area over Tenasserim coast on 6th October 2013.
The VSCS, PHAILIN crossed Odisha & adjoining north Andhra Pradesh coast near Gopalpur (Odisha) at 1600 UTC of 12th October 2013 with maximum intensity T6.0
Phailin’s genesis growth and movement was mainly monitored by the satellite as Bay of Bengal is a data sparse region.
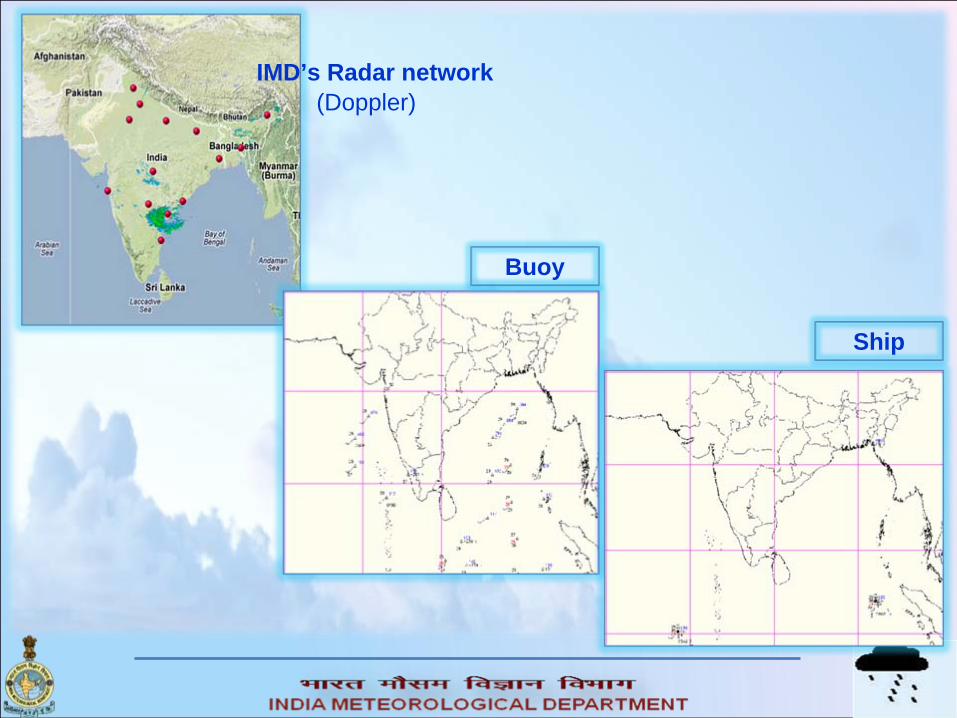
Buoy
Ship
IMD’s Radar network(Doppler)
MAIN FEATURES
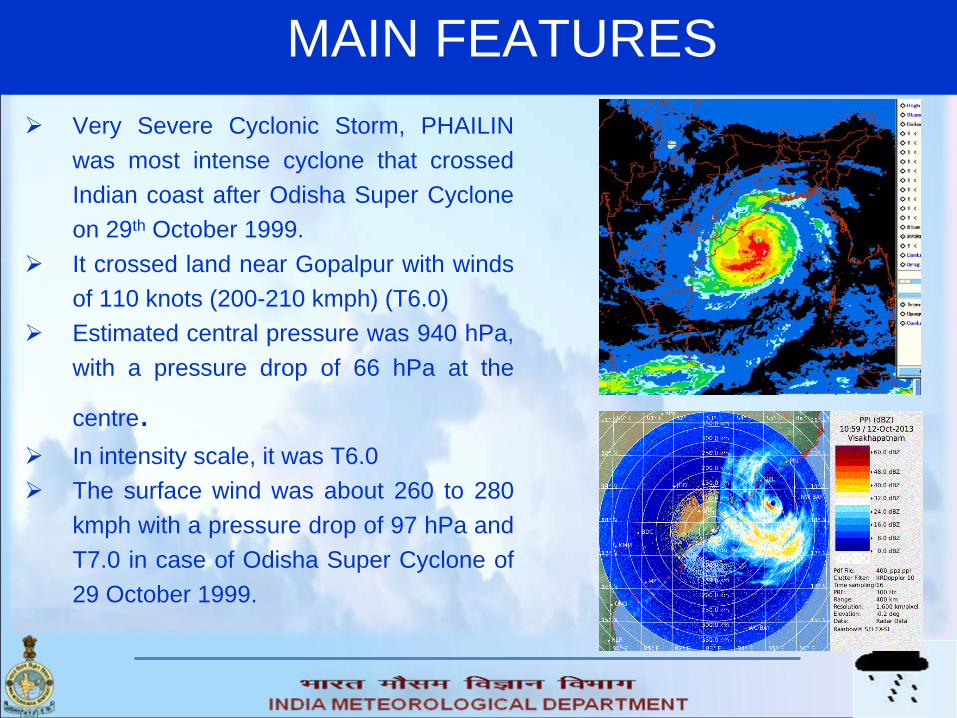
Very Severe Cyclonic Storm, PHAILIN was most intense cyclone that crossed Indian coast after Odisha Super Cyclone on 29th October 1999.
It crossed land near Gopalpur with winds of 110 knots (200-210 kmph) (T6.0)
Estimated central pressure was 940 hPa, with a pressure drop of 66 hPa at the
centre.
In intensity scale, it was T6.0
The surface wind was about 260 to 280 kmph with a pressure drop of 97 hPa and T7.0 in case of Odisha Super Cyclone of 29 October 1999.
PHAILIN : Rapid intensification
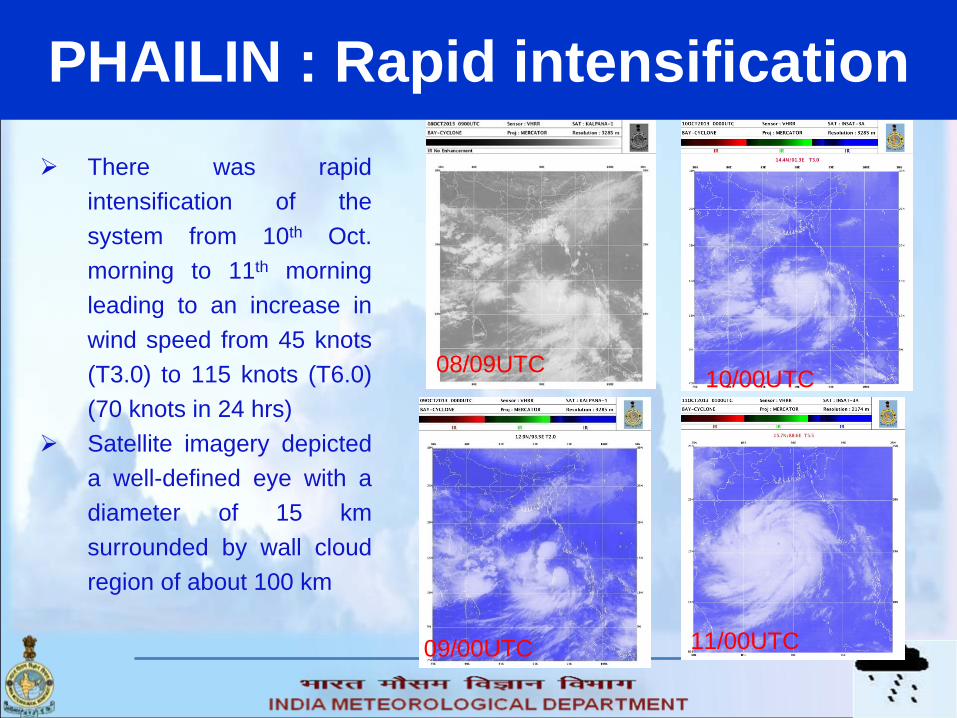
There was rapid intensification of the system from 10th Oct. morning to 11th morning leading to an increase in wind speed from 45 knots (T3.0) to 115 knots (T6.0) (70 knots in 24 hrs)
Satellite imagery depicted a well-defined eye with a diameter of 15 km surrounded by wall cloud region of about 100 km
08/09UTC 10/00UTC
09/00UTC 11/00UTC

DAMAGE DUE TO CYCLONE ‘PHAILIN’ OVER ODISHADistricts Affected:Angul Balasore, Bhadrak, Bolangir, Cuttak, Ganjapati, Ganjam, Jagatsinghpur, Jajpur, Kamdhamal, Kendrapara, Keonjhar, Khurda, Koraput, Mayurbhanj, Nayagarh, PuriBlock Affected (Nos.) : 151GPs Affected(Nos.) : 2015Village Affected(Nos.) : 18117ULB Affected (Nos.) : 43Population Affected (Nos.) due to flood & cyclone : 12396065Human Casualty due to cyclone : 21Human Casualty due to flood : 17Crop area affected (hect) : 668268Person evacuated due to cyclone : 983642Person evacuated due to flood : 171083Cattle evacuated : 31062House damaged : 419052

DAMAGE DUE TO CYCLONE ‘PHAILIN’ OVER ANDHRA PRADESHDistricts Village Affected Human Casualty Person evacuated House damaged
Srikakulam 237 1 90326 1242Vizainagaram 35 ‐ 20100 8Visakhapatnam 22 ‐ 24000 13
Total 294 1 134426 1263Loss of Animal Life
•Milch Animals : 36•Draught Animal : 01•Calves : 05•Sheeps and goats : 57Crop Inundated : As per preliminary reports•Agriculture: Paddy inundated : 6,192 Ha.,
780 Ha in Wg dist due to excess release of water from Karatam Krishna Murthty Project during cyclone
•Paddy Lodging : 1462 Ha.•Maize : 555 Ha. •Sugarcane : 145 Ha.•Horticulture: •Coconut : 3,219 Ha. •Cashew : 929 Ha. •Vegetables : 663 Ha. •Banana : 283 Ha. •Papaya : 46 Ha.
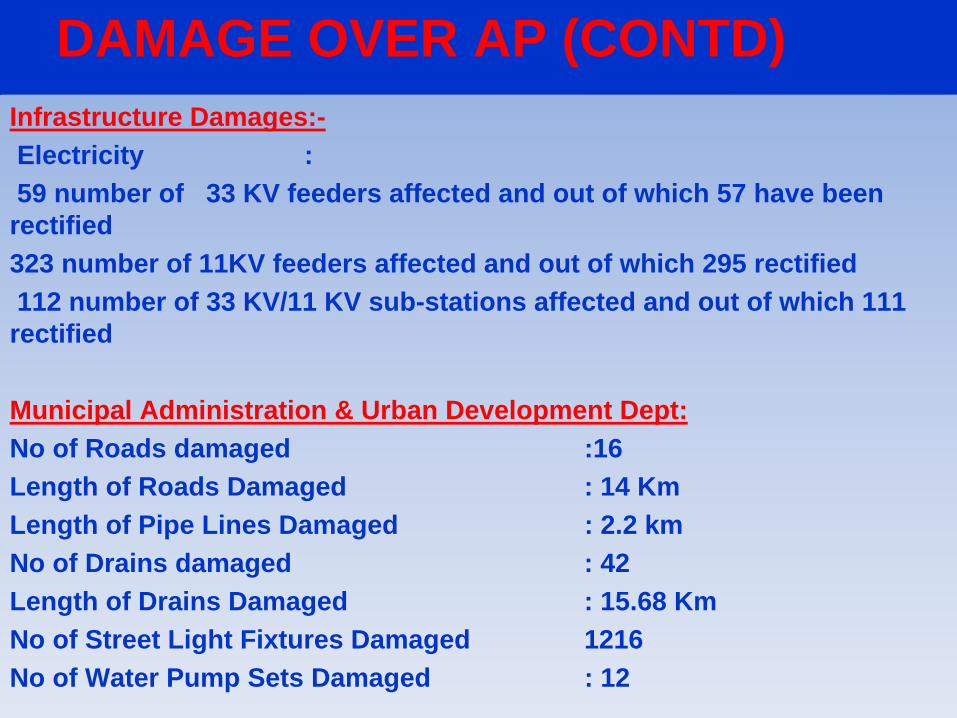
DAMAGE OVER AP (CONTD)Infrastructure Damages:-Electricity :59 number of 33 KV feeders affected and out of which 57 have been
rectified323 number of 11KV feeders affected and out of which 295 rectified112 number of 33 KV/11 KV sub-stations affected and out of which 111
rectified
Municipal Administration & Urban Development Dept:No of Roads damaged :16Length of Roads Damaged : 14 KmLength of Pipe Lines Damaged : 2.2 kmNo of Drains damaged : 42Length of Drains Damaged : 15.68 KmNo of Street Light Fixtures Damaged 1216No of Water Pump Sets Damaged : 12
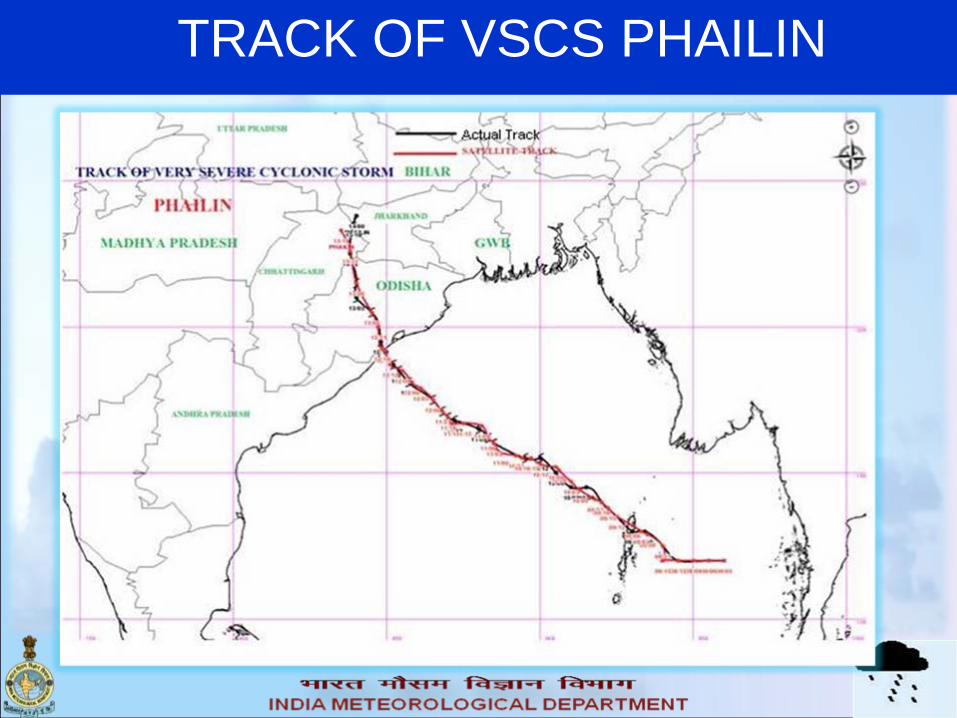
TRACK OF VSCS PHAILIN

Best Track with satellite and Radar estimated tracks

Satellites used for analysis of Tropical Satellites used for analysis of Tropical cyclone Phailincyclone Phailin
KalpanaKalpana--1, INSAT 1, INSAT --3A & INSAT3A & INSAT--3D3D
OceansatOceansat--IIII
DMSPDMSP
NOAANOAA
METEOSATMETEOSAT
METOPSMETOPS
MODISMODIS
TRMMTRMM
MTSATMTSAT
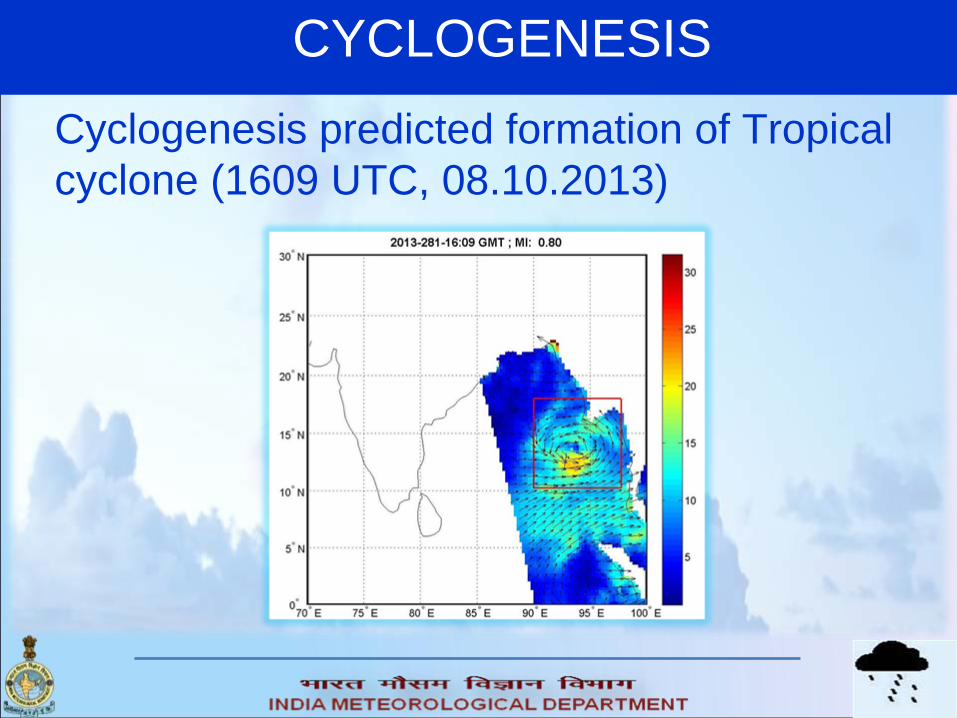
CYCLOGENESISCyclogenesis predicted formation of Tropical cyclone (1609 UTC, 08.10.2013)

GENESISThe cyclonic circulation lay as a low pressure area over Tenasserim coast on 6th October 2013.
2100 UTC of 06.10.2013 (IR)
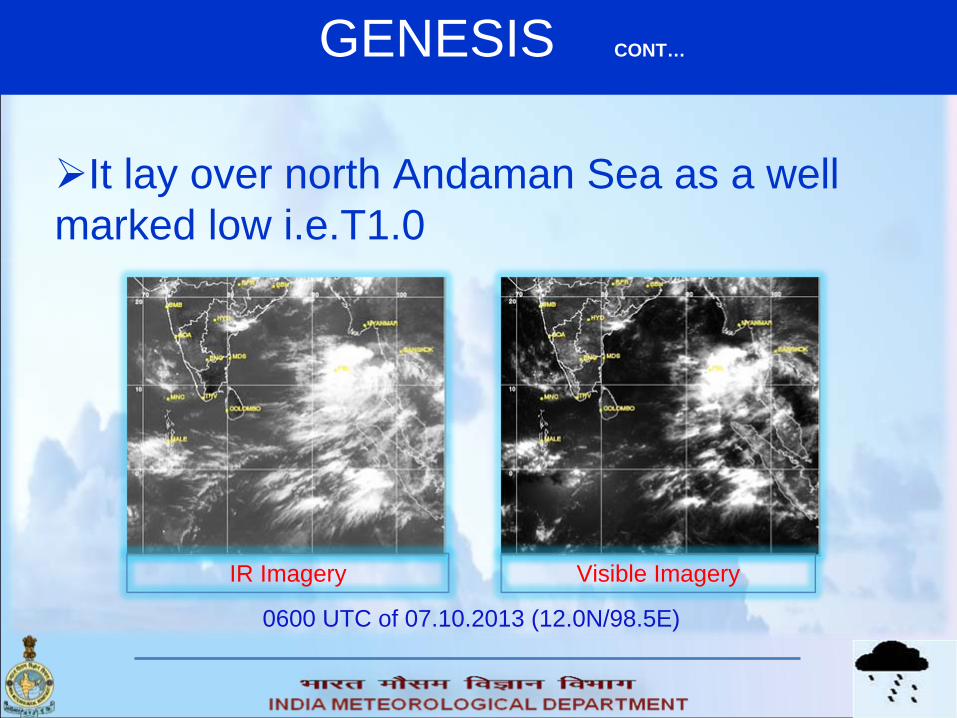
GENESIS CONT…
It lay over north Andaman Sea as a well marked low i.e.T1.0
IR Imagery Visible Imagery
0600 UTC of 07.10.2013 (12.0N/98.5E)
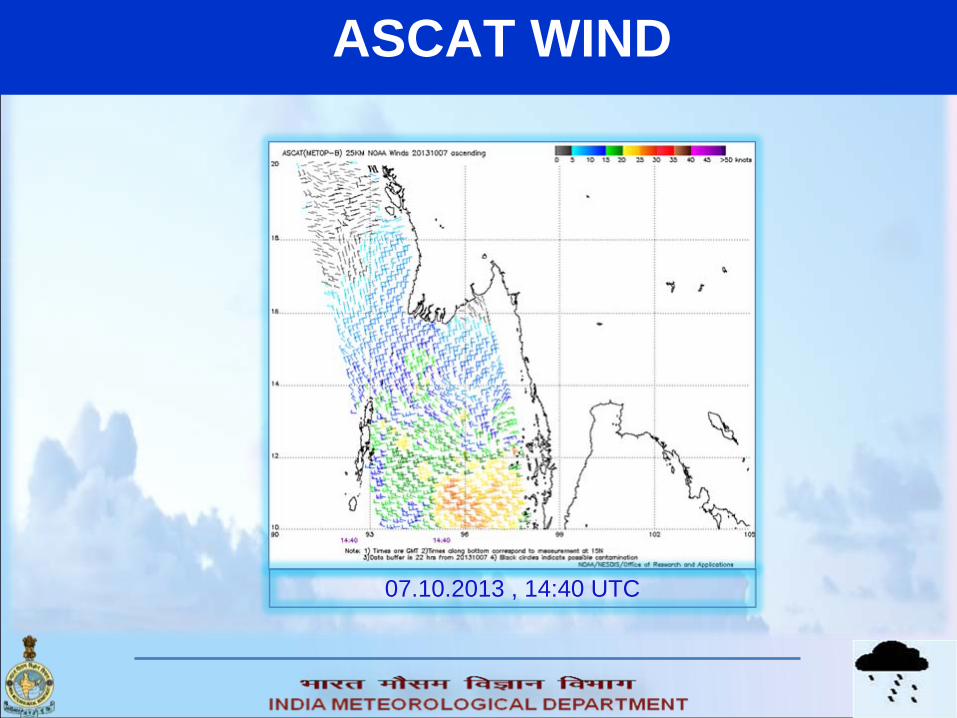
ASCAT WIND
07.10.2013 , 14:40 UTC

WIND SHEAR & SHEAR TENDENCY
Wind Shear & Shear tendency derived from Meteosat-7, (1800 UTC of 07.10.2013)
Wind Shear 5.-10 knots Shear tendency -10 to -20 knots

INTENSIFICATION
1810 UTC of 09.10.2013 2100 UTC of 09.10.2013 (IR)

INTENSIFICATION
0212 UTC of 10.10.2013
0230 UTC of 10.10.2013
Visible IR

MERGING OF CLOUD CLUSTERS
0430 UTC of 09.10.2013 0930 UTC of 09.10.2013

RAPID INTENSIFICATION
0200 UTC of 10.10.2013 - T3.0 0200 UTC of 11.10.2013 - T5.5

WIND SHEAR & SHEAR TENDENCY
1200 UTC of 10.10.2013
Shear tendency -5 to 0 knotsWind shear 0-10 knots
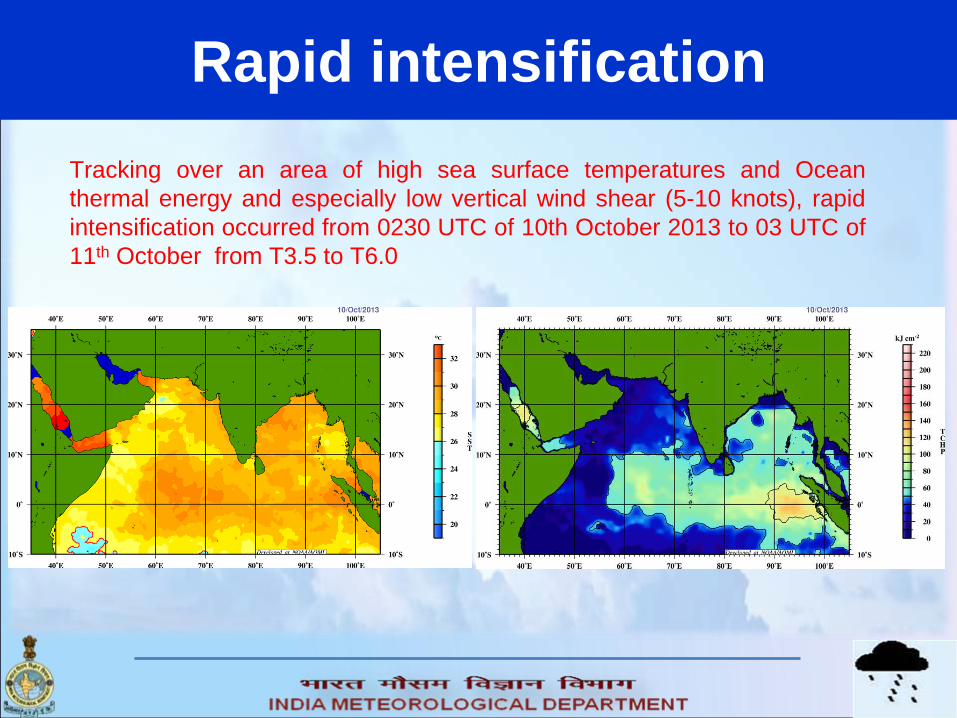
Rapid intensificationTracking over an area of high sea surface temperatures and Ocean thermal energy and especially low vertical wind shear (5-10 knots), rapid intensification occurred from 0230 UTC of 10th October 2013 to 03 UTC of 11th October from T3.5 to T6.0

SST & TCHP after landfall

INTENSIFICATION
Moving in west-northwestward direction it intensified with intensity T6.0 (Very Severe Cyclonic Storm) and centre 16.0N/88.5E at 0300 UTC of 11th October.
Visible IR0300 UTC of 11.10.2013
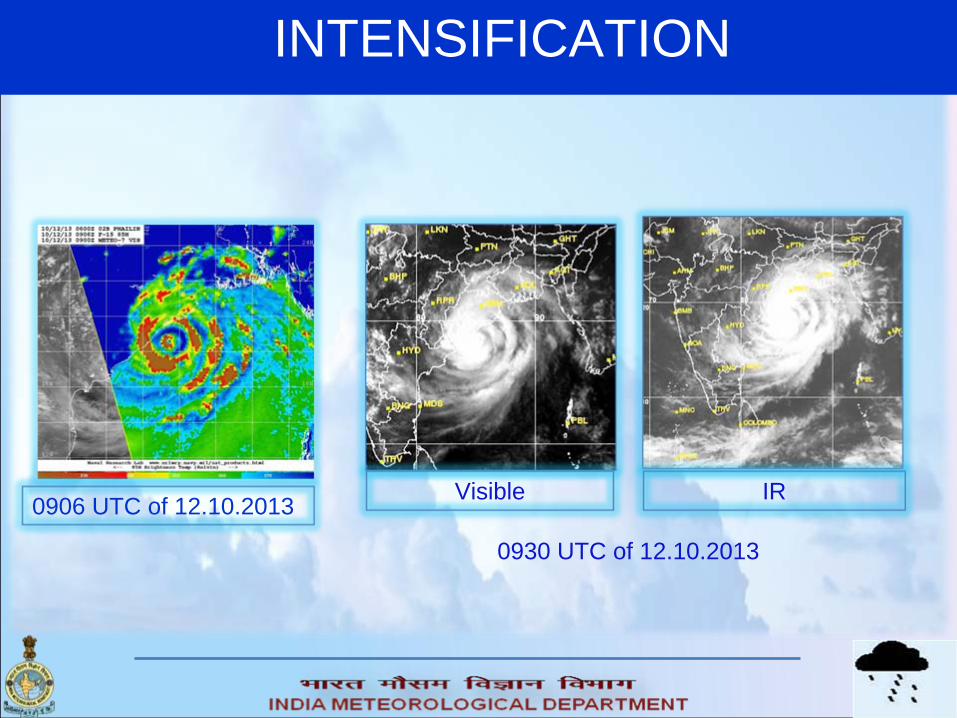
INTENSIFICATION
0906 UTC of 12.10.2013
0930 UTC of 12.10.2013
Visible IR

TRACK OF PHAILIN

INTENSITY MEASUREMENT
0.5 °
Embedded distance :0.5°E. No.: 4.0Eye adjustment : 0Banding Feature: 2.0Intensity= E No + EyeAdjustment + BandingFeature = 6.0
0230 UTC of 12 October 2013 (Visible)
PT agreesMET: 5.5Final T.No.: T6.0
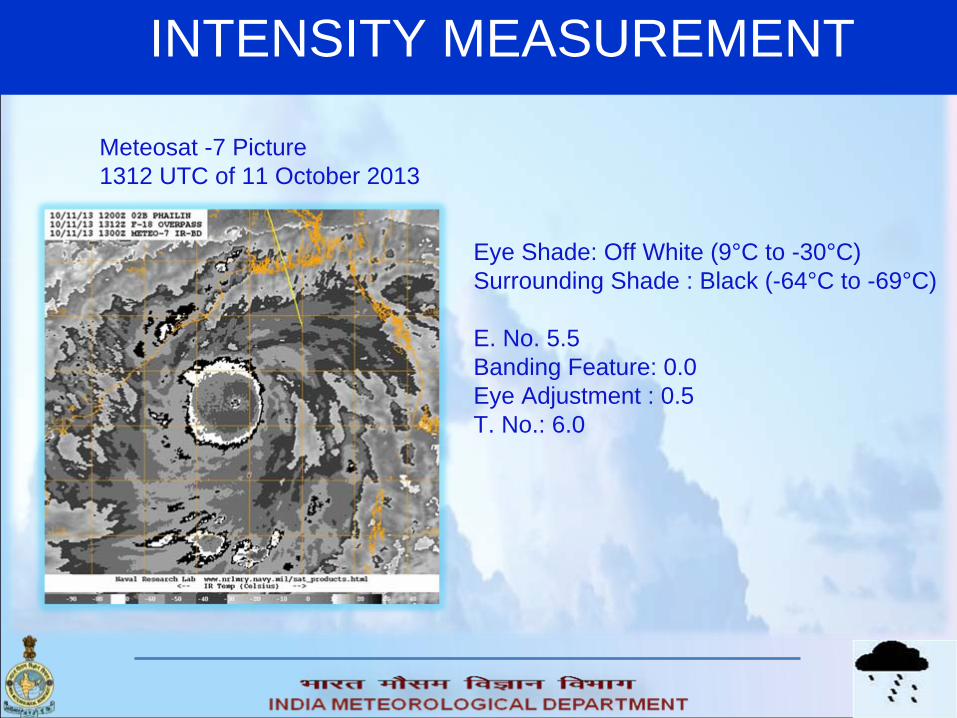
INTENSITY MEASUREMENT
Meteosat -7 Picture 1312 UTC of 11 October 2013
Eye Shade: Off White (9°C to -30°C)Surrounding Shade : Black (-64°C to -69°C)
E. No. 5.5Banding Feature: 0.0Eye Adjustment : 0.5T. No.: 6.0

LANDFALL
The VSCS ‘Phailin’ crossed Odisha adjoining Andhra Pradesh coast (near Gopalpur)at 1600 UTC of 12th October at 19.26N/84.82E
1600 UTC of 12.10.2013 (IR)

SATELLITE BULLETIN DATED 09.10.2013 DURING VSCS PHAILIN


SPL SATELLITE BULLETIN BASED ON SATELLITE IMAGERIES AND PRODUCTS
Dated: 08.10.2013 Time: 0600 UTC
TCIN50 DEMS 080600SPL SATELLITE BULLETIN BASED ON INSAT PIC OF 080600 UTC (.) VORTEX OVER ANDAMAN SEA CENTERED WITH IN HALF A DEG OF 12.0N/95.5E (.) INTENSITY T1.5 (.) ASSTD BKN LOW/MED CLOUDS WITH EMBDD INT TO V INT CONVTN OVER ANDAMAN SEA ADJ AREA BET LAT 9.0N TO 15.0N EAST OF LONG 88.0E & TENASSERIM COT (.) THE SYSTEM IS MOVING IN WESTWARD DIRECTION & LIKELY TO INTENSIFY FURTHER DURING NEXT 24 HRS (.) MICROWAVE IMAGERY OF 0417 UTC OF TRMM INDICATES THE CENTRE 12.2N/95.0E AND VISIBLE IMAGERY OF MTSAT-2 SUGGESTS THE CENTRE 12.0N/95.5E (.) TOO: 08/1235EF=
0600 UTC of 08.10.2013 (VIS)

PHAILIN
There has been a lot of discussion about the maximum intensity of Tropical Cyclone Phailin .
According to Satellite Meteorology Division of IMD the Maximum T. No. was T6.0 from 0300 UTC of 11th October to 1600 UTC of 12th October.
According to SSD NOAA & JTWC Maximum T. No. was 7.0

POSITION & INTENSITY AS PER SATELLITE (IMD)Date Time Lat Long Intensity
(UTC) (°N) (°E) (T No)Date Time Lat Long Intensity
(UTC) (°N) (°E) (T No)

POSITION & INTENSITY ACCORDING TO SSD NOAA

INTENSITY MEASURED BY DIFFERENT AGENCIES

T. NO. - SATMET VS CIMSS
Date-Time

AVERAGE SPEED OF PHAILIN
Date-wise average speed (Km/hr) of the cyclone ‘Phailin’
Km/hr


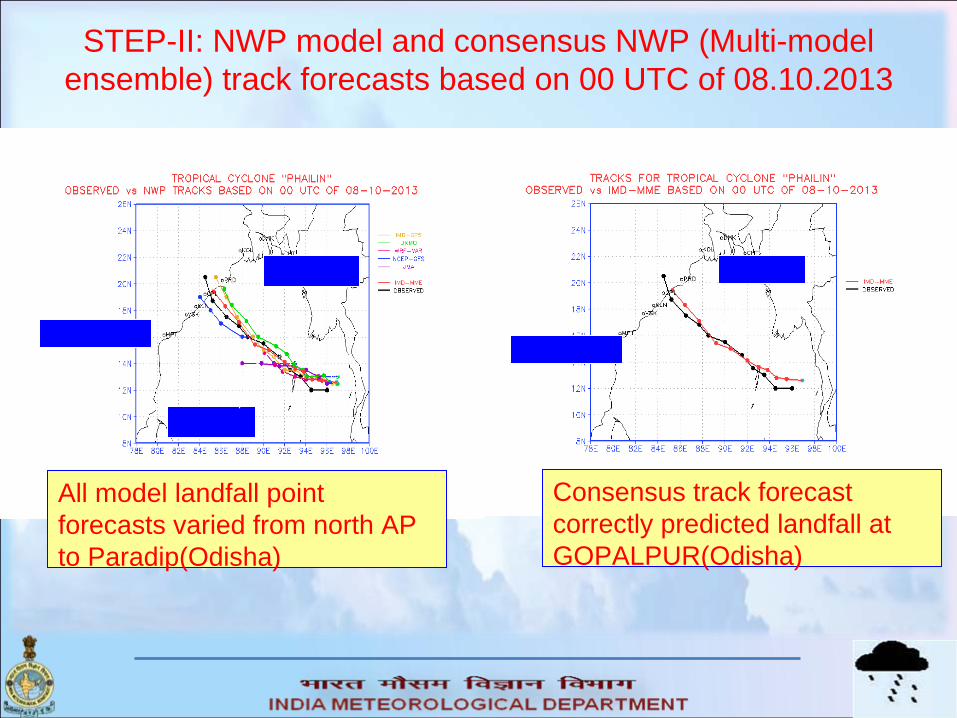
STEP-II: NWP model and consensus NWP (Multi-model ensemble) track forecasts based on 00 UTC of 08.10.2013
OBSERVED
MMEUKMO
JMA
OBSERVED
Consensus track forecast correctly predicted landfall at GOPALPUR(Odisha)
All model landfall point forecasts varied from north AP to Paradip(Odisha)
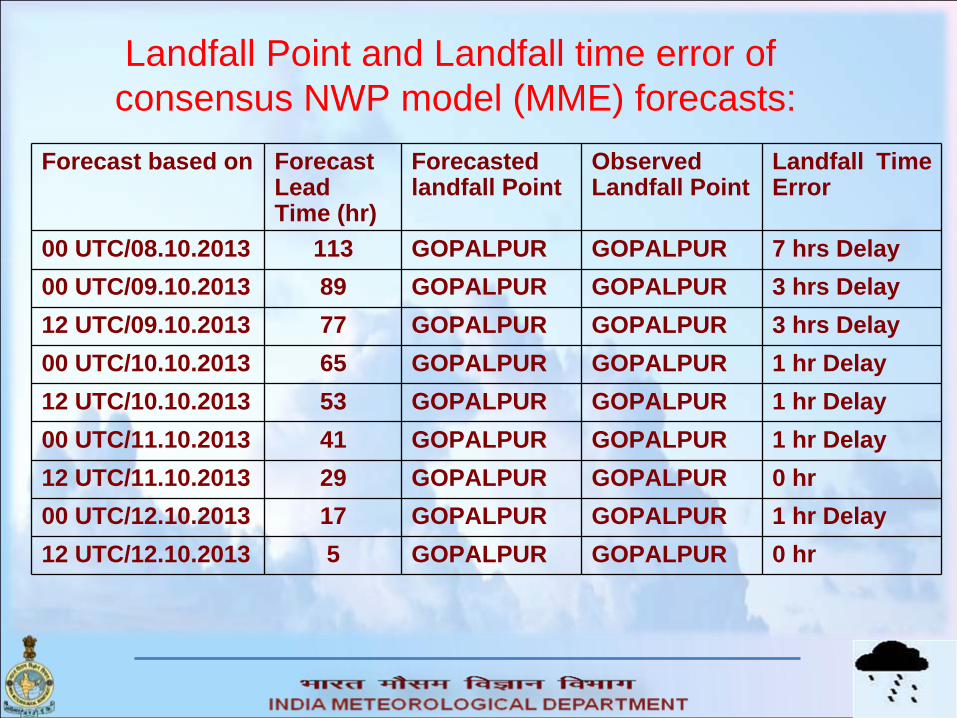
Forecast based on Forecast Lead Time (hr)
Forecasted landfall Point
Observed Landfall Point
Landfall Time Error
00 UTC/08.10.2013 113 GOPALPUR GOPALPUR 7 hrs Delay00 UTC/09.10.2013 89 GOPALPUR GOPALPUR 3 hrs Delay12 UTC/09.10.2013 77 GOPALPUR GOPALPUR 3 hrs Delay00 UTC/10.10.2013 65 GOPALPUR GOPALPUR 1 hr Delay12 UTC/10.10.2013 53 GOPALPUR GOPALPUR 1 hr Delay00 UTC/11.10.2013 41 GOPALPUR GOPALPUR 1 hr Delay12 UTC/11.10.2013 29 GOPALPUR GOPALPUR 0 hr00 UTC/12.10.2013 17 GOPALPUR GOPALPUR 1 hr Delay12 UTC/12.10.2013 5 GOPALPUR GOPALPUR 0 hr
Landfall Point and Landfall time error of consensus NWP model (MME) forecasts:

Processed Radiance data Source: ftp NCEP
Assimilation (6 hourly)(1) AMSU-A & B (Advanced Microwave Sounding Unit) (2) HIRS-3 & 4 (High-Resolution Infrared Radiation Sounder)(3) IASI (Infrared Atmospheric Sounding Interferometer)(4) AIRS (Atmospheric Infrared Sounder)(5) AMSRE (Advanced Microwave Scanning Radiometer - Earth Observing System)(6) GOES (Geostationary Operational Environmental Satellite)(7) MHS (Microwave Humidity Sounder)(8) TRMM (Tropical Rainfall Measurement Mission)(9) SBUV/8 (Solar Backscattered Ultraviolet system/Version 8)(10) GPS RO (GPS Radio occultation)

Assimilation of satellite winds (source GTS)
• GOES (East & West)• Meteosat-7, Meteosat-9• MTSAT-1R• MODIS (TERRA and AQUA)• EUMETSAT including Meteosat Second Generation (MSG)
• Japan Sat Wind • ASCAT

To avoid discrepancies between different international agencies workshop on satellite based analysis of tropical cyclones needs to be arranged yearly
Suggestion

Thanks