use of scan overlap redundancy ^ to enhance … · gathering instrument for passive remote sensing...
TRANSCRIPT

: ; ; ; ; : : ; ; ; • ; ; ; ; ; ; ; ; : ; : ; ; ; ? ; ;N;7^3; •$*. _ . , . . , . • i ~ " :- '>rv , r > r . . . ? -v : . ; . . •=• -.•••^ • - . - . . - . > ; . , . : , , ;
LARS Information Note 120271% r: ; r; ;; :
<~ .J> c'TJ> :
CASE FILECOPY
Use of ScanOverlap Redundancy ^To Enhance MultispectralAircraft Scanner DataS
J. C.,Lindenlaub and
|pr::Aepfi t;ions a Rehfibte•
Burdue c University ,>,W(est Lafayette,
https://ntrs.nasa.gov/search.jsp?R=19730013668 2018-05-30T19:49:29+00:00Z

USE OF SCAN OVERLAP REDUNDANCY TO ENHANCE
MULTISPECTRAL AIRCRAFT SCANNER DATA*
J. C. LindenlaubJ. Keat
INTRODUCTION
The multispectral scanner has proved to be a basic data-gathering instrument for passive remote sensing systerns.(1) (2)A multispectral scanner is basically a multiband spectrometerwhose instantaneous field of view is scanned by means of amirror rotating across the scene. A conceptual drawing of amultispectral scanner mounted in an aircraft is shown in Figure1. At a given instant the device is gathering energy from asingle resolution element. The energy from this element passesthrough .appropriate optics, is separated into different fre-quency bands by means of a prism (for visible bands) or a grat-ing (for infrared bands), and is measured by a bank of detectors,The detector outputs are recorded on board the aircraft ortransmitted to a ground station.
As the mirror rotates, a path perpendicular to the forwardmotion of the aircraft is scanned (see Figure 1), and, succes-sive scans cover the target area in the direction of flight.When parameters of the data-gathering system have the properrelationships, successive scans will be contiguous to eachother. Scanner rotation which is slow relative to the othersystem parameters results in underscan, that is, successivescans separated from each other as shown in Figure 2; scannerrotation which is fast relative to other system parametersresults in overscan, that is, successive scan lines overlappingeach other. A typical situation is shown in Figure 3.
Most of LARS' multispectral aircraft scanner data is over-scanned. As a result when .the data are converted to digitalformat not every scan line is digitized. This study was under-taken to develop techniques which could make use of the infor-
"The work described In this report was sponsored in whole or inpart by the National Aeronautics and Space Administration (NASA)under Grant NGR 15-005-112.

-2-
Ground rfesoiu'fjon
Figure 1. Aircraft mounted multispectral scanner.
Directionof flight
this strip notcovered
circular resolution area
Figure 2. Example of successive scan lines when aircraft groundspeed and scanner speed of rotation are such that under scanningoccurs. The two circular resolution areas are drawn to emphasizethe ground area represented by digitized data points from thesame column and adjacent lines.

-3-
Directionof flight
His strip coveredtwice
Figure 3a. Examples of successive scan lines when aircraftground speed and scanner speed of rotation are such that overscanning occurs. (To keep the drawing simple, a case of onlya small amount of overlap is shown.)
•i^r-center points of resolution areas
t ::^<-one resolution area*i?"
Figure 3b. Resolution elements corresponding to data pointsin the same column when the amount of scan overlap is large.(The number of redundant scan lines is large.)

—it-
mat ion contained in the scan lines not now digitized. Basi-cally the idea is to average the sample values of severaloverlapping scan lines. The trade-offs between resolution andthe signal-to-noise ratio resulting from this operation arediscussed in the next section. Criteria for choosing theaveraging coefficients are then presented, followed by a des-cription of the implementation of the procedure and an evalu-ation based on using the method on a particular flightline.
RESOLUTION VS. SIGNAL-TO-NOISE RATIO TRADE-OFFS
In order to understand the trade-offs between signal-to-noise ratio and resolution which result from averaging severalscan lines, it is necessary to understand the temporal andspatial relationships between sample values from the analogtape and ground resolution elements. Figure U shows theserelationships for a situation in which there is no scan over-lap or underlap. Note that samples in a row are adjacent intime whereas samples in a column are separated in time by anamount which corresponds to the time required for one revolu-tion of the scanner.
The scanner-produced signal on the tape is noisy. Typicalsources of noise include shot noise in the sensors, atmosphericscattering, electronic and mechnical tape recorder noise, etc.It is reasonable to assume that the signal on the tape is thesum of two components: a desired component proportional to theirradiance at the scanner aperture, and an undesired or noisecomponent caused by imperfections in the electronic system. Thenoise is described by its mean value and autocorrelation function.The period of time over which the noise can be expected to becorrelated is equal to one-half the reciprocal of the recordersystem bandwidth. When typical scanner parameters are used,the noise components of adjacent values in the same row, becausethey are adjacent in time, can be expected to be correlated,while the noise components of adjacent values in the samecolumn, because they are separated in time, can be expected tobe uncorrelated. It is because the noise components in thecolumn direction are uncorrelated that one can achieve an improve-ment in signal-to-noise ratio by averaging lines of data. Foruncorrelated samples the noise standard deviation will decreaseas V'ji' where N is the number of lineas averaged.
VJTIn the absence of scan overlap, averaging of scan lines has
the effect of decreasing the resolution in the column direction.With scan overalp, the decrease in resolution does not becomeserious until the number of lines averaged begins to exceed thenumber of redundant scan lines.

-5-
oo
oo>
ooo
o<o
leuuoqo ui SOUDUDA
o o o o oin 'fr ro cvj —
Oo
OCO
3rHid
( I
in oo>
inoo
ooo
ot- m(0
O<o
inin O
in
oCM
f
10
IO
cvj
0)
10
bO-P3.
C O0)0) -P5 C•P-H0) b
CO 0)
«0O
(0 tOCO >»
•rl 1TJ•P ^id bo
QJ
id
•rl Q)•P ftid (d
|S9i x)^ (%) Xooinooy
CQ
•osI
•H
t

-6-
The trade-off between resolution and signal-to-noise ratiois determined by the number of lines averaged. Averaging morelines will improve the signal-to-noise ratio but at the cost ofdecreased resolution. The next section proposes criteria forchoosing the number of lines to average and the weighting co-efficients to use.
CRITERIA FOR CHOOSING WEIGHTING COEFFICIENTS
Overview
Having pointed out the trade-off between the resolutionand signal-to-noise ratio, we now consider the problem of choos-ing the weighting coefficients. In order to evaluate theseriousness of loss in resolution, a measure of resolution errormust be devised. This is the first problem treated in this sec-tion of the report. It is shown that the size of the resolu-tion error depends upon, among other things, the weightingcoefficients. Then noise reduction as a function of the numberand relative values of the weighting coefficients is treated.It is shown that maximum noise reduction is achieved with equalweighting coefficients.
Two approaches to optimizing the resolution/signal-to-noise-ratio trade-off are then presented. In -the first approachequal weighting coefficients are used and the number of linesaveraged is choosen so that the resolution error equals the noiseerror. In other words, the number of lines averaged is increaseduntil the point is reached where the resolution error just equalsthe noise error. In the second approach the weighting coefficientsare choosen so as to minimize the sum of the resolution error andthe noise error.
Resolution Error Measurement and Computation
It is shown below that for a given scanner-aperture geometrythe resolution error depends upon the number and relative magni-tude of the weighting coefficients, the number of redundant scanlines, D, and the line increment, I.
It has been assumed in the following that the scanner opticsare such that the detectors respond to a circular resolution areaon the ground and that the response of the scanner is uniform overthe resolution area. The relationship between D and I is shown inFigure 5. In this figure, the dots separated by distance S rep-resent the centers of the resolution elements of adjacent scanlines. For simplicity it is assumed that the velocity of the

-7-
Direction of Flight. >
S |<— Resolution element spacing between adjacent scan lines
1-1-3 <+4 *+5
—>| r = diameter of 1 resolution element [
Is
Figure 5. Number of redundant scan lines D is defined by therelation r=(D+l)s .

-8-
aircraft and scanner speed of rotation are related such that r,the diameter of one resolution element, is KS where K ia aninteger. The parameter I is best described in terms of howmultispectral scanner data is handled when no line averagingis done. With no line averaging, only every Ith scan line isdigitized; I and the sampling rates are determined so as toobtain the desired aspect ratio for display purposes. Inorder to maintain the proper aspect ratio when averaging lines,one line of averaged data must be produced for each Ith line ofthe original tape.
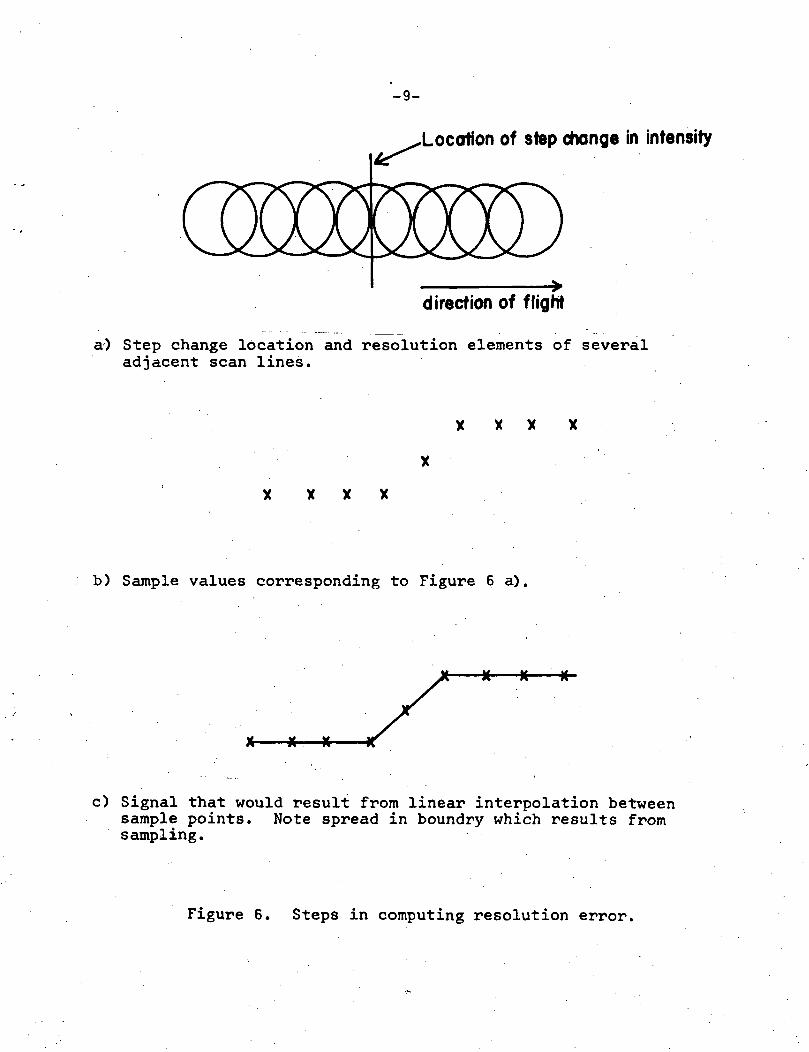
Resolution error will be defined with respect to a stepchange in ground intensity along a direction perpendicular tothe direction of flight. The resolution error is defined asthe average of the integral-squared error between the line-averaged signal and the step change. The "average" in thisdefinition is with respect to the uncertainty of the locationof the step which occurs when I > D+l. The steps in the com-putation are illustrated in Figure 6 for the case of oneredundant scan line and 1=3. Figure 6a shows the step boundaryand resolution elements for several adjacent scan lines. Ifevery line of the tape were used, sample points as shown inFigure 6b would result from the digitization process. If asignal were to be reconstructed by connecting the sample pointswith straight line segments, it would appear as in Figure 6c.Note here that the step change is distorted even without lineaveraging. If a series of pictures analogous to Figure 6c weredrawn with the number of redundant scan lines increasing frompicture to picture, the sample points would get closer togetherand approach a continuous curve. The shape of the curve isdependent upon the geometry of the resolution element and thedirection of the boundary with respect to the flight direction.The curve for a circular aperture and a step change perpendicu-lar to the direction of flight is shown in Figure 7.
Before introducing any line averaging into the example,consider .what would happen if only every third scan line wereused. Then, depending on where the counting process began, oneof the three signals shown in Figure 6d could result. Notethat selecting every Ith scan line introduces additional"spreading" of the boundary region and, assuming each of thecases is equally likely, introduces an uncertainty regardingthe boundary location. It is with respect to this uncertaintyin boundary location that the resolution error will be aver-aged.
To continue the example, Figure 6e shows the result ofaveraging three lines using equal weighting coefficients. Each
-9-
Location of step change in intensity
direction of flight
a) Step change location and resolution elements of severaladjacent scan lines.
X X X X
X X X X
b) Sample values corresponding to Figure 6 a).
-X K -*•
X X K
c) Signal that would result from linear interpolation betweensample points. Note spread in boundry which results fromsampling.
Figure 6. Steps in computing resolution error.

-10-
d) Three possible signals resulting from selecting every thirdsample. Note additional spreading of boundry.
-*•
e) Result of averaging 3 lines with equal weighting coefficients,
-X * St, K X-
f) Overscanned error signal. Figure 6 b)minus Figure 6 e)
Figure 6. (continued)

-11-
g) Three (I) possible error signals resulting from selectingevery third sample of line averaged signal (Figure 6 e).
ic (o+a2+o) + (o+o) •»• (o+a2+o) ]o
h) Computation of mean square resolution error,error corresponding to ei of Figure 6 g).
is squared
Figure 6. (concluded)

-12-
a) Result of convolving circular aperture with step change in- intensity.
Boundry
b) Aperture position for sample points shown in a).
Figure 7. Response of circular aperture to step change inintensity.

-13-
new data point is computed using the relationship
"new (i) • jL,.TXold (it !»•
In general the weighting coefficients are constrained so that
NI o. = 1
j»l 3-
where N is the number of lines averaged.
An overscanned error signal is defined as the differencebetween the original step change and the line-average data."Overscanned" signifies that this signal includes every scanline. The overscanned error signal for this example is shownin Figure 6f. Selecting every third data point (1=3) andconsidering the three possible starting points results in thethree error signals shown in Figure 6g. Also shown are thecorresponding squared errors. The final step in computing theresolution error is to average the I squared errors, Figure 6h.
Summarizing the computation of the resolution error for agiven set of parameters, D, I, N, a., i=l, 2, ...N, one firstcomputes the sample points corresponding to the output of thescanner for each scan line. This computation will be depen-dent upon the geometry of the resolution element. A new setof data points is then generated using the N weighting coef-ficients ai, 02, ...ou.. An overscanned error signal is obtainedby taking the difference of the averaged data points and thestep change. I error signals are then obtained by choosingevery Ith scan line. I such signals are formed depending onwhich sample point is chosen as the initial point. Finally, thesum squared errors are found for each of the I error signals andaveraged. The resulting resolution error depends upon thescanner-aperture geometry, number of redundant scan lines D, theline increment I, and N weighting coefficients ai, 02, . ..ot».
Noise Reduction by Averaging
The amount of noise reduction which is achieved by aver-aging N lines is now considered. Assuming that the noise iszero mean, and stationary and that noise samples from differentscan lines are independent, the noise variance after averagingN lines is given by:

Na 2 = a2 Z a.2N 1=1 1
where a2 is the noise variance before averaging. Recall thatthe weighting coefficients satisfy the relationship
NZ a. = 11=1 1
so that
If it were desired to minimize oN2 without regard to resolu-
tion error the (oi) should be chosen to minimize the sum of thesquares of the oi subject to the constrant given above. It canbe shown that the sum of the squares will be minimized when
The noise variance after averaging is then aN2 = sy 02. The rms
value of the noise is reduced by 1//J7.
Averaging scan lines to form new lines of data has oppositeeffects on the mean square resolution error and mean squarenoise. As the number of lines averaged increases, the noisedecreases but the resolution error increases. Two criteriafor choosing the weighting coefficients are discussed next.The first criterion uses equal weighting coefficients (becausethis gives maximum noise reduction for a fixed number ofcoefficients) and chooses the number of lines to be averagedso as to make the resultant noise error equal to the resolutionerror. The second criterion chooses the weighting coefficientsso as to minimize the sum of the resolution error and meansquare value of the noise.
Equal Error Criterion
Under this criterion equal weighting coefficients are usedand the number of weighting coefficients is chosen so as tomake the resolution error equal to the noise error. Anotherway to view this criterion is that more and more lines areaveraged until the resolution error introduced by the averagingprocess equals the noise error. For a given signal-to-noiseratio the optimum number of lines to average can be found byequating the errors

-15-
Er (N) A2 = o2 J
where E 2(N) is the resolution error associated with a unitstep chSnge in signal and A is the amplitude of the step change.Rewriting
Af_ X
a2 N Er2(N)
2
Interpreting ^ as a measure of the signal-to-noise ratiobefore averaging, ** the last equation can be used to find theoptimum number of weighting coefficients for a given inputsignal-to-noise ratio.
A computer program was written to determine the optimumnumber of lines to average for a given signal-to-noise ratioA2/a2.
Minimization of Total Error Criterion
Although uniform weighting minimizes the noise variance ofthe averaged data, the mean square resolution error may bereduced if nonuniform weighting is used. A second -criterionfor choosing the weighting coefficients is to choose the numberof lines to average, N, and the relative size of the coefficients,the a., so as to minimize the sum of the mean square resolutionerror and the mean square noise error.
For purposes of this study, a general minimization was notcarried out. Instead, programs were written to find the bestset of linearly or exponentially decaying coefficients. Resultsfor these two weighting procedures were sufficiently close toconjecture that the total error is not highly dependent on theexact functional relationship between the weighting coefficientsbut depends more on the rate at which the coefficients decay.
IMPLEMENTATION OF LINE AVERAGING
The previous section has established criteria for choosingthe number and value of the weighting coefficients. The selec-tion of a criterion requires knowledge of the channel signal-to-noise ratios. Determining these ratios and a number of otherpractical problems associated with the implementation of theline-averaging technique are treated in this section.

-16-
A Working Definition of Signal-to-Noise Ratio
A measure of the noise power, a..2 , can be obtained byassuming that variations in the signal on the bulk tape cor-responding to the dark part of the scanner are due solely tonoise. This assumption seems reasonable for the visiblechannels, since the interior of the scanner is designed to beuniformly dark. For the IR channels it is also necessary toassume that the interior of the scanner is at a constant tem-perature. The mean square value of the noise was estimated byusing a program called CENTROID. Used with the bulk data tape,CENTROID computes the variance of the signal corresponding tothe dark region of the scanner.
By assuming that the signal on the portion of .the scanline corresponding to the field of view is the sum of thedesired signal plus noise, a measure of the total power (desiredsignal plus noise), aT
2, can be obtained. The working .definitionused for the total power was the square of 1/6 times the dynamicrange of the signal associated with that part of the scan linecorresponding to the field of view. The factor 1/6 arises fromthe fact that under appropriate assumptions the "peak-to-peak"value of a gaussian random process is six times the standarddeviation. The total power was estimated by examining severaltypical'lines of the bulk data tape.
As a check, another method of computing the total powerwas tried. The average line variance over the run 5T
2, was de-fined as
2222 . J- r& ^ r
T " \ ill 1™
where N^ is the number of lines consideredS-J4 is the jth sample in the ith line222 is the number of samples in a line
and y^ is the mean of the ith line.3T
2 and aT2 did not differ greatly in the cases tried.
Combining the methods for obtaining aN2 and OT2 the follow-
ing working definition for signal-to-noise ratio (SNR) was used.
aT2 ~ VSNR = —= ; —
Note that as used here SNR represents a power ratio,

-17-
How to Handle Calibration Values
At the end of each line of data on a LARS data storage tapethere are three calibration number denoted CO, Cl, C2. Thesenumbers may be used to calibrate the data in a variety of dif-ferent ways (3). The question arises as to how to handle thesecalibration numbers when averaging lines of data.
Analysis shows that for a one-point calibration (clamping),the calibration values CO, Cl and C2 should be averaged in thesame manner as the data points. This result is also true fortwo-point calibration provided the signal-to-noise ratio of theoriginal data is large.
Data Storage Tape Generation
One of the requirements of the investigation was to pro-duce a data storage tape in the standard LARS format. To theaverage user, this data storage tape should have the same for-mat as the data storage tapes currently produced. Two approacheswere possible:
1) Sample every line of the analog tape; reformat usingthe present reformatting program to produce an inter-mediate data storage tape which has every scan lineon it; and use a program called LINAVE to produce afinal data storage tape where each line is the averageof several adjacent lines.
2) Sample every line of the analog tape; use a modifiedreformatting program to do the line averaging andproduce a final data storage tape in one operation.
In the research phase the first of these approaches was used.This decision was based primarily on the fact that a version ofLINAVE was available and could be used with only minor modifi-cations.
Need to Degrade Signal
In the course of the investigation described in the nextsection, evaluation of the line-averaging technique was hamperedby the fact that classification accuracies even without any lineaveraging were so high that it was virtually impossible to showany decisive improvement in classification accuracy as a resultof line averaging. In order to evaluate the technique in a lessmarginal situation, the original data was degraded by addingindependent gaussian noise samples to each sample point in eachchannel. The technique used was similar to that employed byWhitsitt (4).

-18-
EVALUATION: ACTUAL USE OF METHOD
It would be highly desirable to evaluate the use of scanoverlap redundancy to enhance multispectral data from the stand-point of several user situations such as ground cover classifi-cation accuracy, thermal mapping of water resources, soils studies,crop yield studies, degree of plant stresses, etc. In this study,the use of scan overlap redundancy was evaluated in terms ofclassification accuracy. Its usefulness in other applicationsis yet to be evaluated.
LARS data run 69002901 was chosen for the study. This dataset is representative of agricultural ground cover found in cen-tral Indiana. The data was gathered in June, 1969. To achievethe proper aspect ratio, every seventh line of the analog tapewas originally digitized. In order to evaluate the line-averagingtechnique, all lines of the first part of the run, a total of 1600X 7 = 11200 lines, were redigitized. This corresponds to thefirst 1600 lines of the original data storage tape or about 1/4of the total flightline. The decision to redigitize up to line1600 was based on the fact that, in a previous analysis of thisflightline, most of the training fields and many test fields fellwithin this portion of the flightline. Redigitization of theentire run would have required an excessive number of bulk anddata storage tapes. The redigitized run denoted as 69002904required eight bulk tapes and two data storage tapes.
Channels 1, 7, 10 and 11 were selected as the subset ofchannels which would be used for classification. This was doneupon the recommendation of Paul Anuta, who was familiar with theclassification of run 69002901.
The noise variance, total signal variance, and SNR areshown below for each channel. Although the SNR's are differentfor different channels, which implies different weighting, onlythe case of equal weighting was considered for all channels.Weighting coefficients based on the channel with the lowest SNRwere used on all channels since using a different set of coef-ficients on different channels would have the effect of intro-ducing different resolution errors in different channels.
Channel
1
7
10
11
V81.0
184. 0
144.0
144.0
V1.0
1.0
1.8
3.9
SNR
80.0
483.0
80.0
36.0

-19-
Th e number of redundant scan lines was found to be betweenone and two.*
Using the estimated values for the number of redundant scanlines (2), line increment (7), and SNR (40), the weighting pro-grams were used to find the best weighting coefficients.
One program choose the ou so as to produce triangularweighting. Using this program it was found that for N linesaveraged, the weighting ratios and total square error (TERR)areas were as shown below.
N Weighting Coefficient Ratios TERR
1
23
4
1
1:110:25:10
10:103:103:10
1.972
2.1718
1.6220
2.1584
For N greater than four the total square error is greaterthan that for N=3. Thus, this program indicates that usingthree weighting coefficients having the ratio 10:25:10 or0.222:0.556:0.222 is best. Using the program which ranks thefifty best weighting coefficients gave exactly the same weight-ing coefficients for the best case. ,
The large SNR's and correspondingly small number of linesto average indicated that noise was not a severe problem withthis data and that averaging would probably not enhance thedata much.
Because of possible differences in bias and gain levelsbetween the original run 69002901 and the redigitized run69002904, it was decided not to compare classifications of line-averaged data with 69002901 classifications directly. Insteadthe LINAVE program was used to generate a tape (69002907) whichconsisted of every seventh line of 69002904. If digitizationhas been started at exactly the same spot on the analog tapeand if the bias and gains used when 69002904 was digitized hadbeen equal to those used when 69002901 was digitized, 69002907would have been identical to 69002901. Training and test fieldsused on 69002901 were found on 69002907 and a classification made.Results were nearly identical to those obtained by using thefirst 1600 lines of 69002901.
"In the theoretical considerations treated in previous sectionsit was assumed that the scanner overlap was such that it could bedescribed in terms of an integer number of scan lines. In practicethis may not be the case.

-20-
Trial line-averaging runs using equal weighting coefficientsrevealed that classification accuracy was not sensitive toresolution error. This result may be due to the fact that train-ing and test field boundaries often lie within the physicalboundaries of the field and that errors introduced near theboundaries do not have a large effect on classification accuracywhen the fields are large. As a result of the observations itwas decided to carry out the remainder of the evaluation usingequal weighting coefficients.
Table 1 shows classification accuracies achieved by' usingLINAVE to average and select lines from run 69002904 so as toproduce data storage tapes wherein each line is the average ofseveral adjacent lines. It is seen from these results that .nosignificant improvement in classification accuracy occurred.This fact is attributed to the relatively high signal-to-noiseratio on the original tape.
In order to evaluate the line-averaging concept under morenoisy circumstances, LINAVE was revised to allow the additionof uncorrelated gaussian noise to each sample in all channelsbefore averaging. The new program was named NOISEAV." Thenoise was generated by the subroutines GAUSS and RANDU.
A noisy run, run 69002908, was constructed by adding noisehaving a8.0 bins (out of 256) to run 69002904. Averaging overvarious numbers of lines was tried on the redigitized run witho=8.0 noise added.
The SNR for each noisy channel is shown below for run69002908.
Channel
17
10
11
V155.0
548.0
208.0
208.0
V65.0
65.0
65.8
67.9
SNR
1.23
7.45
2.16
2.07
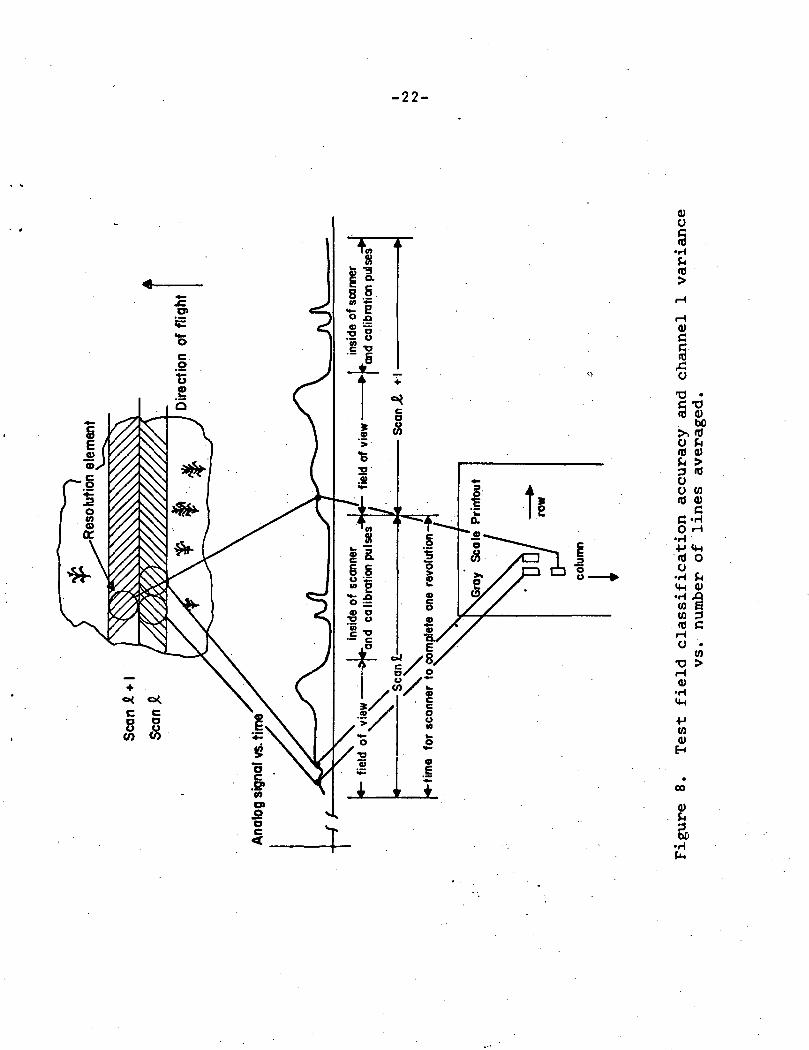
Averaging had a very beneficial effect on the noisy data as canbe seen in Table 1 and 2 and Figure 8.
It is seen that line averaging significantly improves dataquality when the initial signal-to-noise ratio is small.

-21-
Table 1.
RUN
69002904
69002905
6900290.6
69002907
69002915
69002917
69002908
69002909
69002911
69002910
69002916
Classification accuracy as a function of number oflines averaged (N) for run 69002904 (no noise added)and run 69002908 (gaussian noise with a=8 added)
N
1
2
3
7
14
28
1
3
5
7
14
o_
--
-
--
8.0
8.0
8.0
8.0
8.0
TRAIN
94.9%
95.6
95.9
95.9
95.7
95.4
80.4
88.3
91.0
91.9
93.4
TEST
82.8%
83.2
83.5
83.7
84,2
84.3
72.1
78.7
82.2
82.2
84.6
Table 2.
RUN69002904
69002905
69002906
69002907
69002915
69002917
69002908
69002909
69002911
69002910
69002916
Average line
Channel 1138.6
135.8
134.8
127.5
117.6
113.2
203.0
156.3
143.7
136.7
122.2
variance for
Channel 7
611.9
605.2
599.8
578.2
547.9
532.9
674.0
620.8
600.9
586.4
552.0
the runs shown
Channel 10
1047.1
1040.0
1035.5
1018.7
995.3
983.1
1111.7
1056.7
1038.8
1027.7
999.8
in Table 1.
Channel 11
529.2
520.2
515.3
506.6
493.8
487.3
593.7
535.7
523.6 .
515.8
498.3
-22-
0)o
(t
0)
Io
c -oid a)
bO>>««o fcrtf 0)fc >3 «JOO (0Iti 0)
cC'HO rH
•H•M «4nfd OO
•H bMH 0)
(0(0mo •
(0•o ><u
•HIM•Pwd)
CO

-23-
SUMMARY
The use of scan overlap redundancy to enhance multispec-tral aircraft scanner data has been studied. Two criteria weresuggested for optimizing the resolution error versus signal-to-noise-ratio trade-off. The first criterion uses equalweighting coefficients and chooses n, the number of lines aver-aged, so as to make the average resolution error equal to thenoise error. The second criterion adjusts both the number andrelative sizes of the weighting coefficients so as to minimizethe total error (resolution error plus noise error). Theoptimum set of coefficients depends upon the geometry of theresolution element, the number of redundant scan lines (d), thescan line increment (I), and the original signal-to-noise ratioof the channel. Programs were developed to find the optimumnumber and relative weights of the averaging coefficients.
A working definition of signal-to-noise ratio was givenand used to try line averaging on a typical set of LARS data.Line averaging was evaluated only with respect to its effecton classification accuracy. Trial runs indicated that clas-sification accuracy was not very sensitive to resolution error.*Thus equal weighting coefficients were used in the 'evaluation.To illustrate the potential benefits of line averaging for verylow signal-to-noise situations, noise was added to the originaldata before line averaging. Averaging of seven adjacent scanlines increased the correct classification from 73% to 82% forthe noisy data.
For purposes of this study, line averaging was accomplishedby generating one data storage tape from another data storagetape. If used operationally, it is recommended that the line-averaging operation be carried out as part of the reformattingoperation.
"This result is obviously data-dependent. Border effects willbe minimal if test fields are large and lie well within thephysical boundaries of the field. Border effects may not benegligible if test fields are small.

-24-
References
1. Holmes, R. A., R. B. MacDonald. The Physical Basis ofSystem Design for Remote Sensing Agriculture. Proceedingsof the IEEE, Vol. 57, No. 4, April, 1969.
2. Landgrebe, D. A. Systems Approach to the Use of RemoteSensing. LARS Information Note 041571, Laboratory forApplication of Remote Sensing, Purdue University, 1971.
3. Phillips, T. L. Calibration of Scanner Data for OperationalProcessing Programs at LARS. LARS Information Note 071069,Laboratory for Applications of Remote Sensing, PurdueUniversity, 1969.
4. Whitsitt, S. J. Random Noise in Multispectral Classifica-tion. LARS Information Note 102670, Laboratory forApplications of Remote Sensing, Purdue University, 1970.