use of the cone calorimeter to detect seasonal differences
TRANSCRIPT

CSIROPUBLISHING
www.publish.csiro.au/journals/ijwf International Journal of Wildland Fire, 2005, 14, 321-338
Use of the cone calorimeter to detect seasonal differences in selected combustion characteristics of ornamental vegetation*
David R. WeiseA,D, Robert H. WhiteB, Frank C. BeallC and Matt EtlingerC
AForest Fire Laboratory, Pacific Southwest Research Station, USDA Forest Service, 4955 Canyon Crest Drive, Riverside, CA 92507, USA.
BForest Products Laboratory, USDA Forest Service, One Gifford Pinchot Drive, Madison, WI 53726-2398, USA. Telephone: +1 608 231 9265; fax: +1 608 231 9592; email: [email protected]
CUniversity of California, 211 Mulford Hall, Berkeley, CA 94720, USA. Telephone: +1 510 231 9564; email:[email protected]
DCorresponding author. Telephone: +1 951 680 1500; fax: +1 951 680 1501; email: [email protected]
Abstract. The flammability of living vegetation is influenced by a variety of factors, including moisture content. physical structure and chemical composition. The relative flammability of ornamental vegetation is of interest to homeowners seeking to make their homes ‘fire safe’. The relative importance of the factors influencing fire behaviour characteristics, such as flammability, is unknown. In the present study, oxygen consumption calorimetry was used to obtain selected combustion characteristics of ornamental vegetation. Peak heat release rate, mass loss rate, time to ignition and effective heat of combustion of 100 × 100-mm samples of foliage and small branches were measured using a bench-scale cone calorimeter. Green and oven-dry samples of 10 species were collected and tested seasonally for a period of 1 year. Similar measurements were made on whole shrubs in an intermediate-scale calorimeter. The range of cone calorimeter peak heat release rates for green and oven-dry samples was 1-176 and 49-331kW m-2, respectively. Moisture content significantly reduced heat release rates and increased time to ignition. Peak heat release rates for Olea europea and Adenostoma fasciculatum were consistently highest over the year of testing; Aloe sp. consistently had the lowest heat release rate. The correlation of peak heat release rater measured by the cone calorimeter and an intermediate-scale calorimeter was statistically significant yet low (0.5 1) The use of the cone calorimeter as a tool to establish the relative flammability rating for landscape vegetation requires additional investigation.
Introduction Wildland fire has affected the wildland-urban interface (WUI) for decades. In the past, most of the interface fires occurred in southern California in chaparral. However, as the US population has moved, WUI fires now occur in the major-ity of states. The USA National Fire Plan recognised and is addressing this problem through activities such as hazardous fuels reduction and support of the FIREWISE programme.
One component of the FIREWISE programme involves landscape design and the selection of plants that are desirable. People choose landscaping plants for a variety of reasons that may be mutually exclusive. Plants that are adapted to areas that experience water deficits regularly may have leaves with thick cuticles, small size or pubescence (Barbour et al. 1980). Other plant adaptations to water deficits include suc-culence. These water-deficit adaptations may also influence
the flammability of the plant. Thick leaf cuticles may contain waxes and volatile compounds. Leaf pubescence and narrow leaves with high surface area-to-volume ratios can contribute to the relative ease of ignition of the plant. Succulent plants have a high moisture content that can delay ignition.
A major difficulty in developing reliable lists of recom-mended vegetation is the identification of suitable experimen-tal criteria to rank the relative fire behaviour of vegetation. There is also the potential for seasonal variations in the flammability. In the present study, we examined seasonal variations in selected combustion characteristics of a group of ornamental plant species. The study was also an evaluation of oxygen consumption calorimetry (Huggett 1980) as a means to rank the relative flammability of vegetation. Oxygen con-sumption calorimetry methodologies used included both the bench-scale cone calorimeter test and an intermediate-scale
*This manuscript was produced by a U.S. Government employee using U.S. Government funds, is not subject to copyright laws and is in the public domain.
1O.1071/WF04035 1049-8001/04/030321

322 Int. J. Wildland Fire D. R. Weise et al
test setup (Etlingerand Beall 2004). The samples tested with the cone calorimeter were small (100 × 100mm) and were composed principally offoliageand fine branches <0.64cm. In the intermediate-scale test setup, the test specimen was a small group of intact plants.
Background The relative flammability of vegetation has been examined overthepastfew decades. Anderson (1970)defined flamma- bility as a group ofcharacteristics as follows: (1) ignitability, the time required for a material to ignite; (2) combustibility, a measure of the rapidity with which a material burns; and (3) sustainability, ameasure ofhow well a material will burn with orwithout an external heat source. Differentplant char- acteristics have been used to define flammability. Radtke (1978) described 66 years of work by forestry and fire offi- cials in Los Angeles County, California, to plant native and exoticspecies in andadjacenttochaparral toprovide fire pro- tection and erosion control. Work to identify slow-burning plants that could survive in southern California began in the 1950s and plants with high mineral content were identified as fire-retardantplants (Ching and Stewart 1962). In another study, low flammability was defined as low fuel volume and several specieswere identified(Nordand Green 1977).
Vegetation moisture content and plant geometry are two of the most critical determinants of flammability. Both the size of a plant’s foliage and branches, expressed as the sur- face area-to-volume ratio σ, and the proximity of foliage and branches are important factors governing flammabil- ity (Papio and Trabaud 1990). Other components include the presence or absence of volatile compounds that may contribute to the ignition and combustion processes. Dimi- trakopoulos and Panov (2001) measured heat content, mineral ash content, s and fuel particle density as part ofan effort to assessplantflammability(Dimitrakopoulos2001).
Dimitrakopoulos (2001) and Etlinger and Beall (2004) provide a current summary of the status of vegetation flammability ratings in Europe and the US. A variety of methods have been used to measure the ignitability offorest fuels,which includeliveanddeadplantmaterial. Babrauskas (2003) reviewed the available data on the ignitability ofveg- etation. No universally accepted method of flammability rating for vegetation (UCFPL 2001) currently exists. Dif- ferent methodologies determine different characteristics that are used as measures of the relative fire hazard of the veg- etation. Common measures are related to the ignitability of the material, the rate offlame propagation or the heat release due to thermal degradation or combustion ofthe material.
As described by Etlinger and Beall (2004), the method- ologies for evaluating the fire behaviour ofvegetation differ according to scale. Many of the test methods, such as the oxygen bomb calorimeter, use small ground samples ofthe test material. The oxygen bomb calorimeter is a common test method to determine the total heat content ofa material
(Susott et al. 1975; Owens et al. 1998; Dimitrakopoulos and Panov 2001; Behm et al. 2004). Susott et al. (1975) and Susott (1982a) used the bomb calorimeter to obtain an effective heat content of the volatiles from natural fuels by subtract- ing the total heat content of residual char from the total heat content of the fuel. Thermogravimetric (TG) analysis and dif- ferential thermal analysis have been used to identify ignition temperatures and heat yields from combustion (Browne and Tang 1962; Philpot and Mutch 1968; Susott 19826; Liodakis et al. 2002). A thermal evolution analyser has been used to obtain the effective heat content of the gases evolved from samples heated in nitrogen at a controlled rate of tempera- ture increase (Shafizadeh et al. 1977) based on correlations between heat of combustion at 400°C and carbon content (Susott et al. 1975). Silica-free mineral content has also been proposed as an indicator of vegetation flammability because the mineral content tends to inhibit the combus- tion process (Mutch and Philpot 1970). None of these tests incorporates the effects of vegetation structure on flamma- bility. Another technique, the Limiting Oxygen Index, has been proposed as a measure of flammability (Mak 1988). The flammability of several species in Mediterranean cli- mates in Europe has been examined with a radiant heater (Delabraze and Valette 1981). The time to piloted ignition of 1-g samples was obtained. Dimitrakopoulos and Papaioannou (2001) tested leaves in an ISO 5657-1986E ignition apparatus (cone calorimeter; International Organization for Standard- ization, Geneva, Switzerland) to obtain time-to-ignition and ignition temperatures. Regression models relating time-to- ignition and moisture content were successfully developed for 24 species, including Cistus salviifolius.
Full-size plants represent the other extreme in specimen size. Heat release rates of full-size Christmas trees have been determined using oxygen consumption calorimetry (White et al. 1997; Babrauskas 2002a). The combustibility of larger vegetation complexes (litter, herbs and shrubs together) has been examined in a wind tunnel facility (Delabraze and Valette 1981). Tests of intact foliage represent an interme- diate scale of testing. As with the ISO ignition apparatus used by Dimitrakopoulos and Papaioannou (2001), the cone calorimeter is of a scale that pieces of foliage can be tested. Investigation of the potential use of the cone calorimeter to devise a flammability rating for vegetation (White et al. 1996) included a study of the flammability of Christmas trees (White et al. 1997). The cone calorimeter tests included sam- ples from three Christmas trees that were tested under a large hood using oxygen consumption methodology. In addition to the tests reported in the present paper, the cone calorimeter was used to examine the flammability of north-eastern USA and Colorado species (White et al. 2002).
Wildland vegetation typically exhibits an annual cycle of moisture content (Burgan 1978; Weise et al. 1998). In southern California, woody chaparral species increase their moisture content during the winter and spring months during

Seasonal changes in plant flammability
the rainy season. The moisture content generally decreases during the long, often rainless, summer and autumn. In tests of chamise, Philpot (1969) found seasonal variations in the heat content and corresponding changes in the ether extractive content. There were also seasonal changes in the heat con-tent of the extractive itself. Although it is true that these fuels are less flammable during periods when moisture content is high, good quantitative measures of the various combus-tion properties for wildland species are still lacking and it is unknown how the properties change as the plants grow throughout the year. Burgan and Susott (1991) examined the seasonal changes in three species native to the coastal plain of the south-eastern US; the data suggested seasonal differences in the low temperature (200-300°C) volatiles for one of the species. Seasonal changes in foliage terpene content, which may relate to flammability as well as air quality, have been studied. In a study of Juniperus ashei in eastern and western Texas, seasonal differences in monoterpenoid concentrations were observed that may affect flammability (Owens et al. 1998). In a study of terpene emissions from living plants at ambient temperatures, Cistus albidus exhibited seasonal dif-ferences in foliar terpene content (Llusia and Peñuelas 2000).
In the present study, the seasonal differences in combus-tion characteristics for several species used for landscaping in southern California were examined. Agreement between small-scale tests made with a cone calorimeter and larger-scale tests made in a large test facility was also examined.
Methods
Two sets of tests were performed on a variety of ornamental plant species found in southern California. The first set of experiments examined seasonal changes in the combustion characteristics determined using a cone calorimeter (peak heat release rate, average effective heat of combustion, total heat release and time-to-ignition) for 10 different species. At four times in the year (August 1995-May 1996), mea-surements were made on both green (moist) and oven-dry samples. A randomised complete-block design was used. The testing order was randomly determined within a block. At each time interval, three blocks were tested of both oven-dry and moist samples. The cone calorimeter samples (n = 240) were tested at the Forest Service Forest Products Laboratory (FSFPL) in Madison (WI, USA).
The second set of experiments in 1999 examined the correlation between heat release rate and effective heat of combustion measured by a cone calorimeter and Interme-diate Scale Biomass Calorimeter (ISBC; Etlinger and Beall 2004). Five species were selected for testing. Two or three replicate's of each species were burned in the ISBC located at the UCFPL. A replicate consisted of one or more pot-ted plants because the size of the plants varied considerably. Biomass distribution, moisture content, particle volume, par-ticle density, surface area-to-volume ratio, fuel bed height, canopy volume, bulk density, packing ratio, porosity and
Int. J. WildlandFire 323
foliage volatile fraction were determined for each species through measurement and calculation or using values from the literature. Etlinger and Beall (2004) describe, in detail, the techniques and protocols used to determine fire performance variables for the intermediate-scale tests. Small samples were collected from these plants and shipped to FSFPL for cone calorimeter testing. In the present study, a total of 13 tests was performed using the ISBC and 41 samples were tested with the FSFPL cone calorimeter.
Determining physical characteristics
Cone calorimeter samples
Prior to shipping plant samples to FSFPL for testing, a branch sample was randomly selected from each test sample for measurement to determine sample dimensions that were then used to calculate surface area-to-volume ratios (Eqn 1):
(1)
where d1 and d2 are the branch end diameters, Af, Pf and Tf
are the planform area, perimeter and thickness of an individ-ual leaf, lb is the branch length, nf is the number of leaves on a branch, S, V and σ are surface area, volume and surface area-to-volume ratio for a leaf ( f ) or branch ( b ) and σc is the composite sample surface area-to-volume ratio. A leaf area meter (Li-Cor, Lincoln, NE, USA) was used to estimate Af, a Vernier caliper was used to measure Tf to a precision of 0.05 mm and Pf was determined using a map wheel to measure the traced outline of a leaf.†
Intermediate-scale tests Between two and eight individual plants per species were
destructively tested to estimate mass distribution, density, volume and surface area. Plants were cut and divided into three biomass categories: (1) foliage that included all leaves, petioles, flowers and fruit; (2) twigs, which included all woody material ≤6 mm in diameter; and (3) stems, which included all woody material > 6 mm in diameter. The total wet mass of each category was determined by weighing. Samples from each category were selected for moisture content, vol-ume and surface area determination. Oven-dry mass mi and moisture content Mi, where i =foliage, twig or stem, were determined by drying a sample at 105°C overnight, which
†The use of trade names is provided for information only and does not constitute endorsement by the U.S. Department of Agriculture.
324 Int. J. Wildland Fire D. R. Weise et al. was sufficient to remove all moisture. The total moisture con- tent MT of a plant was estimated as a weighted sum (Eqn 2). Particle volume Vi was determined by water displacement in a 1000-mL graduated cylinder. Total density ρT and total volume VT were also calculated as weighted sums (Eqn 2):
(2)
where fi, Mi, Vi, and ρi are the mass fraction, moisture con- tent, volume and density for each dry biomass component. For the UCFPL tests, the surface area-to-volume ratio was determined by scanning a foliage sample, determining mi as above and using Eqn (3):
(3)
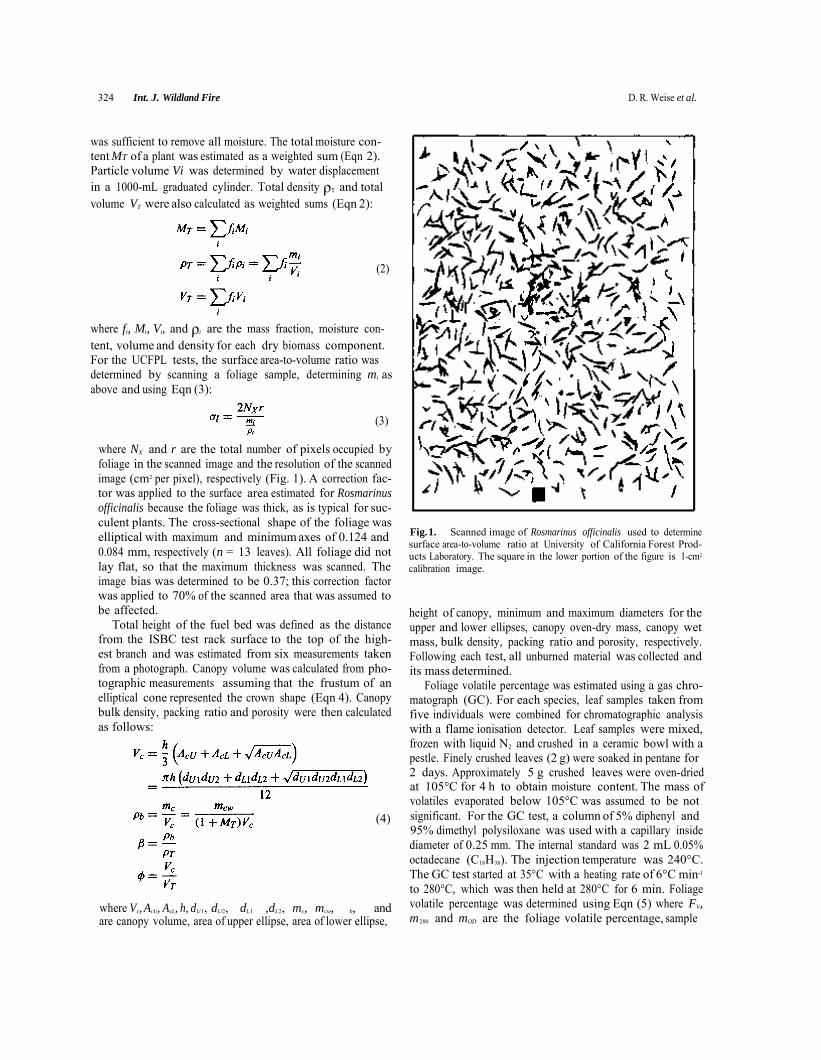
where NX and r are the total number of pixels occupied by foliage in the scanned image and the resolution of the scanned image (cm2 per pixel), respectively (Fig. 1). A correction fac- tor was applied to the surface area estimated for Rosmarinus officinalis because the foliage was thick, as is typical for suc- culent plants. The cross-sectional shape of the foliage was elliptical with maximum and minimum axes of 0.124 and 0.084 mm, respectively (n = 13 leaves). All foliage did not lay flat, so that the maximum thickness was scanned. The image bias was determined to be 0.37; this correction factor was applied to 70% of the scanned area that was assumed to be affected.
Total height of the fuel bed was defined as the distance from the ISBC test rack surface to the top of the high- est branch and was estimated from six measurements taken from a photograph. Canopy volume was calculated from pho- tographic measurements assuming that the frustum of an elliptical cone represented the crown shape (Eqn 4). Canopy bulk density, packing ratio and porosity were then calculated as follows:
(4)
where Vc, AcU, AcL, h, dU 1, dU2, dL1 ,dL2, mc, mcw, b, and are canopy volume, area of upper ellipse, area of lower ellipse,
Fig. 1. Scanned image of Rosmarinus officinalis used to determine surface area-to-volume ratio at University of California Forest Prod- ucts Laboratory. The square in the lower portion of the figure is 1-cm2
calibration image. height of canopy, minimum and maximum diameters for the upper and lower ellipses, canopy oven-dry mass, canopy wet mass, bulk density, packing ratio and porosity, respectively. Following each test, all unburned material was collected and its mass determined.
Foliage volatile percentage was estimated using a gas chro- matograph (GC). For each species, leaf samples taken from five individuals were combined for chromatographic analysis with a flame ionisation detector. Leaf samples were mixed, frozen with liquid N2 and crushed in a ceramic bowl with a pestle. Finely crushed leaves (2 g) were soaked in pentane for 2 days. Approximately 5 g crushed leaves were oven-dried at 105°C for 4 h to obtain moisture content. The mass of volatiles evaporated below 105°C was assumed to be not significant. For the GC test, a column of 5% diphenyl and 95% dimethyl polysiloxane was used with a capillary inside diameter of 0.25 mm. The internal standard was 2 mL 0.05% octadecane (C18H38). The injection temperature was 240°C. The GC test started at 35°C with a heating rate of 6°C min-1
to 280°C, which was then held at 280°C for 6 min. Foliage volatile percentage was determined using Eqn (5) where FV, m280 and mOD are the foliage volatile percentage, sample
Seasonal changes in plant flammability
mass loss from 105 to 280°C and GC sample oven-dry mass, respectively.
( 5 )
Materials For the cone calorimeter test using 10 species, samples were collected from the following species: chamise (Adenostoma fasciculatum H. & A.), aloe (Aloe sp.), saltbush (Atriplex halimus L.), wild lilac (Ceanothus ‘JoyceCoulter’), crimson-spot rockrose (Cistus ladanifer L.), sageleaf rock-rose (C. salviifolius L.), toyon (Heteromeles arbutifolia M. Roem.), prostrate myoporum (Myoporum parvifolium), olive (Olea europaea L.) and spiny saltbush (Rhagodia spinescens). All species except A. fasciculatum were located outdoors in a commercial nursery and watered regularly. Adenostoma fasciculatum was located adjacent to the nurs-ery and only received rainfall. The plants were not grown in a greenhouse. Samples of the plants were obtained by the USDA Forest Service Forest Fire Laboratory in Riverside (CA, USA) and shipped overnight to FSFPL. The green and dried branch samples with intact foliage were collected from the outer crown of each species with new growth, flowering and fruiting portions removed. Removal of these high-water content plant parts may have removed part of the effect of season on flammability; however, these plant parts comprise only a small portion of the total plant mass for the species in the present study. Maximum diameter of the branch samples was ≤6 mm. Plastic bags of green samples were kept in cold storage for up to 1 month until testing to retain moisture con-tent. The oven-dry samples were dried in a convection oven and desiccant was added to the plastic bags with the dried samples.
For the intermediate-scale tests, plants were purchased from a commercial nursery in southern California and shipped in pots to the UC Berkeley Richmond Field Sta-tion where the test facility was located (UCFPL). Five species were tested: big saltbush (Atriplex lentiformis (Torr.) S. Wats), Santa Barbara ceanothus (Ceanothus impressus Trel. ‘Eleanor Taylor’), sageleaf rockrose (C. salviifolius), spiny saltbush (Rhagodia spinescens) and rosemary (Rosmarinus officinalis L. ‘prostrata’). Two of these landscape plants (C. salvifolius and R. officinalis) are common com-ponents of garrigue, a fire-prone shrub community found in France. Plants were watered, on average, every 3 days after arriving at UCFPL until testing. Only ‘five-gallon’ size plants were used. All plants lost foliage after arrival from cold weather stress, scale and fungal infection and/or water stress. Plants were watered daily for 3 days before a fire test.
Equipment Both the bench-scale cone calorimeter and the ISBC obtain the heat release rate of the burning sample as a function of time (Babrauskas 2002a) by measuring the consumption of
Int. J. Wildland Fire 325
oxygen as the result of combustion (Huggett 1980; Janssens 2002). The basic assumption of the calculations is that approximately 13.1 MJ heat is released per kg O2 consumed for a wide range of materials, including plastics and liquid fuels. Combustion gases are collected in an exhaust hood and duct. Samples of the exhaust gases in the ducts above the hood over the burning sample are analysed for their O2, CO2 and CO contents. The O2 concentrations measured in the hood are compared with the normal ambient concentration determined before ignition. From these gas concentration measurements, the net heat release rate as the result of combustion is calcu-lated. Susott (1982a), in his study of various forest fuels, found that the relationship between the gross heat of com-bustion and the O2 required for the combustion of pyrolysis volatiles was 14.6 MJ/kg oxygen. Using the data of Susott et al. (1975), Dietenberger (2001) found that the net heat of combustion for forest fuels was 13.23 MJ/kg times the ratio of stoichiometric O2 mass to fuel mass. The ratio was shown to be valid for biomass with high ash content, treated wood, wood volatiles and wood char.
Bench-scale calorimeter tests
The cone calorimeter is widely used to obtain the heat release rate of building materials and other products (Babrauskas 1984, 2002b; ASTM International 2004). An electric cone heater exposed the 100 × 100-mm specimen holder to a fixed heat flux in an open environment. In these tests, the plant specimens were placed in an aluminum foil container that was laid on a holder with a low-density ceramic wool blanket. To contain the pieces of the specimens, we placed a steel edge retainer frame with a grid over the holder (Fig. 2). A water-cooled shutter was used to shield the specimen until the test was initiated. An electric spark igniter provided the ignition source. The cone calorimeter at FSFPL is a CONE2 AutoCal Combustion Analysis System (Atlas Electric Devices Co., Chicago, IL, USA) (Fig. 2). A methane burner with an output of 5 kW is used to calibrate the equipment involved in the heat-release measurements.
Defermination of O2, CO2 and CO content
Initial test data were curves of heat release rate v. time and curves of mass loss rate v. time. Heat release rate is nor-mally expressed as kW per exposed surface area (m2). From visual observations and these initial test data, results that can be reported included the following: peak heat release rate (PHRR) at time x, average heat release rate over interval y minutes after ignition, total heat release (THR), average mass loss rate, time for sustained ignition (TSI), effective heat ofcombustion v. time and average effective heat ofcom-bustion (EHOC). Results for PHRR, EHOC, THR and TSI are reported here. The values reported for EHOC ofthe green samples were calculated from the total heat release and the mass loss without any correction for the mass loss due to moisture. An exposed surface area of 0.0080 m2 was assumed

326 Int. J.WildlandFire D. R. Weise etal.
(a)
(b)
(c)
Fig. 2. ( a) Cone calorimeter used to measure combustion charac-teristics of various vegetation specimens, (b ) specimen holder with retainer frame and grid used by cone calorimeter and (c ) intermediate scale biomass calorimeter used to measure combustion characteristics of small shrubs.
Fig. 3. Example of a calibration run for the intermediate scale biomass calorimeter at the University of California Forest Products Laboratory.
in the calculations of results in terms of unit area. This is the exposed area of the top of the specimen holder accounting for the edges of the retainer frame and the grid (Fig. 2b; Urbas 2005). This surface area is smaller than 0.0088 m2 reported by Urbas (2005) owing to the grid.
Cone calorimeter samples were removed from the plastic bags, weighed and placed in the holder immediately before testing. The amount of material was usually a single layer of foliage with the entire exposed surface area of the sample holder not covered. A radiant flux of 25 kW m-2 was used to ignite the samples. Gas concentration and mass loss mea-surements were sampled at 1 Hz. A small orifice plate was used in the exhaust duct to obtain a measured exhaust flow of 0.012 m3 s-1.
Intermediate-scale calorimeter tests The ISBC tests were conducted at UCFPL. In addition to the equipment to measure O2, CO2 and CO concentrations, the ISBC had two platform load cells, a propane line burner, a three-sided ceramic board enclosure, a plant rack and a data-acquisition system. A three-sided wooden wall, lined with ceramic fibreboard, surrounded the plant rack and line burner (Fig. 2). The calorimeter was calibrated by measuring heat release from propane (Fig. 3).
To produce an even heat output from the propane burner, propane gas was uniformly forced through a 15-cm tall col-umn of sand. This sand propane burner produced a wall of flame approximately 1 m in length. The flame leaned into the fuel bed at an angle of approximately 45° due to entrainment ofair caused by the surrounding walls. This allowed the entire width ofthe vegetation to be penetrated with flame. Depend-ing on the height and depth ofthe vegetation, the flame mainly penetrated the middle ofthe fuel in a vertical orientation and missed the back bottom and top front of the fuel. Convec-tion, radiation and intermittent flame contact heated those areas missed by continuous flame impingement.
Statistical analysis
The PHRR was normalised on a per unit area basis: the sample holder area (0.0080 m2) was used for the cone calorimeter and a sample's estimated crown area ( π ( dU 1 dU 2 + dL1 dL 2 + √ dU 1 dU 2 dL 1 dL 2)/4) was used for

Seasonal changes in plant flammability
the ISBC tests. Analysis of variance was used to test the effects of species and season on PHRR, EHOC and TSI for the cone calorimeter tests. For the green samples, mois-ture content was not controlled in the living plants. Some species from the nursery were watered since they were grown in pots. Other plants from the nursery and the adjoining native landscape were rooted in the ground, were drought-adapted and only received occasional watering (nursery) or natural rainfall. In order to reduce the confounding effect of moisture, plants were also tested as oven-dry samples. The PHRR for oven-dry and green samples was ranked separately within a season. Ranks for oven-dry and green samples were compared to determine whether moisture content changed the species order. Following Dimitrakopoulos and Papaioan-nou (2001), a regression model was fit relating TSI to the estimated water mass for all green samples.
Owing to the limited number of the intermediate scale tests, only data plots and correlation were used to determine whether a relationship existed between the cone calorimeter and the intermediate-scale biomass calorimeter results. Both PHRR and EHOC were examined.
Results Bench-scale calorimeter tests The moisture content of some species, such as A. fasciculatum, changed appreciably over the test period (Table 1). Aloe sp. and M. parvifolium, both succulent species, maintained mean moisture contents > 1000% and 300%, respectively, for the entire experiment. The composite surface area-to-volume ratio a, was similar for the 10 species with the exception of Aloe sp. (Table 2). The branch surface area-to-volume ratios (σb) were similar for most species and there was a wider range for the foliage (σ f ). Aloe sp. and R. spinescens had the lowest and highest composite ratios (σc), .respectively.
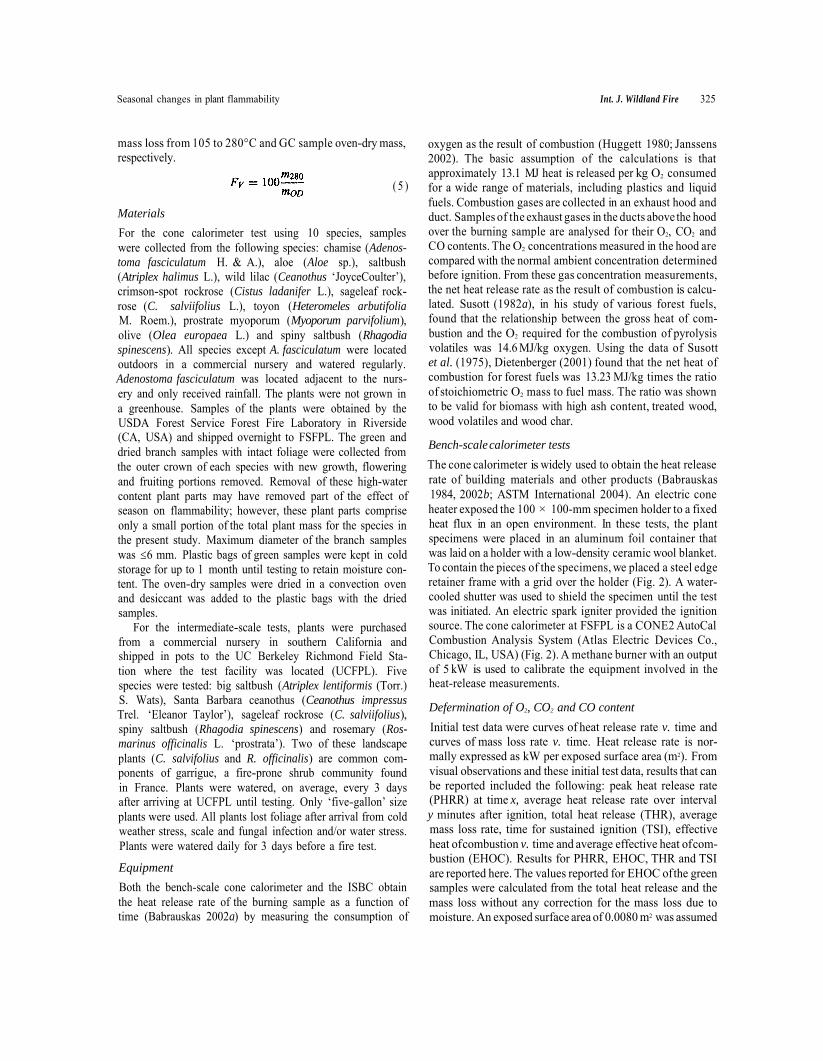
Examples of the evolution of heat release rate over time can be found in Fig. 4. Oven-dry samples had greater heat release
Int. J. WildlandFire 327
rates than the green samples for the same species. There was a significant difference in the time needed to achieve the peak heat release rate between oven-dry and green samples. For the 4 tests illustrated in Fig. 4, there was a difference of at least 100 s between green and oven-dry samples. As would be expected, green samples had a longer ignition delay. The PHRR differed appreciably between green and oven-dry sam-ples (Table 3). Green samples exhibited lower PHRR (Fig. 5). The PHRR for oven-dry samples ranged from 49 (Aloe sp.) to 331 kW m-2 (O.europaea). The range of PHRR for green sampleswas 1 (Aloe sp.) to 176 kW m-2 (A. fusciculatum).
As would be expected, the EHOC for green samples was lower than for oven-dry samples (Table 3; Fig. 6). For oven-dry samples, the EHOC ranged from 9.4 (Aloe sp.) to 19.6 MJ kg-1 (O.europaea), whereas for green samples EHOC ranged from 0 (Aloe sp.) to 10.8 MJ kg-1 (A. fasciculatum). Combining the oven-dry data for total heat release and the dry mass consumed resulted in an overall estimate of 16.07 MJ kg-1 for the effective heat of combustion (slope of line for oven-dry data in Fig. 7) ofthe ornamental vegetation
2used in this test. In many instances, the green samples did not sustain igni-
tion with the 25 kW m-2 radiant ignition flux (Table 4). For those tests in which sustained ignition was observed, the observed times ranged from 52 s (Ceanothus ‘Joyce Coul-ter’) to 555 s (M. parvifolium) for green samples and from 13 s (M. parvifolium) to 1 14 s (Aloe sp.) for oven-dry sam-ples. The time to sustained ignition increased with moisture content (Fig. 8).
As can be seen in Tables 3 and 4, and Figs 5 and 6, dif-ferences in PHRR, EHOC and TSI between species were observed. Analysis of variance of the oven-dry samples indicated that season, species and the species-seasoninter-action significantly affected PHRR and TSI means; season and species significantly affected mean EHOC (significant defined as α ≤ 0.05). Species, season and their interaction affected PHRR, TSI and EHOC means for green samples also.
Table 1. Mean moisture content of live foliage samples from 10 ornamental plant species tested using a
Species
Olea europaea Adenostoma fasciculatum Cistus landanifer Heteromeles arbutifolia Ceanothus ‘Joyce Coulter’A
Cistus salviifolius Atriplex halimus Rhagodia spinescens Myoporum parvifolium Aloe sp.
cone calorimeter Values are the mean (s.e.)
Moisture content (%)
August December March May
58 (1) 69 (2)
110 (1)
88 (2) 99 (1) 65 (2) 128 (54)
116 (34) 146 (3)
100 (17) 98 (7)
163 (7) 121 (4) 103 (2) 117 (3) 185 (6) 121 (5) 151 (3)
38 (1)196 (4) 199 (4) 244 (4)
182 (3) 125 (0) 220 (5) 307 (32) 250 (6) 205 (22) 276 (16) 341 (27) 325 (16) 466 (2) 452 (124) 775 (28)
1935 (127) 1130 (19) 2396 (58) 1901 (118)
A Plant used for sampling died between December 1995 and March 1996.
328 Int. J. WildlandFire D. R. Weise et al.
Table 2. Estimated mean (s.e.) surface area-to-volume ratios for ornamental plant species in California USFS, measurements and calculations ( n = 9) performed at USDA Forest Service Forest Fire Laboratory,
Riverside, CA, USA; UCFPL, measurements and calculations performed at University of California Forest Products Laboratory, Richmond CA, USA
Species Source Surface area/volume (σ; cm-1) Leaf Branch Composite
Aloe sp. USFS 7.3 (3.7) 5.6 (0.8) 5.0 (1.2) Atriplex halimus USFS 37.3 (1.9) 15.0 (1.7) 33.4 (1.9) Ceanothus ‘Joyce Coulter’ USFS 44.0 (2.4) 13.0 (2.8) 34.3 (1.7) Adenostoma fasciculatum USFS 42.3 (5.5) 14.7 (1.9) 30.2 (5.5) Cistus landanifer USFS 40.4 (3.6) 22.2 (1.2) 39.2 (3.3) Cistus salviifolius USFS 36.5 (3.7) 26.3 (1.1) 35.8 (3.5) Myoporum parvifolium USFS 19.7 (4.0) 9.9 (2.5) 17.2 (3.5) Olea europaea USFS 55.9 (4.8) 21.2 (3.8) 42.9 (5.1) Rhagodia spinescens USFS 75.3 (7.8) 22.1 (2.7) 60.8 (4.0) Heteromeles arbutifolia USFS 26.5 (8.5) 8.9 (2.5) 23.0 (7.5) Atriplex lentiformii UCFPL 57.8 Ceanothus impressus ‘Eleanor Taylor’ UCFPL 76.1 Cistus salviifolius UCFPL 55.3 Rhagodia spinescens UCFPL 61.9 Rosmarinus officinalis ‘prostrata’ UCFPL 106.8
Fig. 4. Mass loss rates and heat release rates measured in a cone calorimeter for green and oven-dry samples of (a,b) chamise (Adenostoma fasciculatum) and (c,d) saltbush (Atriplex halimus).

Table 3. Means (coefficient of variation) for the peak heat release rates and effective heat of combustion using a cone calorimeter for green and oven-dry samples of ornamental
Species
Olea europaea
Adenostoma fasciculatum
Atriplex halimus
Heteromeles arbutifolia
Cistus ladanifer
Myoporum parvifolia
Ceanothus ‘Joyce Coulter’A
Cistus salviifolius
Aloe sp.
Rhagodia spinescens
vegetation in southern California collected in between August 1995 and May 1996 G, plant sample not dried (green); O, plant sample dried at 90°C to a constant weight
O/G Peak heat release rate (kW m-2) Average effective heat of combustion (MJ kg-1)
August December March May August December March May
O G
260 (7) 127 (6)
287 (14) 165 (6)
302 (8) 140 (16)
264 (9) 127 (22)
17.4 (5) 8.0 (14)
17.2 (6) 8.4 (10)
18.8 (5) 8.2 (8)
18.2 (6) 7.7 (3)
O 247 (4) 255 (11) 281 (14) 210 (19) 16.6 (3) 17.9 (2) 17.3 (1) 16.1 (3) G 102 (18) 119 (11) 166 (6) 101 (12) 6.9 (17) 8.5 (8) 9.2 (17) 7.4 (3) O 93 (29) 209 (8) 216 (19) 147 (16) 12.7 (10) 14.6 (8) 14.6 (5) 13.3 (8) G 26 (15) 61 (26) 98 (10) 46 (105) 0.9 (86) 4.1 (20) 3.7 (1) 1.5 (78) O 111 (6) 168 (14) 181 (17) 120 (15) 15.4 (4) 17.5 (5) 15.7 (3) 14.1 (6) G 45 (39) 62 (10) 88 (10) 38 (43) 3.4 (44) 5.6 (17) 4.9 (16) 2.6 (10) O 152 (7) 159 (3) 219 (11) 131 (13) 14.6 (10) 15.6 (3) 16.3 (6) 13.2 (6) G 37 (72) 60 (37) 50 (22) 40 (42) 4.9 (75) 4.9 (16) 3.9 (20) 3.1 (34) O 162 (9) 149 (13) 131 (2) 110 (21) 16.3 (2) 16.0 (5) 15.1 (5) 14.4 (3) G 35 (53) 37 (81) 71 (13) 19 (68) 1.6 (7) 1.0 (14) 1.5 (4) 0.8 (29) O 139 (23) 150 (11) 13.4 (5) 14.2 (1) G 41 (70) 82 (13) 2.8 (57) 8.5 (15) O 99 (12) 167 (11) 183 (10) 138 (7) 12.7 (3) 14.2 (3) 13.9 (3) 12.3 (8) G 47 (23) 32 (38) 62 (12) 42 (13) 4.7 (16) 2.8 (13) 4.0 (11) 2.8 (10) O 92 (19) 92 (35) 70 (81) 93 (41) 11.6 (2) 11.2 (14) 8.2 (71) 10.1 (7) G O
4 (11)88 (11)
4 (9) 182 (14)
2 (48) 207 (3)
2 (34)157 (26)
0 (14) 13.4 (9)
0 (148) 14.8 (4)
0.1 (125) 15.0 (2)
0.2 (18) 14.2 (1)
G 24 (81) 73 (44) 65 (20) 28 (22) 2.3 (30) 4.7 (32) 2.5 (10) 1.6 (22)
A Plant used for sampling died between December 1995 and March 1996.

330 Int. J. Wildland Fire
Fig. 5. Mean peak heat release rates (PHRR) for (a ) green and ( b ) oven-dry samples of ornamental vegetation in southern California. The PHRR was determined using 25 kW m-2 flux in a cone calorimeter.
It was not possible to isolate the effects of species and season individually on PHRR, EHOC or TSI because of the presence of interaction. The changes in PHRR and EHOC for oven-dry and green vegetation can be seen in Figs 5 and 6 respectively. For many of the species, there was a sugges-tion of a seasonal trend in PHRR. For the oven-dry samples, PHRR appears to have increased for samples tested in December and March. A similar trend was observed for the green samples, particularly O. europaea, A. fasciculatum and M. parvifolium. For O. europaea, the EHOC of oven-dry vegetation was similar for the four sampling times. Other species exhibited a slight trend with higher EHOC occurring in December and March.
Total heat release was strongly correlated (r2 = 0.94) with oven-dry mass consumed for the oven-dry samples (Fig. 7). More variability in THR was observed for the green samples and the fitted regression accounted for less variation in THR (r2 = 0.60). The three intercept terms were not significantly different than 0. The estimated coefficients for dry mass
D. R. Weise etal.
Fig. 6. Mean effective heat ofcombustion (EHOC) for (a) green and (b) oven-dry samples of ornamental vegetation in southern California. The EHOC was determined using25 kW m-2 flux in a cone calorimeter.
Fig. 7. Effective heat of combustion calculated as slope of total heat release v, dry mass consumed for green and oven-dry samples of ornamental vegetation in southern California. Total heat release was determined using 25 kW m-2 flux in a cone calorimeter.

Seasonal changes in plant flammability Int. J. Wildland Fire 331
Table 4. Time to sustained ignition estimated using a cone calorimeter for green samples of ornamental vegetation in southern California collected in between August 1995 and May 1996
Species August December March May TimeA TestsB Time Tests Time Tests Time Tests
Aloe sp. 2 (0) 3 (0) 3 (0) 3 (0) Atriplex halimus 3 (0) 174 (14) 3 (2) 261 (9) 3 (3) 310 3 (1) Ceanothus ‘Joyce Coulter’ 204 (16) 3 (2) 98 (32) 3 (3) Adenostoma, fasciculatum 138 (24) 3 (3) 108 (11) 3 (3) 104 (14) 3 (3) 100 (5) 3 (2) Cistus ladanifir 121 3 (1) 136 3 (1) 3 (0) 250 (0) 3 (1) Cistus salviifolius 131 3 (1) 3 (0) 3 (0) 189 3 (1) Myoporum parvifolia 292 3 (1) 336 3 (1) 544 (11) 3 (2) 3 (0) Olea europea 99 (9) 3 (3) 91 (9) 3 (3) 106 (4) 3 (3) 103 (5) 3 (3) Rhagodia spinescens 3 (0) 102 3 (1) 3 (0) 3 (0) Heteromeles arbutifolia 3 (0) 157 (20) 3 (2) 182 3 (1) 254 3 (1)
A Mean time to sustained ignition in seconds (standard error of mean). B Total number of tests (number of tests with sustained ignition).
Fig. 8. Relationship between total water mass and time to sus-tained ignition for green samples of ornamental vegetation in southern California.
consumed were 16.070, 9.941 and 14.160 MJ kg-1 for oven-dry, green and all samples respectively.
Because of significant interaction and the inability to iso-late the treatment effects, the TSI data of the green samples were pooled and a regression model was fit relating TSI to the estimated total mass of H2O in the sample (Fig. 8). For the green samples, the H2O mass accounted for 91 % of the variation in TSI.
Intermediate-scale calorimeter tests
Thirteen tests were run in February 1999: three each for A. lentiformis, R. spinescens and C. salviifolius, and two each for C. impressus and R. officinalis. A group offour plants was used for each Atriplex, Cistus and Ceanothus test; two plants were used for Rosmarinus and one plant per test was used for Rhagodia. Owing to the small nature of the potted plants,
the fine fuels (diameter < 6 mm) comprised a large percent-age (60-80%) of the total mass of the samples (Table 5). As plants mature, the percentage of total mass that is fine fuel decreases (Rundel and Parsons 1979). Foliage moisture con-tent ranged from 180% to over 300%. Total sample moisture content MT was < 1/2 of the foliage moisture content for four of five species.
The range of measured leaf a was 55-107 cm-1. These values are larger than a for a 6-mm diameter cylinder ( σ = 6.3 cm-1). This indicated that the foliage fell within the size range ofthe 1-h moisture time-lagfuel class; however, livingfoliagedoesnotrespondpassivelytochanges in atmo-sphericmoistureasdeadfuelsdo.Thesurfacearea-to-volume ratio ( σ ) for C. salviifolius was similar to that reported by Papio and Trabaud (1990); however, the leaf σ for R. Officinalis observed in the present study was much greater than a reported (47 cm-1) by Papio and Trabaud (1990). The fuel packing ratios ( β ) were similar between species and gener-ally low when compared with litter fuel beds (0.056-0.064; Rothermel and Anderson 1966) and native chaparral stands (0.01-0.02; Weise et al. 2005). The percentage of volatile compounds contained in the foliage was essentially con-stant for four of the five species tested. Rosmarinus had a significantly higher percentage of volatiles by mass. Most
2of these volatiles were produced at temperatures <300°C. The PHRR ranged from a low of 52 kW m-2 for an Atriplex sample to > 300 kW m-2 for a Rhagodia sample (Table 6). Average EHOC ranged from 5.8 MJ kg-1 for Rhagodia to 21.6 MJ kg-1 for C. salviifolius. The EHOC for most samples was < 10 MJkg-1.
Discussion Seasonal effects on PHRR measured by the cone calorime-ter differed between species and season. Moisture content reduced PHRR appreciably, but did not affect the ranking of the extremes. Estimated heat of combustion was also

332 Int. J. Wildland Fire D. R. Weise et al.
Table 5. Physical characteristics of plant species used in intermediate scale biomass calorimeter tests
Species Fine fuel Moisture Fuel bed Leaf σ Packing Foliage Particle density massA (kg) contentB (%) height (m) (cm-1) ratio volatilesC (%) (kg m-3)
Atriplex lentiformis 0.33 (59) 291 (128) 0.60 57.8 0.005, 0.01 0.4 571 Ceanothus impressus 0.20 (77) 180 (142) 0.64 76.1 0.003 0.3 452 Cistus salviifolius 0.37 (64) 289 (107) 0.60 55.3 0.008 0.5 611 Rhagodia spinescens 0.78 (80) 304 (118) 0.4 I 61.9 0.006 0.4 622 Rosmarinus officinalis 0.54 (74) 201 (I 15) 0.43 106.8 0.008 3.8 608
A Oven-dry mass of material < 6 mm diameter. (Fine fuel dry mass/total dry mass (%).) B Numbers are foliage (total) moisture content. C Volatile mass expressed as a percentage of total oven-dry mass.
Table 6. Peak heat release rate and average effective heat of combustion estimated by an intermediate scale biomass calorimeter
for five species of ornamental plants in southern California EHOC, effective heat of combustion; PHRR, peak heat release rate
Species Normalised PHRR EHOC
Atriplex lentiformis
Ceanothus impressus
Cistus salviifolius
Rhagodia spinescens
Rosmarinus officinalis
(kW m-2) (MJ kg-1)
97.6 9.3 79.4 9.2 52.1 8.7 72.8 7.2 98.3 11.7 92.7 6.9 93.4 8.0
115.4 21.6 309.9 6.7 161.2 5.8 220.4 6.5 206.7 7.4 294.8 7.8
influenced by species and month of sampling; however, the influence of sampling month was not consistent. Because the plants we used were living and actively managing the water content of foliage and branches, the effects of sample mois-ture content and season are confounded. It was not possible in the present study to definitively state that the observed dif-ferences in PHRR and EHOC between sampling times were caused solely by moisture content or by phenological or phys-iological differences in the plants as a result of the annual growth cycle. Etlinger and Beall (2004) reported little effect of moisture on PHRR above moisture contents of 100% and a reduction in PHRR of 4 kW per 1% moisture content for moisture content between 0% and 100%. Likewise, Fig. 9 suggests that there is an upper limit to the impact of even greater moisture. Moisture dampened the variability in the PHRR results.
Relative flammability of species
Mean PHRR was ranked from highest to lowest for oven-dry and green samples separately for each group of seasonal tests (Table 3). Ranks were evaluated to determine whether the relative order of species changed. The two species with
Fig. 9. Peak heat release rate normalised by sample initial oven-dry mass and moisture content for green samples of ornamental vegetation in southern California: (a) all data and (b) moisture content < 300%. The curve is Etlinger and Beall’s (2004) fitted equation.
highest PHRR (and lowest rank) were A. fasciculatum and O. europaea (Table 7) . Aloe sp. consistently had the highest ranks and lowest PHRR. The one exception to this consis-tency in the ranking for Aloe sp. was the oven-dry samples of Rhagodia for December, in which Rhagodia had a slightly lower PHRR (88 kW m-2) than the average for the Aloe sp.

Seasonal changes in plant flammability Int. J. Wildland Fire 333
Table 7. Rank of cone calorimeter-based mean peak heat release rates for ornamental vegetation by season and fuel moisture content
G, plant sample not dried (green); O, plant sample dried at 90°C to a constant weight
Species August December March May 1995 1995 1996A 1996
O G O G O G O G
Olea europea 1 1 1 1 1 2 1 1 Adenostoma fasciculatum 2 2 2 2 2 1 2 2 Atriplex halimus 8 8 3 6 4 3 4 3 Cistus ladanifir 4 6 7 1 3 9 6 5 Rhagodia spinescens 10 9 4 4 5 6 3 7 Cistus salviifolius 7 3 6 9 6 1 5 4 Heteromeles arbutifolia 6 4 5 5 7 4 7 6 Ceanothus ‘Joyce Coulter’B 5 5 8 3 Myoporum parvifolia 3 1 9 8 9 5 9 9 Aloe sp. 9 10 10 10 10 10 10 10
A For purposes of ranking the plants, Ceanothus was assumed to have a ranking of ‘8’ in the March and May 1996 columns. B Plant died between December 1995 and March 1996.
(92 kW m-2). The relative position of both R. spinescens and A. halimus changed between the August 1995 and Decem-ber 1995 sampling periods. The PHRR for these two species increased relative to the other species examined. The ranks of the species other than A . fasciculatum, O. europaea and Aloe sp. changed over the course of the sampling period and no obvious trend emerged.
In a compilation of references on the fire performance ratings of residential landscape plants posted on the website of the University of California Forest Products Labora-tory (Lubin and Shelly 1997), plants with a favourable fire performance rating in three or more references included Myoporum parvifolium ‘prostrata’ and three species of Aloe (Aloe arborescens, Aloe aristata and Aloe brevifolia). Four additional species of Aloe were listed by two references. Plants recommended for high tire risk areas by one reference included Cistus ladanifer and Ceanothus ‘Joyce Coulter’. Other species of Atriplex were included in the listing of those recommended by three or more references (Atriplex canescens, Atriplex lentiformis breweri and A triplex semibaccata). Plants with an unfavourable fire performance rating in three or more references included A. fasciculatum. There was conflicting information in the references on the fire per-formance of C. salviifolius, O. europaea and H. arbutifolia. Rhagodia spinescens was not listed.
In a study of eight Mediterranean species, Liodakis et al. (2002) included O. europaea in the group of ‘most flammable species’ based its autoignitability behaviour. The derivative thermogravimetric curves for O. europaea indicated mass losses in the range of 120-160oC, which Liodakis et al. (2002) attributed to the evaporation of volatile constituents. In the cone calorimeter tests, O. europaea was consistently shown to be very flammable based on PHRR and EHOC.
Dimitrakopoulos (2001) concluded that the leaves of C. salviifolius were moderately flammable in a ranking of
very flammable, flammable, moderately flammable and less flammable. Dimitrakopoulos (2001) based the ranking on low foliage heat content, low surface area-to-volume ratio and high ash content. Dimitrakopoulos (2001) noted that Valette (I 990) classified C. salviifolius as ‘moderately inflammable’ based on ignition data. In the cone calorimeter tests, there were variations in the seasonal ranking of C. salviifolius. Overall, the green samples had the third lowest PHRR and the dry samples had the second lowest EHOC. The times for sustained ignition for the green samples were very rapid with only R. spinescens having a shorter overall average time for sustained ignition of the green samples.
Cone calorimeter methodology Cone calorimeter testing is normally done on an exposed sur-face area basis. This is difficult when the samples are pieces of foliage. In these tests, the foliage generally did not com-pletely cover the exposed surface area of the holder. In the case of Aloe sp., the sample was a thick bed of foliage. The initial mass of the oven dry samples ranged from 1 g for a R. spinescens sample to 16.7g for a H. arbutifolia sample. Questions remain on the effects of the initial sample mass on the test results. In a series of ISBC tests of six species, Etlinger and Beall (2004) found that a critical variable in the PHRR was the oven-dry mass of the foliage. In a series of tests of H. arbutlfolia (White et al. 1996), the initial mass had an effect on the time for the peak heat release rate, the time for sustained ignition and the total heat release. These tests did not indicate that the peak heat release rate or the average effective heat of combustion depended on the initial sam-ple mass. In other cone calorimeter tests on vegetation, the effects of the initial sample mass on the PHRR or the average EHOC have been inconsistent or confounded by other fac-tors, such as species. The effect of initial sample mass on the cone calorimeter test results likely depends on whether the

334 Int. J. WildlandFire D. R. Weise etal.
sample behaves as a thermally thin or thermally thick mate-rial. Thus, any effect of initial mass on PHRR or other test results may be non-linear. Figure 7 is a plot of PHRR v. the oven-dry mass consumed. The three samples with consumed mass greater than 0.01 kg were three H. arbutifolia samples that had initial sample mass values significantly greater than that for the other samples. Because the vegetation sample is not a planar surface, there are questions as to whether a por-tion of the sample received the specified heat flux. Briggs (1997) discusses differences in test results for unplasticized polyvinyl chloride tested as a flat sheet v. pipe sections. Fur-ther work is needed to standardise the quantity of the test sample for improved consistency in results. One alternative to using pieces of foliage is to grind the sample before testing so the ground material would completely cover the exposed surface of the sample holder.
Compared with the high pressure and pure oxygen envi-ronment of the bomb calorimeter, cone calorimeter exposures are more representative of real fires. As discussed by Janssens (2002), the main distinction between the average effective heat of combustion in the cone calorimeter and the net heat of combustion from the oxygen bomb calorimeter is the residual charred material. In the oxygen bomb calorimeter, nearly all of a wood sample is consumed and the net heat of combustion of wood is 16-18 kJ g-1. In contrast, 20-30% of a wood sample is not consumed in a cone calorime-ter and the effective heat of combustion is 12-13 kJ g-1. The net heat of combustion of the residual char is approx-imately 30 kJ g-1 (Janssens 2002). Reported values from the bomb calorimeter are often for the gross heat of combus-tion (or higher heat content), which includes the latent heat of evaporation of water. Values in Drysdale (1985) include a net heat of combustion for pure cellulose of 16.1 MJ kg-1, a gross heat of combustion for Fagus sylvatica (European beech) wood of 19.5 MJ kg-1 and a gross heat of combustion for Fagus sylvatica (European beech) char of 34.3 MJ kg-1. Dimitrakopoulos and Panov (2001) reported higher gross heat content values of 18.65 (leaves) and 19.05 (branches) MJ kg -1 for C. salviifolius. Behm et al. (2004) reported gross heat content of foliage from several species in the south-eastem US ranging from 19.5 to 21.5 MJ kg-1. Dimi-trakopoulos and Panov (2001), in a study of 13 Mediterranean vegetation species, noted a general trend of leaves having higher heating values than the branches, stems and spines. In contrast, the average net effective heat of combustion values from the cone calorimeter tests for the dry C. salviifolius samples were 11.3-14.2 MJ kg-1 (Table 3). In tests of A. fasciculatum samples, Philpot (1969) reported gross heat of combustion results of 21.0-23.3 MJ kg-1 for leaves and 2 1.2-22.7MJ kg-1 for the stems. The average net effective heat of combustion values from the cone calorimeter tests for the dry A. fasciculatum samples were 15.8-1 8.1 MJ kg-1
(Table 3). In a series of ISBC tests of six species, Etlinger and Beall (2004) obtained an average value of 17.3 MJ kg-1
for the effective heat of combustion with a range of 11.7-26.6 MJ kg-1 on an oven-dry basis. Any smoke or volatiles that do not undergo complete combustion before the sam-pling of the exhaust gases are also factors in the values for the average EHOC. Incomplete combustion was possibly a factor in the tests of the green samples, particularly for the species like Aloe sp. where sustained ignition was difficult or did not occur. The average effective heat of combustion values for green samples were also low because the mass loss was not corrected for that due to moisture loss. Future evaluation of the methodology should include comparative testing of samples in the cone calorimeter and the oxygen bomb calorimeter. In the present study, the results reported include the PHRR, TSI and the average EHOC. In terms of the concepts of Anderson (1970), the PHRR is an indicator of the ‘combustibility’ because it reflects the rapidity with which the fire burns. The average EHOC is a normalised value for the total heat release. Thus, it is an indicator of the sustain-ability of the fuel to continue to burn with or without the heat source.
One advantage of the cone calorimeter over just the heat content from the oxygen bomb calorimeter is that the over-all heat-release curves from the cone calorimeter should be directly related to the four fuel properties mentioned by Dim-itrakopoulos and Panov (2001) and used by Dimitrakopoulos (2001) in a statistical classification of plant species for flammability. The flammability of the foliage as reflected in the timing and shape of the heat-release curve should be affected by the heat content, total ash content, surface area-to-volume ratio and fuel particle density of the fuel. One difficulty is condensing the overall curve into single num-bers for the purpose of ranking vegetation. The use of cone calorimeter data in a fire growth model for wood building products is discussed by Dietenberger and White (2001). This model for flame propagation on solid wood products is based on the THR, TSI and the PHRR data from the cone calorime-ter. In addition to the form (foliage or ground) and quantity of the sample, considerations for future cone calorimeter test-ing of vegetation include the selection of the heat flux level and the use of the retainer frame and grid. The 25 kW m-1
level of heat flux used in the cone calorimeter is near the lower limit of heat flux used in the testing of wood prod-ucts. The advantage of using lower heat flux levels is that it increases differences in the results for the TSI. Comparison of the effective heat of combustion data with heat content data from oxygen bomb calorimeter suggests that the 25 kW m-1
was appropriate for the dry specimens. A higher heat flux level may be more appropriate for the green specimens, in which there were difficulties in obtaining sustained ignition. Testing at the intermediate-scale level is also affected by the choice of the external fire exposure. The question of ignition source and heat flux levels in heat release testing is discussed by Babrauskas (2002a). One consideration is the expected heat flux exposure in the field of application. Sullivan et al.
Seasonal changes in plant flammability Int. J. Wildland Fire 335
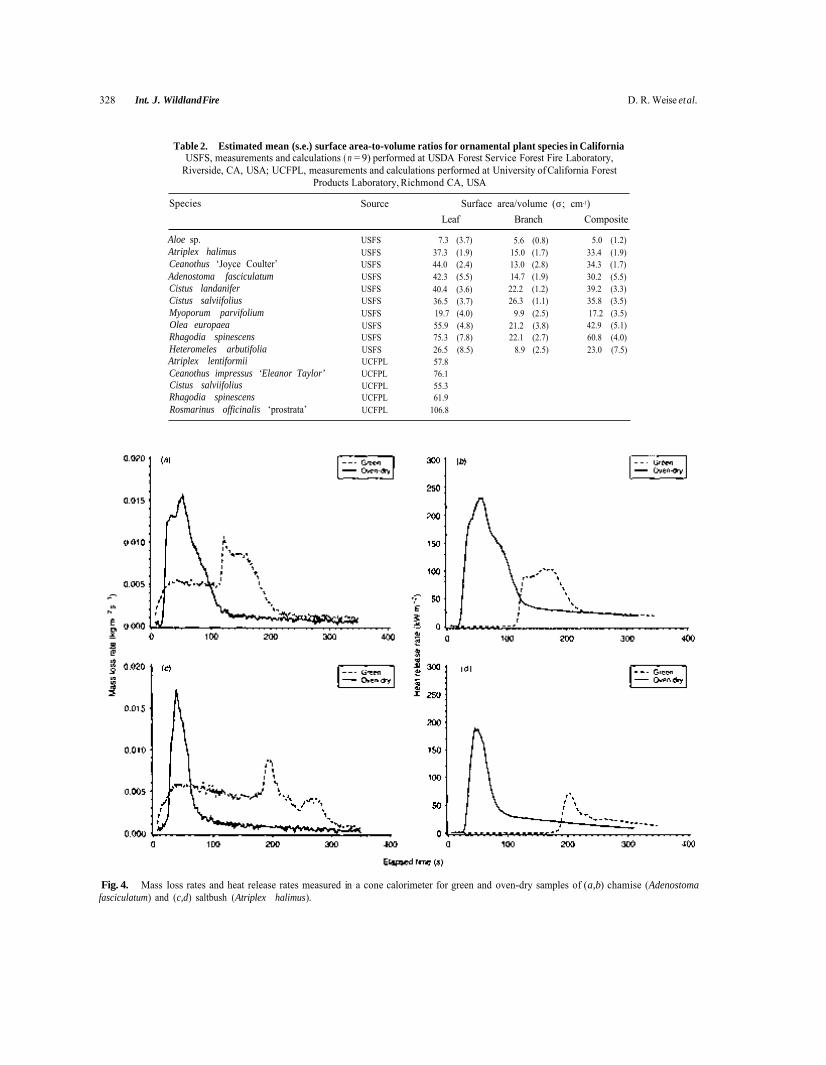
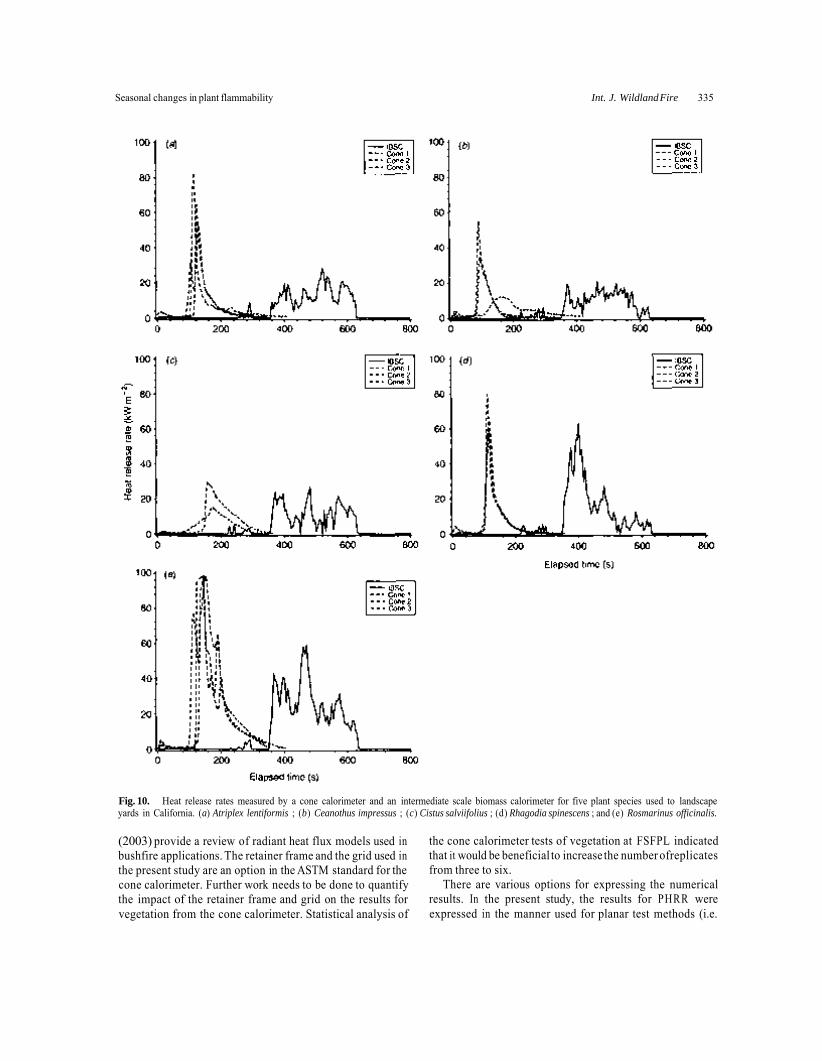
Fig. 10. Heat release rates measured by a cone calorimeter and an intermediate scale biomass calorimeter for five plant species used to landscape yards in California. (a) Atriplex lentiformis ; (b) Ceanothus impressus ; (c) Cistus salviifolius ; (d) Rhagodia spinescens ; and (e) Rosmarinus officinalis.
(2003) provide a review of radiant heat flux models used in the cone calorimeter tests of vegetation at FSFPL indicated bushfire applications. The retainer frame and the grid used in that it would be beneficial to increase the number ofreplicates the present study are an option in the ASTM standard for the from three to six. cone calorimeter. Further work needs to be done to quantify There are various options for expressing the numerical the impact of the retainer frame and grid on the results for results. In the present study, the results for PHRR were vegetation from the cone calorimeter. Statistical analysis of expressed in the manner used for planar test methods (i.e.
336 Int. J. Wildland Fire D. R. Weise etal.
kW m-2). Alternatives include reporting the heat release rate as kW normalised to the initial sample oven-dry mass. An overall representation of the PHRR data (kW kg-1) with the moisture content of the sample is shown in Fig. 9. A similar representation of ISBC data was presented by Etlinger and Beall (2004).
Comparison ofcone and ISBC calorimeters
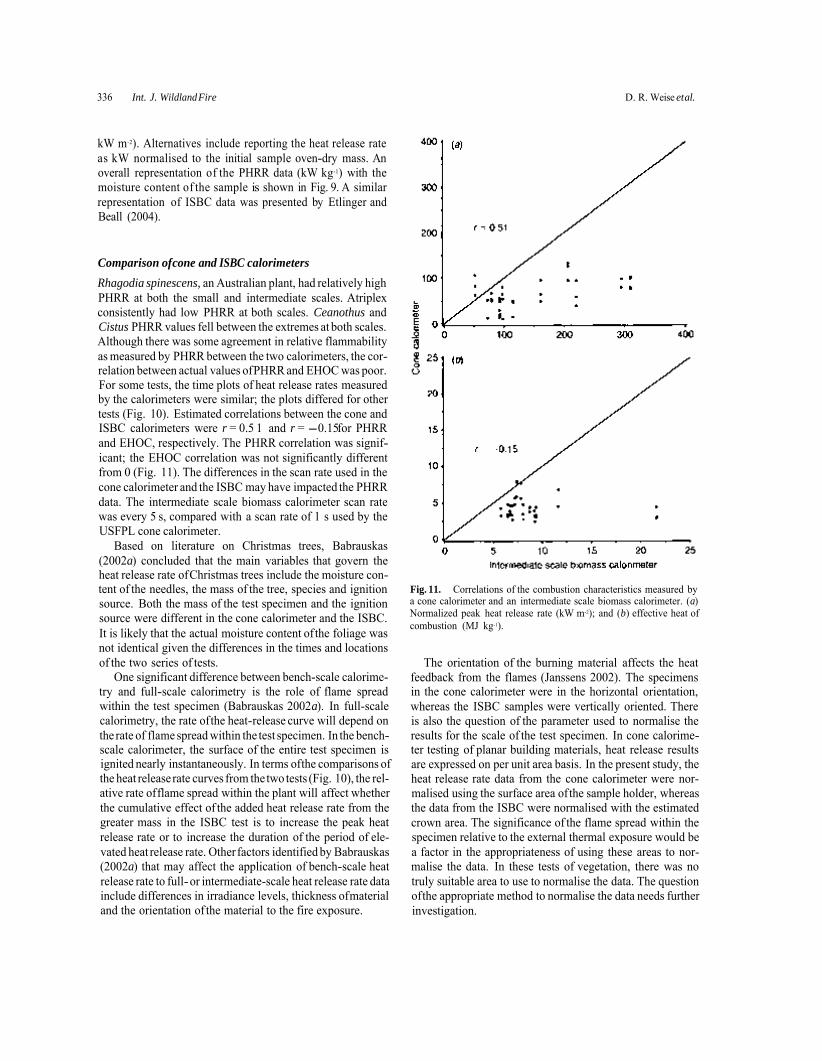
Rhagodia spinescens, an Australian plant, had relatively high PHRR at both the small and intermediate scales. Atriplex consistently had low PHRR at both scales. Ceanothus and Cistus PHRR values fell between the extremes at both scales. Although there was some agreement in relative flammability as measured by PHRR between the two calorimeters, the cor-relation between actual values ofPHRR and EHOC was poor. For some tests, the time plots of heat release rates measured by the calorimeters were similar; the plots differed for other tests (Fig. 10). Estimated correlations between the cone and ISBC calorimeters were r = 0.5 1 and r = -0.15for PHRR and EHOC, respectively. The PHRR correlation was signif-icant; the EHOC correlation was not significantly different from 0 (Fig. 11). The differences in the scan rate used in the cone calorimeter and the ISBC may have impacted the PHRR data. The intermediate scale biomass calorimeter scan rate was every 5 s, compared with a scan rate of 1 s used by the USFPL cone calorimeter.
Based on literature on Christmas trees, Babrauskas (2002a) concluded that the main variables that govern the heat release rate of Christmas trees include the moisture con-tent of the needles, the mass of the tree, species and ignition source. Both the mass of the test specimen and the ignition source were different in the cone calorimeter and the ISBC. It is likely that the actual moisture content of the foliage was not identical given the differences in the times and locations of the two series of tests.
One significant difference between bench-scale calorime-try and full-scale calorimetry is the role of flame spread within the test specimen (Babrauskas 2002a). In full-scale calorimetry, the rate ofthe heat-release curve will depend on the rate of flame spread within the test specimen. In the bench-scale calorimeter, the surface of the entire test specimen is ignited nearly instantaneously. In terms ofthe comparisons of the heat release rate curves from the two tests (Fig. 10), the rel-ative rate offlame spread within the plant will affect whether the cumulative effect of the added heat release rate from the greater mass in the ISBC test is to increase the peak heat release rate or to increase the duration of the period of ele-vated heat release rate. Other factors identified by Babrauskas (2002a) that may affect the application of bench-scale heat release rate to full-or intermediate-scale heat release rate data include differences in irradiance levels, thickness ofmaterial and the orientation of the material to the fire exposure.
Fig. 11. Correlations of the combustion characteristics measured by a cone calorimeter and an intermediate scale biomass calorimeter. (a) Normalized peak heat release rate (kW m-2); and (b) effective heat of combustion (MJ kg-1).
The orientation of the burning material affects the heat feedback from the flames (Janssens 2002). The specimens in the cone calorimeter were in the horizontal orientation, whereas the ISBC samples were vertically oriented. There is also the question of the parameter used to normalise the results for the scale of the test specimen. In cone calorime-ter testing of planar building materials, heat release results are expressed on per unit area basis. In the present study, the heat release rate data from the cone calorimeter were nor-malised using the surface area of the sample holder, whereas the data from the ISBC were normalised with the estimated crown area. The significance of the flame spread within the specimen relative to the external thermal exposure would be a factor in the appropriateness of using these areas to nor-malise the data. In these tests of vegetation, there was no truly suitable area to use to normalise the data. The question ofthe appropriate method to normalise the data needs further investigation.
Seasonal changes in plant flammability
Conclusion Although the cone calorimeter provided results that may be used to determine the flammability of a particular species, the applicability of this type of result to complete plants is currently unknown. The flammability of complete plants is influenced by the geometry of the plant in addition to other characteristics, such as moisture content. The season of year may influence the relative flammability of various species; however, moisture content is confounded with sea-son. More testing of paired samples of vegetation with the oxygen bomb calorimeter, cone calorimeter, ISBC and large-scale calorimeters is recommended before any specific test protocol is used to rate plant flammability.
Acknowledgements The stimulus for the present study was provided by Susan Frommer (Menifee, CA, USA). The assistance of Bonni Cor-coran (Forest Fire Laboratory), Tom Breiner (UC Forest Prod-ucts Laboratory) and Anne Fuller (Forest Service Forest Prod-ucts Laboratory) was critical to the completion of this study.
References Anderson HE (1970) Forest fuel ignitability. Fire Technology 6,
312-319. ASTM International (2004) ‘Standard test method for heat and vis-
ible smoke release rates for materials and products using an oxygen consumption calorimeter.’ (ASTM International: West Conshohocken, PA)
Babrauskas V (1984) Development of the cone calorimeter: a bench scale heat release rate apparatus based on oxygen consumption. Fire and Materials 8, 81-95.doi:10.1002/FAM.810080206
Babrauskas V (2002a) Heat release rates. In ‘The SFPE handbook of fire protection engineering’. 3rd edn. (Eds Society of Fire Protec-tion Engineers) pp. 3-1–3-37. (National Fire Protection Association: Quincy, MA)
Babrauskas V (2002b) The cone calorimeter. In ‘The SFPE handbook of fire protection engineering’. 3rd edn. (Eds Society of Fire Protection Engineers) pp. 3-63–3-81. (National Fire Protection Association: Quincy, MA)
Babrauskas V (2003) ‘Ignition handbook.’ (Fire Science Publishers: Issaquah, WA)
Barbour MG, Burk JH, Pitts WD (1980) ‘Terrestrial plant ecology.’ (Benjamin/Cummings Publishing Company: Menlo Park, CA)
Behm AL, Duryea ML, Long AJ, Zipperer WC (2004) Flammabil-ity of native understory species in pine flatwood and hardwood hammock ecosystems and implications for the wildland-urban interface. International Journal of Wildland Fire 13, 355-365. doi: 10.1071/WF03075
Briggs PJ (1997) Note: use of the cone calorimeter for testing non-planar products. Fire and Materials 21, 51. doi: 10.1002/(SICI)1099-1018( 199701) 21:1 < 51 ::AID-FAM592>3.3.CO;2-F
Browne FL, Tang WK (1962) Thermogravimetric and differential ther-mal analysis of wood and of wood treated with inorganic salts during pyrolysis. Fire Research Abstracts and Reviews 4, 76–91.
Burgan RE (1978) ‘Modeling live fuel moisture in the 1978 National Fire Danger Rating System.’ USDA Forest Service Research Paper INT-226. (Ogden, UT)
Burgan RE, Susott RA (1991) Influence of sample processing tech-niques and seasonal variation on quantities of volatile compounds
Int.J. Wildland Fire 337
of gallberry, saw-palmetto and wax myrtle. International Journal of Wildland Fire 1, 57-62,
Ching FT, Stewart WS (1962) Research with slow burning plants. Journal of Forestry 60, 796798.
Delabraze P, Valette J-C (1981) The use of fire in silviculture. In ‘Proceedings of the symposium on dynamics and manage-ment of Mediterranean-type ecosystems’. 22-26 June 1981, San Diego, CA. USDA-Forest Service General Technical Report PSW-58. (Technical coordinators CE Conrad WC Oechel) pp. 475–482. (Berkeley, CA)
Dietenberger M (2001) Update for combustion properties of wood components. In ‘Fire and Materials 2001, 7th International Con-ference, 22-24 January 2001, Fisherman’s Wharf, San Francisco, USA’. pp. 159-171. (Interscience Communications: London)
Dietenberger MA, White RH (2001) Reaction-to-fire testing and modeling for wood products. In ‘12th annual BCC conference on flame retardancy’. pp. 54–69. (Business Communications: Norwalk, CT)
Dimitrakopoulos AP (2001 )A statistical classification of Mediterranean species based on their flammability components. International Journal of Wildland Fire 10, 113-118. doi:10.1071/WF01004
Dimitrakopoulos AP, Panov PI (2001) Pyric properties of some dominant Mediterranean vegetation. International Journal of Wildland Fire 10, 23-27. doi:10.1071/WF01003
Dimitrakopoulos AP, Papaioannou KK (2001) Flammability assess-ment of Mediterranean forest fuels. Fire Technology 37, 143-152. doi: 10.1023/A:1011641601076
Drysdale DC (1985) ‘An introduction to fire dynamics.’ (John Wiley and Sons: Chichester)
Etlinger MG, Beall FC (2004) Development of a laboratory protocol for fire performance of landscape plants. International Journal of Wildland Fire 13, 479–488. doi:10.1071/WF04039
Huggett C (1980) Estimation of rate of heat release by means of oxygen consumption measurements. Fire and Materials 4, 61-65. doi: 10.1002/FAM.810040202
Janssens M (2002) Calorimetry. In ‘The SFPE handbook of fire pro-tection engineering’. 3rd edn. (Eds Society of Fire Protection Engineers) pp. 3-38–3-62. (National Fire Protection Association: Quincy, MA)
Liodakis S, Bakirtzis D, Lois E (2002) TG and autoignition studies on forest fuels. Journal of Thermal Analysis and Calorimetry 69, 519-528.doi:10.1023/A:1019907706137
Llusia J, Peñuelas J (2000) Seasonal patterns of terpene content and emission from seven Mediterranean woody species in field conditions. American Journal of Botany 87, 133-140.
Lubin DM, Shelly JR (Eds) (1997) ‘Defensible space landscaping in the urban/wildland interface: a compilation of fire perfor-mance ratings of residential landscape plants’. Internal Report No. 36.01.137. (University of California Forest Products Laboratory: Richmond, CA)
Mak EHT (1988) Measuring foliar flammability with the limiting oxygen index method. Forest Science 34, 523-529.
Mutch RW, Philpot CW (1970) Relationofsilicacontentto flammability in grasses. Forest Science 16, 6465.
Nord EC, Green LR (1977) ‘Low-volume and slow burning vegeta-tion for planting on clearings in California chaparral.’ USDA Forest Service Research Paper PSW-124. (Berkeley, CA)
Owens MK, Lin C-D, Taylor CA Jr, Whisenant SG (1998) Sea-sonal patterns of plant flammability and monoterpenoid content in Juniperus ashei. Journal of Chemical Ecology 24. 2115-2129. doi:10.1023/A:1020793811615
Papio C, Trabaud L (1990) Structural characteristics of fuel components of five Mediterranean shrubs. Forest Ecology and Management 35, 249-259.doi:10.1016/0378-1127(90)90006-W
338 Int. J. WildlandFire D. R. Weise et al.
Philpot CW (I969) ‘Seasonal changes in heat content and etherextrac-tive content of chamise.’ USDA Forest Service Research Paper INT-61.(Ogden,UT)
PhilpotCW,MutchRW(1968)‘Flammabilityofherbicide-treatedguava foliage.’USDAForestServiceResearchPaperINT-54.(Ogden,UT)
Radtke K (1978) ‘Wildland plantings and urban forestry: native and exotic 1911-1977.’ (Los Angeles County Department Foresterand FireWarden, Forestry Division: LosAngeles,CA)
Rothermel RC,Anderson HE (1966) ‘Firespreadcharacteristics deter-mined in the laboratory.’ USDA Forest Service Research Paper INT-30.(Ogden,UT)
Rundel PW, Parsons DJ (1979) Structural changes inchamise (Adenostoma fasciculatum) along a tire-induced age gradient. Journal of Range Management 32, 462466.
Shatizadeh F, Chin PPS, DeGroot WF(1977) Effective heat content of green forest fuels. Forest Science 23, 81-89,
Sullivan AL, Ellis PF, Knight IK (2003) A review of radiant heat flux models used in bushfire applications. International Journal of Wildland Fire 12, 101–110. doi:10.1071/WF02052
Susott RA (1982a) Characterization ofthe thermal properties offorest fuels by combustible gas analysis. Forest Science 28, 404420.
Susott RA(1982b) Differential scanning calorimetry of forest fuels. Forest Science 28, 839-851.
Susott RA, DeGroot WF, Shatizadeh F (1975) Heat content ofnatural fuels. Journal of Fire and Flammability 6, 311-325.
UCFPL (2001) ‘Introduction to the I-zone.’ (University of Cal-ifornia Forest Products Laboratory: Richmond, CA) Available at http://nature.berkeley.edu/~fbeall/FireMit/izone.html [Verified 8 August20051
UrbasJ (2005) Effects ofretainer frame, irradiance level and specimen thickness on cone calorimeter test results. Fire and Materials 29, 1-13. doi:10.1002/FAM.861
Valette JC (1990) lnflammabilite des especes forestieres mediter-ranneenes: consequences sur la combustibilite des formations forestieres. Revue Forestiere Francaise 42, 76-92.
Weise DR, Hartford RA, Mahaffey L (1998)Assessing live fuel moisture for tire management applications. In ‘20th Tall Timbers Fire Ecology Conference’. Boise, ID. (Eds TL Pruden, LA Brennan) pp. 49-55. (Tall Timbers Research Station: Tallahassee, FL)
Weise DR, Zhou Z, Sun L, Mahalingam S (2005) Fire spread in cha-parral: go or no-go. International Journal of Wildland Fire 14. 99-106. doi: 10.1071/WF04049
White RH, Weise DR, Frommer S (1996) Preliminary evaluation of the flammability of native and ornamental plants with the cone calorime-ter. In ‘21st International Conference on Fire Safety’. January 1996, Clarion Hotel, San Francisco International Airport, Millbrae, California. pp. 256-265. (Product Safety Corporation: Sissonville, WV)
White RH, DeMars D, Bishops M (1997) Flammability of Christ-mas trees and other vegetation. In ‘Proceedings of 24th Interna-tional Conference on Fire Safety’. pp. 99-110. (Product Safety Corporation: Sissonville, WV)
White RH, Weise DR, Mackes K, Dibble AC (2002) Cone calorimeter testing of vegetation: an update. In ‘35th International Conference on Fire Safety’, July 2002, Ramada Plaza Hotel and Conference Center, Columbus, Ohio. pp. 1-12. (Columbus, OH)
http://www.publish.csiro.au/journals/ijwf