use$and$interpretaon$of$ld$ score$regression$
TRANSCRIPT

Use and Interpreta,on of LD Score Regression
Brendan Bulik-‐Sullivan bulik@broadins,tute.org PGC Stat Analysis Call
Outline of Talk
• Intui,on, Theory, Results – LD Score regression intercept: dis,nguishing polygenicity from popula,on stra,fica,on
– Gene,c correla,on from summary sta,s,cs
• What can LD Score Regression do for you? – Prac,cal advice on using LD Score in day-‐to-‐day GWAS analysis
• Useful links at the end
LD Score Regression Intercept
Dis,nguishing Polygenicity from Popula,on Stra,fica,on
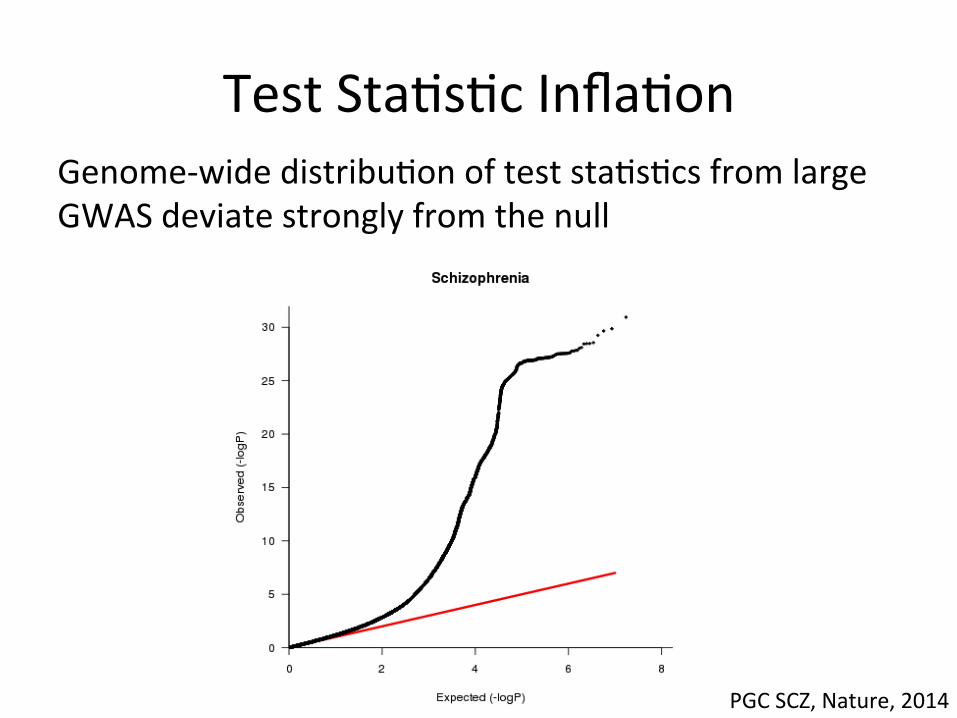
Test Sta,s,c Infla,on Genome-‐wide distribu,on of test sta,s,cs from large GWAS deviate strongly from the null
PGC SCZ, Nature, 2014
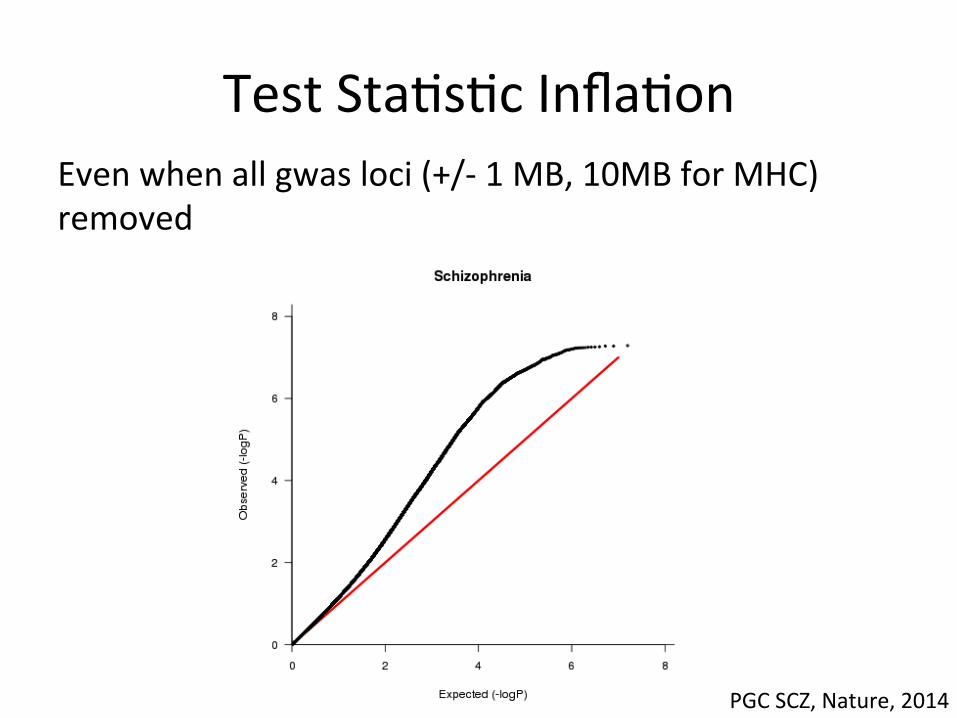
Test Sta,s,c Infla,on Even when all gwas loci (+/-‐ 1 MB, 10MB for MHC) removed
PGC SCZ, Nature, 2014

Toy Illustra,on of Genome
LD blocks
Lonely SNPs [no LD] LD Block Lonely SNP
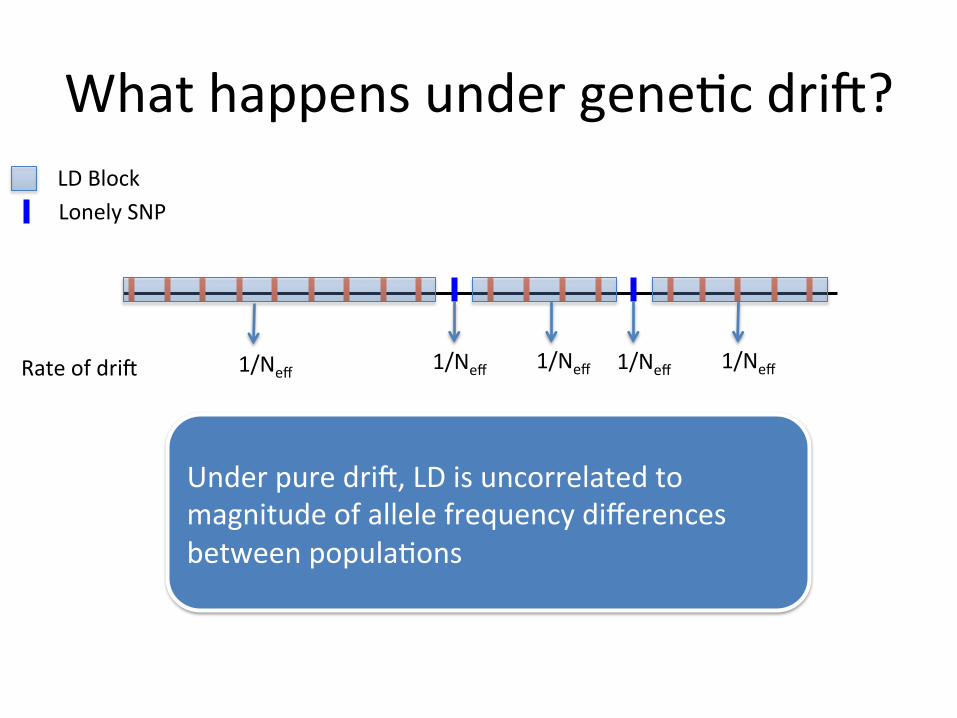
What happens under gene,c dri^? LD Block Lonely SNP
Rate of dri^ 1/Neff 1/Neff 1/Neff
1/Neff
1/Neff
Under pure dri^, LD is uncorrelated to magnitude of allele frequency differences between popula,ons

Simula,on of a gene,c signal in polygenic architecture
LD Block Lonely SNP
Sim 1 * *
* Causal SNP All SNPs in LD blocks w/ causal SNP have high chi-‐square

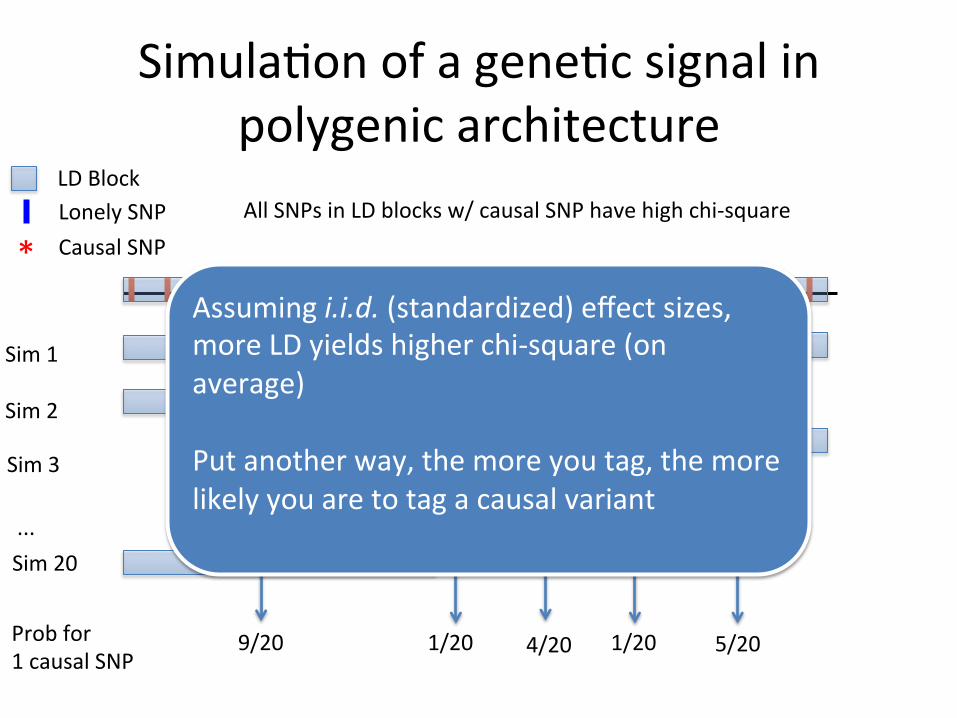
Simula,on of a gene,c signal in polygenic architecture
LD Block Lonely SNP
Sim 1 * * Sim 2 * * Sim 3
* *
* Causal SNP
... Sim 20 * * Prob for 1 causal SNP
9/20 1/20 4/20 1/20 5/20
All SNPs in LD blocks w/ causal SNP have high chi-‐square
Simula,on of a gene,c signal in polygenic architecture
LD Block Lonely SNP
Sim 1 * * Sim 2 * * Sim 3
* *
* Causal SNP
... Sim 20 * * Prob for 1 causal SNP
9/20 1/20 4/20 1/20 5/20
Assuming i.i.d. (standardized) effect sizes, more LD yields higher chi-‐square (on average) Put another way, the more you tag, the more likely you are to tag a causal variant
All SNPs in LD blocks w/ causal SNP have high chi-‐square
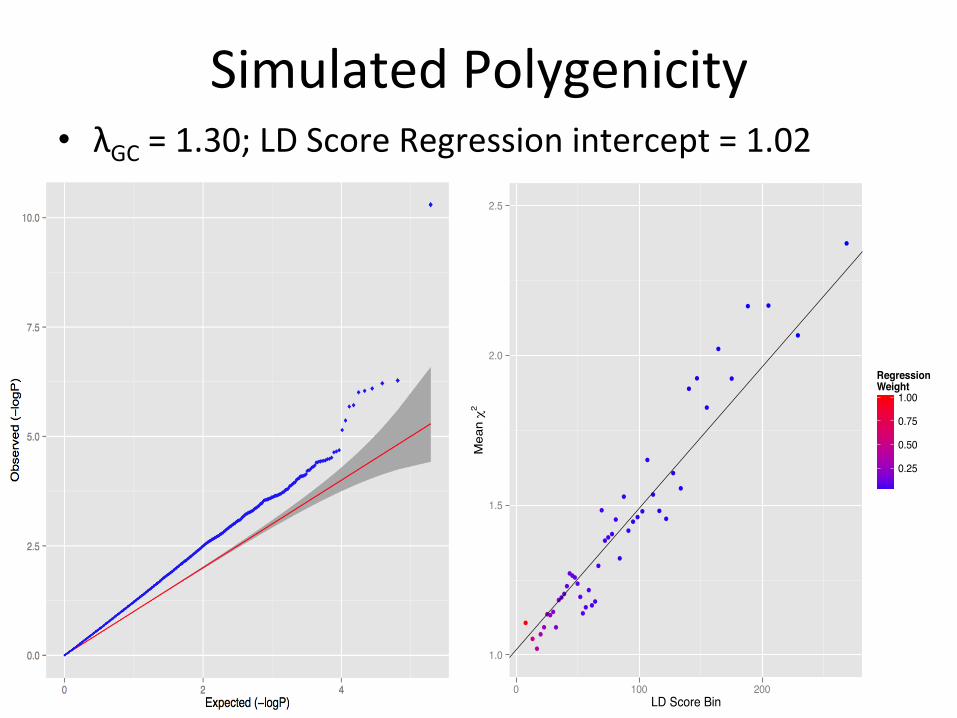
Simulated Polygenicity • λGC = 1.30; LD Score Regression intercept = 1.02
●
●
●
●●
●●●
●
●●●
●
●●●●
●
●●
●
●●
●
●
●●●
●
●
●
●
●●●
●
●
●
●
●
●
●
●
●
●
●
● ●
●
●
1.0
1.5
2.0
2.5
0 100 200LD Score Bin
Mea
n χ
20.25
0.50
0.75
1.00
RegressionWeight

Simulated Pop Strat (Sweden vs UK) • λGC = 1.30; LD Score Regression intercept = 1.32
●
●
●
●●●●
●●●
●
●
●●
●●
●
●
●
●
●
●
●
●
●●
●
●
●
●
●●
●
●
●
●
●
●
●
●●
●
●
●
●●
●
●
●
●
1.0
1.5
2.0
2.5
0 100 200LD Score Bin
Mea
n χ
2
0.25
0.50
0.75
1.00
RegressionWeight
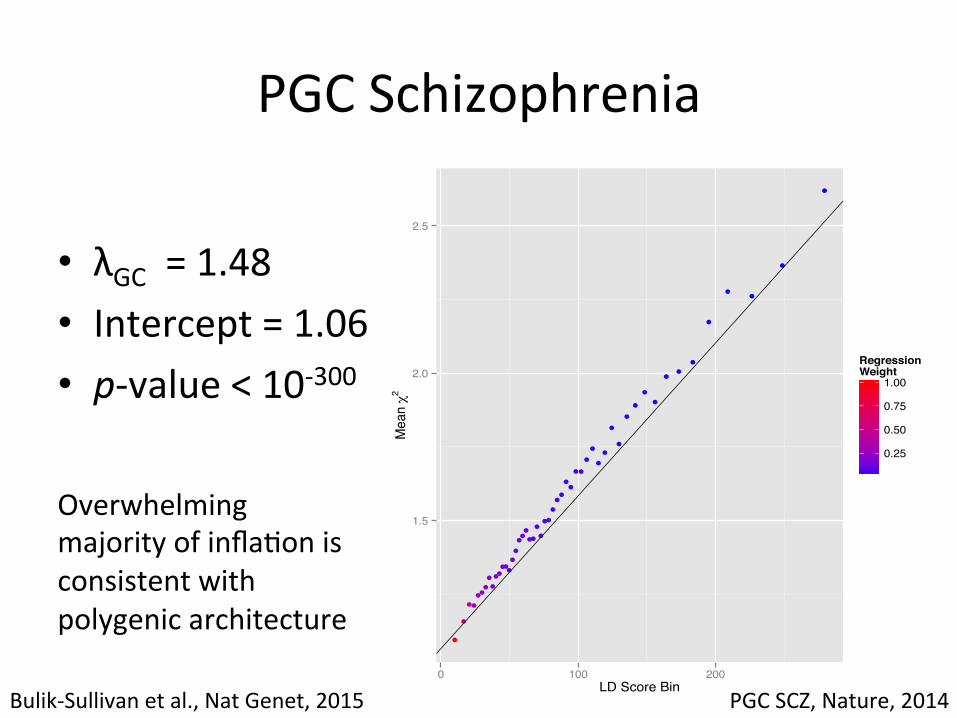
PGC Schizophrenia
• λGC = 1.48 • Intercept = 1.06 • p-‐value < 10-‐300
●
●
●●
●●●
●
●
●●●●●
●
●
●●●
●●
●
●
●●
●
●●
●●
●●
●
●
●
●
●
●
●
●
●
●
●●
●
●
●●
●
●
1.5
2.0
2.5
0 100 200LD Score Bin
Mea
n χ2
0.25
0.50
0.75
1.00
RegressionWeight
Overwhelming majority of infla,on is consistent with polygenic architecture
Bulik-‐Sullivan et al., Nat Genet, 2015 PGC SCZ, Nature, 2014

LD Score Regression • Regress χ2 sta,s,cs against LD Score
– LD Score (Lj) is a property of SNP j, defined as sum r2, es,mated as sum r2 w/ all other SNPs a 1cM window.
– N is sample size. – M is # SNPs. – h2 is SNP-‐heritability. – a is infla,on from pop strat/cryp,c relatedness.
Bulik-‐Sullivan et al., Nat Genet, 2015

LD Score Results
• Applied to > 20 GWAS – Almost all infla,on due to polygenicity. – LD Score intercept < λGC in all studies.
• Conclusions: – PCA / mixed models mostly appear to work. – Genomic control (dividing all χ2 sta,s,cs by λGC) is unnecessarily conserva,ve.
Bulik-‐Sullivan et al., Nat Genet, 2015
Gene,c correla,on
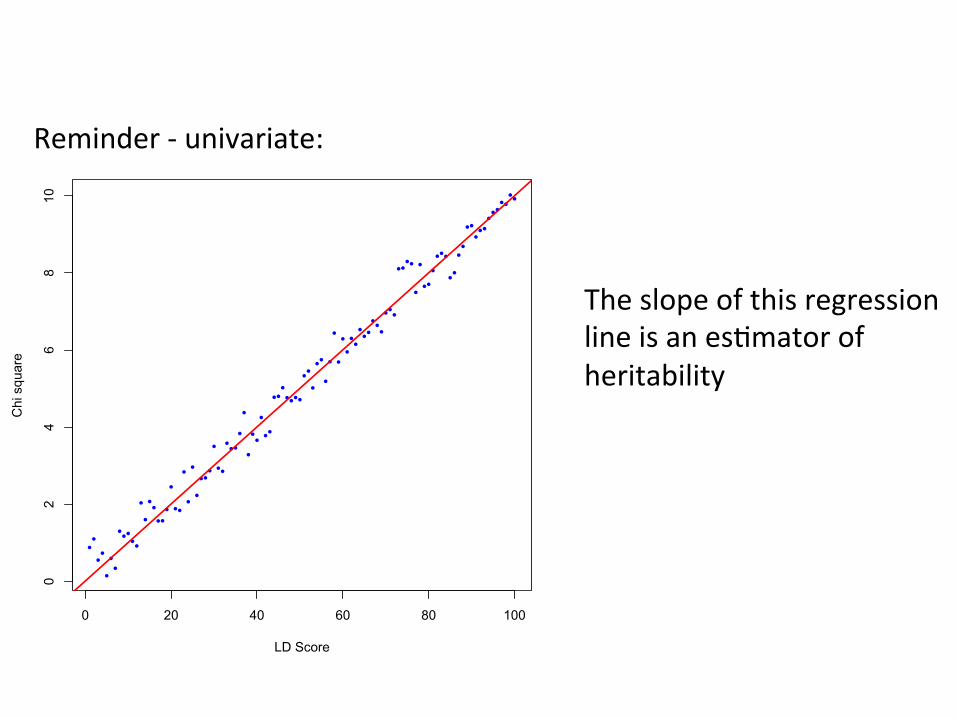
Reminder -‐ univariate:
The slope of this regression line is an es,mator of heritability
0 20 40 60 80 100
02
46
810
LD Score
Chi
squ
are
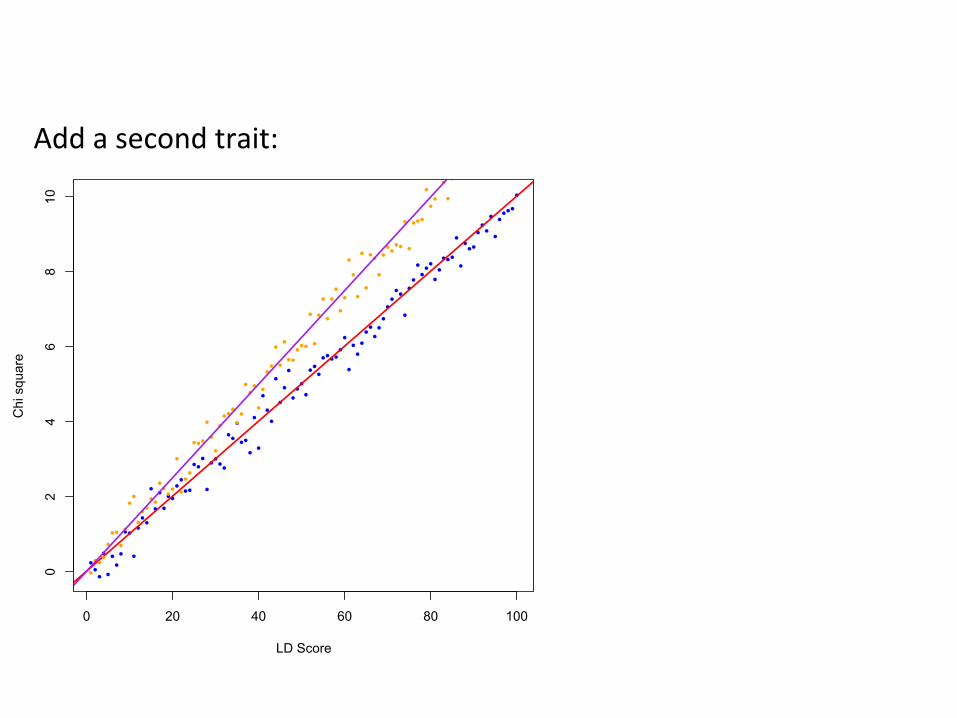
Add a second trait:
0 20 40 60 80 100
02
46
810
LD Score
Chi
squ
are
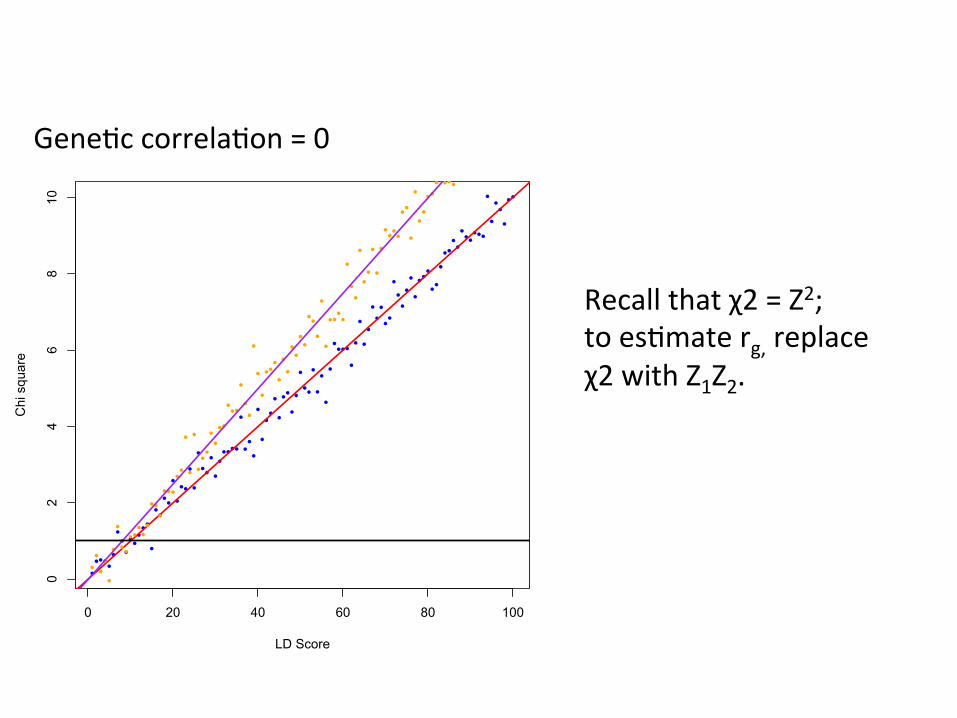
Recall that χ2 = Z2; to es,mate rg, replace χ2 with Z1Z2.
0 20 40 60 80 100
02
46
810
LD Score
Chi
squ
are
Gene,c correla,on = 0
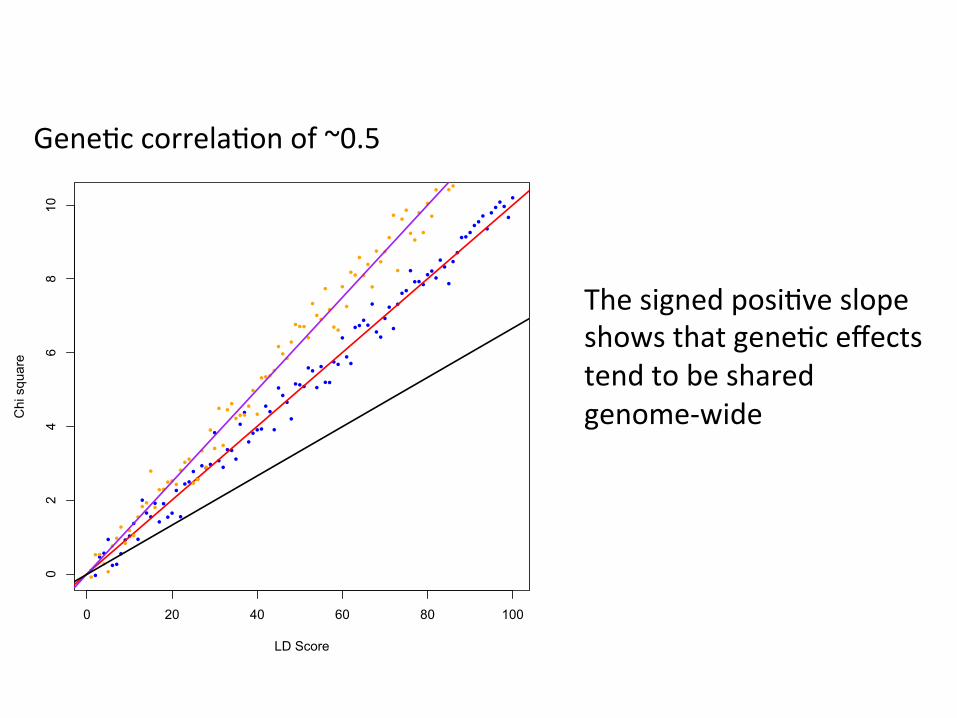
Gene,c correla,on of ~0.5
The signed posi,ve slope shows that gene,c effects tend to be shared genome-‐wide
0 20 40 60 80 100
02
46
810
LD Score
Chi
squ
are
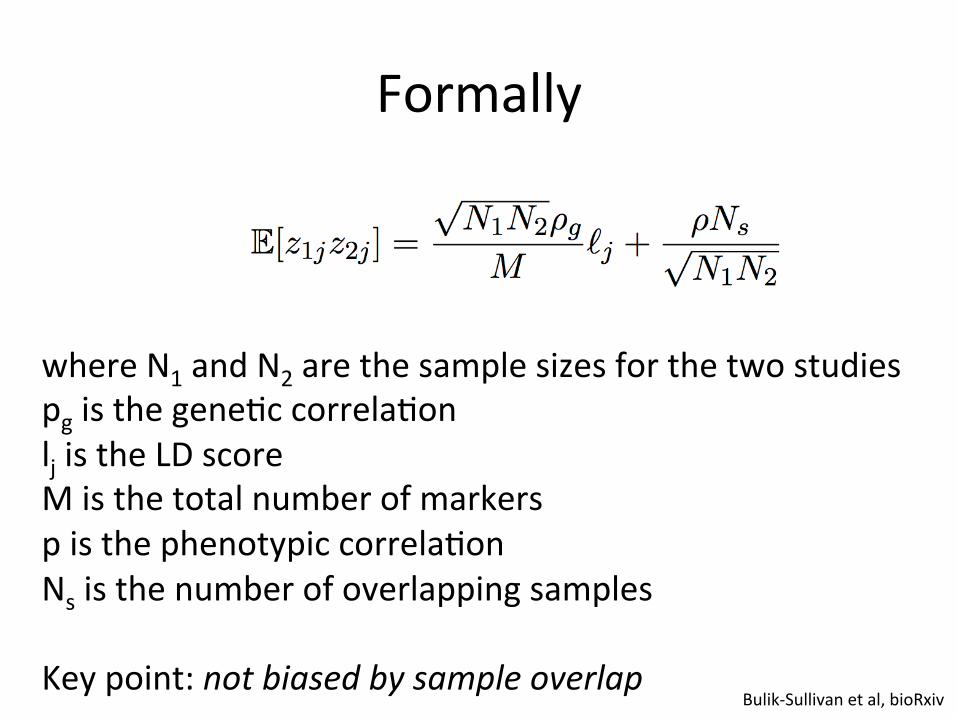
Formally
where N1 and N2 are the sample sizes for the two studies pg is the gene,c correla,on lj is the LD score M is the total number of markers p is the phenotypic correla,on Ns is the number of overlapping samples Key point: not biased by sample overlap
Bulik-‐Sullivan et al, bioRxiv

Proof of concept
Lee et al, 2013 Nat Gen
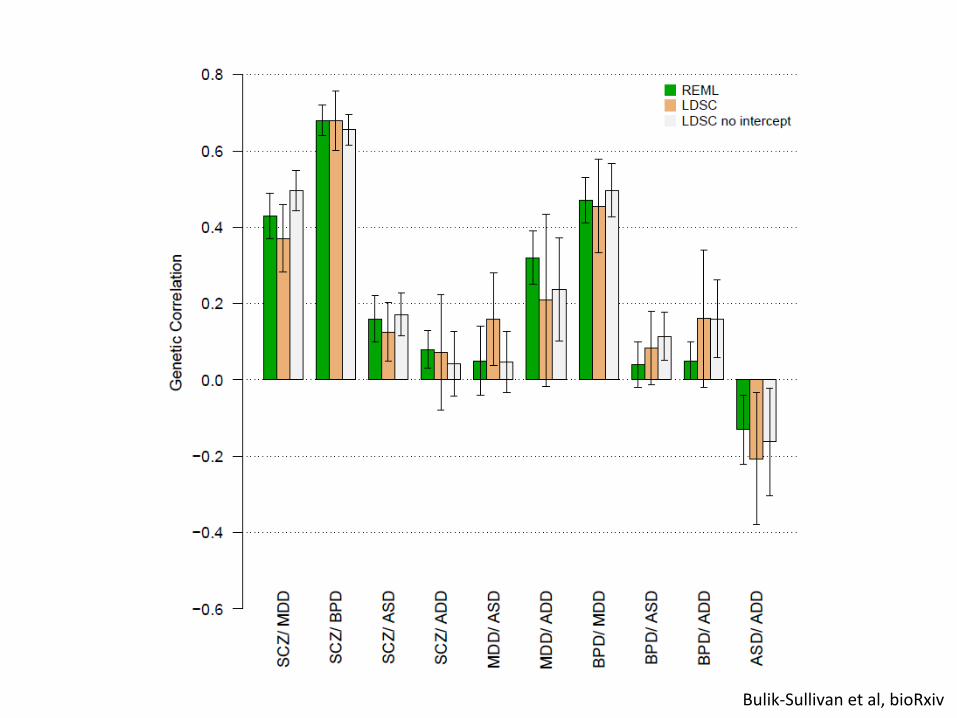
Bulik-‐Sullivan et al, bioRxiv
*
*
*
****
*
***
*
*
*
*
*
*
**
*
*
*
*
****
*
*
*
*
*
*
*
**
*
*
*
*
*
***
*
*
**
**
*
*
***
*
****
*
*
**
*
*
*
**
**
*
*
*
**
*
*
*
*−0.55
−0.38
−0.21
−0.03
0.14
0.31
0.48
0.66
0.83
1Ever/Neve
r Smoke
r
Obesity
(Adu
lt)
Childho
od O
besity
Type 2
Diabete
s
Fastin
g Gluc
ose
Trigly
cerid
es
Extrem
e Wais
t−Hip
Ratio
Corona
ry Arte
ry Dise
ase
LDL C
holes
terol
College
(Yes
/No)
Height
(Adult)
Infan
t Hea
d Circ
umfer
ence
Birth Le
ngth
Birth W
eight
HDL Cho
lester
ol
Age at
Men
arche
Anorex
ia Nerv
osa
Schizo
phren
ia
Bipolar
Disorde
r
Major D
epres
sion
Autism
Spectr
um Diso
rder
Rheum
atoid
Arthriti
s
Alzheim
er's D
iseas
e
Crohn's
Diseas
e
Ulcerat
ive Colit
is
Ever/Never Smoker
Obesity (Adult)
Childhood Obesity
Type 2 Diabetes
Fasting Glucose
Triglycerides
Extreme Waist−Hip Ratio
Coronary Artery Disease
LDL Cholesterol
College (Yes/No)
Height (Adult)
Infant Head Circumference
Birth Length
Birth Weight
HDL Cholesterol
Age at Menarche
Anorexia Nervosa
Schizophrenia
Bipolar Disorder
Major Depression
Autism Spectrum Disorder
Rheumatoid Arthritis
Alzheimer's Disease
Crohn's Disease
Ulcerative Colitis
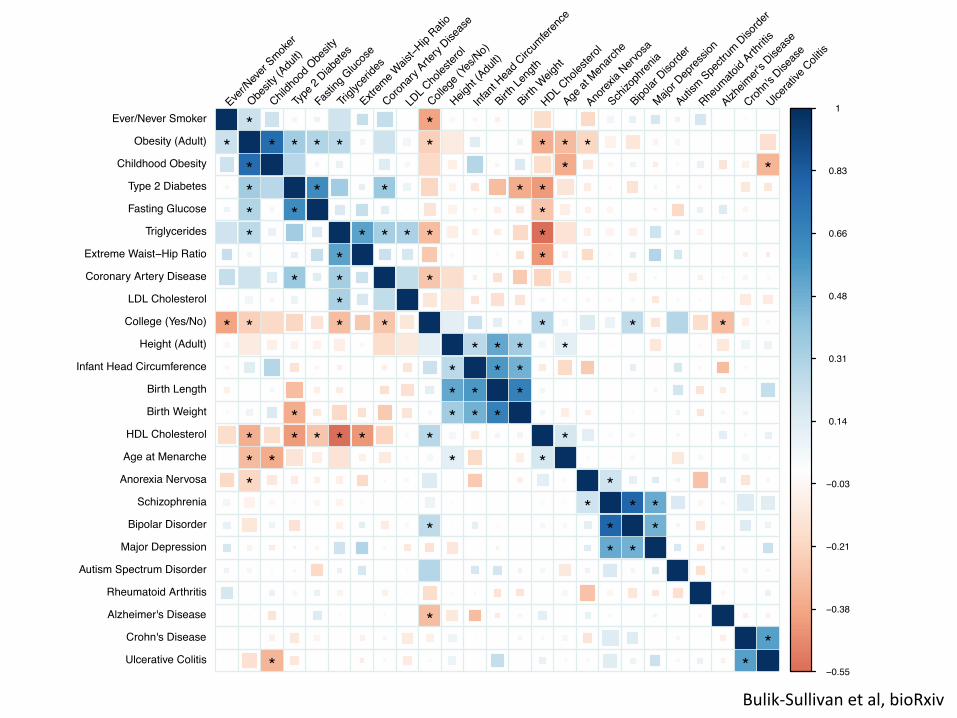
Figure 2: Genetic Correlations among 25 GWAS. Blue represents positive genetic correlations; red repre-sents negative. Larger squares correspond to more significant p-values. Genetic correlations that are di↵erentfrom zero at 1% FDR are shown as full-sized squares. Genetic correlations that are significantly di↵erentfrom zero after Bonferroni correction for the 300 tests in this figure have an asterisk. We show results that donot pass multiple testing correction as smaller squares in order to avoid whiting out positive controls wherethe estimate points in the expected direction, but does not achieve statistical significance due to small samplesize. This multiple testing correction is conservative, since the tests are not independent.
The estimates of the genetic correlation between age at onset of menarche and adult height [31],cardiovascular disease [32] and type 2 diabetes [32,33] are consistent with the epidemiological asso-ciations. The estimate of a negative genetic correlation between anorexia nervosa and obesity (and
6
Bulik-‐Sullivan et al, bioRxiv

New Psychiatric rg
V. Anula, Brainstorm Project
In addi,on: +20% rg between AN and BMI

Pause for ques,ons …
What can LD Score do for you?
Prac,cal advice on using LD Score in day-‐to-‐day GWAS analysis

So^ware
• LD Score regression implemented in free + open-‐source python command-‐line tool ldsc: – github.com/bulik/ldsc
• Tutorials & FAQ here: – github.com/bulik/ldsc/wiki
• Ask me ques,ons on the google group!

LD Score is Fast and Easy
• Trivial run-‐,me & memory (~15s, ~1GB for h2). • Automated data re-‐formaung and QC. – munge_sumstats.py included w/ ldsc. – No need for one-‐off perl scripts.
• Download pre-‐computed LD Scores. – broadins,tute.org/~bulik/eur_ldscores/ – (European-‐only, for now)
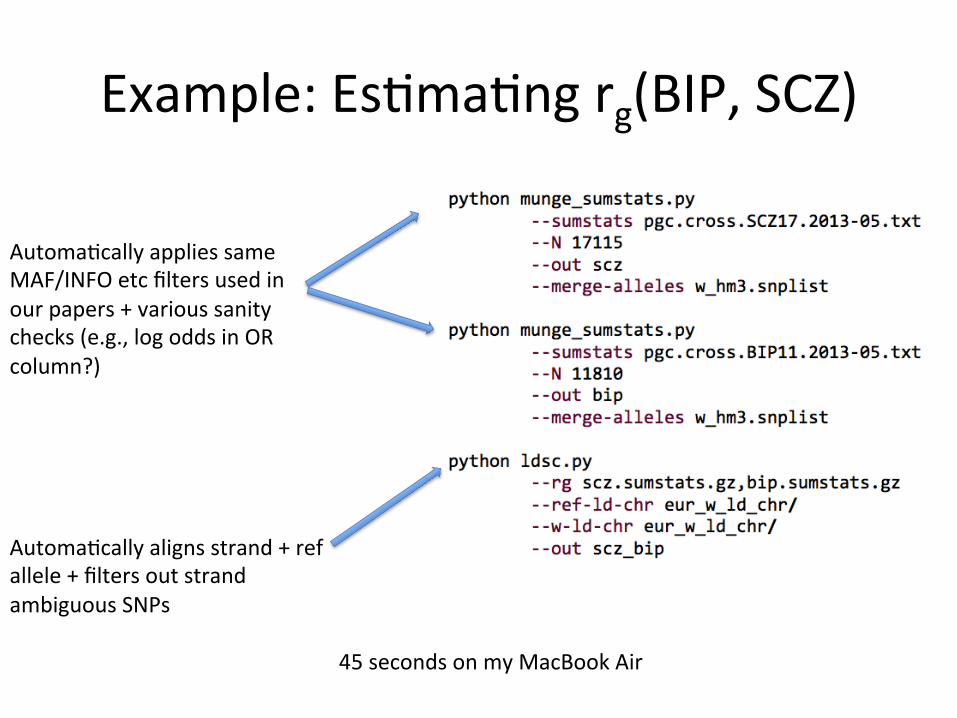
Example: Es,ma,ng rg(BIP, SCZ)
45 seconds on my MacBook Air
Automa,cally applies same MAF/INFO etc filters used in our papers + various sanity checks (e.g., log odds in OR column?)
Automa,cally aligns strand + ref allele + filters out strand ambiguous SNPs
Basic QC with LD Score intercept
• QC Ques,on: have we adequately controlled for confounding from popula:on stra:fica:on?
• Solu,on: check LD Score intercept close to 1. – Caveat: only sensi,ve to sources of genome-‐wide infla,on; can’t tell you whether 10 suspect SNPs are OK.
QC with LD Score h2
• QC Ques,on: do we see more or less infla:on than we would expect given N and h2?
• Low infla,on can mean phenotype problems. – Non-‐screened controls. – Bad phenotype def’n. – Data munging error, e.g., column swap in ped file.
• Solu,on: compare h2(old data), h2(new data). – Big + significant differences may indicate problems.
QC with LD Score rg
• QC Ques,on: does phenotype defini:on in new data match older data? – Coordina,ng pheno def’n across studies is hard. – Data munging error, e.g., column swap in ped file.
• Solu,on: compute rg(new data, old data) – Par,cularly useful for summary-‐sta,s,c meta-‐analysis consor,a.

Streamlined PRS • Statements about predic,on R2 from PRS analysis are o^en equivalent to statements about h2 or rg:
• PRS for X predicts1 Y if and only if rg(X, Y) != 0. • PRS for X predicts1 X if and only if h2(X) > 0.
1In independent samples
Dudbridge, PLoS Gen, 2013
Streamlined PRS
• LD Score rg/h2 o^en faster/easier than PRS – No LD pruning. – No individual-‐level genotype data. – Don’t have to worry about sample overlap. – Don’t have to split sample into train/test sets. – Caveat: GCTA and PRS have (slightly) be�er power than LD Score, possibly makes a big difference for small N.
Prac,cal Advice
• LD Score is noisy at small N. – Rule of thumb: use GCTA for N < 3k.
• Par,,oned h2 requires very large N. – Rule of thumb: not worth trying for < 5k cases.

Prac,cal Advice
• ldsc not presently applicable to admixed data. – LD structure in admixed samples is more complex.
• If no pop strat / no sample overlap, constrained intercept LD Score has lower SE – Equivalent to Haseman-‐Elston regression (Bulik-‐Sullivan, bioRxiv, 2015)
Notes for PGC users
• munge_sumstats.py -‐-‐daner flag processes Ricopili-‐format data (daner* files)
• ldsc.py -‐-‐samp-‐prev and -‐-‐pop-‐prev flags convert to liability-‐scale h2
Acknowledgements
• rg + func,onal h2 + ldsc joint work w/ Hilary Finucane
• Ben Neale • Alkes Price • Nick Pa�erson • Po-‐Ru Loh • Mark Daly • Many others …
URLs
• ldsc – github.com/bulik/ldsc – Installa,on instruc,ons – FAQ
• Tutorials / wiki – github.com/bulik/ldsc/wiki
• Pre-‐computed European LD Scores – broadins,tute.org/~bulik/eur_ldscores/
• ldsc_users google group: – groups.google.com/forum/?hl=en#!forum/ldsc_users

LD Score Papers
• LD Score regression dis,nguishes confounding from polygenicity in genome-‐wide associa,on studies
• Par,,oning heritability by func,onal category using GWAS summary sta,s,cs
• An Atlas of Gene,c Correla,ons across Human Diseases and Traits
• Rela,onship between LD Score and Haseman-‐Elston Regression