user guide contents sofa support june 2012.pdfuser guide contents sofa - how you can use it...
TRANSCRIPT

USER GUIDE CONTENTS
SOFA - how you can use itInstalling SOFASOFA won't start - solutionsGetting startedEntering fresh dataMy variables won't go into SOFASetting variable details e.g. labelsConnecting to databasesImporting spreadsheet/csv dataOnline surveys with Google DocsReport tablesStatistical testsMaking chartsFiltering dataRecoding dataNon-Ubuntu/Debian Linux installationExporting data
SOFA SupportIf you are looking for affordablecommercial support, or if you want tosupport making Statistics Open For All,there is an option to suit you:
Released with open source AGPL3 licence© 2009-12 Paton-Simpson & Associates Ltd

Contents [http://www.sofastatistics.com/userguide.php]
Using SOFASOFA can be used to:
make charts e.g. Pie Chartsproduce attractive report tables on your data e.g. gender vs agerun basic statistical tests e.g. one-way ANOVAsand generally increase your understanding of your data.
SOFA is great for initial research and exploratory analysis - or as someone put it rather nicely, “statistical/mathematical doodling”. Itdoesn't have every statistical test you could possibly need, but for many purposes it has more than enough. And the plan is togradually extend SOFA over time without compromising the emphasis on ease of use, beautiful output, and learn as you go.
Contents [http://www.sofastatistics.com/userguide.php]
Wiki
help/overview.txt · Last modified: 2012/06/13 17:18 by adminExcept where otherwise noted, content on this wiki is licensed under the following license: CC Attribution-Noncommercial-Share Alike3.0 Unported [http://creativecommons.org/licenses/by-nc-sa/3.0/]

Contents [http://www.sofastatistics.com/userguide.php]
Installation
Installer PackagesSOFA Statistics has installer packages for:
Windows (covers XP, Vista, and Windows 7).
A video of installation is here Windows Installation [http://www.sofastatistics.com/videos.php#win_install]
The installer lets you skip adding all the extra packages if you have already installed them in a previous installation of SOFAStatistics.
Ubuntu deb package (covers Ubuntu and Linux Mint).

Mac dmg package (covers Leopard and Snow Leopard)
The Mac installer, like the Windows installer, lets you opt out of installing some packages e.g. Python if you already have a suitableversion installed
If you have another Linux distro you should also be able to get SOFA running using a special installer script in the tar.gz file. See Non-Ubuntu/Debian Linux Installation [http://www.sofastatistics.com/wiki/doku.php?id=help:linux_installation]

Ubuntu/Debian Linux Installation [http://www.sofastatistics.com/wiki/doku.php?id=help:linux_installation]
If you have any installation problems, please contact [email protected].
Installing a Newer Version
This should Just Work . The only quirk is that SOFA might rename your existing default_report.htm file to something likedefault_report_pre_version_x.htm to make sure everything new you make works in the new system. Newer versions of SOFA Statisticssometimes upgrade the underlying Javascript that displays charts in reports and existing charts may get broken by Javascript changes.This should become less of a practical issue over time as SOFA stabilises.
Linux Mint Menu IssueFor some mysterious reason, the SOFA Statistics shortcut (under Other) doesn't work. But there is a simple workaround. Just drag theicon onto the desktop. That icon will work. There seems to be something a little quirky about the Mint Menu.
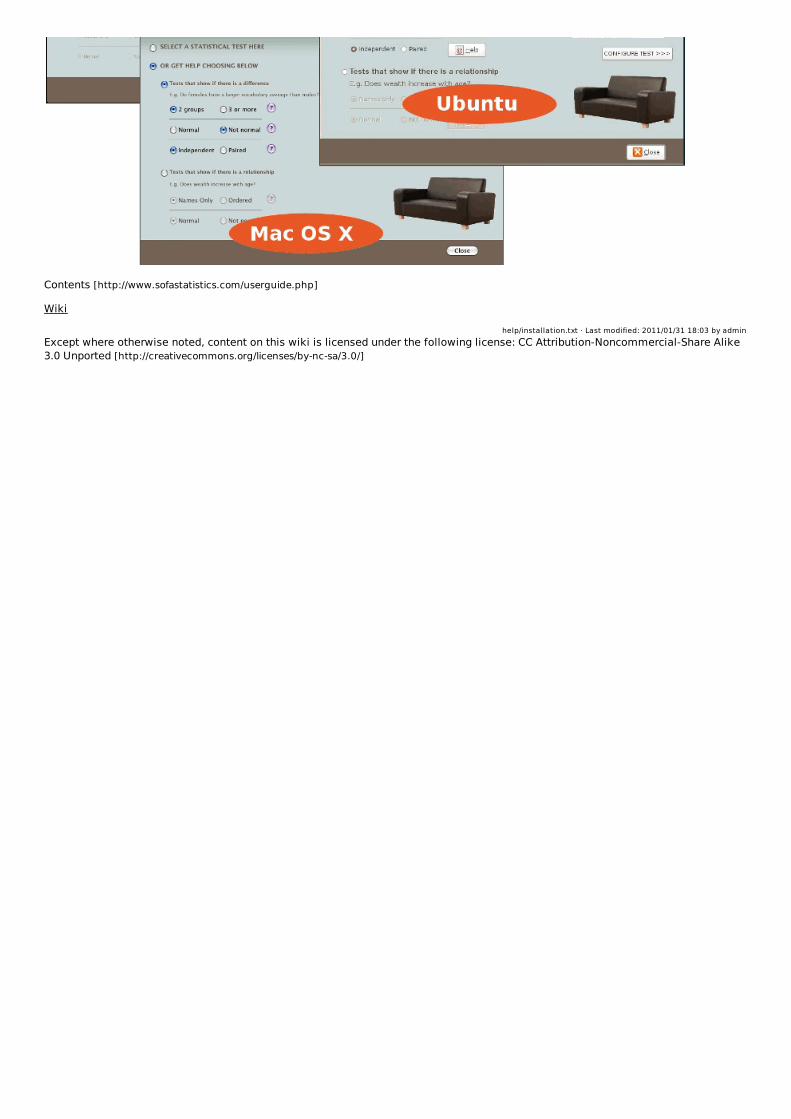
Screenshot on Three Systems
Contents [http://www.sofastatistics.com/userguide.php]
Wiki
help/installation.txt · Last modified: 2011/01/31 18:03 by adminExcept where otherwise noted, content on this wiki is licensed under the following license: CC Attribution-Noncommercial-Share Alike3.0 Unported [http://creativecommons.org/licenses/by-nc-sa/3.0/]

Contents [http://www.sofastatistics.com/userguide.php]
SOFA Won't StartSorry! But we can probably fix it. Make sure you are installing the latest version of SOFA Statistics Sourceforge SOFA downloads[https://sourceforge.net/projects/sofastatistics/files/]. Newer versions are sometimes better at handling problems.
Here are some things which might help:
Using Sofastats RecoveryCheck to see if you have a local sofastats_recovery folder. E.g.
Windows - it should be in one of the following places unless you have custom configured where your home folder is:C:\Documents and Settings\username\sofastats_recoveryC:\Documents and Settings\username\My Documents\sofastats_recoveryC:\Users\username\sofastats_recoveryC:\Users\username\Documents\sofastats_recovery
Mac OS X:/Users/username/sofastats_recovery
Linux e.g. Ubuntu:/home/username/sofastats_recovery
If not, try to open SOFA using IDLE (see below).
Next to your local sofastats_recovery folder should be a local sofastats folder. Delete your local “sofastats” folder and rename the“sofastats_recovery” folder to “sofastats”. When you restart SOFA Statistics, everything should now work.
The “sofastats_recovery” folder only includes a clean install of SOFA. Any modifications you have made will be lost if you wipe the“sofastats” folder. You can always keep a copy of your original “sofastats” folder so you can recover individual items e.g. the internalSOFA database from “sofastats/_internal/sofa_db”.
1. Delete the sofastats folder
2. Rename the sofastats_recovery folder to sofastats
Open SOFA using IDLE to see any error messagesTo use IDLE you will to install Python (version 2.6 is needed for SOFA - installers available herehttp://www.python.org/download/releases/2.6.6/ [http://www.python.org/download/releases/2.6.6/]). You can use IDLE to open and thenrun SOFA.
Step 1 - Find SOFA's start.py file. In Windows it will usually be in C:\Program Files\sofastats. Ubuntu users should look at/usr/share/pyshared/sofastats. For other Linux see /usr/share/sofastats. In Macs look for /Applications/SOFA Statistics.app

Step 2 - Right click start.pyw (or start.py) file and select Edit with IDLE
Step 3 - There should be two windows open - click on the one with lots of coloured text in it and either press F5 or from the menuselect Run>Run Module
Step 4 - Look at the messages displayed. Is there anything that might explain the problem? Email [email protected] for help,preferably with a screen-shot of the message.
In Ubuntu, you can open the terminal and try:
python2.6 <your path to the sofastats folder>/start.py
e.g. python2.6 /usr/share/pyshared/sofastats/start.py
In other Linux distros, assuming you ran the install script, you can open the terminal and try:
sofastats

sofastats
or failing that:
python2.6 <your path to the sofastats folder>/start.py
e.g. python2.6 /usr/share/start.py
Python Broken?Reinstall SOFA as usual but, when you get to the Python step, select the Repair option.
Wrong version of PythonSOFA Statistics currently requires Python 2.6. Any additional packages installed by the SOFA installer must also be attached topython26 not python27 etc. If your system has multiple versions of Python installed, the icon or launcher must explicitly refer to 2.6.
On Windows, one test you can try is to click on Start then Run and run the following:
C:\Python26\python.exe “C:\Program Files\sofastats\start.pyw”
The same approach can be tried on Mac and Linux from the terminal - explicitly tell the system which version of Python to use tolaunch SOFA. NB the start.py file is the one you need if not on Windows.
python2.6 /home/username/sofastats/start.py
Ask for Help
Community discussion group - http://groups.google.com/group/sofastatistics [http://groups.google.com/group/sofastatistics]Direct email to lead developer - Open email to SOFA developer [mailto:mailto:[email protected]?subject=I%20am%20interested%20in%20SOFA]
Specific Errors
Problems with comtypesComtypes is installed as part of the SOFA installation process.
If you have any comtypes problems, try reinstalling it manually e.g. by double clicking “comtypes-0.6.2.win32.exe” in “C:\ProgramFiles\sofastats\sofalibs”. Make sure it is associated with Python 2.6 (not 2.7 etc if you already have other versions of Python - seeWrong version of Python).
Did that step succeed? On Windows XP you can see it in a folder like below. Is it present on your system? Under python26 notpython27?
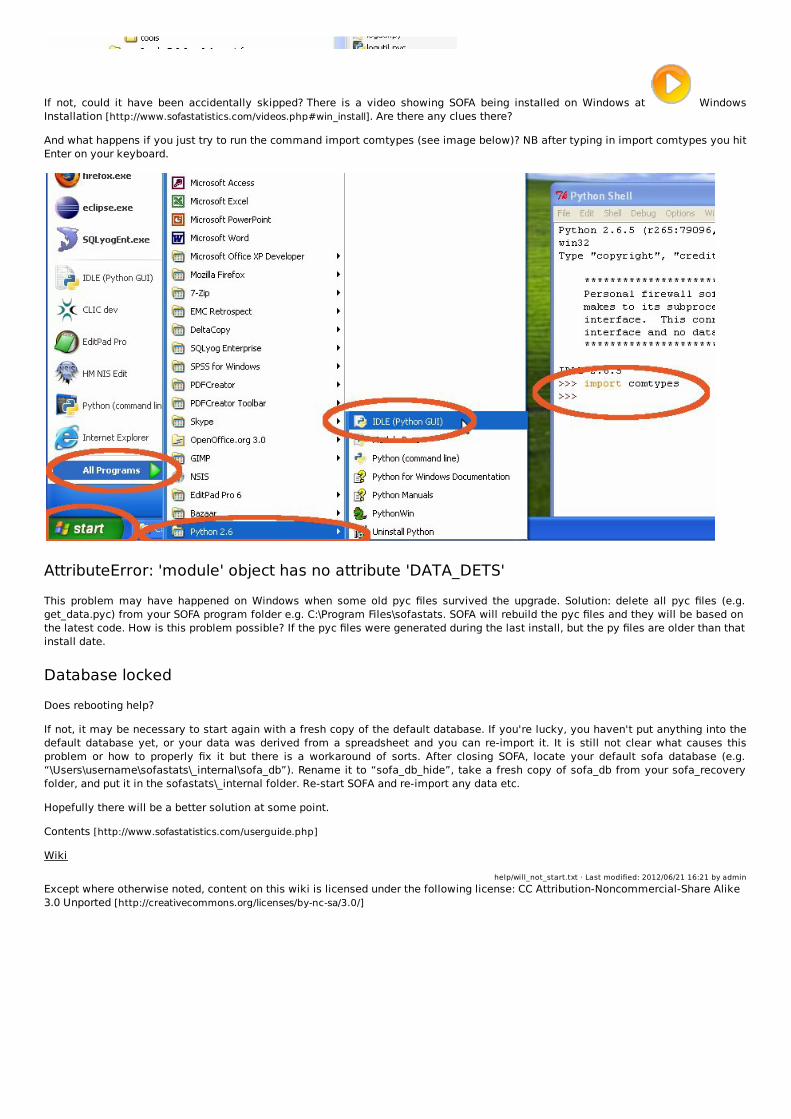
If not, could it have been accidentally skipped? There is a video showing SOFA being installed on Windows at WindowsInstallation [http://www.sofastatistics.com/videos.php#win_install]. Are there any clues there?
And what happens if you just try to run the command import comtypes (see image below)? NB after typing in import comtypes you hitEnter on your keyboard.
AttributeError: 'module' object has no attribute 'DATA_DETS'This problem may have happened on Windows when some old pyc files survived the upgrade. Solution: delete all pyc files (e.g.get_data.pyc) from your SOFA program folder e.g. C:\Program Files\sofastats. SOFA will rebuild the pyc files and they will be based onthe latest code. How is this problem possible? If the pyc files were generated during the last install, but the py files are older than thatinstall date.
Database lockedDoes rebooting help?
If not, it may be necessary to start again with a fresh copy of the default database. If you're lucky, you haven't put anything into thedefault database yet, or your data was derived from a spreadsheet and you can re-import it. It is still not clear what causes thisproblem or how to properly fix it but there is a workaround of sorts. After closing SOFA, locate your default sofa database (e.g.“\Users\username\sofastats\_internal\sofa_db”). Rename it to “sofa_db_hide”, take a fresh copy of sofa_db from your sofa_recoveryfolder, and put it in the sofastats\_internal folder. Re-start SOFA and re-import any data etc.
Hopefully there will be a better solution at some point.
Contents [http://www.sofastatistics.com/userguide.php]
Wiki
help/will_not_start.txt · Last modified: 2012/06/21 16:21 by adminExcept where otherwise noted, content on this wiki is licensed under the following license: CC Attribution-Noncommercial-Share Alike3.0 Unported [http://creativecommons.org/licenses/by-nc-sa/3.0/]

Contents [http://www.sofastatistics.com/userguide.php]
Getting Started
Demonstration DataBefore analysing your own data, it can be helpful to play with the demonstration data provided with SOFA Statistics. Click the“Enter/Edit Data” button to get started.
This brings up the data selection dialog. Here you can look at existing data tables or make new ones. Here we just want to look at thedemonstration data table “demo_tbl”. Click on “Open”.
Here you can see the data we will be test analysing using SOFA Statistics. Note the pale blue column - the background colour indicatesthe field is read-only. Typically, read-only fields are autonumbered or timestamps.

Click on “Close” when you're finished looking.
Making a Simple Report TableOn the main SOFA form, click on “Report Tables”,
Let's start with a simple report table of Age Group vs Country. NB all of this data is fictitious and designed to allow features of theprogram to be demonstrated.
1. For “Table Type” select “Crosstabs”. A cross tabulation shows one or more variables against one or more other variables e.g.

Age Group in the rows and Country in the columns.2. We need to add a row so click on “Add” under the “Rows” label3. Select “Age Group” and either double click it or select “OK”.
Under the “Columns” label click on “Add” and add Country.
In the demonstration pane below you will see a rough illustration of what the table will look like. If you want to see the actual table,click on “Run”.
If “Add to report” is ticked, the output will also be saved to the end of the output file specified at the bottom of the form.
Extra Configuration of Report TableNext you may want to configure the rows and/or columns. Let's add a total column and columns for row and column percentages.
1. Click on “Config” under the “Columns” label2. Tick “Total” under the “Misc” heading3. Tick “Column %” and “Row %” under the “measures” heading4. Click on “OK” to see changes in demonstration table. NB to see actual results, click on “Run”.

If you click “Run” with “Add to report” ticked, you can view the result by clicking on the “View” button. This will open your default webbrowser so you can see the output.
The styling of your table can also be changed - here are some examples of different report tables:

Documentation on making report tables is extended in Making Report Tables
AnovaClick on the “Statistics” button on the main SOFA form.
Then click on the “CONFIGURE TEST” button (ANOVA should already be selected).
Let's look at whether there is a difference between the average ages in the 3 different countries. NB all the data here is fictitious andonly for example purposes.
1. Select the variable that is averaged (the one we think might vary between groups). In this case, select “Age”.2. Select the variable with the groups. In this case, select “Country” and then select “Group A” and “Group B”.3. Click on “Run” to see results.
In this case, there is probably a real difference (p has a vary small value). Looking at the mean age for each group and the distributionfor each group will help us decide how important the difference is for the purpose at hand. NB a difference can be statisticallysignificant and clinically/politically/practically etc insignificant.

Final CommentsThere is a lot more to SOFA Statistics than what is demonstrated here. Hopefully this is enough to encourage you to try differentfeatures out. Of course, if you have any questions, ask them in the community discussion group Discussion Group[http://groups.google.com/group/sofastatistics]
Contents [http://www.sofastatistics.com/userguide.php]
Wiki
help/getting_started.txt · Last modified: 2010/06/14 18:24 by adminExcept where otherwise noted, content on this wiki is licensed under the following license: CC Attribution-Noncommercial-Share Alike3.0 Unported [http://creativecommons.org/licenses/by-nc-sa/3.0/]

Contents [http://www.sofastatistics.com/userguide.php]
Entering Fresh DataSOFA Statistics lets you enter your data directly. Or you can import it from a spreadsheet or csv file. Or you can connect directly to adatabase. This demonstration shows how to enter fresh data.
Start by clicking on the “Enter/Edit Data” button on the main SOFA form.
In the “Configure Data Table” dialog:
1. Give your table a name. NB spaces are not allowed in the table name.2. Add fields - each with a name and a data type (“Numeric” (numbers), “String” (which means text), or “Date”.3. Click on the “Update” button to save your changes and open the table ready for data entry.
Any tables you make yourself are added to the default SOFA database “sofa_db”.
To open your new table, click on “Enter/Edit Data”, select your table and click on the “Open” button.

The Sofa_Id is an autonumber to enable SOFA to keep track of everything. It can't be edited. You can edit the other fields. NB to hit the“Enter” key on your keyboard to save a row and open and empty one ready for more data entry. Note how the Sofa_Id is autfilled in.
Contents [http://www.sofastatistics.com/userguide.php]
Wiki
help/data_entry.txt · Last modified: 2010/06/14 17:27 by adminExcept where otherwise noted, content on this wiki is licensed under the following license: CC Attribution-Noncommercial-Share Alike3.0 Unported [http://creativecommons.org/licenses/by-nc-sa/3.0/]

Contents [http://www.sofastatistics.com/userguide.php]
My Variables Won't Go Into SOFAIf you have trouble analysing your variables in SOFA Statistics, check that:
1. Your data is structured the right way for the analysis you want. For example, if SOFA needs a column for gender and a columnfor height, there will be a problem if your data has a column for male height and a column for female height.
2. Any variables you need to analyse as numbers e.g. for correlation analyses or histograms, have actually been entered/importedas numeric data not as text.
Structuring data for analysisThe first step is to think about what you want to find out about the data. Here are some examples.
Types of SOFA Statistics analysis
Differences between groups
Instead of one column per condition or group there needs to be a group column and a measures column.
Example of a bad format (for SOFA):
Male Female186 167179 170...
Example of a good format (for SOFA):
Gender HeightMale 186Female 167Male 179Female 170...
In this case, the ranked or averaged variable would be Height, the Group By variable would be Gender, and groups a and b would beMale and Female respectively.
Or if we were looking at the fictitious weight data in the demonstration data and we wanted to know if it differed between twocountries:
Relationships between two different variables
E.g. looking at linear correlation:
Age Weight56 8622 55...
In the appropriate SOFA dialog you would select one variable as A and the other as B.
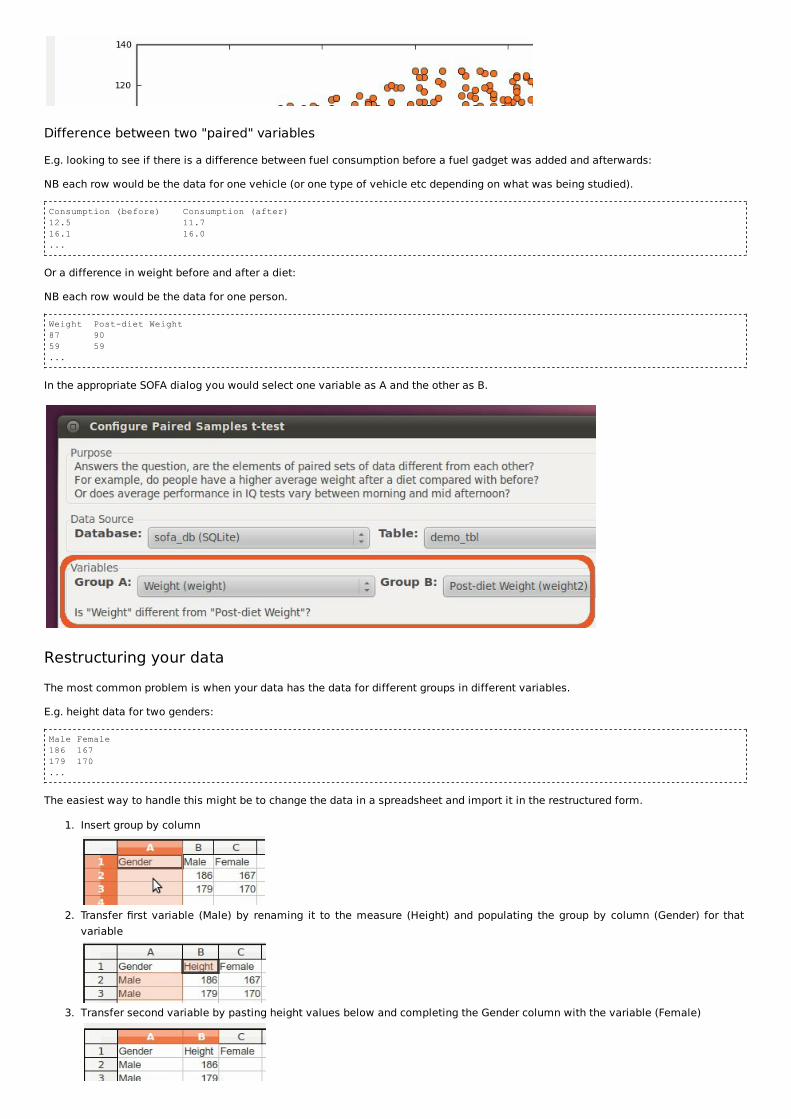
Difference between two "paired" variables
E.g. looking to see if there is a difference between fuel consumption before a fuel gadget was added and afterwards:
NB each row would be the data for one vehicle (or one type of vehicle etc depending on what was being studied).
Consumption (before) Consumption (after)12.5 11.716.1 16.0...
Or a difference in weight before and after a diet:
NB each row would be the data for one person.
Weight Post-diet Weight87 9059 59...
In the appropriate SOFA dialog you would select one variable as A and the other as B.
Restructuring your dataThe most common problem is when your data has the data for different groups in different variables.
E.g. height data for two genders:
Male Female186 167179 170...
The easiest way to handle this might be to change the data in a spreadsheet and import it in the restructured form.
1. Insert group by column
2. Transfer first variable (Male) by renaming it to the measure (Height) and populating the group by column (Gender) for thatvariable
3. Transfer second variable by pasting height values below and completing the Gender column with the variable (Female)

4. Delete the variable not needed (Female in this case)
NB You could have used 1 for Male and 2 for Female if you preferred and added value labels to Gender once the data was importedinto SOFA Statistics. See Setting variable details e.g. labels
The same process can be used if there are multiple groups e.g. countries instead of genders.
Numbers stored in a text variableIf you imported your data into SOFA from a spreadsheet, the solution is probably to change the appropriate column data types tonumeric and reimport the data. SOFA tries to warn you if it doesn't detect enough numeric variables for the analysis you areconducting e.g. you need at least two numeric variables to conduct a Pearson's R linear correlation analysis.
Contents [http://www.sofastatistics.com/userguide.php]
Wiki
help/data_structure.txt · Last modified: 2010/10/06 05:22 by adminExcept where otherwise noted, content on this wiki is licensed under the following license: CC Attribution-Noncommercial-Share Alike3.0 Unported [http://creativecommons.org/licenses/by-nc-sa/3.0/]

Contents [http://www.sofastatistics.com/userguide.php]
Setting variable details e.g. labelsAnywhere you can see a variable, you should be able to right click on it and access its settings. E.g. from a variable added to a reporttable configuration:
Or a variable in a drop down list in a charts dialog:
Clicking on the variable with the right mouse button will pop up a settings dialog:

This dialog allows you to set:
Variable label e.g. “Age Group”. This label will be displayed in reports instead of the variable name e.g. “agegroup”.Notes. You can store any information here about the variable.Data Type. The options are “Nominal (names only)”, “Ordinal (rank only)”, and “Quantity (is an amount)”. This information letsSOFA present appropriate lists of variables for specific tests e.g. quantity variables such as age or height for histograms but notcountry or gender.Value labels e.g. “Male” for 1 and “Female” for 2. SOFA output will display the value labels.
Contents [http://www.sofastatistics.com/userguide.php]
Wiki
help/variable_details.txt · Last modified: 2010/09/30 16:53 by adminExcept where otherwise noted, content on this wiki is licensed under the following license: CC Attribution-Noncommercial-Share Alike3.0 Unported [http://creativecommons.org/licenses/by-nc-sa/3.0/]

Contents [http://www.sofastatistics.com/userguide.php]
Connecting to DatabasesUnlike many statistics programs, in SOFA Statistics you can connect directly to data you have in any supported SQL-type database(currently MS Access, MySQL, MS SQL Server, PostgreSQL, and SQLite).
NB if you have data in a spreadsheet or stored as csv see Importing spreadsheet/csv data
To connect to an SQL-type database, SOFA Statistics needs the necessary login details e.g. password. Rather than having to enterthese repeatedly, you can store the login details as part of a project configuration. Most typically, you will only be wanting to connectto one database server e.g. MySQL. SOFA Statistics lets you store details for as many as you like e.g. if some of your data is in SQLiteand some is in MS Access then you just enter connection login details for both.
1. Click on “Select Project”2. Click on “New” to configure new project or “edit” to edit an existing project. NB the SOFA default project cannot be edited.
3. Enter the required details. Tip - hovering over text boxes will often suggest a likely value e.g. “localhost” for host.

4. Click the “Update” button to save your settingsThe selected project settings are displayed on the main SOFA form
A video is available showing how to connect directly to your SQL data: Connecting to your SQL data video[http://www.sofastatistics.com/videos.php#sql_connect]
Contents [http://www.sofastatistics.com/userguide.php]
Wiki
help/projects.txt · Last modified: 2011/01/10 20:47 by adminExcept where otherwise noted, content on this wiki is licensed under the following license: CC Attribution-Noncommercial-Share Alike3.0 Unported [http://creativecommons.org/licenses/by-nc-sa/3.0/]

Contents [http://www.sofastatistics.com/userguide.php]
Importing Spreadsheet/CSV Data
Prepare Your Data
Clean the Spreadsheet/CSV fileOne data type per column. If you want a column analysed as a number e.g. 60, 102.5, 3, etc remove text such as “n/a”,“removed” etc. SOFA can cope with mixed data types by getting you to choose an overall type as you import (unless you selecttext, data of the other types is converted to missing values). But you will have to decide what to do for each and every columnevery time you import the data. So it is probably best to clean it before attempting an import.One header row (or none) only. SOFA can't handle multiple header rows so tidy that up firstUnique field names. SOFA can handle duplicate field names (it appends 001, 002 etc to make the names unique) but it isprobably better to make the names yourself.Remove empty rows and columns at beginning. They may make the layout more appealing but SOFA expects the firstrow to be either the header row or the first data row.
Remove additional worksheets. SOFA is only set up to import a single worksheet.
Structure the Data for AnalysisSOFA expects your data to be organised in a particular way. E.g. should I have gender as a field with 1s and 2s in it and height asanother field or should I have a column of results e.g. height, for each gender? SOFA only works with the first structure. CheckStructuring Data For Analysis if not sure or if there are problems.
Importing Local DataSOFA Statistics currently supports importing data from Excel spreadsheets, ODS spreadsheets (OpenOffice Calc and Gnumeric etc), csvfiles and Google Docs spreadsheets.
NB you do not need to import data from SQL-type databases (currently MS Access, PostgreSQL, MySQL, MS SQL Server, and SQLite).See Connecting to databases
1. Click on the “Import Data” button on the main SOFA form2. To import local data, click on “Browse” and select csv, xls, or ods file

3. Provide the data with a unique name by which SOFA Statistics can identify the data.
Then click on the “Import” button to import the data into the default SOFA database “sofa_db” with the table name provided.
A video is available showing how to import CSV data: Importing CSV data video[http://www.sofastatistics.com/videos.php#importing_csv]
A video is available showing how to import Open Document Format (ODF) spreadsheets: Importing Open Document Format(ODF) spreadsheets video [http://www.sofastatistics.com/videos.php#importing_odf]
Importing Google Docs Online Spreadsheets
1. Click on the “Import Data” button on the main SOFA form2. Click on the “Google spreadsheet” button
3. Enter the correct email and password details to sign into your Google account

The existing spreadsheets are listed and then you can select a worksheet. If there is only one spreadsheet and one worksheetthere is no need to make a selection.
4. Click on the “Download” button to download the data onto your local machine.5. The data is saved in a local SOFA folder as an ods format file.6. Change the SOFA Table Name and then click on the “Import” button.
A video is available showing how to import Google Docs data: Importing Google Docs spreadsheets video[http://www.sofastatistics.com/videos.php#importing_google]
Contents [http://www.sofastatistics.com/userguide.php]
Wiki
help/importing.txt · Last modified: 2012/05/24 16:29 by adminExcept where otherwise noted, content on this wiki is licensed under the following license: CC Attribution-Noncommercial-Share Alike3.0 Unported [http://creativecommons.org/licenses/by-nc-sa/3.0/]

Contents [http://www.sofastatistics.com/userguide.php]
Online Surveys with SOFA and Google Docs Spreadsheets
OverviewSOFA makes it easy to survey people and analyse the results. Just make a simple survey form in Google Docs, send a link to thepeople you want to survey (perhaps individually, perhaps in a newsletter), and import the data into SOFA Statistics from theunderlying Google Docs Spreadsheet ready to make tables etc. You can even embed the survey in a web page.
Configure Survey
Start at Google Docs [http://docs.google.com]Select “Form”
Add questionsThe options are limited compared to may survey tools but they should be adequate for a quick and simple survey.
Click “Done”Click on the Theme button near the top and select a visual theme for the survey

View the result and click on “Apply” if you like it
Distribute SurveyThe survey page displays the link to the survey.
You can email the link

either manually, or using the “Email this form” button.Or you can embed the survey in a webpage
Results Automatically Stored in SpreadsheetSurvey results are automatically stored in the spreadsheet that Google Docs automatically makes when you configure your form.
The new spreadsheet will appear in your list of spreadsheets.
Importing into SOFA for AnalysisUse the standard approach to importing from Google Docs spreadsheets.

Extra Data PreparationGoogle Docs Spreadsheets store multi-choice responses as text rather than numbers. This is probably not a problem if the data iscategorical (order doesn't matter) but if you are analysing Likert scales e.g. “Very Unhappy”, “Unhappy”, “Neutral”, “Happy”, “VeryHappy”, you want the results reported in the correct order.
To achieve this we must recode the data so that “Very Unhappy” becomes 1, “Unhappy” becomes 2 etc.
Fortunately, SOFA has a GUI for recoding values. See Recoding data for details.
AnalysisThere will be many ways to report and analyse your data. The example below is a simple Frequency Table. Note how the labels havebeen applied to the recoded numbers.

Contents [http://www.sofastatistics.com/userguide.php]
Wiki
help/online_surveys.txt · Last modified: 2010/12/02 14:07 by adminExcept where otherwise noted, content on this wiki is licensed under the following license: CC Attribution-Noncommercial-Share Alike3.0 Unported [http://creativecommons.org/licenses/by-nc-sa/3.0/]

Contents [http://www.sofastatistics.com/userguide.php]
Making Report Tables
Making a Simple Crosstab TableOn the main SOFA form, click on “Report Tables”,
Let's start with a simple report table of Age Group vs Country. NB all of this data is fictitious and designed to allow features of theprogram to be demonstrated.
1. For “Table Type” select “Crosstabs”. A cross tabulation shows one or more variables against one or more other variables e.g.Age Group in the rows and Country in the columns.
2. We need to add a row so click on “Add” under the “Rows” label3. Select “Age Group” and either double click it or select “OK”.
Under the “Columns” label click on “Add” and add Country.
In the demonstration pane below you will see a rough illustration of what the table will look like. If you want to see the actual table,click on “Run”.

If “Add to report” is ticked, the output will also be saved to the end of the output file specified at the bottom of the form.
Extra Configuration of Report TableNext you may want to configure the rows and/or columns. Let's add a total column and columns for row and column percentages.
1. Click on “Config” under the “Columns” label2. Tick “Total” under the “Misc” heading3. Tick “Column %” and “Row %” under the “measures” heading4. Click on “OK” to see changes in demonstration table. NB to see actual results, click on “Run”.
If you click “Run” with “Add to report” ticked, you can view the result by clicking on the “View” button. This will open your default webbrowser so you can see the output.

The styling of your table can also be changed - here are some examples of different report tables:
Making a Row Stats TableInstead of frequencies and percentages, Row Summaries Tables have means, medians, standard deviations etc.

1. Select “Row Stats” as the report Table Type.2. Under the “Rows” label, click on the “Add” button.3. The “Variables” dialog will display all numeric variables. Choose one or more.4. Clic on “OK” button.
1. Under the “Rows” label click on the “Config” button.2. Select the measures you wish to report on. Mean is preselected by default.3. Click “OK”.
Optionally, you can add a column variable e.g. “Age Group”. Column variables for “Row Stats” report tables can have totals.
NB Click on the “Run” button to produce the output. Also note that all the data in the “demo_tbl” is fictitious.
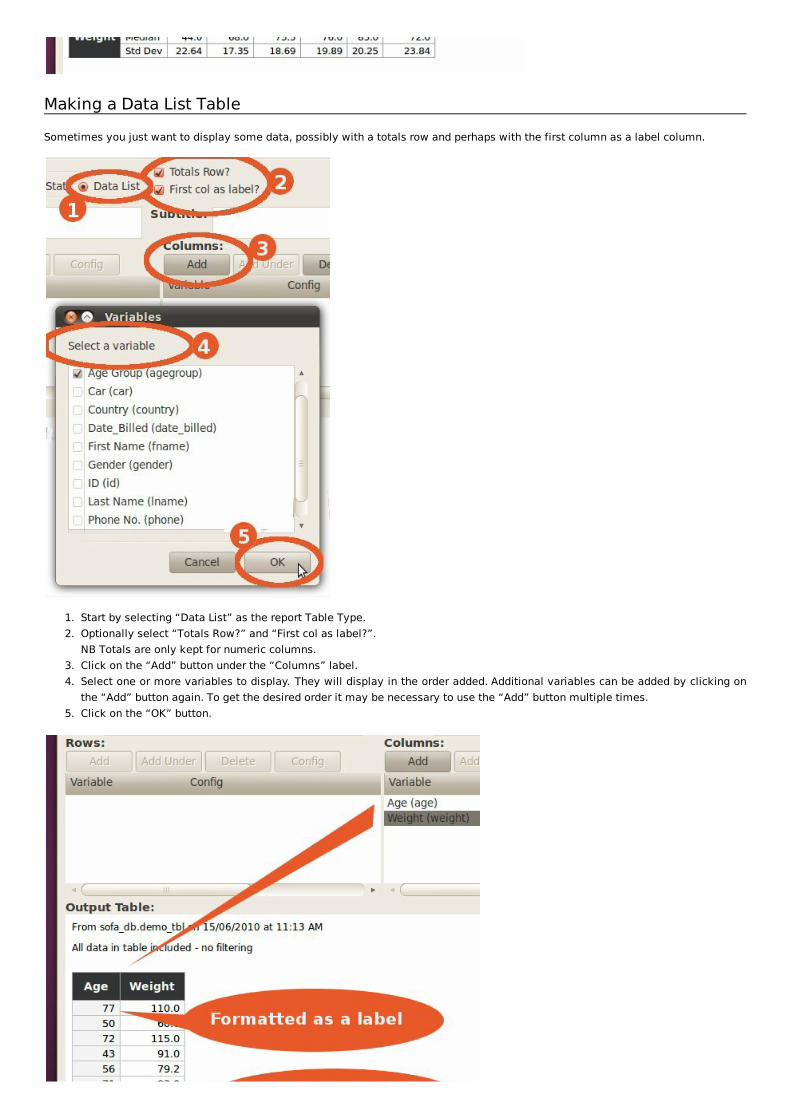
Making a Data List TableSometimes you just want to display some data, possibly with a totals row and perhaps with the first column as a label column.
1. Start by selecting “Data List” as the report Table Type.2. Optionally select “Totals Row?” and “First col as label?”.
NB Totals are only kept for numeric columns.3. Click on the “Add” button under the “Columns” label.4. Select one or more variables to display. They will display in the order added. Additional variables can be added by clicking on
the “Add” button again. To get the desired order it may be necessary to use the “Add” button multiple times.5. Click on the “OK” button.

A video is available showing how to make report tables: Making report tables video[http://www.sofastatistics.com/videos.php#report_tables]
Contents [http://www.sofastatistics.com/userguide.php]
Wiki
help/report_tables.txt · Last modified: 2011/01/11 03:38 by adminExcept where otherwise noted, content on this wiki is licensed under the following license: CC Attribution-Noncommercial-Share Alike3.0 Unported [http://creativecommons.org/licenses/by-nc-sa/3.0/]

Contents [http://www.sofastatistics.com/userguide.php]
Wiki
Statistical Tests Available in SOFA Statistics
A video is available showing how SOFA Statistics can help you select and interpret the appropriate statistical test: Statisticaltest selection video [http://www.sofastatistics.com/videos.php#stats_help]
ANOVA (Analysis of Variance)Chi Square TestCorrelation - Pearson's RCorrelation - Spearman's RKruskal-Wallis HMann-Whitney UIndependent t-testPaired t-testWilcoxon Signed Ranks
Contents [http://www.sofastatistics.com/userguide.php]
help/stats_tests.txt · Last modified: 2011/01/11 22:55 by adminExcept where otherwise noted, content on this wiki is licensed under the following license: CC Attribution-Noncommercial-Share Alike3.0 Unported [http://creativecommons.org/licenses/by-nc-sa/3.0/]

Contents [http://www.sofastatistics.com/userguide.php]
Wiki
Making Charts
OverviewSOFA Statistics support making a range of different charts:
simple bar chartsclustered bar chartspie chartsline chartsarea chartshistogramsscatter plotsbox plots
To make a chart, select the chart type, make any settings specific to that type of chart, and click on the “Show Results” button.
Area charts - wide if neededArea charts can display as wide as necessary to show the data.
Histograms and human-friendly bin ranges

Histograms and human-friendly bin rangesSOFA Statistics endeavours as much as possible to use human-friendly bins e.g. 10 - <20 rather than 9.86-19.54.
Scatter plots and number of data pointsUnless the number of data points is too high, SOFA shows each item in a scatter plot as a dynamic item you can interact with:
When it is not practical to show every point, SOFA Statistics shows the scatter plot as a single, non-interactive image:
Usually, SOFA displays dot borders to make it easier to see the data but sometimes they simply get in the way. Fortunately, it ispossible to turn them off if required.

Chart seriesSOFA lets you produce charts in series e.g. bar charts by a second variable e.g. gender

A video is available showing how to make charts: Making charts video [http://www.sofastatistics.com/videos.php#charts]
Contents [http://www.sofastatistics.com/userguide.php]
help/charts.txt · Last modified: 2012/02/23 14:12 by adminExcept where otherwise noted, content on this wiki is licensed under the following license: CC Attribution-Noncommercial-Share Alike3.0 Unported [http://creativecommons.org/licenses/by-nc-sa/3.0/]

Contents [http://www.sofastatistics.com/userguide.php]
Filtering DataSometimes you want to conduct analyses on a subset of your data e.g. on males only. In SOFA you can apply temporary filters to yourdata.
Remember: Filters will remain in place until you close SOFA or deliberately remove them.
1. Select the table you want to filter2. Click on the “Filter” button (or right click on the table) and enter details into the Apply Filter dialog.
3. Once you have applied you filter, the table name will appear with ”(filtered)” at the end until the filter is removed (or SOFA isclosed).
4. Output will show the filter which has been applied
You can also modify your filter and apply much more flexible constraints

And if your filter is faulty, helpful examples are provided which are appropriate to the type of database you are connecting to(SQLite, MySQL etc).
A video is available showing how to filter your data: Filtering data video [http://www.sofastatistics.com/videos.php#filtering]
Contents [http://www.sofastatistics.com/userguide.php]
Wiki
help/filtering_data.txt · Last modified: 2012/06/16 00:08 by adminExcept where otherwise noted, content on this wiki is licensed under the following license: CC Attribution-Noncommercial-Share Alike3.0 Unported [http://creativecommons.org/licenses/by-nc-sa/3.0/]

Contents [http://www.sofastatistics.com/userguide.php]
Recoding Data
IntroductionSometimes you need to change your data before you can analyse it. For example, you might have a field called age but you want tolook at the percentages in different age groups. You might want 0-19 in one group, 20-29 in another, 30-39 in another, 40-64 inanother, and finally 65+ in another.
How do you get from data like this:
To a report table like this:
The easiest way is to use the built-in recoding functionality of SOFA Statistics (see below). This makes it easy, for example, to mapranges of values to single values. If you are wanting to do something more complex, e.g. averaging the values from multiple fields, itis possible to do so using a spreadsheet before importing/reimporting, or SQLite Database Browser. Finally, if the dataset is small,there is the option of manual data entry.
Recoding in SOFA
1. Click on the “Enter/Edit Data” button on the main SOFA form.2. Select a table in the default SOFA database “sofa_db” other than the read-only “demo_tbl”3. Click on the “Design” button because we are going to alter the design of the table by adding an agegroup field based on the
“age” field4. Click on the “Recode” button
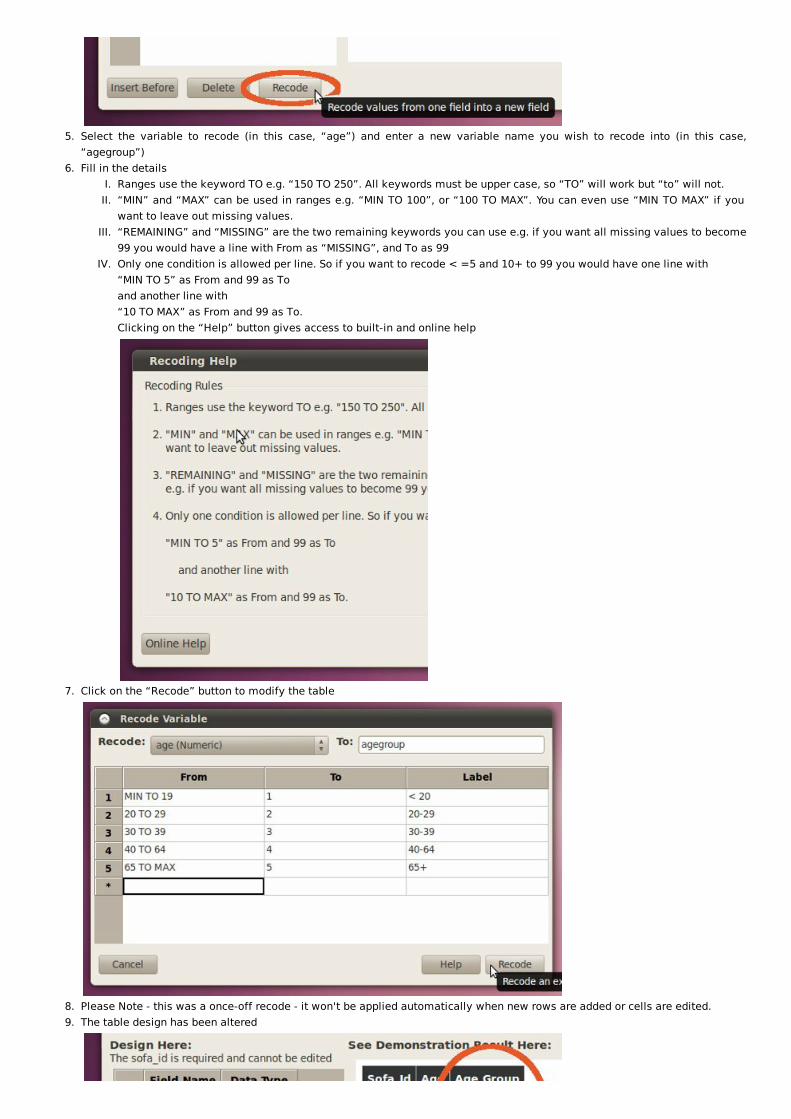
5. Select the variable to recode (in this case, “age”) and enter a new variable name you wish to recode into (in this case,“agegroup”)
6. Fill in the detailsI. Ranges use the keyword TO e.g. “150 TO 250”. All keywords must be upper case, so “TO” will work but “to” will not.II. “MIN” and “MAX” can be used in ranges e.g. “MIN TO 100”, or “100 TO MAX”. You can even use “MIN TO MAX” if you
want to leave out missing values.III. “REMAINING” and “MISSING” are the two remaining keywords you can use e.g. if you want all missing values to become
99 you would have a line with From as “MISSING”, and To as 99IV. Only one condition is allowed per line. So if you want to recode < =5 and 10+ to 99 you would have one line with
“MIN TO 5” as From and 99 as Toand another line with“10 TO MAX” as From and 99 as To.Clicking on the “Help” button gives access to built-in and online help
7. Click on the “Recode” button to modify the table
8. Please Note - this was a once-off recode - it won't be applied automatically when new rows are added or cells are edited.9. The table design has been altered

10. If you open the table, you will see that the data has been altered as well. The labels you added are now part of your project andare automatically applied to fields of that name.
11. Now your data is ready to analyse by age group
A video is available showing how to recode data: Recoding data video [http://www.sofastatistics.com/videos.php#recoding]
More Sophisticated RecodingSometimes you need to do something involving multiple variables e.g. making a new variable from the average of three othervariables. Or you may have some other, more sophisticated data manipulation requirements. The easiest way to do this is in aspreadsheet before importing (or reimporting) the data.
Using Spreadsheet FunctionsCreating a standard function makes this very easy.
Using SQLite Database BrowserAnother option is to manipulate data already inside SOFA. SOFA stores its data in an SQLite database called sofa_db. It will be storedin a folder like “C:\Documents and Settings\username\sofastats\_internal” or ”/home/username/sofastats/_internal”. You can alter thedata directly using the free and open source program SQLite Database Browser [http://sqlitebrowser.sourceforge.net/]

Adding a New Variable
The following syntax works in SQLite (common field types are INTEGER, TEXT, and NUMERIC):
ALTER TABLE mytable ADD newvar INTEGER
Populating a New Variable with Data
The following syntax shows how flexible this approach is:
UPDATE mytable SET newvar = Total/2
or
UPDATE mytable SET newvar = (var1 + var2 + var3)/3
You can also use this approach to alter values in an existing variable. You can also restrict the changes using a WHERE clause e.g.
UPDATE mytable SET existingvar = “Invalid data” WHERE var1 > 100 OR var2 > 100
Anything Else You Can Imagine
Once you have started using SQL there is very little you cannot do in data manipulation. The SQLite SQL syntax documentation is here:SQL As Understood By SQLite [http://www.sqlite.org/lang.html]
Contents [http://www.sofastatistics.com/userguide.php]
Wiki
help/recoding_data.txt · Last modified: 2011/04/07 17:04 by adminExcept where otherwise noted, content on this wiki is licensed under the following license: CC Attribution-Noncommercial-Share Alike3.0 Unported [http://creativecommons.org/licenses/by-nc-sa/3.0/]

Contents [http://www.sofastatistics.com/userguide.php]
Non-Ubuntu/Debian Linux Installation
IntroductionDeb packages are supplied for download on the main SOFA website. To cater to other flavours of Linux, a tar.gz is also provided.Inside, you will find README.txt and INSTALL.sh.
Step 1 is to use your distro package manager to install all the required support packages e.g. matplotlib (for chart plotting).Details of required packages are in the next subsection.Step 2 is to run INSTALL.sh as described in README.txt.
The process is quite simple and has been achieved in two very different distros. SOFA works on Fedora 14:
and openSUSE 11.3:
This page is the go-to place for information on how to successfully install SOFA on non-Ubuntu Linux systems. For direct discussion,please post at SOFA Statistics google discussion group [http://groups.google.com/group/sofastatistics].

please post at SOFA Statistics google discussion group [http://groups.google.com/group/sofastatistics].
And if you manage to get SOFA working on other distros please email me ([email protected]) the relevant package details etcand a screen-shot (preferably one which reveals the distro involved).
Packages Required (Dependencies)NOTE to self - keep README.txt up-to-date in /home/g/projects/SOFA/debmaker/KEEPME
UPDATE - now using python-psycopg2 instead of python-pygresql
UPDATE - now need python-xdg and python-crypto as well
In Ubuntu SOFA now requires:
python (>= 2.6.2)wx-common (>= 2.8.9.2)python-wxversion (>= 2.8.9.2)python-wxgtk2.8 (>= 2.8.9.2)python-numpy (>= 1:1.2.1)python-pysqlite2 (>= 1.0.1)python-mysqldb (>= 1.2.2)python-psycopg2 (>= 2.0)python-matplotlib (>= 0.98.5.2)python-webkit (>= 1.0.0)python-xdg (>= 0.15)python-crypto (>= 2.0.1)
In Fedora 14 I installed the following successfully for older versions of SOFA - :
Python was already therewxPython-2.8.11… and that brought with it some other packages needed.numpy-1:1.4.1…python-sqlite2-1:2.3.5…MySQL-python-1.2.3…PyGreSQL-3.8.1… (presumably needs to change to python-psycopg2 or openSUSE equivalent)python-xdg-0.15… (or a higher number e.g. 0.19 - not actually included in my tests but needed from SOFA 1.1.5 onwards)python-matplotlib-1.0.0…for more recent versions of fedora you will need to separately install python-matplotlib-wx (otherwise you get a messageabout “No module named backend_wxagg”)not sure what I did about python-webkitwasn't requiring python-crypto when I tested this so you'll need to figure this bit out.
A friend using Fedora 17 needed
python-cryptopywebkitgtkpython-matplotlib-wx
In openSUSE 11.3 I installed the following successfully AFTER I had added the community devel:languages:python and educationrepositories:
python-wxGTK 2.8.10.1…python-numpy (NB to upgrade the existing version 1.3… to the later education repo version 1.5… - see Python matplolib onopenSUSE [http://forums.opensuse.org/english/development/programming-scripting/416182-python-matplolib.html#post2229592])python-mysql 1.2.2-90.1PyGreSQL 3.8.1… (presumably needs to change to python-psycopg2 or openSUSE equivalent)python-matplotlib 1.0.0…python-xdg-0.19… (or a higher number - not actually included in my tests but needed from SOFA 1.1.5 onwards)python-sqlite2 2.6.0…python-webkit (upgraded)python-webkitgtk 1.1.8… (to avoid error about backend_wxagg module being missing)wasn't requiring python-crypto when I tested this so you'll need to figure this bit out.
I expect in other major distros there is a similar process of finding packages that seem right, trying, and adding more if necessary. Itcertainly should be possible to get SOFA working on the major distros.
Running SOFAMake a launcher with the following details:
Name: SOFA Statistics

Name: SOFA StatisticsDescription: Analysis packageCommand: python /usr/local/share/sofastats/start.pyIcon: /usr/local/share/sofastats/images/sofa_48x48.xpm
You can run sofa from the command line with a single command sofastats (assuming you ran INSTALL.sh). If you want to set it upmanually, details are in the Appendix:
Installation and Configuration for Specific UserWhen SOFA is run, it checks to see if the user has a sofastats folder and adds it if they don't e.g./home/username/Documents/sofastats. It also make a sofastats_recovery folder.
If you are able to get SOFA to launch at all, but there is a problem of some sort, look at the output.txt file in your/home/username/Documents/sofastats/_internal folder. It may be, for example, that you forgot to install matplotlib.
Appendix
Simple Launch from Command LineMake a text file called runsofastats.sh with the following
#! /bin/bashpython /usr/local/share/sofastats/start.py
And save it e.g. to your home folder. If bash is not located in /bin/bash on your system, use the command
which bash
to find it.
Then make a symlink to it located in /usr/local/bin (NB give everyone rights to run it)
su rootln -s /home/username/runsofastats.sh /usr/local/bin/sofastatschmod a+x /usr/local/bin/sofastats
Now you can run SOFA Statistics from the command line by typing in
sofastats
See Linux by example - how to create symlink? [http://linux.byexamples.com/archives/19/how-to-create-symlink/]
File LocationsHere is where things should go during installation (in Ubuntu it is /usr/share/pyshared/sofastats):
/usr/local/share/sofastats/usr/local/share/sofastats/boomslang/usr/local/share/sofastats/css/usr/local/share/sofastats/dbe_plugins/usr/local/share/sofastats/googleapi/usr/local/share/sofastats/googleapi/atom/usr/local/share/sofastats/googleapi/gdata/usr/local/share/sofastats/googleapi/gdata/docs/usr/local/share/sofastats/googleapi/gdata/oauth/usr/local/share/sofastats/googleapi/gdata/spreadsheet/usr/local/share/sofastats/googleapi/gdata/tlslite/usr/local/share/sofastats/googleapi/gdata/tlslite/integration/usr/local/share/sofastats/googleapi/gdata/tlslite/utils/usr/local/share/sofastats/images/usr/local/share/sofastats/_internal/usr/local/share/sofastats/locale/usr/local/share/sofastats/locale/gl_ES/usr/local/share/sofastats/locale/gl_ES/LC_MESSAGES/usr/local/share/sofastats/projs/usr/local/share/sofastats/reports/usr/local/share/sofastats/reports/sofa_report_extras/usr/local/share/sofastats/scripts/usr/local/share/sofastats/vdts//usr/local/share/sofastats/xlrd/
In the following example, I downloaded the sofa source code into the Downloads folder in Fedora 14.
Then extract contents of sofastats_1.1.5.tar.gz into the Downloads folder.
The next lot of commands were performed as root (NB the /* after sofa.main)

su root
cd Downloads/sofa/sofastats_1.1.5cp -r sofastats /usr/local/sharecp -r sofa.main/* /usr/local/share/sofastatscp runsofastats.sh /usr/local/share/sofastats
NB nothing will work without the dependencies installed. Running:
python /usr/local/share/sofastats/start.py
will return a traceback because wxversion or whatever isn't available. So the next step is installing the dependencies.
After installing wxPython, but before adding the other dependencies, running sofa prematurely will result in a message about aproblem with the first round of local importing.
Contents [http://www.sofastatistics.com/userguide.php]
Wiki
help/linux_installation.txt · Last modified: 2012/06/19 16:26 by adminExcept where otherwise noted, content on this wiki is licensed under the following license: CC Attribution-Noncommercial-Share Alike3.0 Unported [http://creativecommons.org/licenses/by-nc-sa/3.0/]

Contents [http://www.sofastatistics.com/userguide.php]
Exporting DataFuture versions of SOFA Statistics should support exporting data directly. In the meanwhile, the following approach works well:
1. Download and install the excellent free and open source SQLite Database Browser application(http://sqlitebrowser.sourceforge.net/ [http://sqlitebrowser.sourceforge.net/])
2. Use SQLite Database Browser to open the internal SOFA database (e.g. /home/username/sofastats/_internal/sofa_db orC:\Documents and settings\username\sofastats\_internal\sofa_db)
3. Open the export dialog
4. Select the appropriate table and export it
Contents [http://www.sofastatistics.com/userguide.php]
Wiki
help/exporting_data.txt · Last modified: 2011/03/08 13:37 by admin

help/exporting_data.txt · Last modified: 2011/03/08 13:37 by adminExcept where otherwise noted, content on this wiki is licensed under the following license: CC Attribution-Noncommercial-Share Alike3.0 Unported [http://creativecommons.org/licenses/by-nc-sa/3.0/]