user guide - swissquote: trade markets online with a …. new etrading platform the new platform is...
TRANSCRIPT

The eTrading platform
User Guide

1. New eTrading Platform ............................................................................ 3
2. Objective................................................................................................... 4
2.1 Important note on execution-only trading ...................................................................... 4
3. Introduction to widgets ............................................................................ 5
3.1 “Account Summary” widget ............................................................................................ 6
3.2 “Cash and Securities” widget ......................................................................................... 7
3.3 “Positions” widget ........................................................................................................... 7
3.3.1 “Chart” tool (analysis tool) ............................................................................................................ 9
3.3.2 “FullQuote” tool ........................................................................................................................... 13
3.3.3 “News” tool .................................................................................................................................. 14
3.3.4 “Orderbook” tool ......................................................................................................................... 15
3.3.5 “Paid prices” tool ......................................................................................................................... 16
3.3.6 “Trend Radar” tool ...................................................................................................................... 17
3.4 “Orders” widget ............................................................................................................. 18
3.5 “Personal List” widget ................................................................................................... 19
3.5.1 Useful help tools in your personal list (as for the “My Optionchain” widget) .......................... 20
3.6 “Search” widget ............................................................................................................. 22
3.6.1 Advanced search ........................................................................................................................ 22
3.6.2 Advanced search: shares .......................................................................................................... 23
3.6.3 Advanced search: indices .......................................................................................................... 25
3.6.4 Advanced search: warrants ....................................................................................................... 25
3.6.5 Advanced search: funds ............................................................................................................ 26
3.6.6 Advanced search: ETFs ............................................................................................................. 27
3.6.7 Advanced search: bonds ........................................................................................................... 28
3.7 “News” widget ................................................................................................................ 29
3.8 “Market Overview” widget ............................................................................................. 30
3.9 “Trend Radar” widget .................................................................................................... 33
3.10 “Optionchain” widget .................................................................................................... 34
4. The order entry mask ............................................................................. 36
4.1.1 Automatic foreign currency balancing ....................................................................................... 38
4.1.2 Important notes concerning the order entry mask ................................................................... 39
4.1.3 Order types ................................................................................................................................. 39
4.1.4 Explanations regarding buy orders ........................................................................................... 40
4.1.5 Explanations regarding sell orders ............................................................................................ 40
4.1.6 More complex order types ......................................................................................................... 41
5. Currency exchange transactions mask ................................................. 42
5.1 Currency exchange transactions mask ........................................................................ 42
6. Securities transactions .......................................................................... 44
7. Documents in your account ................................................................... 45
8. Order History .......................................................................................... 46
9. Preferences ............................................................................................ 47
9.1 “Trade Mask” and “My Profile” ..................................................................................... 47

1. New eTrading Platform
The new platform is secure and customisable. The wide array of analysis and selection tools and the extensive range of information on offer enable you to carry out independent and personalised searches for appropriate investment products. This platform also offers, in real time, a very rich source of constantly updated information, which enables you to participate in the financial markets at any time.
Wherever you are and whenever you want. This financial platform combines financial analyses and information – on your laptop, your tablet and your mobile.
You can build your individually tailored portfolio at any time by rearranging, removing and adding widgets. In the screenshot below you can see how to create your own individual portfolio (in contrast to the screenshot above).

2. Objective
The purpose of this manual is to provide comprehensive information on the eTrading financial platform. Nevertheless, we recommend that you review the points explained below one by one whilst carrying out a simulation in an eTrading account.
2.1 Important note on execution-only trading
Swissquote Bank Ltd offers eTrading customers autonomous securities trading (execution-only transactions). Therefore neither asset management nor wealth and investment advice are available via Swissquote Bank Ltd. Instead, customers make their own investment decisions and carry out their transactions autonomously. All transactions are executed at customers’ own risk.

3. Introduction to widgets
The eTrading platform is essentially based on various widgets that can be freely selected and partly configured. The following widgets are already open by default: Account Summary, Search, Personal List, News, Orders, Cash and Securities, Positions, Option Chain and Market Overview.
Click on the “widgets” symbol, which is in the bar at the bottom of the webpage.
Here is an enlarged version:
Add a widget to your workspace by opening the “Widgets” bar. Select and drag widgets from the list to a new location in your workspace. You can drag as many widgets as you want to your work area.
The following widgets are available for you to choose from. Each one is described in the manual:
Account Summary
Cash and Securities
Positions
Orders
Personal List
Search
News
Market Overview
Trend Radar
Option Chain

3.1 “Account Summary” widget
This widget enables you to obtain an overview of your assets at a glance.
IBAN/Account number: this is your account number at Swissquote Bank Ltd. The figures in bold are
important during customer telephone contact. In documents intended for eTrading customers this number also appears as the contract number.
Account Value: this amount is calculated at the level of the cash and securities in the eTrading
accounts.
Buying Power: this amount shows your current room for manoeuvre. It is calculated on the basis of the
sum of all the assets available in eTrading, minus open purchase orders, ForexBook margins, etc. Click on the arrow to see the details.
Potential increase of your buying power: this is the maximum amount of the potential increase of
your liquid assets via a Lombard loan. Click on the arrow to increase the Lombard loan, subject to having already signed the two Lombard loan application forms and having returned them to Swissquote Bank Ltd.
Performance: this is a calculation of the profit (including commission, sales of securities, currency
conversions, incoming and outgoing payments) since the account was opened or since some other selected date (time-weighted method). You can define the start date of the calculation yourself by selecting “Preferences-> My Profile” (see the screenshot below). The default setting is the account opening date.
Consolidated in: you have the option of displaying your assets in various currencies.
The detailed setting options in the “Preferences” menu are explained in this menu.

3.2 “Cash and Securities” widget
This widget gives you an overview of the current value of your cash and securities.
The cash balance and the value of the securities are shown in the currency of the security. The total values are converted into CHF or into the reference currency that you have defined. This currency can be changed in the “Total” box in the bottom left-hand corner (likewise for the “Account Summary” widget. The currencies that can be selected here are as follows: CHF, EUR, USD, GBP, DKK, NOK, SEK, JPY and CAD.
In this widget you can carry out a currency exchange transaction easily and conveniently by clicking on “Convert” (details on the “Convert” button can be found in the chapter “Currency exchange transactions mask”).
3.3 “Positions” widget
Use the “Positions” widget to display and manage your securities. You can view your profits, your losses and the total value of your securities in real time. Then all you have to do is make your investment decisions in just a few clicks.
Here is a summary of the most important columns:
Symbol (the short name of a security)
Last price paid on the stock exchange
The quantity columns shows the number of securities that you possess
The average ask price is the average value of the purchase price for your securities
Total value
P&P – the value of your profits or losses
The bid price shows the best (highest) price currently being offered (by the buyer), i.e. the
price at which the securities can currently be sold.
You can of course also trade a security directly via the “Trade” button (for information on this see the chapter “Order entry mask”).

Some of the column headings in the widget are a little unusual; they are explained in greater detail
below. The default columns in this widget, which appear after the symbol, are as follows:
Qty (Quantity) Number of securities in your custody account
Unit Cost The cost of each unit of the security
Total Value Last price traded on the exchange multiplied by the
number of securities
P&L% Profits and/or losses calculated as a percentage
Bid Size Volume of securities at the bid price
Bid Price at which you can sell
Ask Price at which you can buy
Ask Size Volume of securities at the ask price
Last Last price paid on the stock exchange
Chg (Change) as a % Change expressed in terms of a percentage
Ccy (Currency) The currency of the security
When you click on a security symbol in the list (e.g. ABBN) or on the small triangle (see the arrow), a box containing various additional information and functions opens in this row.
These various tools are as follows:
Chart (analysis tool)
FullQuote
News
Orderbook
Paid Prices
Trend Radar
You can also access “Tools” via the “Orders” and the “Personal List” widgets. Note: not all tools are available in the same way in all markets or for all products.
The tools are presented below in the same order in which they have been listed above.

3.3.1 “Chart” tool (analysis tool)
In the simple format you can view the real-time changes, in the form of a chart, over the last two trading days, showing the volume.
It is preferable, however, to work with this tool by clicking on the ‘enlarge’ symbol (see the green arrows).
Once you have enlarged this tool you have a professional decision-making tool at your disposal: the “analysis tool”.

The icon bar (symbols) is divided into several areas:
This button enables you to compare several charts
Administration and management
Window display options
Type of chart
Scale button (to change the scale)
Intervals and periods
These various icons are explained below:
Administration and management
You can use this icon to save a particular chart view or to define a workspace. Saved settings are always stored centrally on the server, so you can find them again at any time in your profile.
You can use the workspaces to relocate and redisplay saved views.
Click on this symbol to obtain an overview of the technical indicators. You can then select from among the available indicators.
A single click on this symbol displays several drawing tools on the left-hand side of the tool.
Use this symbol to enable or disable the caption bar located at the very bottom of the analysis tool.
By clicking on this symbol you can change certain default values or certain settings. This will allow you, for example, to define your personal settings for the indicators (see the screenshot below).

You can open up to six chart display windows at the same time. So, for example, you can enable your six preferred securities and also define them as a workspace.
By clicking on this button you can transfer all the settings from one chart to other open charts.
This enables you to specify the type of chart (the descriptions of the three main types include illustrated examples).
Line graph: In this representation the closing prices for each interval are combined into one.
HLOC chart (bar chart): HLOC here stands for High – Low – Open – Close. Each interval is represented by an HLOC figure.
Japanese candles: The Japanese candle variant of the bar chart provides the same information as the traditional HLOC chart, but presents it differently. In this analysis tool a solid red bar means that the closing price is lower than the opening price and a green bar means that the closing price is higher than the opening price.
Higher – Lower: By combining the highest prices and the lowest prices the user obtains a clear representation of the range of fluctuation.
Dot chart: Instead of combining the prices at specified intervals, this diagram shows just the prices in the form of discrete dots.

Scale button (to change the scale)
Changing the scale allows you to choose between an arithmetic variant and a logarithmic variant. Here is a brief example to explain the difference between these two options:
On an arithmetic scale, the vertical scale of the prices shows even spacing between the same price units.
On a logarithmic scale, on the other hand, the spacing is reduced. In fact increases are lower when considered in terms of percentages. So, for example, expressed as a percentage an increase from 1 to 2 is 100%; likewise for an increase from 5 to 10. Consequently the distance between 1 to 2 and between 5 to 10 is the same, as you can see in the chart on the right. Therefore logarithmic plotting involves considering increases in terms of percentages and arranging the spacing between the values as a result.
Arithmetic plotting Logarithmic plotting
Intervals and periods
Historic and intraday time series can be adapted in the analysis tool according to the period over which the analyses are to be carried out.
In the “Historical” dropdown menu it is possible to set both the period and the interval (frequency). By default prices are shown on a daily basis, but they can also be shown on a weekly, monthly, quarterly, semi-annual and annual basis. Once the frequency has been defined the user can then set the date from which the historical time series is to begin.
The procedure is the same for the settings in the “Intraday” field (1-5 days). Here too you can set both the period and the frequency, and in addition you also have the option to define both criteria manually.
A quicker way to specify the periods is to press and hold down the left mouse button in the chart at the beginning of the period from which you would like to start, and then to release it after having dragged the cursor to the end of this period.

3.3.2 “FullQuote” tool
This tool enables you to view the main financial information for the security you have selected at a single glance.
To aid comprehension, the meaning of the captions shown in the tool is provided below:
Closing price – the price at the close of trading on the previous day
Opening price – the price at the start of trading
Highest/lowest price
Daily volume traded
Exchange
Rate of the last dividend paid
Date of the last dividend payment
Annual profit, including dividends
A share’s price/earnings ratio

3.3.3 “News” tool
International news is an important instrument for a trader. This tool provides you with the key information about a specific security in the following languages: German, French, Italian and English, either together or separately, depending on your preferences.
You simply have to click in the field of a news item to open a detailed window (see the green arrow).
The “News” tool shows information relating to or connected with the selected security, unlike the “News” widget (see later on in this chapter), which displays general information.

3.3.4 “Orderbook” tool
This tool enables you to view the five most recent bid and ask limits, respectively, as well as the (dynamic) volumes
You can also enlarge this tool by clicking on the ‘enlarge’ icon (see the green arrow) for a better overview.

3.3.5 “Paid prices” tool
In this tool you can see the last 10-11 prices paid.
If you also enlarge this tool (see the green arrow) you are able to view all the prices paid, as well as the volumes, for the current trading day.
In the chart you can see red, green and grey bars. Red means that the security was traded at the bid price, green means that it was traded at the ask price and grey means that it was traded at the average price between the two. The same applies to the sell/buy indications on the far right of the chart (but this function is still in the beta phase).

3.3.6 “Trend Radar” tool
Since Trend Radar is also a separate widget it is presented in full in the section on the “Trend Radar” widget. Nevertheless we are defining it here as a securities tool that has been specially selected from the “Personal List”, unlike the widget, in which “Trend Radar” itself selects the top ten securities over the past few months.
Here too you can obtain more information by clicking on the ‘enlarge’ icon (see the green arrow).

3.4 “Orders” widget
Display and manage your open orders using the “Orders” widget. Open orders can be changed or deleted by clicking on the appropriate button, as we explain in greater detail in the chapter “Order entry mask”.
The screenshot above shows an overview of the orders that are still open in an account.
The symbol enables you to delete an open order.
The symbol enables you to change an open order.
The order entry mask is explained later on in the chapter of the same name.
Just like in the “Positions” widget you can add different columns via the symbol. The following columns are displayed by default:
Buy/Sell Buy/Sell order
Quantity Number of units
Type Type of order (market order, limit order, etc.)
Price At what price
Currency In which currency
Maturity Period of validity of the order
Order Date Date on which the order was placed
Status Current status
Bid Price Current stock market price
Ask Price Current stock market price
Last Last price paid on the stock exchange
In the “Orders” widget it is also possible, by clicking on the security symbol, to open various tools that have already been described in detail in the “Positions” section and in connection with the various “Tools”.

3.5 “Personal List” widget
The “Personal List” widget allows you to organise your financial instruments clearly. You can, for example, input your preferred securities or the companies that you want to check regularly in this personal list. The data will be updated automatically.
By clicking on a symbol (e.g. UHR) you can display additional information about the selected security. You can manage rows and columns, add new instruments and place orders.
Here is a summary of the most important columns:
Symbol the short name of a security.
Bid Size the quantity being sought for the purchase at the bid price.
Bid the best (highest) price currently being offered (by the
buyer), i.e. at which the securities can currently be sold.
Ask the best (lowest) price actually being asked (by the seller),
i.e. at which the securities can currently be bought.
Ask Size the volume being offered for sale at the ask price.
Where you already have a security in your custody account, which appears in “Positions”, the system also shows you, in the “Total Value” column, relevant data such as: the quantity, the P&L, the total value (depending on the configuration of the columns).

3.5.1 Useful help tools in your personal list (as for the “My Optionchain” widget)
Managing columns
Configure your personal list by selecting the data you need. Add or delete a column using the column selection option.
Editing mode
Click on the crayon symbol on the widget’s toolbar to access editing mode. Rearrange rows, for example by clicking on the relevant symbol and dragging a row to the right position. Delete rows by clicking on the delete symbol. In this mode you can also change the heading “Personal List” and replace it by the heading of your choice, for example “Swiss Securities”.
Placing an order
To place an order, simply click on the “Trade” button. Fill out eTrading’s mask, then prepare and place your order. The trading mask is explained later on in greater detail in the chapter “Order entry mask”.
Add a product
Add a new instrument in the last row of the “Personal List” widget. You just have to click on the “Add Symbol” button and state the name or the symbol of the instrument that you want to add.
Sometimes, for some securities that are traded abroad, liability disclaimers are displayed and have to be completed to confirm that you are not a professional trader (e.g. Nasdaq, Amex, etc.).
When you click on a security symbol in the list (e.g. ABBN), a box containing various tools opens in this row. These tools were presented earlier on in connection with the “Tools” in the “Positions” widget.

You can also rename the “Personal List” widget in editing mode.
To do this, go to the widgets menu on the bar at the very bottom and click on the “Personal List” widget.
Here is an enlarged view:
Then drag other “Personal List” widgets into the eTrading overview.
Using the ‘edit’ button , you can now edit or rename the “Personal List” widgets.
For example the widgets “Personal List Swissquote” or “Personal List 1”.
The option to rename the “Personal List” widget in a personalised way is a feature of this widget and also of the “My Optionchain” widget (see this section).
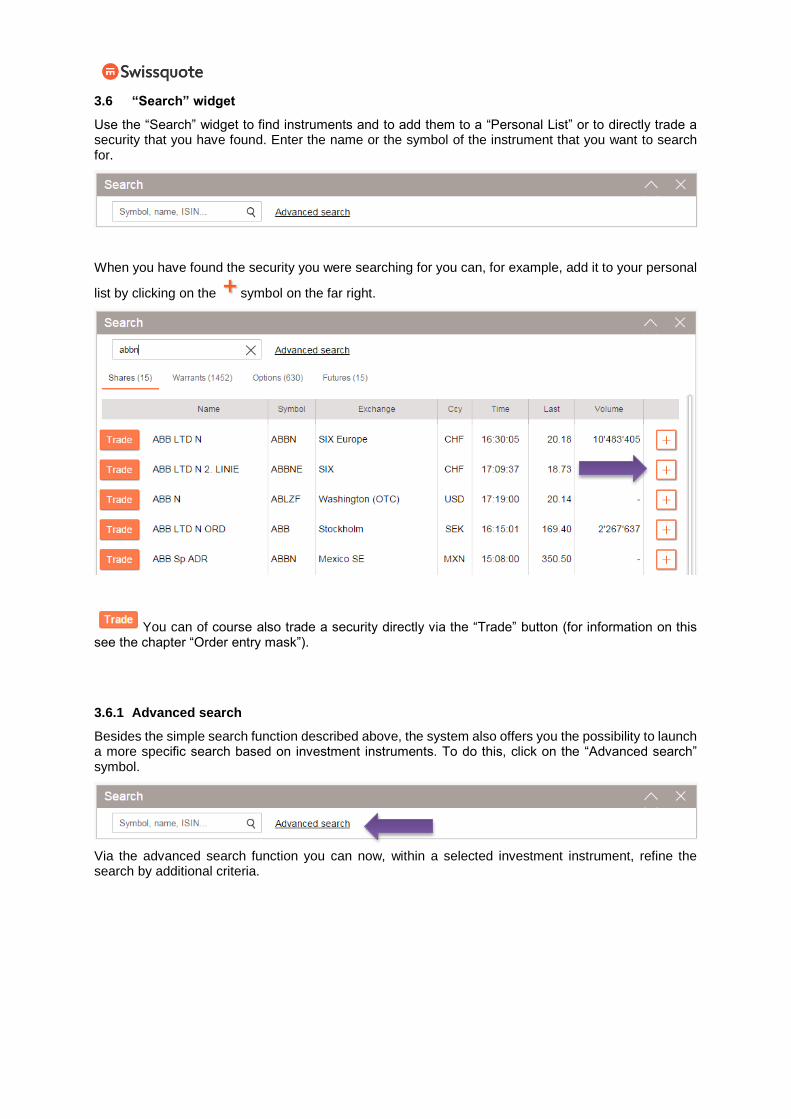
3.6 “Search” widget
Use the “Search” widget to find instruments and to add them to a “Personal List” or to directly trade a security that you have found. Enter the name or the symbol of the instrument that you want to search for.
When you have found the security you were searching for you can, for example, add it to your personal
list by clicking on the symbol on the far right.
You can of course also trade a security directly via the “Trade” button (for information on this see the chapter “Order entry mask”).
3.6.1 Advanced search
Besides the simple search function described above, the system also offers you the possibility to launch a more specific search based on investment instruments. To do this, click on the “Advanced search” symbol.
Via the advanced search function you can now, within a selected investment instrument, refine the search by additional criteria.

3.6.2 Advanced search: shares
In “Shares” you have the possibility to display various shares, depending on the selection criteria you have chosen – according to the market, the currency, the overall rating and/or the sector.
In this field, select the market you want.
Select the currency you want from this dropdown menu.
In this field, select the “Trend Radar” system (in relation to this see also the pages concerning the “Trend Radar” tool and widget).
Here you can select various sectors and branches of activity, e.g. the financial sector, transport, etc.
You can of course also trade a security directly via the “Trade” button (for information on this see the chapter “Order entry mask”).

3.6.2.1 “More filters/additional filter options”
In this category you have the possibility to configure additional settings (in this example, for shares).
On the one hand, for instance, you can modify the categories of the Trend Radar system according to your weighting (fundamental data, technical data, performance calculations, risk and analysts’ recommendation).
On the other hand, you can also search for shares according to “conventional” criteria, such as market capitalisation, the last price paid, the volume traded, the dividend yield and the price/earnings ratio.

3.6.3 Advanced search: indices
This search function allows you to search global indices by their name and their symbol as well as by market (country) and currency.
3.6.4 Advanced search: warrants
For structured products it is possible to search by the underlying as well as by other sub-categories.
The sub-categories are as follows: exchange, currency, product type, maturity and type (strategy: call/put).
The “More filters” function also enables you to carry out a search by issuer and by a warrant’s risk classification.
Note regarding the risk classification:
The SSPA’s risk indicator allows you to evaluate the commercial risk of a structured product by using the “value at risk” (VaR) reference In order to facilitate classification, structured products are divided into six risk categories, with category 6 representing the highest risk of investing in a product and category 2 representing the lowest risk. The risk indicator is calculated daily and made available to investors. The intervals between the six risk categories are reviewed weekly and amended if necessary. More information about the SSPA’s risk indicator and the adjustment of the intervals can be found via the link below:
More information on the SSPA’s website: http://www.svsp-verband.ch

3.6.5 Advanced search: funds
Searches for funds can also be configured in various ways. Besides searching by name and symbol, you can also select other search criteria, such as the currency, the asset class, the Morningstar rating and the issuer.
In addition, via the “More filters” function, you can carry out in-depth searches for funds on the basis of the net asset value (NAV), the performance (YTD), and the performance over 1-3 years.
Furthermore, you can adjust the volatility over three years (the last three years) in several intermediary steps depending on the objective of your search.

3.6.6 Advanced search: ETFs
For ETFs (exchange traded funds) it is possible to search by symbol and by name.
Moreover you can define other parameters, such as the market (exchange) and the currency, and you can also find an ETF via the “More filters” function, based on the last price or the volume.
Note: in the screenshot above you can see additional buttons, the meaning of which is self-evident: “Geographical area”, “Asset class”, “Underlying name”, “Provider” and “Long / Short”. Since these buttons are not yet active at the time of the drafting of this manual, they may undergo further modifications (which is why they have been greyed out).

3.6.7 Advanced search: bonds
In this search function you can search for bonds by symbol and by name, or again on the basis of the currency and the sector (for example the financial sector, transport, etc.).
The “More filters” function also offers you the option to search for a bond on the basis of the number of years to maturity (YTM), the coupon and/or the maturity.

3.7 “News” widget
Economic and financial information are important instruments for a trader. This tool provides you with key information on finance, the economy and politics in the following languages: German, French, Italian and English, either together or separately, depending on your preferences.
If you click on a news item it will be displayed in an enlarged window containing additional information.
This widget is designed in a very similar way to the “News” tool, which is described in detail earlier on in the presentation of the tools. The “News” widget, however, displays more information in overall view, unlike the “News” tool, which only displays information about the selected security.

3.8 “Market Overview” widget
This allows you to access international marketplaces via a world map and to obtain an overview of the current market situation at the same time. Just choose the market you are interested in.
Once you have selected your market (in this example, Switzerland) you have access to a diversified overview in which, in this case, the SMI chart is displayed covering a two-day period.

In this field you can select other indices in order to view their charts and other information.
In the menu bar various kinds of additional information are available to you:
The “Winners” button gives you access to a list of securities that have had the best daily performance in the selected market.
You can view the reverse situation by clicking on the “Losers” button.
Use this button to find out which securities have recorded the best
daily turnover.
Use this button to find out which securities have reached the best
daily volumes.
On the right-hand side of the menu bar you can also display the various securities that make up each index.

For example, the securities in the SMI (the list is not exhaustive due to space considerations).
You can of course also trade a security directly via the “Trade” button (for information on this see the chapter “Order entry mask”).

3.9 “Trend Radar” widget
Discover the ten securities with the best development last month in terms of fundamental analysis, performance and technical trends as well as in light of analysts’ recommendations. For each security the applicable data relates to the past 12 months. Simply click on the stars to display the analyses clearly in a new window.
For a single security, when you click on the stars in the “Rating” column (see the arrow in the screenshot above) a new information window opens up, which also includes – in the right-hand column – indicators for the underlying analyses.
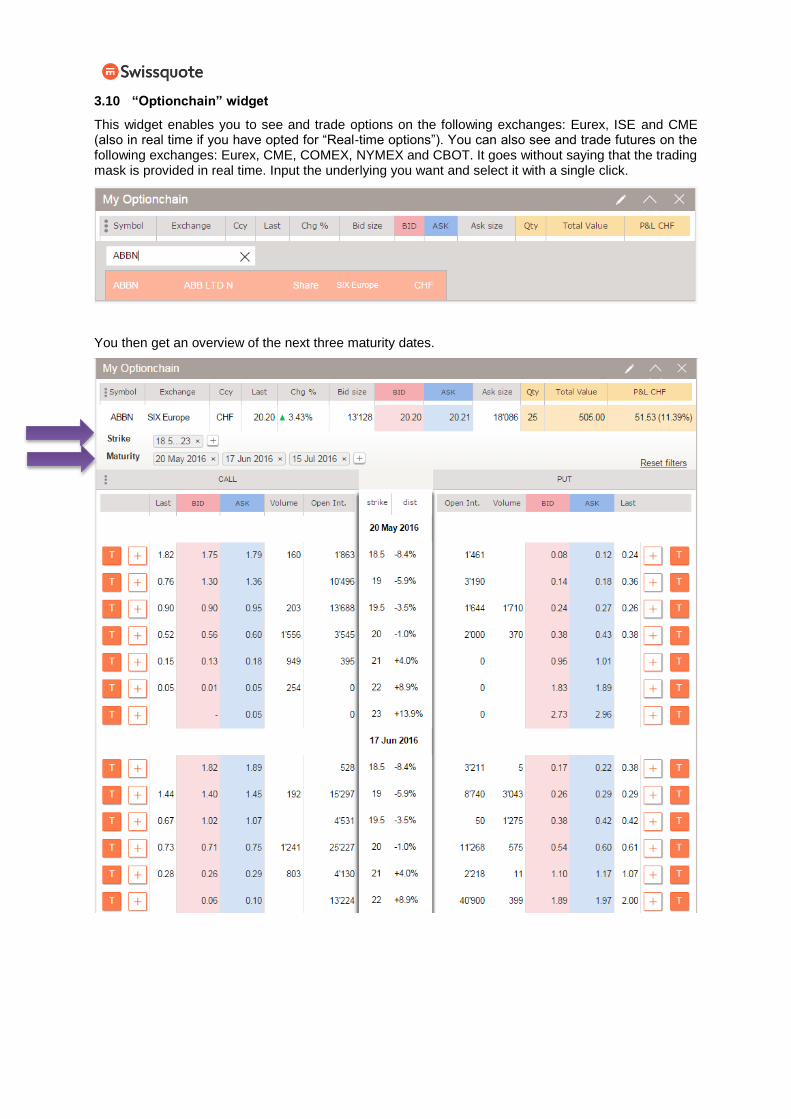
3.10 “Optionchain” widget
This widget enables you to see and trade options on the following exchanges: Eurex, ISE and CME (also in real time if you have opted for “Real-time options”). You can also see and trade futures on the following exchanges: Eurex, CME, COMEX, NYMEX and CBOT. It goes without saying that the trading mask is provided in real time. Input the underlying you want and select it with a single click.
You then get an overview of the next three maturity dates.

The maturity dates can be removed individually and/or other maturity dates can be selected.
Moreover the strike prices can be changed, as can the maturity dates.
If you have any questions about configuring the columns, searching by symbols, etc., please consult the “Personal List” widget.

4. The order entry mask
Trading orders, i.e. the purchase or sale of securities, may be carried out via various widgets (such as the “Positions”, “Personal List”, “Search”, “Market Overview” and “Trend Radar” widgets). In the example shown here, they are being carried out via the “Positions” widget.
But you can also place an order directly via the “Search” widget.
Or via the “Trend Radar” widget.

If you click on “Trade”, the security is read in the mask with the selected exchange. (Please observe at the screenshots below):
Then check the symbol or the name, as appropriate.
Check the ISIN number and the exchange (top centre).
Please select the execution account that you want (under “Account”).
Then select “Buy” or “Sell” (on Transaction 1.).
Specify how many shares, warrants, etc., you want to buy (in 2. Quantity).
Then specify your order type and the currency (in 3. Order type).
Finally, specify for how long your order should be valid (in 4. Validity).
Once you have entered all the appropriate data you can click on “Prepare the order” (see the green arrow).
In this example (see the screenshot above) you have no liquidity, or have insufficient liquidity, in USD,
which is why the system is showing you that you are falling into the red in this currency. If you want to go ahead all the same click on “Place order”, unless you should have defined the currency of the “Account” beforehand in CHF.

However, you can still do this by clicking on the “Modify” button.
Transaction executed
If the transaction has been executed you will be informed via a pop-up window and furthermore you will be able to define settings (in your “Preferences”).
4.1.1 Automatic foreign currency balancing
This system is still enabled. For example, if a negative balance arises following a securities transaction in a foreign currency account (see the example above), the account in question is balanced at 22.15 on the same day with the currency that has the strongest countervalue. This service is available in the following currencies: CHF / EUR / USD / GBP / CAD. Consequently, as a general rule, you will incur a negative interest rate. There can only be exceptions to this if booking a purchase/sale takes more than two value dates (this exceptional case is mentioned purely as a matter of form).

4.1.2 Important notes concerning the order entry mask
If you want to sell securities that have been frozen in your custody account in connection with a management transaction (securities transaction), this is indicated in the order entry mask (see the orange arrow below right) and these securities cannot then be sold.
In addition, in the order entry mask the message “At market” is displayed for bid and ask prices shortly before the close of trading, since the closing prices are still being calculated (see the orange arrow top left).
4.1.3 Order types
Various types of orders are available to you, depending on the exchange. Since it is the exchanges that determine them, and since this is subject to changes, it is not possible to compile an exhaustive list here. The possible order types appear in the trading mask each time.

4.1.4 Explanations regarding buy orders
4.1.4.1 Limit order
Definition: the limit in question is the maximum amount per share that you are prepared to pay. Consequently you never pay more than the price that you have defined as the limit. It may happen that you obtain an execution at a lower price. If the limit is not reached within the respective validity period, your order matures on the maturity date that you have specified.
Aim/objective: This is the most commonly used order type. You know what you will be paying and will not have any unpleasant surprises.
4.1.4.2 Market order (on the best market)
Definition: You buy at the best (most favourable) price being asked on the market. Given that the stock market is dynamic and may also sometimes be very volatile, the execution price cannot be specified in advance with absolute certainty. Trading of other deals always takes priority over limit orders (stock ahead).
Aim/objective: You are committed to buying the share without entertaining any notion of a fixed price – in other words you accept current market conditions.
Note: If you place a market order before the start of trading, you will still pay the opening price. It is essential to check the order book beforehand.
4.1.4.3 Stop order
Definition: A stop order is an order that is subject to the condition that it will be executed immediately once the security reaches or exceeds a certain price. When the order is a buy order it is
called a “buy on stop order”.
Aim/objective: Professional traders sometimes wait until, for example, the price has overcome resistance and then want to benefit from this newly created upside potential.
4.1.5 Explanations regarding sell orders
4.1.5.1 Limit order
Definition: The limit in question is the minimum amount per share that you are prepared to accept. Consequently you never receive less than the price that you have defined as the limit (threshold). Otherwise, it is used in exactly the same way as a buy limit.
Aim/objective: The same as for a buy limit.
4.1.5.2 Market order (on the best market)
Definition: You sell at the best (highest) price being offered on the market. Otherwise, it is used in exactly the same way as a market buy order.
Aim/objective: The same as for a market buy order.

4.1.5.3 Stop order
Definition: A stop order is an order that is subject to the condition that it will be placed in the order book only if a certain price (the trigger) is reached or exceeded. When the order is a sell order it is called a “sell on stop order”.
Aim/objective: Professional traders limit their losses. Once the price falls and the last price paid reaches or exceeds the trigger, then the order is activated – in other words, it become a market order. This makes it possible to avert an even bigger price loss in all cases.
4.1.5.4 Stop limit order
Definition: The same as for a stop loss order, but in addition it is possible to set a minimum price (limit).
Aim/objective: The same as for a stop loss order, the only difference being that it is possible to specify an additional limit. This means that when the trigger point is reached or exceeded, the order becomes a limit order.
4.1.6 More complex order types
4.1.6.1 Trailing stop
A trailing stop order is a stop order, but with a variable trigger point.
With this type of order it is possible, when selling, to track the upward trend in the price until the trend reverses. The objective here is to track market trends whilst securing the profits obtained.
When buying, the objective is to optimise the entry level; the downward trend of a security is tracked until the market value picks up again.
4.1.6.2 Trailing stop limit
The difference between this type of order and a trailing stop is the same as that between a stop limit order and a stop order: once the trigger is activated, a limit order is automatically placed in the order book.
4.1.6.3 OCO
An OCO (one cancels others) order comprises two elements: a limit order and a stop order. The execution of one of these orders automatically cancels the other.
When selling, this type of order makes it possible to set a fixed price for the profit (the limit order element) and to protect oneself at the same time from a potential price decline (the stop order element).
When buying, this type of order makes it possible to buy during the downturn (the limit order element) or when a defined threshold is exceeded (the stop order element).

5. Currency exchange transactions mask
In the “Cash and Securities” widget you can also carry out a foreign currency conversion.
In this case, you want to convert CHF 1,000 into euros, so you click on the “Exchange” button for cash in Swiss francs. Then a pop-up window opens.
5.1 Currency exchange transactions mask
Here too some important rules must be observed.
Since you have clicked on “Exchange” in the cash and securities account for the currency in CHF, this currency now automatically appears as the first amount.
IMPORTANT: this currency (in the example shown, CHF), will now apply to the entire buy or sell transaction!
By default, the order entry mask will always be set to “Buy” for the transaction.
However, since you want to sell Swiss francs in this particular case, you must change this setting (see the green arrow).

Select the second option, “Debited Account”. You wanted to sell Swiss francs and buy euros instead, so this data is entered in the mask. Then enter the amount in Swiss francs that is to be sold (in this case, CHF 1,000).
IMPORTANT: you wanted to sell Swiss francs, so you have to select this as well. Next, an exchange
rate appears; you then have 15 seconds to accept it.
It goes without saying that you can also update this exchange rate by clicking on the appropriate button. If you want to accept the exchange rate now, then please click on “Sell”.
Your currency exchange transaction is now complete.

6. Securities transactions[XX1]
With eTrading you have the exclusive option to participate personally, online, in various operations to manage the securities held in your custody account.
However, this requires active account management, so you can act within the time limits.
Access the “Corporate Actions” area via the securities transactions mask; it is located in the menu bar in the top right-hand corner in the overall view of your custody account.
Here is an enlarged view:
In the corporate actions area you will find an overview of your ongoing and completed securities transactions.
To participate in a securities transaction you must click on one of those listed in order to access the explanations in the options menu.
Most of the time you have several options that can be selected by a single click.
If you decide on an option, click on “Transmit the response” and the back office will then have all the data. It is important to do this within the specified time limit. Otherwise the default settings will be applied.

7. Documents in your account
Under the “Transactions” and “Documents” headings in the menu bar you will find all the documents and statements relating to your Trading account since the time it was opened and you can also download them as a PDF file containing all the details.
Here is an enlarged view:
A menu opens up.

8. Order History
In “Order History” you can search for your market orders over a particular period.
You can see your orders here.

9. Preferences
In your account you can change some settings directly and customise your account to suit your needs.
To do this, click on the “Preferences” button.
Here is an enlarged view:
When the “Preferences” screen appears two options are available:
9.1 “Trade Mask” and “My Profile”
Access “Trade Mask” to configure your preferred order type. Your preferences will subsequently always be offered in the “Order entry” mask.
Access “My Profile” to specify the reference currency (in “Currencies”) and to add other currency accounts to your contract.
You will receive a notification when a transaction has been carried out.
In the “Performance” area you can personally define the date from which you want to calculate the overall performance. The default setting is the account opening date.