user manual for a beta streamflow
TRANSCRIPT


User Manual for a Beta Streamflow Duration Assessment Method for the Arid
West of the United States Version 1.0
March 1, 2021
Prepared by Raphael Mazor1, Brian Topping2, Tracie-Lynn Nadeau2,3, Ken M. Fritz4, Julia Kelso5, Rachel Harrington6,
Whitney Beck2, Kenneth McCune1, Heili Lowman1, Aaron Allen7, Robert Leidy8, James T. Robb9, and Gabrielle C. L.
David10.
1 Southern California Coastal Water Research Project. Costa Mesa, CA
2 U.S. Environmental Protection Agency—Office of Wetlands, Oceans, and Watersheds. Washington, D.C.
3 U.S. Environmental Protection Agency—Region 10. Portland, OR
4 U.S. Environmental Protection Agency—Office of Research and Development. Cincinnati, OH
5 Oak Ridge Institute of Science and Education (ORISE) Fellow at U.S. Environmental Protection Agency—Office of
Wetlands, Oceans, and Watersheds. Washington, D.C.
6 U.S. Environmental Protection Agency—Region 8. Denver, CO
7 U.S. Army Corps of Engineers–South Pacific Division. Los Angeles, CA
8 U.S. Environmental Protection Agency—Region 9. San Francisco, CA.
9 U.S. Army Corps of Engineers – South Pacific Division. Sacramento, CA
10 U.S. Army Corps of Engineers—Engineer Research and Development Center Cold Regions Research and
Engineering Laboratory. Hanover, NH.
Suggested citation:
Mazor, R.D., Topping, B., Nadeau, T.-L., Fritz, K.M., Kelso, J., Harrington, R., Beck, W., McCune, K.,
Lowman, H., Allen, A., Leidy, R., Robb, J.T., and David, G.C.L. 2021. User Manuel for a Beta Streamflow
Duration Assessment Method for the Arid West of the United States. Version 1.0. Document No. EPA-
800-5-21001
Cover images
The top row shows the biological indicators included in the streamflow duration assessment method for the Arid
West: number of hydrophytic plant species, such as seep monkey flowers; abundance of aquatic invertebrates,
such as black fly larvae; evidence of mayfly, stonefly, and caddisfly taxa, such as a larva or pupal case of
Dicosmoecus gilvipes (photo credit: California Department of Fish and Wildlife’s Aquatic Bioassessment Lab); and
algal cover on the streambed.
The bottom row shows examples of perennial (Virgin River, Utah), intermittent (Pine Valley Creek, California), and
ephemeral (Red Rock Canyon, Nevada) streams.

i
Acknowledgments
The development of this method and supporting materials was guided by a regional steering committee
consisting of representatives of federal regulatory agencies in the Western U.S.: James T. Robb (U.S.
Army Corps of Engineers [USACE]—South Pacific Division, Sacramento District), Robert Leidy (U.S.
Environmental Protection Agency [USEPA]—Region 9), Aaron Allen (USACE—South Pacific Division, Los
Angeles District), Loribeth Tanner (USEPA—Region 6), Tunis McElwain (USACE—Headquarters), Gabrielle
C. L. David (USACE—Engineer Research and Development Center Cold Regions Research and Engineering
Laboratory), Matt Wilson (USACE—Headquarters), and Rose Kwok (USEPA—Headquarters).
We thank Abel Santana and Anne Holt for assistance with data management, and Jeff Brown, Liesl
Tiefenthaler, Patricia Spindler, Mike Klinefelter, John Olson, Matthew Robinson, Emma Haines, Jess
Turner, Katharina Zimmerman, Kelsey Trammel, Marcus Beck, Savannah Peña, Abigail Rivera, and
Andrew Caudillo for assistance with data collection. Rob Coulombe provided training.
Numerous researchers and land managers with local expertise assisted with the selection of sites to
calibrate the method: Chad Loflen, Patricia Spindler, Eric Stein, Scott Johnson, Andrew C. Rehn, Peter R.
Ode, Chris Solek, Christopher Tracy and the Deep Canyon Desert Research Center
(doi:10.21973/N3V66D), Stephanie Kampf, Lindsey Reynolds, Kris Barrios, Marcia Radke, Michael Bogan,
William Isham, Jonathan Humphrey, Dale Turner, Kacey Shaughnessy, Bryant Dickens, Nathan Mack, and
Boris Poff. We thank the California Department of Fish and Wildlife’s Aquatic Bioassessment Lab and
Daniel Pickard for use of imagery from the macroinvertebrate digital reference collection.
ii
Table of Contents Section 1: Introduction and Background ...................................................................................................... 1
The Beta Method for the Arid West ......................................................................................................... 3
Intended use and limitations .................................................................................................................... 6
Development of the Beta Arid West SDAM .............................................................................................. 6
Section 2: Overview of the Beta SDAM AW and the Assessment Process ................................................... 8
Considerations for assessing streamflow duration and interpreting indicators ...................................... 8
Clean Water Act Jurisdiction ................................................................................................................. 8
Scales of assessment ............................................................................................................................. 8
Spatial variability ................................................................................................................................... 8
Temporal variability .............................................................................................................................. 9
Ditches and modified natural streams .................................................................................................. 9
Braided systems .................................................................................................................................... 9
Disturbed or altered streams ................................................................................................................ 9
Section 3: Data Collection ........................................................................................................................... 11
Order of operations in completing the SDAM AW assessment .............................................................. 11
Conduct desktop reconnaissance ........................................................................................................... 11
Prepare sampling gear ............................................................................................................................ 12
Timing of sampling .................................................................................................................................. 13
Assessment reach size, selection, and placement .................................................................................. 14
Walking the assessment reach............................................................................................................ 14
How many assessment reaches are needed? ..................................................................................... 15
Photo-documentation ............................................................................................................................. 15
Conducting assessments and completing the field form ........................................................................ 15
General site information ..................................................................................................................... 15
Site sketch ........................................................................................................................................... 18
How to measure indicators of streamflow duration .............................................................................. 18
1. How many hydrophytic plant species (up to five) are growing in the channel, or within one
half-channel width of the channel? .................................................................................................... 19
2. How many aquatic macroinvertebrate individuals are found? .................................................. 23
3. Is there evidence of aquatic stages of Ephemeroptera, Plecoptera, or Trichoptera (EPT) taxa?
27
4. Are algae found on the streambed? ........................................................................................... 29

iii
5. Are single indicators of intermittent or perennial streamflow duration observed? .................. 32
Supplemental information ...................................................................................................................... 34
Aquatic or semi-aquatic amphibians and reptiles .............................................................................. 34
Aquatic invertebrates that prefer perennial streams ......................................................................... 37
Iron-oxidizing fungi and bacteria ........................................................................................................ 38
Additional notes and photos ................................................................................................................... 39
Section 4: Data Interpretation .................................................................................................................... 40
Outcomes of SDAM classification ........................................................................................................... 40
What to do if an SDAM application results in Need more information .................................................. 43
Evaluate supplemental information collected during assessments ................................................... 43
Conduct additional evaluations at the same site ................................................................................ 43
Conduct evaluations at nearby sites ................................................................................................... 43
Review historical aerial imagery ......................................................................................................... 43
Conduct site revisits during regionally appropriate wet and dry seasons .......................................... 45
Collect additional hydrologic data ...................................................................................................... 45
Preparing a Streamflow Duration Assessment Report ........................................................................... 45
References .................................................................................................................................................. 46
Appendix A. Glossary of terms .................................................................................................................... 48
Appendix B. Images of Aquatic Invertebrates of the Arid West ................................................................. 53
Appendix C. Field Forms ............................................................................................................................. 74
Section 1: Introduction and Background
1
Section 1: Introduction and Background Streams exhibit a diverse range of hydrologic regimes, and the hydrologic regime strongly influences the
physical, chemical, and biological characteristics of active stream channels and their adjacent riparian
areas. Thus, information describing a stream’s hydrologic regime is useful to support resource
management decisions, including regulatory decisions. One important aspect of the hydrologic regime is
streamflow duration—the length of time that a stream sustains surface flow. However, hydrologic data
to determine flow duration has not been collected for most stream-reaches nationwide. Although maps,
hydrologic models, and other data resources exist (e.g., the National Hydrography Dataset, McKay et al.
2012), they may exclude small headwater streams and unnamed second- or third-order tributaries, and
limitations on accuracy and spatial or temporal resolution may reduce their utility for many
management applications (Hall et al. 1998, Nadeau and Rains 2007, Fritz et al. 2013). Therefore, there is
a need for rapid, field-based methods to determine flow duration class at the reach scale in the absence
of long-term hydrologic data (Fritz et al. 2020).
This method is intended to classify stream reaches into one of three streamflow duration classes 0F
1:
Ephemeral reaches are channels that flow only in direct response to precipitation. Water typically
flows only during and/or shortly after large precipitation events, the streambed is always above the
water table, and stormwater runoff is the primary water source.
Intermittent reaches are channels that contain sustained flowing water for only part of the year,
typically during the wet season, where the streambed may be below the water table and/or where
the snowmelt from surrounding uplands provides sustained flow. The flow may vary greatly with
stormwater runoff.
Perennial reaches are channels that contain flowing water continuously during a year of normal
rainfall, often with the streambed located below the water table for most of the year. Groundwater
typically supplies the baseflow for perennial reaches, but the baseflow may also be supplemented
by stormwater runoff and/or snowmelt.
Example photos and hydrographs of stream reaches in each class are shown in Figure 1.
1 The definitions used for development of this manual are consistent with the definitions used to develop the streamflow duration assessment method for the Pacific Northwest, and they are not identical to the definitions found in the Navigable Waters Protection Rule of 2020 at 33 CFR 328.3(c) / 40 CFR 120.2.

Section 1: Introduction and Background
2
Perennial stream reach Whitewater River at Whitewater, CA
(USGS 10256000)
Intermittent stream reach Babocomari River at Tombstone, AZ
(USGS 09471400)
Ephemeral stream reach Dark Canyon at Carlsbad, NM
(USGS 08405150)
Figure 1. Examples of stream reaches in each streamflow duration class. Hydrographs are in cubic feet per second. Red dots indicate gauge readings of zero (i.e., dry conditions). Photo credits: Raphael Mazor (left, middle) and Emma Haines (right).
These classes describe the typical patterns exhibited by a stream reach over multiple years, although
observed patterns in a single year may vary due to extreme and transient climatic events (e.g., severe
droughts). Although flow duration classes are not strictly defined by their sources of flow (e.g., storm
runoff, groundwater, snowmelt), the duration is often related to the relative importance of different
flow sources to stream reaches and the stability of their contributions. Perennial reaches have year-
round surface flow in the absence of drought conditions. Intermittent reaches have one or more periods
of flow sustained by sources other than surface runoff in direct response to precipitation, such as
groundwater, melting snowpack, irrigation, reservoir operations, or wastewater discharges. Ephemeral
reaches have a surface flow for short periods and only in direct response to precipitation.
This manual describes a beta Streamflow Duration Assessment Method (SDAM) that is intended to
distinguish flow duration classes of stream reaches in the Arid West (AW) region of the United States as
defined in the National Wetland Plant list (USACE 2018), excluding the AW region that overlaps with the
states of Washington, Oregon, and Idaho, which are covered by the SDAM for the Pacific Northwest
described in Nadeau (2015); Figure 2. The SDAM AW is based on biological indicators that are known to
respond to gradients of streamflow duration (Fritz et al. 2020). Biological indicators have notable
advantages for assessing natural resources. The primary advantage is their ability to reflect long-term
environmental conditions (e.g., Karr et al. 1986, Rosenberg and Resh 1993). This characteristic makes
them well suited for assessing streamflow duration, because some species reflect the aggregate
hydrologic conditions that a stream has experienced over multiple years. As a result, relatively rapid
field observation of biological indicators made at a single point in time can provide long-term insights
into streamflow duration and other hydrological characteristics of a stream reach.

Section 1: Introduction and Background
3
Figure 2. Arid regions of the western USA. The beta SDAM AW applies to the dark blue region shown above.
The Beta Method for the Arid West This manual describes a protocol that uses a small number of indicators to predict streamflow duration
class in the Arid West. All indicators are quantified during a single field visit and across the entire
assessment reach. It is anticipated that the beta method will be made available for one year to allow the
user community to provide feedback before a final SDAM AW is produced. For more information on the
development of this SDAM, and SDAMs for other U.S. regions, please refer to EPA’s SDAM website:
https://www.epa.gov/streamflow-duration-assessment.
Five biological indicators form the basis of the method. The first four indicators are evaluated together
to assign a preliminary flow duration class to a stream reach. In contrast, the fifth consists of single
indicators whose presence determines that a reach is At least intermittent, either supporting or
superseding the preliminary classification determined from the first four indicators. An At least
intermittent classification indicates that the reach is confidently not ephemeral, but the indicator data
do not specify if the reach is either perennial or intermittent with high confidence. In cases where a
confident classification cannot be made, the classification is Need more information; guidance on
resolving these situations is provided in a subsequent section of this manual. The five indicators are:
1. How many hydrophytic plant species (up to five) are growing in the channel, or within one half-
channel width of the channel?

Section 1: Introduction and Background
4
2. How many aquatic macroinvertebrate individuals are found?
3. Is there evidence of aquatic stages of Ephemeroptera, Plecoptera, or Trichoptera (EPT) taxa?
4. Are algae found on the streambed?
5. Are single indicators (i.e., the presence of fish or > 10% algal cover) of intermittent or perennial
streamflow duration observed?
The observed indicators are compared with values in Table 1 to determine the streamflow duration
classification. Each question is answered using field-measured indicator data starting with the first
column on the left, and proceeding to the right. The values observed for each indicator determine which
row should be followed until the appropriate classification is reached. Blank cells for an indicator mean
that regardless of their presence or absence in the reach, a classification has already been determined
by the other indicators. For the beta SDAM AW, it is recommended that all five indicators be measured
and recorded during every assessment.

Section 1: Introduction and Background
5
Table 1. Streamflow duration classifications based on key indicators. 1F
2
2 Shading provided to enhance readability by increasing the contrast between neighboring cells; empty cells indicate the classification will not change with additional information however it is recommended that all five indicators be measured and recorded during every assessment.
1. Hydrophytic
plant species
2. Aquatic
invertebrates
3. EPT
taxa
4. Algae 5. Single indicators
• fish present
• algae cover ≥ 10%
Classification
None
None Absent
Absent Absent Ephemeral
Present At least intermittent
Present Absent Need more information
Present At least intermittent
Few (1-19)
Absent
Absent Absent Need more information
Present At least intermittent
Present Absent Need more information
Present At least intermittent
Present At least intermittent
Many (20+)
Absent
Absent Absent Need more information
Present At least intermittent
Present Absent Need more information
Present At least intermittent
Present At least intermittent
Few (1-2)
None Absent Absent
Absent Need more information
Present At least intermittent
Present At least intermittent
Few (1-19)
Absent Absent Intermittent
Present At least intermittent
Present At least intermittent
Many (20+)
Absent Absent Intermittent
Present At least intermittent
Present Absent At least intermittent
Present Intermittent
Many (3+)
None Absent Absent
Absent Need more information
Present At least intermittent
Present At least intermittent
Few (1-19)
Absent At least intermittent
Present Perennial
Many (20+)
Absent At least intermittent
Present Perennial

Section 1: Introduction and Background
6
Intended use and limitations The SDAM AW is intended to support field classification of streamflow duration at the reach scale in
streams with defined channels (having a bed and banks) in the AW region. Use of the SDAM AW may
inform a range of activities where information on streamflow duration is useful, including certain
jurisdictional determinations under the Clean Water Act; however, the SDAM AW is not in itself a
jurisdictional determination. The method is not intended to supersede more direct streamflow duration
measures (e.g., long-term records from stream gages). Other sources of information, such as aerial
imagery, site photos, traditional ecological knowledge, and local expertise, can supplement the SDAM
AW when classifying streamflow duration (Fritz et al. 2020).
Although the SDAM AW is intended for use in both natural and altered stream systems, some alterations
may complicate the interpretation of field-measured indicators or potentially lead to incorrect
conclusions. For example, streams managed as flood control channels may undergo frequent
maintenance to remove some or all vegetation in the assessment area. Although some biological
indicators recover quickly from these disturbances, the results from assessments conducted shortly
after such disturbances may be misleading.
Poor water quality in streams may affect biological indicators—notably, the presence of mayflies,
stoneflies, and caddisflies (i.e., Ephemeroptera, Plecoptera, and Trichoptera, or EPT taxa). Indeed,
several studies have documented the absence of these sensitive taxa in effluent-dominated rivers in the
Southwest (e.g., Halaburka et al. 2013, Hamdhani et al. 2020). However, upgrades to water treatment
plants can lead to a recovery of mayfly taxa (Baker and Sharp Jr. 1998). Consequently, the SDAM AW
may fail to identify perennial systems as Perennial in situations where water quality has been severely
degraded by wastewater or other types of stress such that EPT taxa are eliminated. The SDAM AW
includes other biological indicators that are less affected by poor water quality, and therefore it will
typically classify such streams as At least intermittent.
Development of the Beta Arid West SDAM
Figure 3. Locations of ephemeral, intermittent, and perennial stream reaches used to develop the SDAM AW.

Section 1: Introduction and Background
7
The beta SDAM AW resulted from a multi-year study conducted in numerous locations across the Arid
West (Figure 3) following the process described in Fritz et al. (2020). Twenty-one candidate indicators
expected to control or respond to streamflow duration were tested at 89 study sites with a known flow
duration class: 30 ephemeral sites, 34 intermittent sites, and 25 perennial sites. Through statistical
analyses, the subset of indicators with the highest diagnostic accuracy of flow duration class was
combined into the beta SDAM AW. An expanded data collection effort is planned to begin in 2021 to
inform the development of the final SDAM AW. The expanded effort’s primary goals are to improve
upon the precision and accuracy of the beta SDAM AW and address any shortcomings or limitations
identified during the one-year period following publication of the beta method. For more information,
refer to EPA’s SDAM website: https://www.epa.gov/streamflow-duration-assessment.
Development of the SDAM AW followed the below process steps (Fritz et al. 2020):
• Conducted a literature review with two goals:
o Identified existing SDAMs, focusing on those in the Arid West and comparable arid
regions
o Identified potential biological, hydrologic, and physical indicators of streamflow
duration for evaluation in the Arid West
• Identified candidate study sites with known streamflow duration class, representing diverse
environmental settings throughout the region
• Collected indicator data at 90 study sites
• Calibrated a classification model using a machine learning algorithm (i.e., random forest)
• Refined and simplified the model for rapid and consistent application
The literature review (McCune and Mazor 2019) identified eight flow duration methods for arid regions,
two of which cover portions of the Arid West as defined for this project: the SDAM for the Pacific
Northwest (Nadeau 2015) and the New Mexico method (NMED 2011). From these methods and the
scientific literature, a large number of geomorphological, hydrological, and biological candidate
indicators were identified. These candidate indicators were screened using several criteria, including
consistency, repeatability, defensibility, rapidness, and objectivity, and then evaluated for their ability to
discriminate among streamflow duration classes. The final set of metrics was simplified to reduce the
amount of time required to conduct measurements in the field while maintaining the performance of
the method (e.g., by converting continuous measurements to discrete or presence/absence
measurements). These metrics were then used to calibrate a model that could classify a stream based
on the observed indicators. If the model can rule out ephemeral status, but cannot confidently
determine if a stream is perennial or intermittent, the stream is classified as At least intermittent. If no
class can be determined with confidence, or if the model cannot distinguish between ephemeral and
intermittent status, the stream is classified as Need more information (see section below on how to
interpret this result). If a single indicator of intermittent or perennial streamflow duration (i.e., fish
presence or algae cover ≥ 10%) is observed at a site that would otherwise be classified as Ephemeral or
Need more information, then the classification becomes At least intermittent.

Section 2: Overview of the beta SDAM AW and the assessment process
8
Section 2: Overview of the Beta SDAM AW and the Assessment Process
Considerations for assessing streamflow duration and interpreting indicators
Clean Water Act Jurisdiction Regulatory agencies evaluate aquatic resources based on current regulations, guidance, and policy, and
the Beta SDAM AW does not incorporate that broad scope of analysis. Rather, the method provides
information that may support timely decisions because it helps determine the duration of streamflow.
Scales of assessment The SDAM AW protocol applies to an assessment reach, the length of which scales with the mean
channel width (from a minimum of 40 m to a maximum of 200 m). Indicator observations are restricted
to the channel and within one-half channel width. Floodplains and wetlands extending beyond the
immediate area are not included in the assessment of SDAM AW indicators. However, ancillary
information from outside the assessment reach (such as surrounding land use) is also recorded. The
minimum reach-length of 40 m is necessary to ensure that a sufficient area has been assessed to
observe indicators.
Spatial variability Indicators of streamflow duration (and other biological, hydrologic, and geomorphic characteristics of
streams) vary in their strength of expression within and among reaches in a stream system. The main
drivers of spatial variation are generally the physiographic province (e.g., geology and soils) and climate
(e.g., seasonal patterns of precipitation, snowmelt, and evapotranspiration). For example, certain
vegetation indicators, such as willows and other deep-rooted hydrophytic plants, may be more strongly
expressed in a floodplain with deep alluvial soils than they would be in a reach underlain by shallow
bedrock, even if both reaches have a similar duration of flow. Therefore, understanding the sources of
spatial variability in streamflow indicators will help ensure that assessments are conducted within
relatively homogenous reaches.
Common sources of variation within a stream system include:
• Longitudinal changes in stream indicators are related to increasing duration and volume of flow.
As streams gain or lose streamflow, the expression of indicators changes.
• Longitudinal changes are due to channel gradient and valley width, which affect physical
processes, and they may directly or indirectly affect the expression of indicators. Sharp
transitions in valley gradient or width (e.g., going from a confined canyon to an alluvial fan) can
be associated with changes in streamflow duration.
• The size of the stream; streams develop different channel dimensions due to differences in flow
magnitude, sediment loads, landscape position, land-use history, and other factors.
• Other natural sources of variation, such as fractured bedrock, volcanic parent material, recent or
extensive relic colluvial activity (landslides or debris flows), and drought or unusually high
precipitation events, should also be noted by the user.
• Transitions in land use with different water use (e.g., from commercial forest to pasture, from
pasture to cultivated farmland, or cultivated farmland to an urban setting), or changes in
management practices (e.g., intensification of grazing) that affect the expression of indicators.

Section 2: Overview of the beta SDAM AW and the assessment process
9
• Stream management and manipulation, such as diversions, water importation, dam operations,
and habitat modification (e.g., streambed armoring), can also influence the appearance of
biological, hydrological, and physical characteristics of streams.
Temporal variability Temporal variability in indicators may affect streamflow duration assessment in two ways: interannual
(e.g., year-to-year) variability and intra-annual (e.g., seasonal) variability. This method was developed to
be robust to both types of temporal variability and is intended to classify streams based on their long-
term patterns in either flowing or dry conditions. However, both long-term sources of temporal
variability (such as El Niño-related climatic cycles) and short-term sources (such as scouring storms
before sampling) may influence the ability to measure or interpret indicators at the time of assessment.
Timing of management practices, such as dam operations, channel clearing, or groundwater pumping,
may also affect the flow duration assessment.
Some indicators are highly responsive to temporal variability. For example, algal growth may be
detected in a streambed only following a few weeks of sustained inundation. In contrast, long-lived
riparian plants tend to reflect long-term patterns, and changes in flow regimes may take several years to
result in changes in the hydrophytic plant community. For example, willows with well-established root
systems are likely to survive in an intermittent reach experiencing severe drought, even when flow in a
single year is insufficient to support expression of algal or aquatic invertebrate indicators. Through the
inclusion of multiple indicators having different lifespans and life-history traits, SDAM AW classifications
reflect both recent and long-term patterns in flow duration.
Ditches and modified natural streams Streamflow duration assessments are sometimes needed in canals, ditches, and modified natural
streams that are primarily used to convey water. These systems tend to have altered flow regimes, and
the SDAM AW may determine if these flow regimes support indicators consistent with different
streamflow durations. Thus, the SDAM AW may be applied to these systems when streamflow duration
information is needed.
Braided systems Assessors should identify the extent of the channels, based on the outer limits of ordinary high-water
mark (OHWM), and apply the method to that area as a whole. Some indicators may be present or more
apparent in the main channel versus the secondary channels; note these differences on the field
assessment form.
Disturbed or altered streams Assessors should be alert for natural or human-induced disturbances that either alter streamflow
duration directly or modify the ability to measure indicators. Streamflow duration can be directly
affected by flow diversions, urbanization and stormwater management, septic inflows, agricultural and
irrigation practices, effluent dominance, or other activities. In the development data set, the SDAM AW
classified disturbed sites with the same accuracy as undisturbed sites. When the disturbance is severe
enough to convert a reach from one streamflow duration class to another, the SDAM AW typically
identifies the new class if sufficient time has passed since the disturbance.
Streamflow duration indicators can also be affected by disturbances that may not substantially affect
streamflow duration (for instance, grading, grazing, recent fire, riparian vegetation management, and

Section 2: Overview of the beta SDAM AW and the assessment process
10
bank stabilization); in extreme cases, these disturbances may eliminate specific indicators (e.g., absence
of hydrophytic vegetation in concrete channels). Some long-term alterations or disturbances (e.g.,
impoundments) can make streamflow duration class more predictable by reducing year-to-year
variation in flow duration and/or indicators. Discussion of how specific indicators are affected by
disturbance is provided below in the section on data collection. Assessors should describe disturbances
in the “Notes on disturbances or difficult site conditions” section of the field form.

Section 3: Data collection
11
Section 3: Data Collection
Order of operations in completing the SDAM AW assessment The following general workflow is recommended for efficiency in the field:
1. Conduct desktop reconnaissance.
2. Prepare sampling gear.
3. Walk the reach.
a. Measure the channel width at three locations and calculate the average to determine
the total reach length.
b. Record the presence of fish (i.e., one of the SDAM AW indicators), amphibians, and
other organisms that may be disturbed by field crew activity.
c. Take photos at appropriate locations (i.e., the top, middle, and bottom of the
assessment reach) and begin sketching the site on the field form.
4. Determine the length of assessment reach and reach boundaries.
5. Record general site information on the data sheet.
6. Evaluate the remaining indicators:
a. Record hydrophytic plant species.
b. Collect invertebrates from 6 suitable locations. Tally individuals, and search for mayflies,
stoneflies, and caddisflies in the sampled material.
c. Visually estimate the percent cover of algae in the streambed.
7. Complete and review the field form.
8. Enter data into the web form or refer to Table 1.
Conduct desktop reconnaissance Before a site visit, desktop reconnaissance helps ensure a successful assessment of a stream. During
desktop reconnaissance, assessors evaluate site accessibility and set expectations for conditions that
may affect field sampling. In addition, assessors can begin to compile additional data that may inform
determination of streamflow duration, such as location of nearby stream gages.
This stage of the evaluation is crucial for determining site access. Plot the site or project area on a map
to determine access routes and whether landowner permissions are required. Identify safety concerns
or hazards that may affect sampling, such as road closures or landslides associated with wildfire. These
access constraints are sometimes the most challenging aspect of environmental field activities, and
desktop reconnaissance can reduce these difficulties. Also, assessors can determine if inaccessible
portions of the reach (e.g., those on adjacent private property) have consistent geomorphology or other
attributes, compared with accessible portions.
Desktop reconnaissance can also help identify features that may affect assessment reach placement or
the number of assessment reaches required for a project. Look for natural and artificial features that
may affect streamflow duration at the site—particularly those that may not be evident during the field
visit, or on inaccessible land outside the assessment area. These features include sharp transitions in
geomorphology, upstream dams or reservoirs, and major tributaries. It may be possible to see bedrock
outcrops or other features that modify streamflow duration in sparsely vegetated areas. A review of
historical imagery may also indicate whether the site or its upstream watershed is influenced by
snowmelt.
Section 3: Data collection
12
Evaluating watershed characteristics during desktop reconnaissance can produce useful information
that will help assessors anticipate field conditions, or provide contextual data to help interpret results.
The USGS StreamStats tool, as well as the U.S. EPA WATERS GeoViewer, provide convenient online
access to watershed information for most sites in the United States, such as drainage area, soils, land
use or impervious cover in the catchment, or modeled bankfull discharge.
• USGS StreamStats: https://streamstats.usgs.gov/ss/
• U.S. EPA WATERS GeoViewer: https://www.epa.gov/waterdata/waters-geoviewer
Consult local experts and agencies to gain additional insights about site conditions and see if additional
data are available. For example, state agencies may have records on water quality sampling, indicating
times when the site was sampled, and when it was dry. Local experts may have information about
changes in the site’s streamflow duration.
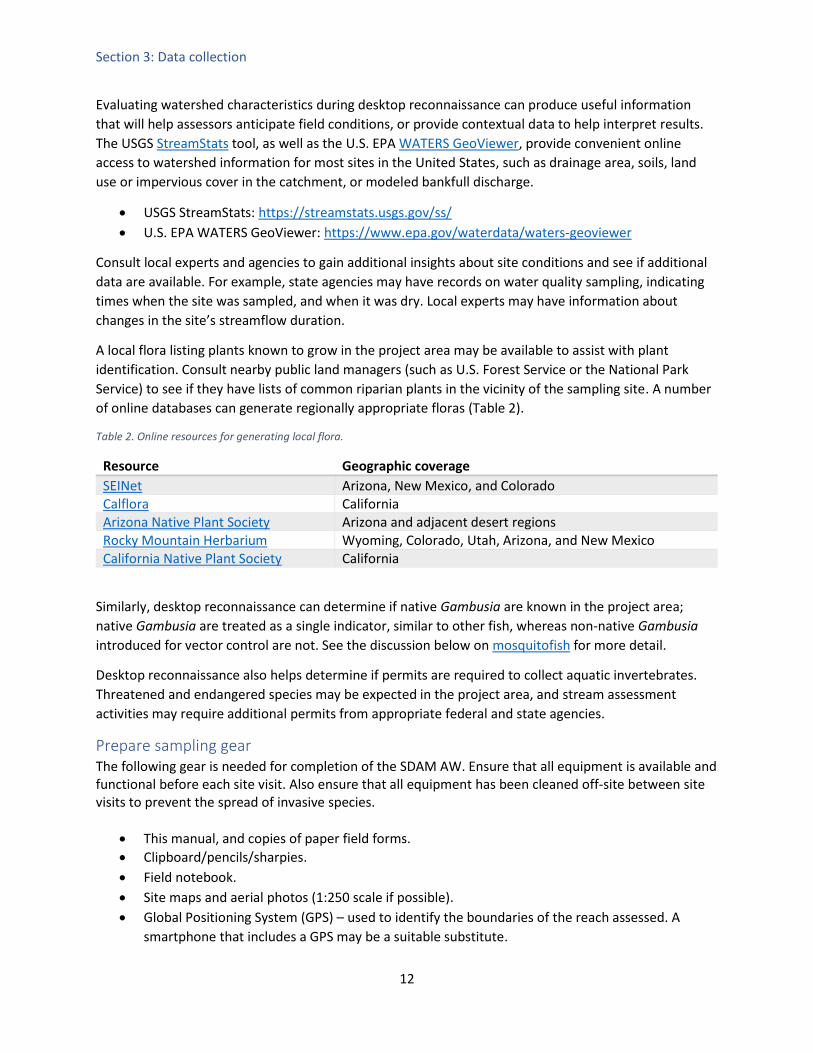
A local flora listing plants known to grow in the project area may be available to assist with plant
identification. Consult nearby public land managers (such as U.S. Forest Service or the National Park
Service) to see if they have lists of common riparian plants in the vicinity of the sampling site. A number
of online databases can generate regionally appropriate floras (Table 2).
Table 2. Online resources for generating local flora.
Resource Geographic coverage
SEINet Arizona, New Mexico, and Colorado Calflora California Arizona Native Plant Society Arizona and adjacent desert regions Rocky Mountain Herbarium Wyoming, Colorado, Utah, Arizona, and New Mexico California Native Plant Society California
Similarly, desktop reconnaissance can determine if native Gambusia are known in the project area;
native Gambusia are treated as a single indicator, similar to other fish, whereas non-native Gambusia
introduced for vector control are not. See the discussion below on mosquitofish for more detail.
Desktop reconnaissance also helps determine if permits are required to collect aquatic invertebrates.
Threatened and endangered species may be expected in the project area, and stream assessment
activities may require additional permits from appropriate federal and state agencies.
Prepare sampling gear The following gear is needed for completion of the SDAM AW. Ensure that all equipment is available and functional before each site visit. Also ensure that all equipment has been cleaned off-site between site visits to prevent the spread of invasive species.
• This manual, and copies of paper field forms.
• Clipboard/pencils/sharpies.
• Field notebook.
• Site maps and aerial photos (1:250 scale if possible).
• Global Positioning System (GPS) – used to identify the boundaries of the reach assessed. A
smartphone that includes a GPS may be a suitable substitute.

Section 3: Data collection
13
• Tape measure – for measuring channel width and reach length.
• Kick-net or small net and tray – used to sample aquatic invertebrates.
• Mechanical tally counter (optional).
• Hand lens – to assist with macroinvertebrate and plant identification.
• Digital camera (or smartphone with camera), plus charger. Ideally, use a digital camera that automatically record metadata, such as time, date, directionality, and location, as part of the EXIF data associated with the photo.
• Polarized sunglasses – for eliminating surface glare when looking for fish, amphibians, and macroinvertebrates.
• Shovel, soil augur, rock hammer, hand trowel, pick or other digging tools to facilitate hydrological observations of subsurface flow.
• Macroinvertebrate field guides (e.g., A Guide to Common Freshwater Invertebrates of North America, Voshell and Wright 2002).
• Vials filled with 70% ethanol and sealable plastic bags for collection of biological specimens, with sample labels printed on waterproof paper.
• Hydrophytic plant identification guides (e.g., Trees and Shrubs of California, Stuart and Sawyer 2001; Western Wetland Flora: An Introduction to the Wetland and Aquatic Plants of the Western United States, Chadde 2019).
• The U.S. Army Corps of Engineers List of wetland plants for sites to be visited – http://wetland-
plants.usace.army.mil/.
• Herpetological field guides (e.g., A Field Guide to Western Reptiles and Amphibians, Stebbins
2003).
• First-aid kit, sunscreen, insect repellant, and appropriate clothing.
Timing of sampling Ideally, SDAM AW application should occur during the growing season when both riparian plants and
aquatic invertebrates are active and most readily identifiable. Assessments may be made during other
times of the year, but there is an increased likelihood of specific indicators being dormant or difficult to
measure at the time of assessment. However, several of the indicators included in the method persist
well beyond a single growing season (e.g., hydrophytic vegetation, algal cover), reducing the sensitivity
of the method to the timing of sampling.
The protocol may be used in flowing streams as well as in dry or drying streams. However, care should
be taken to avoid sampling during flooding conditions and wait at least one week after large storm
events that impact vegetation and sediment in the active stream channel before collecting data to allow
aquatic invertebrates and other biological indicators to recover (Grimm and Fisher 1989). In general,
aquatic invertebrate abundance is suppressed during and shortly after major channel-scouring events,
potentially leading to inaccurate assessments. Recent rainfall can interfere with measurements (e.g., by
washing away aquatic invertebrates or increasing turbidity such that algae on the streambed are not
visible). Assessors should note recent rainfall events on the field form and consider the timing of field
evaluations to assess each indicator’s applicability. Field evaluations should not be completed within
one week of significant rainfall that results in surface runoff. Local weather data and drought
information should be reviewed before assessing a reach or interpreting indicators. Whenever
interpreting SDAM AW data, it is recommended that precipitation data from nearby weather stations be
evaluated after each sampling event to determine if storms may have affected data collection.

Section 3: Data collection
14
Assessment reach size, selection, and placement An assessment reach should have a length equal to 40 channel-widths, with a minimum of 40 m (to
ensure that sufficient area is assessed to observe indicators) and a maximum length of 200 m. Channel
width is averaged from measurements at three locations (e.g., at the downstream end, at 15 m, and at
30 m upstream from the downstream end). Width measurements are made at bankfull elevation,
perpendicular to the thalweg (i.e., the deepest point within the channel). Reach length is measured
along the thalweg. If site constraints (e.g., limited access) require a shorter assessment reach than
needed, the actual assessed reach-length should be noted on the field form, along with an explanation
for why a shortened reach was necessary.
For some applications, reach placement is dictated by project requirements. For example, a small
project area may be fully covered by a single assessment reach. In these cases, assessment reaches may
contain diverse segments with different streamflow duration classes (e.g., a primarily perennial reach
with a short intermittent portion where the flow goes subsurface). In these cases, the portions of the
reach with long-duration flows will likely have a greater influence on the outcome than the portions
with short-duration flows, depending on each portion’s relative size.
Natural features, such as bedrock outcrops or valley confinements, and non-natural features like
culverts or road crossings may alter hydrologic characteristics in their immediate vicinity. For example,
culverts may create plunge pools, and drainage from roadways is often directed to roadside ditches that
enter the stream near crossings, leading to a potential increase in indicators of long streamflow
duration. Specific applications may require that these areas be included in the assessment, even though
they are atypical of the larger assessment reach. For other applications, the area of influence may be
avoided by moving the reach at least 10 m up- or downstream.
Walking the assessment reach Stream assessments should begin by first walking the channel’s length, to the extent feasible, from the
target downstream end to the top of the assessment reach. This initial review of the site allows the
assessor to examine the channel’s overall form, landscape, parent material, and variation within these
attributes as it develops or disappears upstream and downstream. This investigation may determine
whether adjustments to assessment reach boundaries are needed, or whether multiple assessment
reaches are needed to adequately characterize streamflow duration throughout the project area.
Walking alongside, rather than in, the channel is recommended for the initial review to avoid
unnecessary disturbance to the stream and maximize the opportunity to observe single indicator
organisms (e.g., fish). Walking the channel also allows the assessor to observe the surrounding
landscape’s characteristics, such as land use and sources of flow (e.g., stormwater pipes, springs, seeps,
and upstream tributaries).
Once the walk is complete, the assessor can identify the areas along the stream channel where these
various sources (e.g., stormflow, tributaries, or groundwater) or sinks (alluvial fans, abrupt changes in
bed slope, etc.) of water may cause abrupt changes in flow duration. When practical, assessment
reaches should have relatively uniform channel morphology. When evaluating the channel’s
homogeneity, focus on permanent features that control streamflow duration (such as valley gradient
and width), rather than on the presence or absence of surface water. Project areas that include
confluences with large tributaries, significant changes in geologic confinement, or other features that
may affect flow duration may require separate assessments above and below the feature. Regardless of
Section 3: Data collection
15
whether a reach is moved or shortened, it should not be less than 40 m in length to ensure that
indicators are measured appropriately. Assessments based on reaches shorter than 40 m may not detect
indicators that would be recorded by assessments with the recommended size, and may thus provide
inaccurate classifications.
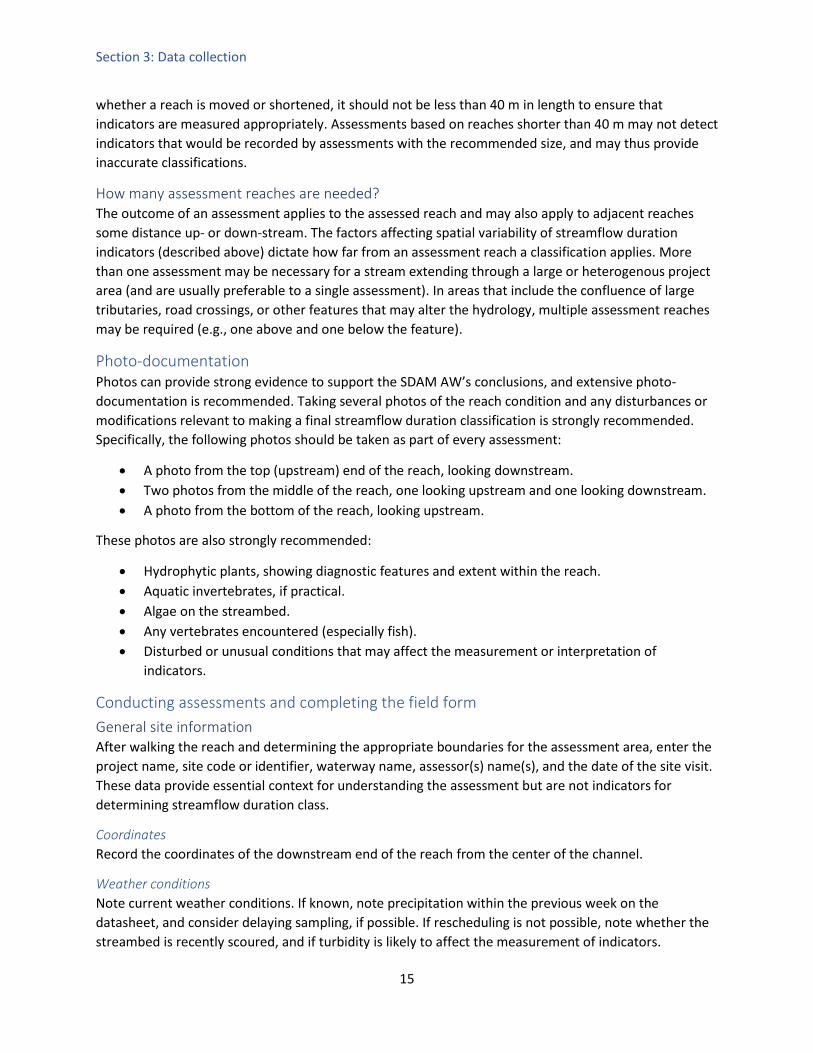
How many assessment reaches are needed? The outcome of an assessment applies to the assessed reach and may also apply to adjacent reaches
some distance up- or down-stream. The factors affecting spatial variability of streamflow duration
indicators (described above) dictate how far from an assessment reach a classification applies. More
than one assessment may be necessary for a stream extending through a large or heterogenous project
area (and are usually preferable to a single assessment). In areas that include the confluence of large
tributaries, road crossings, or other features that may alter the hydrology, multiple assessment reaches
may be required (e.g., one above and one below the feature).
Photo-documentation Photos can provide strong evidence to support the SDAM AW’s conclusions, and extensive photo-
documentation is recommended. Taking several photos of the reach condition and any disturbances or
modifications relevant to making a final streamflow duration classification is strongly recommended.
Specifically, the following photos should be taken as part of every assessment:
• A photo from the top (upstream) end of the reach, looking downstream.
• Two photos from the middle of the reach, one looking upstream and one looking downstream.
• A photo from the bottom of the reach, looking upstream.
These photos are also strongly recommended:
• Hydrophytic plants, showing diagnostic features and extent within the reach.
• Aquatic invertebrates, if practical.
• Algae on the streambed.
• Any vertebrates encountered (especially fish).
• Disturbed or unusual conditions that may affect the measurement or interpretation of
indicators.
Conducting assessments and completing the field form
General site information After walking the reach and determining the appropriate boundaries for the assessment area, enter the
project name, site code or identifier, waterway name, assessor(s) name(s), and the date of the site visit.
These data provide essential context for understanding the assessment but are not indicators for
determining streamflow duration class.
Coordinates
Record the coordinates of the downstream end of the reach from the center of the channel.
Weather conditions
Note current weather conditions. If known, note precipitation within the previous week on the
datasheet, and consider delaying sampling, if possible. If rescheduling is not possible, note whether the
streambed is recently scoured, and if turbidity is likely to affect the measurement of indicators.
Section 3: Data collection
16
Surrounding land use
Indicate the dominant land-use around the site within 100 m of the assessment reach. Check up to two
of the following:
• Urban/industrial/residential (buildings, pavement, or other anthropogenically hardened
surfaces).
• Agricultural (e.g., farmland, crops, vineyard, pasture).
• Developed open-space (e.g., golf course, sports fields).
• Forested.
• Other natural.
• Other (describe).
Channel width and reach length
Record the channel width at three locations at bankfull elevation, and record to the nearest 0.1 m.
Widths should be measured perpendicular to the thalweg. In braided systems, widths should span all
channels within the OHWM. Taking measurements at 0, 15, and 30 m above the downstream end of the
reach or approximately one-third of the expected reach length is recommended. Calculate the average
channel width.
Record the reach length, which should be 40 times the average channel width, but no less than 40 m
and no more than 200 m, and measured along the thalweg (i.e., along the deepest points within the
channel). In multi-thread systems, measure reach-length along the thalweg of the deepest channel. If
circumstances require a shorter reach length, enter the assessed reach’s actual length. Justification for
an assessment reach length shorter than 40 m should be provided in “Describe reach boundaries.”
Describe reach boundaries
Record observations about the reach on the field form, such as changes in land use, disturbances, or
natural changes in stream characteristics that occur immediately up or downstream. If the reach is less
than 200 m and shorter than 40 times the average channel width, explain why a shorter reach length
was appropriate. For example: “The downstream end is 30 m upstream of a culvert under a road. The
upstream end is close to a conspicuous dead tree just past a large meander, near a fence marking a
private property boundary. The reach length was shortened to 150 m to avoid private property.”
Photo-documentation of reach
Check the boxes on the field form as you take the required photos from the bottom, middle, and top of
reach. Record the photo ID on the designated part of the field form.
Disturbed or difficult conditions
Note any disturbances or unusual conditions that may create challenges for assessing flow duration.
Common situations include practices that alter hydrologic regimes, such as diversions, culverts,
discharges of effluent or runoff, and drought. Note circumstances that may limit the growth of
hydrophytes, such as channelization, or vegetation removal that may affect the measurement or
interpretation of several indicators (Figure 4). Also note if the stream appears recently restored, for
example, stream armoring with large substrate or wood additions and recently planted vegetation in the
riparian zone.

Section 3: Data collection
17
Figure 4. Examples of difficult conditions that may interfere with the observation or interpretation of indicators, such as hydrophytic plants. Note that even in the photo on the right, some vegetation is evident; field crews should determine if these plants are hydrophytes. In contrast, the photo on the left shows no vegetation due to the recent channel maintenance; in this case, returning to the site in a month or so may allow plants to recolonize the channel. Photo credits: Raphael Mazor.
Observed hydrology
Surface flow
Visually estimate the percentage of the reach-length that has flowing surface water, or subsurface flow.
The site sketch should indicate where surface flow is evident and where dry portions occur.
Subsurface flow
If the reach has discontinuous surface flow, investigate the dry portions to see if subsurface flow is
evident. Examine below the streambed by turning over cobbles and digging with a trowel. Resurfacing
flow downstream may be considered evidence of subsurface flow (Figure 5). Other evidence of
subsurface flow includes:
• Flowing surface water disappears into alluvial deposits and reappears downstream. This is
scenario is common when a large, recent alluvium deposit created by a downed log or other
grade-control structure creates a sharp transition in the channel gradient or in valley
confinement.
• Water flows out of the streambed (alluvium) and into isolated pools. • Water flows below the streambed and may be observed by moving streambed rocks or digging a
small hole in the streambed.
• Shallow subsurface water can be heard moving in the channel, particularly in steep channels with coarse substrates.
Record the percent of the reach with subsurface and surface flow (combined). That is, the percent of
reach with subsurface flow should be greater than or equal to the percent of reach with surface flow
(Figure 5).
The site sketch should indicate where subsurface flow is evident.
Number of isolated pools
If the reach is dry or has discontinuous surface flow, look for isolated pools within the channel that
provide aquatic habitat. If there is continuous surface flow throughout the reach, enter 0. The site
sketch should indicate the location of pools in the channel or on the floodplain. Only isolated pools

Section 3: Data collection
18
within the channel are counted; count isolated pools within secondary channels below the OHWM.
Pools connected to flowing surface water and isolated pools on the floodplain do not count. Dry pools
(i.e., pools that contain no standing water at the time of assessment) do not count.
Figure 5. Examples of estimating surface and subsurface flow. Black lines represent the channel banks and the blue represents surface water in the channels. In the example on the right, subsurface flow is described because flow resurfaces downstream of the dry portion of the reach. Figure adapted from Nadeau (2015).
Site sketch On the data sheet, sketch the assessment reach, indicating important features, such as access points,
important geomorphological features, the extent of dry or aquatic habitats, riffles, pools, etc. Note
locations where photos are taken and where channel measurements are made.
How to measure indicators of streamflow duration Assessments are based on the measurement of five indicators of streamflow duration:
1. How many hydrophytic plant species (up to five) are growing in the channel, or within one half-
channel width of the channel?
2. How many aquatic macroinvertebrates are found?
Section 3: Data collection
19
3. Is there evidence of aquatic stages of Ephemeroptera, Plecoptera, or Trichoptera (EPT) taxa?
4. Are algae found on the streambed?
5. Are single indicators (i.e., the presence of fish or > 10% algal cover) of intermittent or perennial
streamflow duration observed?
The presence of these indicators is associated with longer duration of flow, and absence is associated
with shorter, more ephemeral flows. The classification is determined by comparing measured indicators
to the values shown in Table 1. For the beta SDAM AW, all five indicators should be measured and
recorded during every assessment.
These indicators are based on what is observed at the time of assessment, not on what would be
predicted to occur if the channel were wet, or in the absence of disturbances or modifications.
Disturbances and modifications (e.g., vegetation management, channel hardening, diversions) should be
described in the “Notes” section of the datasheet and are taken into account when drawing conclusions.
Under each indicator, some common ways that disturbances can interfere with indicator measurement
are described.
1. How many hydrophytic plant species (up to five) are growing in the channel, or within
one half-channel width of the channel? The SDAM AW relies on the detection of hydrophytic vegetation growing within the channel and/or
riparian zone (up to a half-channel width outside the channel). For the SDAM AW, hydrophytes are
defined as those with a FACW or OBL wetland indicator status in the National Wetland Plant List (NWPL,
USACE 2018). The NWPL, formerly called the National List of Plant Species that Occur in Wetlands, was
revised by the USACE, U.S. Fish and Wildlife Service, USEPA, and the Natural Resource Conservation
Service in 2013, biannually since, and is available at: http://wetland-plants.usace.army.mil/. The Arid
West has a regional plant list, which differs in some respects from adjacent regions. For example, red
alders (Alnus rubra) are FACW in the Arid West, and FAC in the Western Mountains, whereas California
sycamores (Platanus racemosa) show the opposite pattern. Therefore, make sure to consult the correct
list when determining indicator status.
Identify up to five hydrophytic plant species growing within the channel or up to one half-channel width
from the channel. Hydrophytes growing at greater distances from the channel are likely supported by
local water sources not closely related to streamflow. The method requires that up to five species be
identified to provide redundancy (as opposed to three) and minimize the impacts of misidentifying non-
hydrophytes as hydrophytes.
In general, it is recommended to focus on the most dominant species in the reach, but focusing on
species where confidence in identification is highest is acceptable. Take photos of each plant species,
focusing on diagnostic features and photos that illustrate the abundance and environmental context
where the species grows.
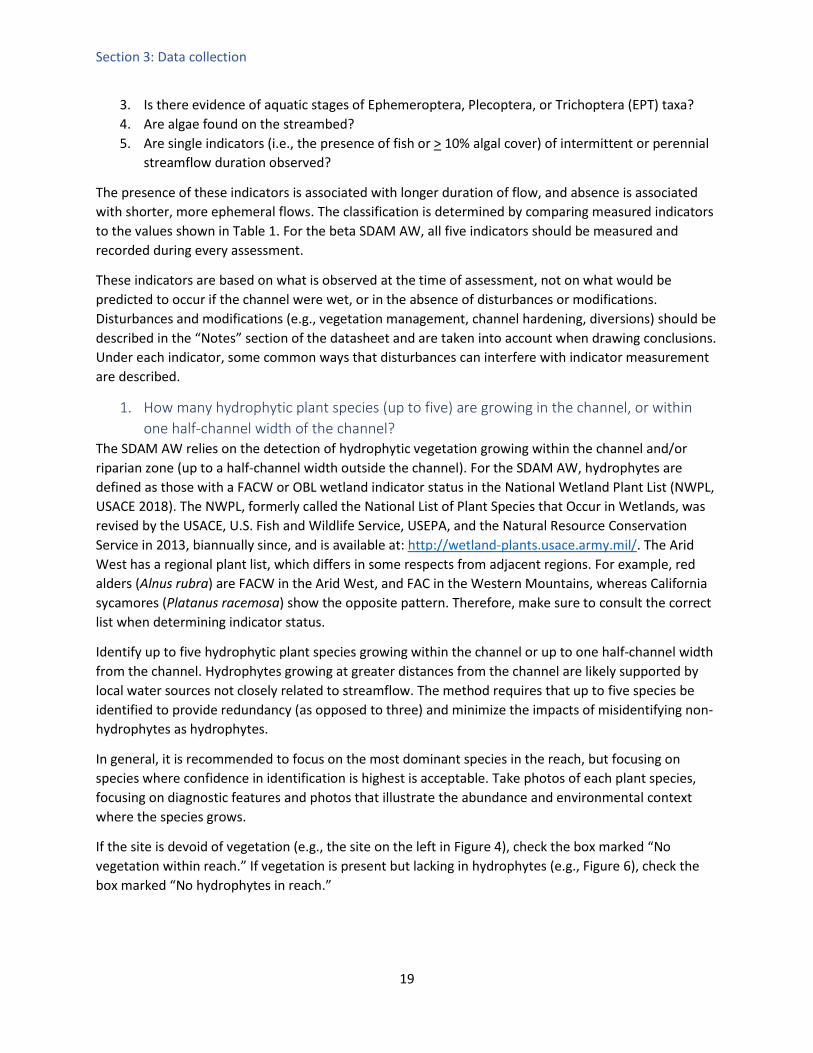
If the site is devoid of vegetation (e.g., the site on the left in Figure 4), check the box marked “No
vegetation within reach.” If vegetation is present but lacking in hydrophytes (e.g., Figure 6), check the
box marked “No hydrophytes in reach.”
Section 3: Data collection
20
Figure 6. Example of an ephemeral stream lacking hydrophytic vegetation. The riparian zone in this Arizona stream is dominated by mesquite, ironwood, and other upland plant species. Photo credit: Raphael Mazor.
Unusual or odd distributions
Note if the plant exhibits an odd or unusual pattern in its distribution that may affect its interpretation
for streamflow duration assessment. Examples include:
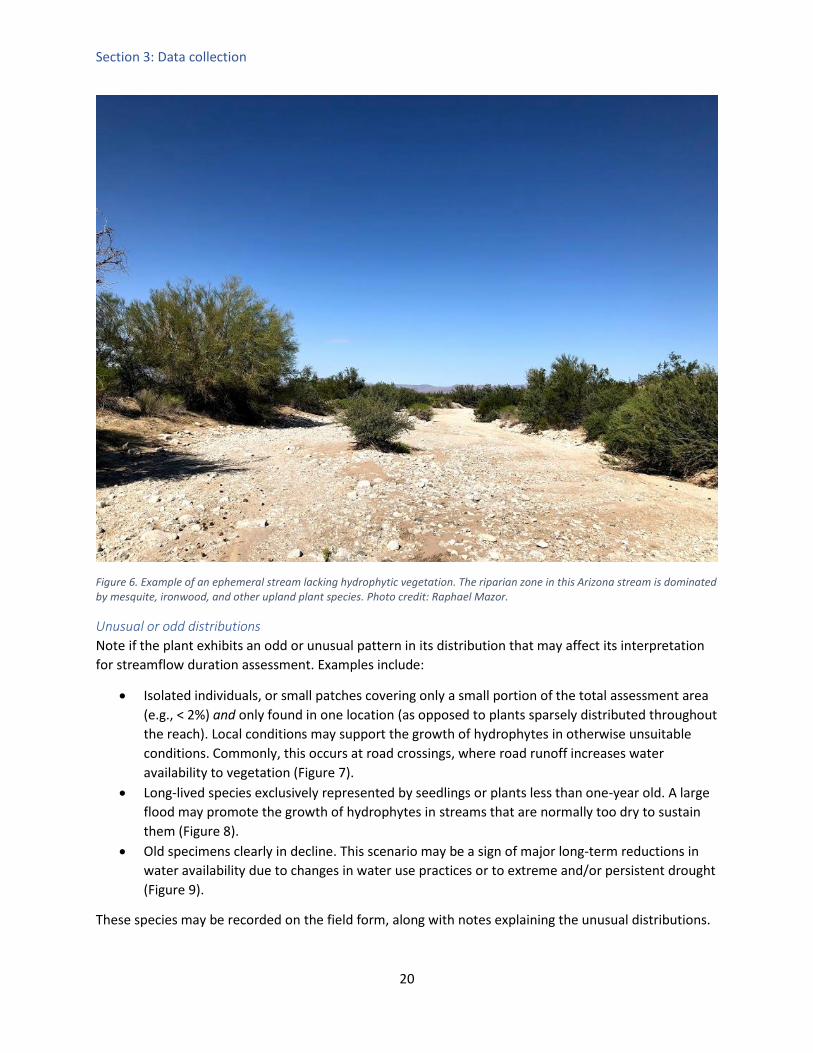
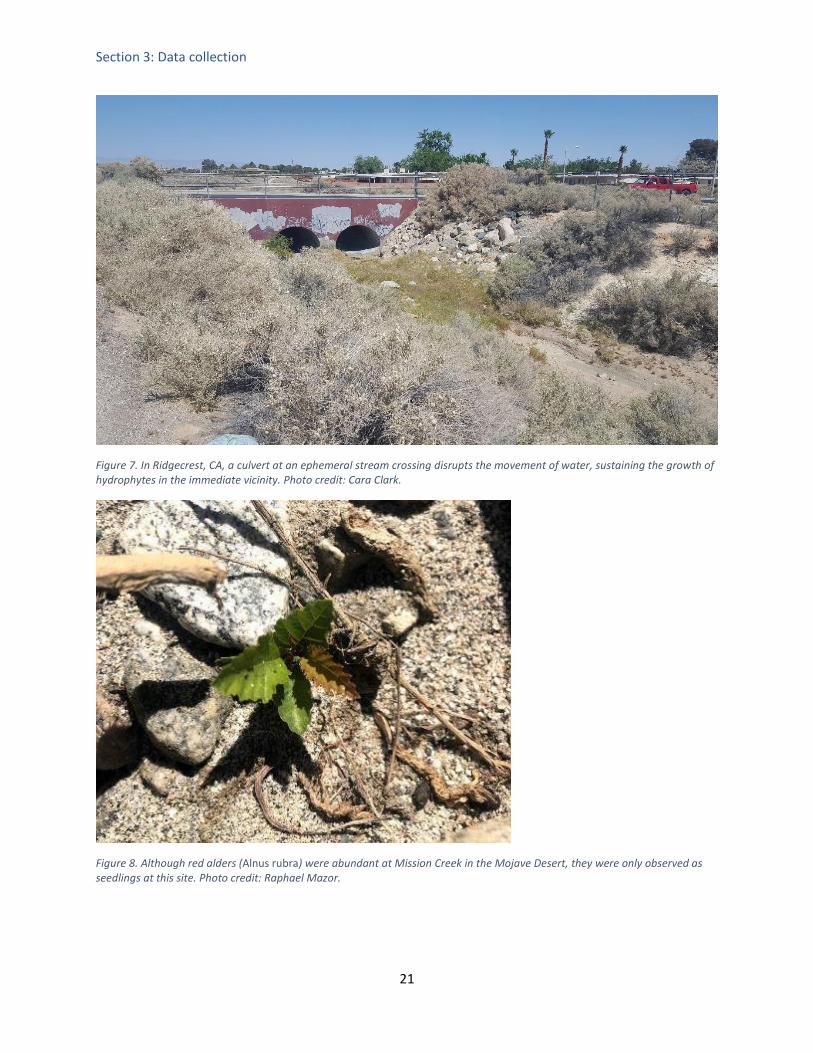
• Isolated individuals, or small patches covering only a small portion of the total assessment area
(e.g., < 2%) and only found in one location (as opposed to plants sparsely distributed throughout
the reach). Local conditions may support the growth of hydrophytes in otherwise unsuitable
conditions. Commonly, this occurs at road crossings, where road runoff increases water
availability to vegetation (Figure 7).
• Long-lived species exclusively represented by seedlings or plants less than one-year old. A large
flood may promote the growth of hydrophytes in streams that are normally too dry to sustain
them (Figure 8).
• Old specimens clearly in decline. This scenario may be a sign of major long-term reductions in
water availability due to changes in water use practices or to extreme and/or persistent drought
(Figure 9).
These species may be recorded on the field form, along with notes explaining the unusual distributions.
Section 3: Data collection
21
Figure 7. In Ridgecrest, CA, a culvert at an ephemeral stream crossing disrupts the movement of water, sustaining the growth of hydrophytes in the immediate vicinity. Photo credit: Cara Clark.
Figure 8. Although red alders (Alnus rubra) were abundant at Mission Creek in the Mojave Desert, they were only observed as seedlings at this site. Photo credit: Raphael Mazor.
Section 3: Data collection
22
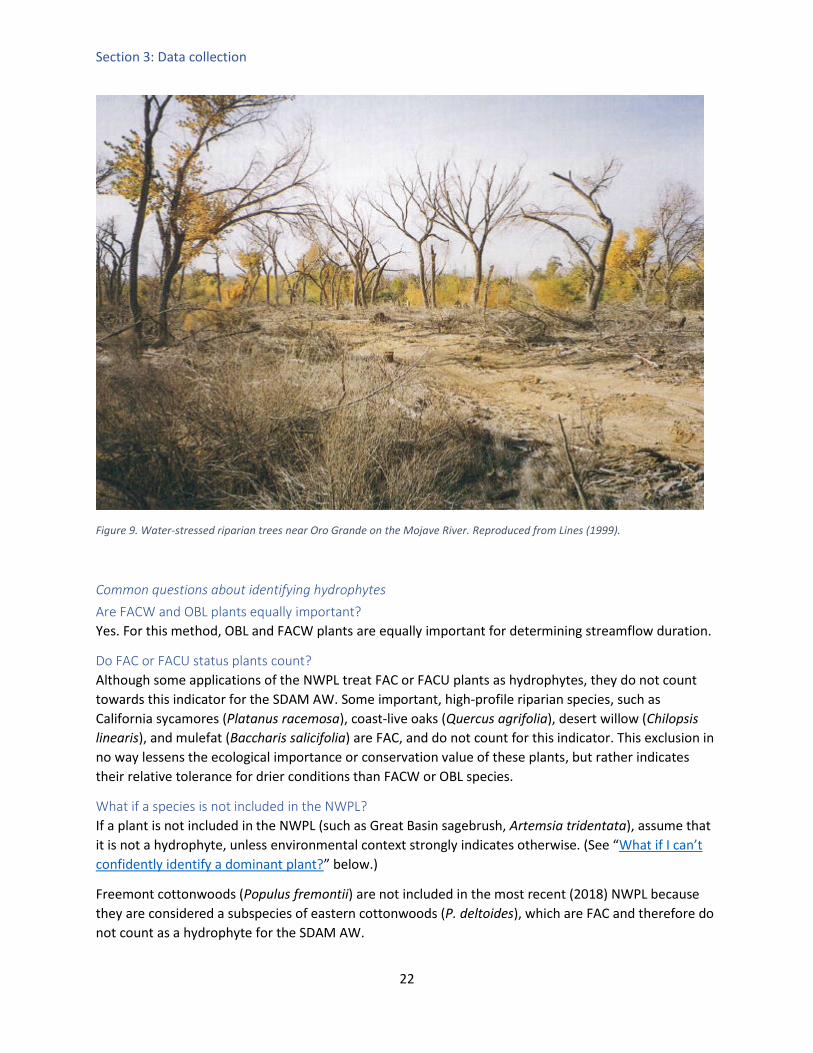
Figure 9. Water-stressed riparian trees near Oro Grande on the Mojave River. Reproduced from Lines (1999).
Common questions about identifying hydrophytes
Are FACW and OBL plants equally important?
Yes. For this method, OBL and FACW plants are equally important for determining streamflow duration.
Do FAC or FACU status plants count?
Although some applications of the NWPL treat FAC or FACU plants as hydrophytes, they do not count
towards this indicator for the SDAM AW. Some important, high-profile riparian species, such as
California sycamores (Platanus racemosa), coast-live oaks (Quercus agrifolia), desert willow (Chilopsis
linearis), and mulefat (Baccharis salicifolia) are FAC, and do not count for this indicator. This exclusion in
no way lessens the ecological importance or conservation value of these plants, but rather indicates
their relative tolerance for drier conditions than FACW or OBL species.
What if a species is not included in the NWPL?
If a plant is not included in the NWPL (such as Great Basin sagebrush, Artemsia tridentata), assume that
it is not a hydrophyte, unless environmental context strongly indicates otherwise. (See “What if I can’t
confidently identify a dominant plant?” below.)
Freemont cottonwoods (Populus fremontii) are not included in the most recent (2018) NWPL because
they are considered a subspecies of eastern cottonwoods (P. deltoides), which are FAC and therefore do
not count as a hydrophyte for the SDAM AW.

Section 3: Data collection
23
Are genus-level identifications okay?
It depends on the genus. Consult the NWPL. Some genera contain high levels of diversity (e.g., Carex),
while others are dominated by wetland species (e.g., Typha). Across most of the Arid West, nearly all
willow (Salix) species are hydrophytes (with a few exceptions), so genus-level identifications of willows
are usually acceptable. Post-sampling confirmation based on photos or collected specimens is
recommended.
What if I can’t confidently identify a dominant plant?
It may be acceptable to use environmental context and cues to determine that a plant is a hydrophyte,
even if taxonomic identifications cannot be made. Examples include submerged or emergent
macrophytes, or plants observed to grow exclusively in saturated soil and absent from adjacent uplands
(Figure 10). Post-sampling confirmation based on photos or collected specimens is strongly
recommended. Photo documentation should convey this context. Photo confirmation is particularly
important if the only hydrophyte observed in an assessment cannot be identified on-site.
Figure 10. Examples of plants determined to be hydrophytes based on context. Left: An emergent macrophyte growing within the channel. Right: Sedges and rushes growing exclusively in saturated and absent from adjacent uplands. Photo credits: Raphael Mazor.
2. How many aquatic macroinvertebrate individuals are found? Aquatic invertebrates require the presence of water (and in many cases flowing water) for their growth
and development for at least part of their life cycle. A wide range of taxonomic groups are considered
aquatic invertebrates, including insects (e.g., mayflies, stoneflies, caddisflies, hellgrammites, midges),
amphipods, isopods, annelids (worms and leeches), mollusks (e.g., bivalves, gastropods), and crayfish.

Section 3: Data collection
24
Only invertebrates that can be seen without magnification (i.e., macroinvertebrates) are counted as part
of this indicator.
Such invertebrates are good indicators of streamflow duration because they require aquatic habitat to
complete specific life stages. For example, several mollusk species cannot survive extended periods
outside of water, in contrast to some stonefly or alderfly larvae that resist desiccation in some seasons
of the year by burrowing into the hyporheic zone. Some invertebrates can survive short periods of
drying in damp soils below the surface in egg or larval stages that are resistant to drying. Others are
quick to colonize temporary water and complete the aquatic portion of their life cycle during the
wettest part of the year when sustained flows are most likely.
Invertebrates are assessed within the defined reach using a single search. Aquatic invertebrate
indicators do not differentiate between live organisms and non-living material such as shells, casings,
and exuviae (i.e., the shed skins of larvae and nymphs left behind as they emerge as winged adults). In
other words, mussel shells are treated the same as live mussels, and empty caddisfly cases are treated
the same as cases with living caddisflies. Note if the distribution of the dead material suggests that it
may have been transported from outside the assessment reach. For example, shells found within wrack
lines may indicate transportation from upstream sources by a flood, and shells found within middens
(i.e., mounds of bones, shells, and other unconsumed food scraps) may indicate transportation from
other waterbodies by an animal.
Although they require aquatic habitats, mosquitos in larval or pupal form should not be counted. Their
rapid lifecycles make them unsuitable for use as indicators of streamflow duration.
A kick-net or D-frame net and a hand lens are required to collect and identify specimens. Begin sampling
at the most downstream point in the assessment reach and move upstream to each new sampling site.
Place the kick-net perpendicular against the streambed and stir the substrate upstream of the net for a
minimum of one minute. Jab the net under banks, overhanging terrestrial and aquatic vegetation, leaf
packs, and in log jams or other woody material. Samples should be collected from at least six distinct
locations representing the different habitat areas found in the reach. Empty contents of the net into a
white tray with fresh water for counting and identification. Many individuals will appear the same until
seen against a contrasting color background, and some bivalves and other invertebrates can be pea-
sized or smaller
Searching is complete when:
• At least six different locations within the reach have been sampled across the range of habitat
types and a minimum of 15 minutes of effort expended (not including specimen identification
time), or;
• All available habitat in the assessment reach has been completely searched in less than 15
minutes. A search in dry stream channels with little bed or bank development and low habitat
diversity may be completed in less than 15 minutes.
During the 15-minute sampling period, search the full range of habitats present, including: water under
overhanging banks or roots, in pools and riffles, accumulations of leaf packs, woody debris, and the
coarse inorganic particles (pick up rocks and loose gravel). To find mollusks, one should examine hard
substrates, such as sticks and rocks for mussels, clams and snails, silty areas of the stream bed for clams,

Section 3: Data collection
25
and aquatic plants for snails. Empty clam shells can be found washed up on banks and bars and in coarse
sand or gravel deposits.
Dry channels: Assessors should first walk the reach to ascertain whether it is completely dry or if areas of
standing water are present. Focus the search on areas serving as refuge such as any remaining pools or
areas of moist substrate for living macroinvertebrates, the sandy channel margins for mussel and
aquatic snail shells, and under cobbles and other larger bed materials for caddisfly casings. Exuviae of
emergent mayflies or stoneflies may be observed on dry cobbles or stream-side vegetation (Figure 11).
In summary, sampling methodology consistent with the Xerces Society’s recommendations on using
aquatic macroinvertebrates as indicators of streamflow duration (Mazzacano and Black 2008) is
recommended.
If a reach contains both dry and wet areas, focus on searching the wet habitats, as these are the most
likely places to encounter aquatic invertebrates. However, do not ignore dry areas.
When searching dry channels (or dry portions of partially wet channels), be sure to avoid counting
terrestrial invertebrates in the streambed (Figure 12). Some insect families, such as crane flies (Diptera:
Tipulidae), include both aquatic and terrestrial species. If you are unsure whether the invertebrates you
encounter are aquatic or terrestrial, collecting a specimen and identifying it in a lab setting or consulting
an entomologist is recommended.

Section 3: Data collection
26
Figure 11. Examples of aquatic invertebrates found in dry streambeds. Top left: Some species of dobsonfly (Megaloptera: Corydalidae) construct chambers in the moist substrate of dry streambeds. Top right: Stonefly (Plecoptera) exuvia. Exuviae are left behind when aquatic nymphs or pupae emerge from the stream and go through a final molt to metamorphose to winged adults. Bottom left: Caddisfly cases may persist under large cobbles or boulders well after the cessation of flow. Bottom right: Snail shells (especially in the Hydrobiidae and Physidae families) are among the most frequently encountered aquatic invertebrates in dry streambeds, but care should be taken to avoid mistakenly counting terrestrial snails as aquatic snails (e.g., Figure 12). Photo credits: Michael Bogan (top left) and Raphael Mazor (other photos).
Figure 12. The larvae of terrestrial soldier flies (Stratiomyidae, left), and terrestrial garden snails (Cornu aspersum) may be found in dry stream channels. Care should be taken to avoid mistaking terrestrial invertebrates for aquatic invertebrates with similar appearances. Photo credits (Raphael Mazor).
Count the number of live or dead individual aquatic invertebrate individuals (any species) found during
the search, and indicate the total abundance on the data sheet in one of these three categories:
• None detected
• 1 to 19 individuals
• 20 or more individuals
Section 3: Data collection
27
3. Is there evidence of aquatic stages of Ephemeroptera, Plecoptera, or Trichoptera (EPT)
taxa? Mayflies, stoneflies, and caddisflies (sometimes called “EPT” taxa, after their orders: Ephemeroptera,
Plecoptera, and Trichoptera) are widespread insects in perennial and intermittent streams but are not
typically found in ephemeral streams. Indicate on the field form if any mayflies, stoneflies, or caddisflies
are encountered in the reach among the individuals collected in assessing indicator #2 (i.e., number of
aquatic macroinvertebrates). They may be present in any number (only their presence or absence
matters). Living material (e.g., live larvae or pupae), and non-living material (e.g., caddis cases, shed
exuviae) are equally considered for this indicator. Images highlighting diagnostic features are shown in
the call-out box, and photos are included in Appendix B.
A series of photos should be taken of any species in question to allow further identification to be made
off-site, if necessary. If the identification is uncertain, then describe any distinguishing features that
were observed in the notes. Alternatively, you may collect specimens in 70% ethanol and confirm
identities in a lab setting with an appropriate key or identification guide (e.g., Merritt et al. 2019) or
consult an entomologist. Collection of aquatic invertebrates may require permits in certain states (e.g.,
California).

Section 3: Data collection
28
Identification of mayflies, stoneflies, and caddisflies
Mayflies (Ephemeroptera) Mayfly nymphs may be readily identified by the presence of plate- or feather-like gills along sides or top of the abdomen. They typically have three cerci (“tails”), although in some species, they appear to have two. They have only one claw at the end of each foot, in contrast to stoneflies (which have two). They lack a pupal phase, but their exuviae may be abundant on streamside vegetation and emergent boulders at certain times of the year.
Stoneflies (Plecoptera) Stonefly nymphs have gills along the thorax, and two claws at the end of each leg. They have two cerci, whereas mayflies usually have three. Like mayflies, stoneflies lack a pupal stage and instead metamorphose directly into winged adults, and their exuviae can be found alongside dry or flowing streams. Caddisflies (Trichoptera)
Caddisfly larvae typically have a C-shaped body ending in two hooks. Thread-like gills may be found along the underside of the abdomen, and three pairs of legs under the thorax (setting them apart from some fly larvae, that may otherwise look similar). The top of thorax may be partly or fully hardened (“sclerotized”). Caddisfly larvae and pupae are aquatic, and they are often found with cases made of sand, pebbles, twigs, leaves, or small snail shells. Most larvae are free roaming, but a few families build larval retreats in fixed locations under cobbles and boulders. One family (Rhyacophilidae) lacks a case or larval retreat, although it builds pupal cases out of pebbles and fine-grained sand. Caddis larval and pupal cases are often the most easily observed sign of aquatic invertebrates in a dry stream.
cerci
Image by Tracey Saxby
Image by Dieter Tracey
gills
cerci
Image by Tracey Saxby
gills
Thoracic sclerites

Section 3: Data collection
29
4. Are algae found on the streambed? Visually estimate the extent of algal cover on the streambed (from the toe of one bank to the toe of the
other) over the entire assessment reach. Algal cover is based on the entirety of the streambed and is not
restricted to the wetted channel. In braided systems, estimate algae cover as a percent of the
streambed of entire active channel.
Algae are visible as a pigmented mass or film, or sometimes hair-like growths on submerged surfaces of
rocks, logs, plants, and any other structures within the channel, and may form mats that cover portions
of the streambed. Microscopic algae associated with biofilm can be felt as a slippery film on substrates,
but growth must be extensive enough to be visible to the naked eye to be counted. Periphyton growth is
influenced by chemical disturbances such as increased nutrient (nitrogen or phosphorus) inputs and
physical disturbances such as increased sunlight to the stream from riparian zone disturbances. All
macroscopic algal forms (filamentous algae, mats, periphyton, macroalgal clumps, or microalgae
growing as a visible biofilm or mat) count, whether living, dead, or dying. Estimates should fall into one
of the following categories:
• Not detected
• ≤ 10% cover
• > 10% cover
Figure 13 shows photos of low (< 2%) and high (> 10%) algae cover in a streambed, and Figure 14 shows diagrams that can assist with visual estimates of algae cover.
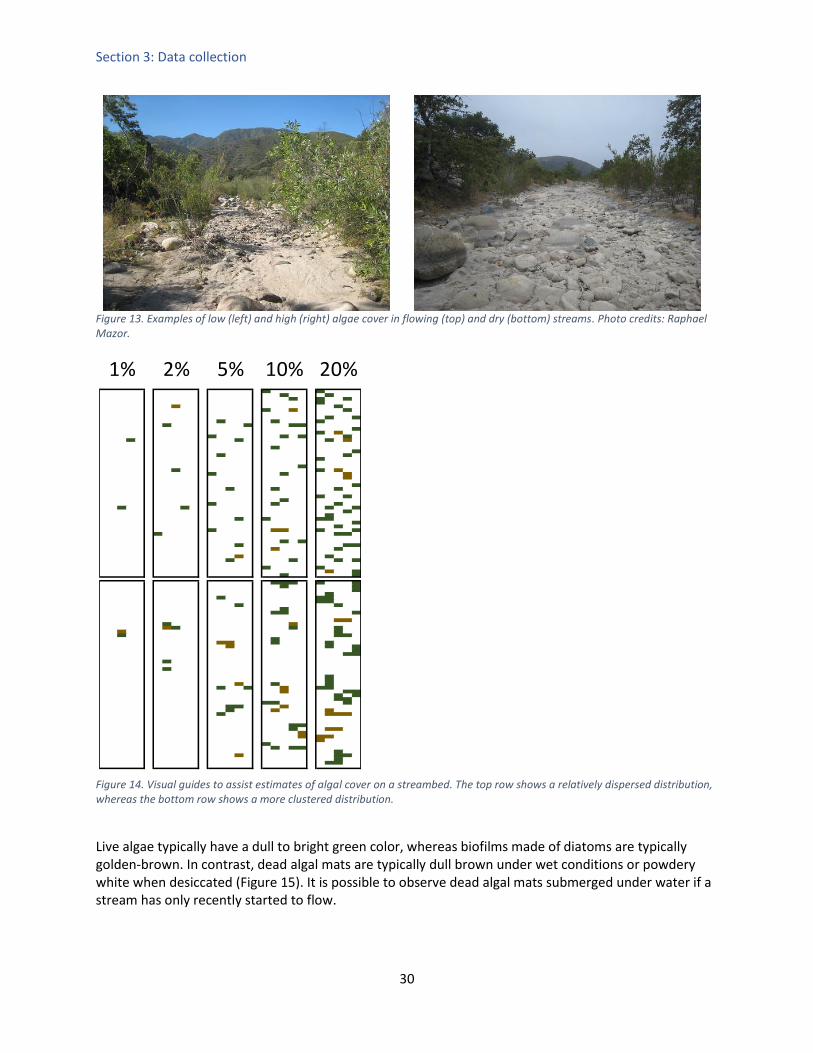
Section 3: Data collection
30
Figure 13. Examples of low (left) and high (right) algae cover in flowing (top) and dry (bottom) streams. Photo credits: Raphael Mazor.
Figure 14. Visual guides to assist estimates of algal cover on a streambed. The top row shows a relatively dispersed distribution, whereas the bottom row shows a more clustered distribution.
Live algae typically have a dull to bright green color, whereas biofilms made of diatoms are typically golden-brown. In contrast, dead algal mats are typically dull brown under wet conditions or powdery white when desiccated (Figure 15). It is possible to observe dead algal mats submerged under water if a stream has only recently started to flow.
1% 2% 5% 10% 20%
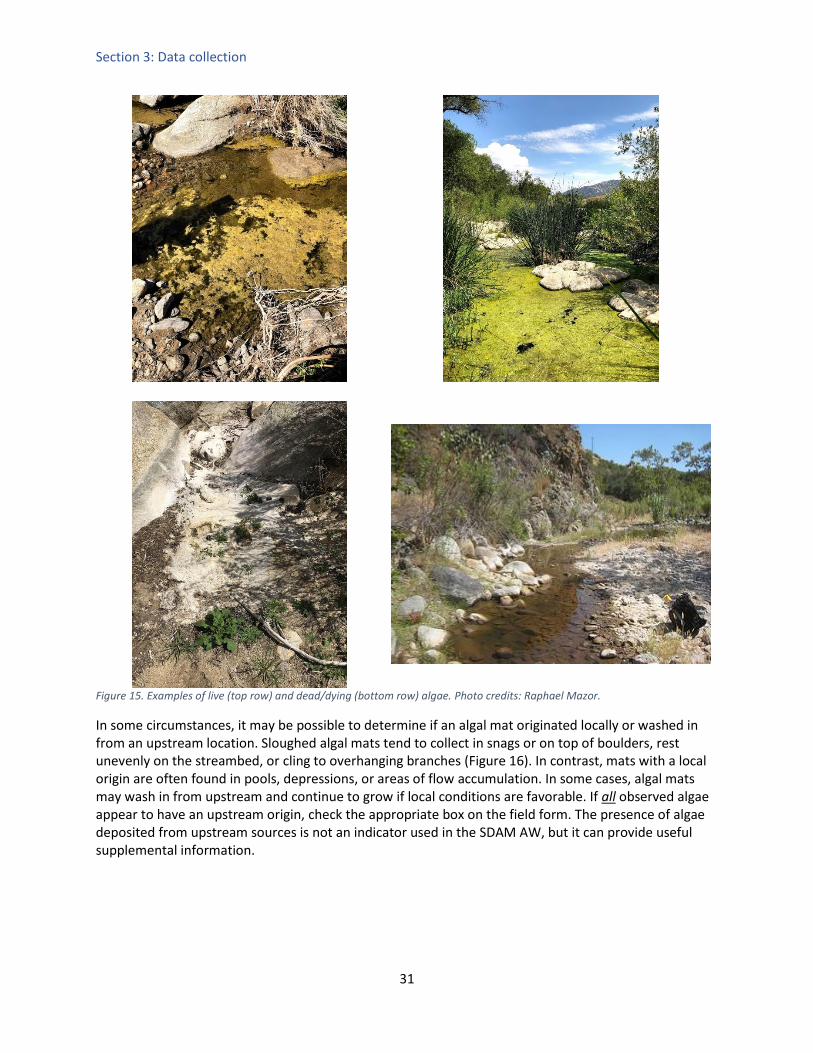
Section 3: Data collection
31
Figure 15. Examples of live (top row) and dead/dying (bottom row) algae. Photo credits: Raphael Mazor.
In some circumstances, it may be possible to determine if an algal mat originated locally or washed in from an upstream location. Sloughed algal mats tend to collect in snags or on top of boulders, rest unevenly on the streambed, or cling to overhanging branches (Figure 16). In contrast, mats with a local origin are often found in pools, depressions, or areas of flow accumulation. In some cases, algal mats may wash in from upstream and continue to grow if local conditions are favorable. If all observed algae appear to have an upstream origin, check the appropriate box on the field form. The presence of algae deposited from upstream sources is not an indicator used in the SDAM AW, but it can provide useful supplemental information.

Section 3: Data collection
32
Figure 16. The greenish algal mat shows signs of recent deposition from an upstream source: note the way that it is bunched up around the boulder in the foreground. However, there are several signs that this mat has regrown since depositing closer to the top of the photo. The white remains of an older mat show additional evidence of local growth. Photo credit: Raphael Mazor.
5. Are single indicators of intermittent or perennial streamflow duration observed? Two indicators may be used in the SDAM AW as single lines of evidence to classify a stream as at least
intermittent (these indicators are not present in ephemeral streams, but their absence is not necessarily
indicative of a stream being ephemeral). Although some protocols (e.g., NMED 2011, Nadeau 2015)
consider single indicators sufficient evidence to make a streamflow duration determination (and thus
field data collection may end once they are observed), completing data collection for the beta method
whether or not single indicators are observed is recommended.
i. Are there any fish within the reach (aside from mosquitofish)?
Fish are rarely found in ephemeral streams, and their presence is a strong sign that a stream is
intermittent or perennial. Record the presence of any live fish observed. If the only fish present are non-
native mosquitofish (Gambusia sp., typically G. affinis, Figure 17), record their presence, but do not
treat them as a single indicator of intermittent or perennial flow. Mosquitofish are widely stocked in
waterbodies, including ephemeral streams, as a method of vector control. Native species of Gambusia
should be counted the same as other species of fish; desktop reconnaissance can determine if native
species of Gambusia occur in the project area. Most native Gambusia are found in small ranges within
New Mexico and Texas:
• G. nobilis: Pecos River drainage, NM & TX

Section 3: Data collection
33
• G. senilis: Devil’s River (Rio Grande drainage), TX
• G. speciosa: Devil’s River (Rio Grande drainage), TX
• G. gaigei: Spring-fed pond in Big Bend National Park, TX
• G. geiseri: San Marcos & Guadalupe River drainages, TX
• G. heterochir: Spring in Clear Creek (San Saba River drainage), TX
• G. krumholtzi: Lower Rio Grande drainage, TX
• G. georgei (presumed extinct): San Marcos Spring and River, TX
• G. amistadensis (presumed extinct): Goodenough Spring (Rio Grande drainage), TX
• G. clarkhubbsi: San Felipe Creek (Rio Grande drainage), TX
All available habitats should be observed when looking for fish, including pools, riffles, root clumps, and
other obstructions (to greatly reduce surface glare, the use of polarized sunglasses is recommended).
Fish may be found in the hyporheic zone in dry reaches of intermittent rivers. In small streams, the
majority of fish species usually inhabit pools and runs. Fish will seek cover once alerted to your
presence, so be sure to look for them slightly ahead of where you are walking during your initial walk
along the reach. Check several areas along the assessment reach, especially below undercut banks or
overhanging vegetation. Dead fish do not count as a single indicator, but may be noted on the field
forms.
In the Arid West, fish may disperse through ephemeral reaches during extreme high flow events
associated with large storms. Thus, this indicator may not be easily interpreted immediately after a
storm.
Figure 17. Western mosquitofish (Gambusia affinis). This species is native to Gulf Slope drainages, including small portions of the Arid West. However, it has been widely introduced into waterbodies throughout the West as a method of vector control, and it should not be used as a single indicator of intermittent or perennial streamflow. Photo credit: Robert McDowell, US Geological Survey.

Section 3: Data collection
34
ii. Do algae cover more than 10% of the streambed?
Although algae may grow sparsely in ephemeral streams, heavy algal growth is usually a sign of longer-
duration flows, particularly in dry streambeds where few other indicators may be evident. This indicator
is also measured as part of this SDAM. Take extra care to ensure that the distribution of algae in the
streambed is consistent with local growth, not deposition from upstream sources; deposition of algal
mats in ephemeral streams is possible where they are closely connected to upstream perennial sources.
Supplemental information Although not required for flow duration classification, additional flow duration measures may be observed during the SDAM assessment. These observations should be noted to provide additional contextual information in support of a streamflow duration classification. It is recommended that supplemental measures be documented at all sites where streamflow duration is assessed, and evaluated to determine if they corroborate the SDAM AW classification or provide more clarity to Need more information classifications (as described below).
Aquatic or semi-aquatic amphibians and reptiles Like fish, aquatic or semi-aquatic amphibians, snakes, and turtles are rarely found in ephemeral streams; if any are encountered during the assessment, their presence should be recorded. Certain frogs and salamanders inhabit the shallow, slow-moving waters of stream pools and near the sides of banks. Note if any adult frogs are seen or vocalizations are heard, even if no frogs are visually observed. Many aquatic vertebrate species are protected by state and federal law, and therefore should not be collected for streamflow duration assessment. Instead, identifications should be made on-site, without disturbing the organisms. It is recommended that a series of photos be taken of any species in question to allow further identification to be made off-site, if necessary. If unable to closely observe and/or photo any vertebrate species and the identification is uncertain, then describe any distinguishing features that were observed in the notes. As with fish, dead specimens may be noted on the field forms.
Amphibians
Amphibians are typically associated with aquatic habitats, and some amphibians require aquatic habitat
for much or all their lives (
Table 3). Aquatic life stages include eggs and tadpoles or larvae of many amphibian species; adults of
several species are aquatic or semi-aquatic as well, and their presence should also be noted (Figure 18).
Aquatic salamanders in the Arid West include the genera Rhyacotriton (torrent salamanders), Taricha (Pacific newts), and Dicamptodon (giant salamanders). The genus Rhyacotriton is aquatic throughout most of its life, whereas the latter two taxa may have terrestrial adult phases that return to the water to breed. Ambystoma (mole salamanders) is another western genus with fully aquatic life stages, but this group is rarely found in flowing water. All other salamander species found in the Arid West are primarily terrestrial and are only found in California and a small portion of New Mexico. Many frog and toad species lay eggs in the water and have aquatic tadpole, metamorph, and juvenile stages. Although several of these species have terrestrial adults that only return to the water to breed, some species (such as bullfrogs, Lithobates catesbeianus¸ and red-legged frogs, Rana draytonii) remain primarily aquatic as adults. An introduced species, the African clawed frog (Xenopus laevis) has an exclusively aquatic life cycle.

Section 3: Data collection
35
Figure 18. A tadpole of a Great Basin spadefoot toad (Spea intermontana, top left), a California tree frog (Pseudacris cadaverina, top right), and a California newt (Taricha torosa bottom). Photo credits: Robert Leidy (top left), Raphael Mazor (top right) and Alex Heyman (bottom).
Snakes
In the western U.S., most species of garter snakes (Thamnophis spp.) are semi-aquatic (Figure 19). The northwestern garter snake (T. ordinoides) is an exception, being found primarily in terrestrial habitats. Water snakes (Nerodia spp.) are found in the eastern part of the Arid West region. Note that several non-aquatic snakes (such as king snakes, gopher snakes, and rattle snakes) may congregate near streams and even bathe in the water during hot weather. Snakes often disperse through ephemeral and intermittent stream channels, and along the riparian corridors of streams of all flow duration classes.

Section 3: Data collection
36
Figure 19. A two-striped garter snake (Thamnophis hammondii) in a perennial stream in California. Photo credit: Raphael Mazor.
Turtles
A large number of aquatic turtles have been introduced to ponds and other lentic habitats throughout
the West, but only a few are found in flowing habits. These include the western pond turtles (Actinemys
spp., Figure 20), mud turtles (Kinosternon spp.), and softshell turtles (Apalone spp.). Mud turtles are
known to disperse within dry ephemeral stream channels to search for persistent pools.
Figure 20. A juvenile (left) and adult (right) southwestern pond turtle (Actinemys pallida) from California. Photo credit: Robert Leidy.

Section 3: Data collection
37
Table 3. Aquatic and semi-aquatic amphibians, snakes, and turtles in the Arid West. A: Life stage is fully aquatic. S: Life stage is semi-aquatic. Blank cells indicate that the life stage is terrestrial.
Life stages
Species Common name Eggs and Larvae/
Tadpoles Juveniles Adults
Salamanders and Newts
Ambystoma spp. Wide-mouthed salamanders
A S S
Dicamptodon spp. Giant salamanders A A S
Rhyacotriton spp. Torrent salamanders A A A
Taricha spp. Pacific newts A S S
Frogs and Toad
Acris spp. Cricket frogs A S S
Anaxyrus (Bufo) spp. Toads A S S
Ascaphus truei Coastal tailed frog A A A
Gastrophryne olivaceae Great Plains narrow-mouthed toad
A S S
Lithobates spp. Leopard frogs and bullfrogs
A S S
Pseudacris spp. Tree frogs A S S
Rana sp. True frogs A S S
Scaphiophus spp. Spadefoot toads A S S
Spea spp. Spadefoot toads A S S
Xenopus laevis African clawed frog A A A
Snakes
Nerodia spp. Water snakes S S
Thamnophis spp. (except T. ordinoides) Gartersnakes S S
Turtles
Actinemys spp. Western pond turtles S S
Apalone spp. Softshell turtles A A
Kinotsernon spp. Mud turtles A A
Aquatic invertebrates that prefer perennial streams Although this protocol does not require the identification of aquatic invertebrates beyond the Order
level, it may be possible to identify some taxa in the field with a preference for perennial (or long-
duration intermittent) flows. Blackburn and Mazzacano (2012) identified 18 families of aquatic
invertebrates (Table 4) as indicators of perennial flow in the Pacific Northwest. These families are used
in the SDAM PNW (Nadeau 2015) to discriminate between intermittent and perennial stream reaches,
and their presence in Arid West streams may indicate that a reach has long duration streamflow.
Table 4. Perennial indicator taxa identified by Blackburn and Mazzacano (2012) for use in SDAM for the Pacific Northwest (Nadeau 2015). Asterisks (*) indicate taxa that are known to occur with some regularity in intermittent streams in the Arid West. Double asterisk (**): Corydalidae in the Protochauliodes-Neohermes group include taxa specialized for life in intermittent
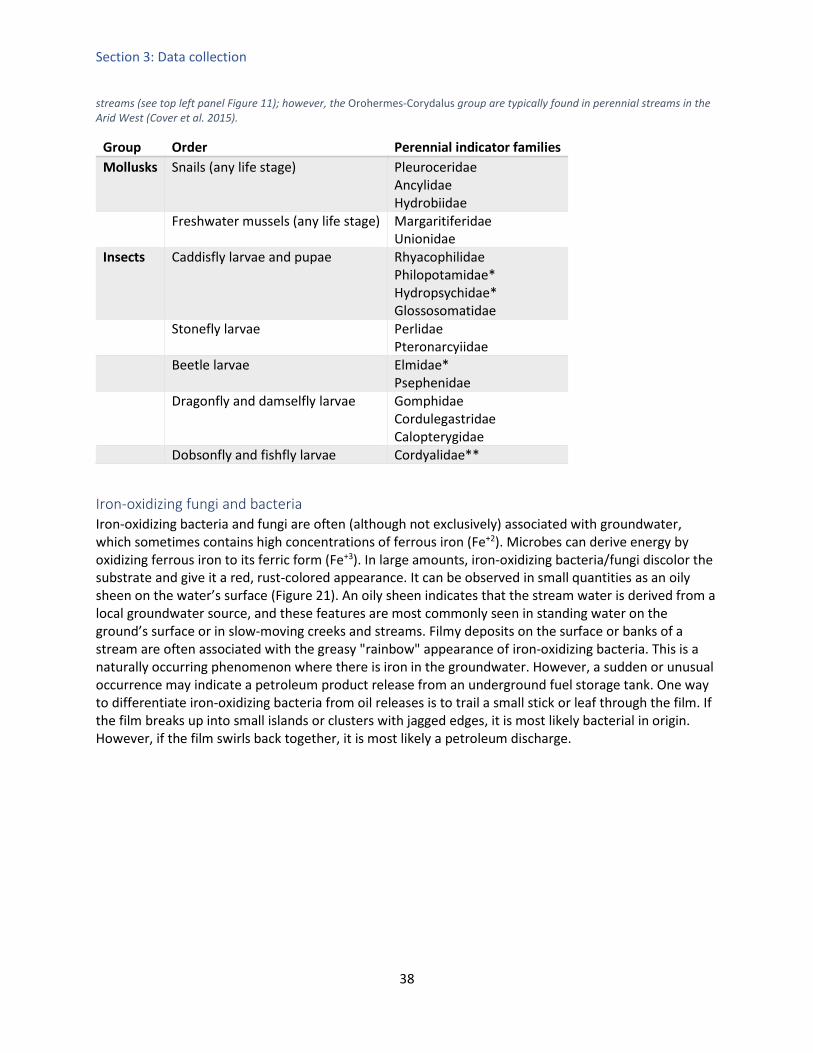
Section 3: Data collection
38
streams (see top left panel Figure 11); however, the Orohermes-Corydalus group are typically found in perennial streams in the Arid West (Cover et al. 2015).
Group Order Perennial indicator families
Mollusks Snails (any life stage) Pleuroceridae Ancylidae Hydrobiidae
Freshwater mussels (any life stage) Margaritiferidae Unionidae
Insects Caddisfly larvae and pupae Rhyacophilidae Philopotamidae* Hydropsychidae* Glossosomatidae
Stonefly larvae Perlidae Pteronarcyiidae
Beetle larvae Elmidae* Psephenidae
Dragonfly and damselfly larvae Gomphidae Cordulegastridae Calopterygidae
Dobsonfly and fishfly larvae Cordyalidae**
Iron-oxidizing fungi and bacteria Iron-oxidizing bacteria and fungi are often (although not exclusively) associated with groundwater, which sometimes contains high concentrations of ferrous iron (Fe+2). Microbes can derive energy by oxidizing ferrous iron to its ferric form (Fe+3). In large amounts, iron-oxidizing bacteria/fungi discolor the substrate and give it a red, rust-colored appearance. It can be observed in small quantities as an oily sheen on the water’s surface (Figure 21). An oily sheen indicates that the stream water is derived from a local groundwater source, and these features are most commonly seen in standing water on the ground’s surface or in slow-moving creeks and streams. Filmy deposits on the surface or banks of a stream are often associated with the greasy "rainbow" appearance of iron-oxidizing bacteria. This is a naturally occurring phenomenon where there is iron in the groundwater. However, a sudden or unusual occurrence may indicate a petroleum product release from an underground fuel storage tank. One way to differentiate iron-oxidizing bacteria from oil releases is to trail a small stick or leaf through the film. If the film breaks up into small islands or clusters with jagged edges, it is most likely bacterial in origin. However, if the film swirls back together, it is most likely a petroleum discharge.

Section 3: Data collection
39
Figure 21. Oily sheen on water surface due to iron-oxidizing bacteria. Photo credit: Ken Fritz.
Additional notes and photos After recording all the indicators and supplemental information described above, provide any additional notes about the assessment, and include photos in the photo log.
Section 4: Data interpretation
40
Section 4: Data Interpretation Classifications are determined by evaluating questions at the top of the columns in Table 1, starting with
the first column on the left, and proceeding to the right. The measurement observed for each indicator
determines which row should be followed until you reach the appropriate classification. For example, if
three or more hydrophytes are observed, along with 20+ aquatic invertebrates (some of which are
mayflies), and algae were present, the stream would be classified as perennial. However, if only one or
two hydrophytes were observed, the site would be classified as intermittent. Blank cells indicate that a
particular indicator is not needed and that a classification has already been determined. For the beta
SDAM AW, all five indicators should be measured and recorded during every assessment.
In addition to using the classification table in Table 1, classifications may be obtained from the online
reporting tool described below.
Outcomes of SDAM classification Application of the SDAM can result in one of five possible classifications:
• Ephemeral
• Intermittent
• Perennial
• At least intermittent
• Needs more information
The first three streamflow duration classifications correspond to the three classes of streams used to
calibrate the SDAM (i.e., perennial, intermittent, or ephemeral streams). These outcomes occur when
the pattern of observed indicators closely matches patterns in the calibration data, and thus a
classification can be assigned with high confidence. For example, the absence of hydrophytes, aquatic
invertebrates, algae, and fish was consistent with 81% of ephemeral sites in the calibration data.
In some cases, the pattern of indicators was associated with multiple classes, and the Beta SDAM model
cannot assign a single classification with high confidence. However, the Beta SDAM model may be able
to rule out an ephemeral classification with high confidence. In this case, the outcome is At least
intermittent, meaning that there is a high likelihood that the stream is either perennial or intermittent.
In this circumstance, however, the two classes cannot be distinguished with confidence. In some cases,
this information is sufficient for management decisions, although additional investigations may be
warranted. This outcome was somewhat common in the SDAM development data set.
In other cases, the SDAM model may rule out a perennial classification but cannot distinguish between
ephemeral or intermittent classes with high confidence. In this case, the result is Need more
information. In general, this level of information is insufficient for management decisions. This outcome
was relatively rare in the SDAM development data set, typically occurring at sites that rarely exhibit
long-duration surface flows, but with groundwater tables close enough to the surface to sustain
hydrophytic vegetation. However, this outcome could also occur in truly perennial streams that are
managed to have no vegetation, experiencing severe disturbance, or sampled under conditions such
that few indicators are detected. Only two perennial streams in the development data set lacked

Section 4: Data interpretation
41
hydrophytes, and only one lacked aquatic invertebrates altogether (a concrete storm drain in Las Vegas,
Nevada).
In the example shown in Figure 22, a site was classified as Need more information. No hydrophytes,
aquatic invertebrates, or fish were observed, but sparse algae cover was noted. Further investigation of
field notes revealed that the crew likely mistook a decayed cow patty for a dead algal mat. After
correcting the data, the site was correctly classified as ephemeral.
In another example (Figure 23), a stream was classified as Need more information because only two
hydrophytic plants were observed (a willow and a rush), but no other indicators were detected.
Investigation of the stream gauge at this site shows that the stream is marginally intermittent and has
not experienced long-duration flows in recent years, suggesting that it may be transitioning to
ephemeral.
Figure 22. Placeritas Canyon, in Arizona. Initially, the site was classified as Need more information. Closer investigation of the field notes resulted in a reclassification of Ephemeral. Photo credit: Matt Robinson.

Section 4: Data interpretation
42
Figure 23. The Zuni River above Black Rock Reservoir, NM, a site classified as Need more information. A. A photo of the reach. A thicket of willows is visible in the background. Inset: Close up of narrow-leaved willow leaves (Salix exigua), one of two hydrophytic plant species observed at the reach. B. Discharge data from a nearby stream gauge (USGS 09386950). Photo credits: Matt Robinson and Emma Haines.
A
B

Section 4: Data interpretation
43
What to do if an SDAM application results in Need more information If the application of the SDAM results in Need more information, it usually means the classifications of
ephemeral and intermittent cannot be distinguished with confidence based on the described indicators.
It may help to examine other lines of evidence (such as the supplemental information included in the
protocol) or conduct additional evaluations.
Evaluate supplemental information collected during assessments The SDAM classification is based on just five indicators. Still, the protocol includes the collection of
supplemental information—specifically, the presence of aquatic life stages of amphibians or reptiles (
Table 3), aquatic invertebrates that prefer perennial streams (Table 4), and iron-oxidizing fungi or
bacteria (Figure 21). In general, the presence of any of these organisms may be considered evidence of
longer-duration flows.
Conduct additional evaluations at the same site Some indicators may be difficult to detect or interpret due to short-term disturbances, floods, severe
drought, or other conditions that affect the sampling event’s validity. A repeat application of the SDAM,
even a few weeks later when the affecting disturbances have cleared, may be sufficient to provide a
determination. Similarly, conducting an additional evaluation during a different season may improve the
ability to identify hydrophytic plants and aquatic invertebrates, leading to more conclusive assessments.
Conduct evaluations at nearby sites Indicators may provide more conclusive results at sites up- or downstream from the assessment reach,
as long as those locations represent similar conditions. For example, there should be no significant
discharges, diversions, or confluences between the new and original assessment locations, and they
should have similar geomorphology. See the section above (“Reach selection and placement”) for
guidance.
Review historical aerial imagery In many parts of the Arid West, sequences of aerial imagery can provide information about streamflow
duration. Google Earth’s time slider offers a convenient method of reviewing historical imagery,
particularly for desert systems with little riparian vegetation that could obscure the channel (however,
note that the Google Earth time slider may not have accurate image dates), as does the USGS Earth
Explorer. If surface water is observed in all interpretable images across multiple years (especially during
dry seasons), this may provide evidence that the reach is likely perennial. Suppose surface water is never
observed, even when other nearby intermittent streams show water. In this case, the consistent
absence of surface water may provide evidence that the reach is likely ephemeral (particularly if images
are captured during the wet season or after major storm events). If surface water is present in some
images and dry in others, the stream may be intermittent. This evidence is strong if the images with
surface water occur in the dry season, and do not coincide with storm events.
Anytime that discrete observations of flow or no flow are used to inform a determination of flow
duration class, it is recommended that such observations be evaluated in the context of relatively
normal climatic conditions. Doing so ensures that flow duration class is not determined based on
observations of flow or no flow during abnormally wet or abnormally dry periods. A useful tool to
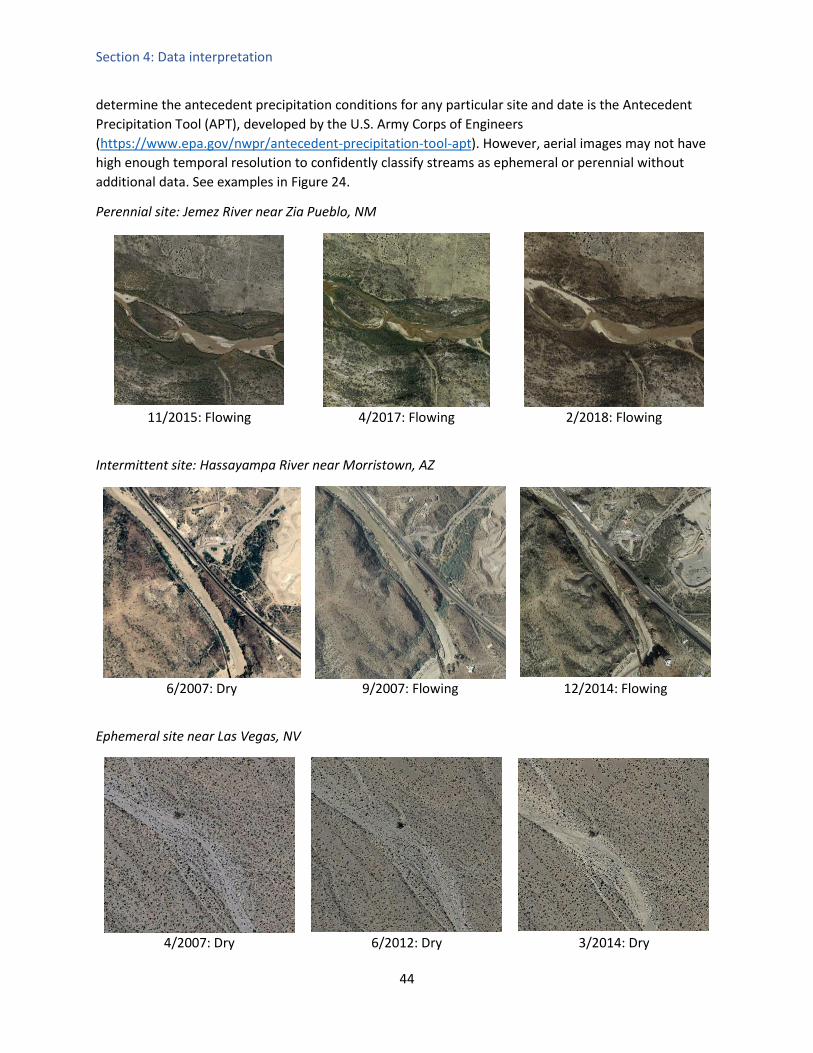
Section 4: Data interpretation
44
determine the antecedent precipitation conditions for any particular site and date is the Antecedent
Precipitation Tool (APT), developed by the U.S. Army Corps of Engineers
(https://www.epa.gov/nwpr/antecedent-precipitation-tool-apt). However, aerial images may not have
high enough temporal resolution to confidently classify streams as ephemeral or perennial without
additional data. See examples in Figure 24.
Perennial site: Jemez River near Zia Pueblo, NM
11/2015: Flowing 4/2017: Flowing 2/2018: Flowing
Intermittent site: Hassayampa River near Morristown, AZ
6/2007: Dry 9/2007: Flowing 12/2014: Flowing
Ephemeral site near Las Vegas, NV
4/2007: Dry 6/2012: Dry 3/2014: Dry

Section 4: Data interpretation
45
Figure 24. Examples of using aerial imagery to support streamflow duration classification. Images were taken from Google Earth using the time slider.
Conduct site revisits during regionally appropriate wet and dry seasons A single well-timed site visit may provide sufficient hydrologic evidence about streamflow duration. For
example, streams flowing at the end of the dry season (~September) in Mediterranean California are
likely perennial, and streams that are dry a week after large monsoon events in Arizona are likely
ephemeral, assuming typical climate patterns. As with observations from aerial imagery, anytime onsite
observations of flow or absence of flow are used to inform a determination of flow duration class, it is
recommended that such observations be evaluated in the context of normal climatic conditions. Doing
so ensures that flow duration class is not determined based on hydrologic observations of flow that
occurred during abnormally wet or abnormally dry periods. The previously mentioned APT can provide
this information.
Collect additional hydrologic data Properly deployed loggers, stream gauges, or wildlife cameras can provide direct evidence about
streamflow duration at ambiguous sites. It may be possible to distinguish intermittent from ephemeral
streams in just a single season, assuming typical precipitation.
Preparing a Streamflow Duration Assessment Report The web application for the beta version of the Streamflow Duration Assessment Method for the Arid
West (https://sccwrp.shinyapps.io/beta_awsdam_report/) provides a way to organize information
about indicators and determine the appropriate classification. This website allows users to enter data
and upload photos associated with each indicator, and then produce a PDF report in a standard format,
which can be included in permit applications.

46
References Baker, S.C. and H.F. Sharp, Jr. 1998. Evaluation of the recovery of a polluted urban stream using the
Ephemeroptera-Plecoptera-Trichoptera index. Journal of Freshwater Ecology 13:229-234. https://doi.org/10.1080/02705060.1998.9663611
Blackburn, M., and Mazzacano, C. 2012. Using aquatic macroinvertebrates as indicators of streamflow duration. The Xerces Society for Invertebrate Conservation. Retrieved from https://xerces.org/publications/id-monitoring/macroinvertebrate-indicators-of-streamflow.
Chadde, S.W. 2019. Western Wetland Flora: An Introduction to the Wetland and Aquatic Plants of the Western United States.
Cover, M., Seo, J.H., and Resh, V.H. 2015. Life history, burrowing behavior, and distribution of Neohermes filicornis (Megaloptera: Corydalidae), a long-lived aquatic insect in intermittent streams. Western North American Naturalist 75: 474-490. https://doi.org/10.3398/064.075.0405
Fritz, K.M., Hagenbuch, E., D’Amico, E., Reif, M., Wigington, P.J. Jr, Leibowitz, S.G., Comeleo, R.L., Ebersole, J.L., and Nadeau, T-L. 2013. Comparing the extent and permanence of headwater streams from two field surveys to values from hydrographic databases and maps. Journal of the American Water Resources Association 49: 867-882. https://doi.org/10.1111/jawr.12040
Fritz, K.M., Nadeau, T.-L., Kelso, J.E., Beck, W.S., Mazor, R.D., Harrington, R.A., and Topping, B.J. 2020. Classifying streamflow duration: the scientific basis and an operational framework for method development. Water 12: 2545 https://doi.org/10.3390/w12092545
Grimm, N.B. and Fisher, S.G. 1989. Stability of periphyton and macroinvertebrates to disturbance by flash floods in a desert stream. Journal of the North American Benthological Society 8:293-307. https://doi.org/10.2307/1467493
Halaburka, B.J., Lawrence, J.E., Bischel, H.N., Hsiao, J., Plumlee, M.H., Resh, V.H., and Luthy, R.G. 2013. Economic and ecological costs and benefits of streamflow augmentation using recycled water in a California coastal stream. Environmental Science & Technology 47: 10735-10743. https://doi.org/10.1021/es305011z
Hall, R. K., Husby, P., Wolinsky, G., Hansen, O., and Mares, M. 1998. Site access and sample frame issues for R-EMAP Central Valley, California, stream assessment. Environmental Monitoring and Assessment 51: 357-367. https://doi.org/10.1023/A:1005920227534
Hamdhani, H., Eppehimer, D.E., and Bogan, M.T. 2020. Release of treated effluent into streams: a global review of ecological impacts with a consideration of its potential use for environmental flows. Freshwater Biology 65: 1657-1670. https://doi.org/10.1111/fwb.13519
Karr, J.R., Fausch, K.D., Angermeier, P.L., Yant, P.R., and Schlosser, I.J. 1986. Assessment of Biological Integrity in Running Waters: A Method and Its Rationale. Illinois Natural History Survey Special Publication 5.
Lines, G.C. 1999. Health of native riparian vegetation and its relation to hydrologic conditions along the Mojave River, Southern California. US Geological Survey. Water-Resources Investigations Report 99-4112. Sacramento, CA. https://doi.org/10.3133/wri994112

47
Mazzacano C, Black SH (2008) Using Aquatic Macroinvertebrates as Indicators of Streamflow Duration. Report prepared by the Xerces Society for Invertebrate Conservation, 33 pp. https://xerces.org/sites/default/files/publications/10-003.pdf
Mazzacano, C., and Blackburn, M. 2015. Macroinvertebrate indicators of streamflow duration: A companion to the Streamflow Duration Assessment Method for the Pacific Northwest. The Xerces Society. Available from https://www.epa.gov/sites/production/files/2015-10/documents/macroinvertebrate_field_guide.pdf
McCune, K. and Mazor, R.D. 2019. Review of flow duration methods and indicators of flow duration in the scientific literature: Arid Southwest. Technical Report 1063. Southern California Coastal Water Research Project. Costa Mesa, CA. http://ftp.sccwrp.org/pub/download/DOCUMENTS/TechnicalReports/1063_FlowMethodsReview.pdf
McKay, L., T. Bondelid, T. Dewald, J. Johnston, R. Moore, and A. Rea. 2012. NHDPlus Version 2: User Guide. ftp://ftp.horizon-systems.com/NHDplus/NHDPlusV21/Documentation/NHDPlusV2_User_Guide.pdf.
Merritt, R.W., Cummins, K.W., and Berg, M.B. 2019. Aquatic Insects of North America, 5th Edition. Kendall Hunt Publishing Company. Dubuque, IA.
Nadeau, T.-L. 2015. Streamflow Duration Assessment Method for the Pacific Northwest EPA 910-K-14-001. U.S. Environmental Protection Agency, Region 10, Seattle, WA. https://www.epa.gov/sites/production/files/2016-01/documents/streamflow_duration_assessment_method_pacific_northwest_2015.pdf
Nadeau, T.-L. and Rains, M.C. 2007. Hydrological connectivity between headwater streams and downstream waters: How science can inform policy. Journal of the American Water Resources Association 43: 118-113. https://doi.org/10.1111/j.1752-1688.2007.00010.x
New Mexico Environment Department. 2011. Hydrology Protocol for the Determination of Uses Supported by Ephemeral, Intermittent, and Perennial waters. Retrieved from https://www.env.nm.gov/surface-water-quality/wqmp-cpp/
Rosenberg, D. M. and Resh, V.H. 1993. Freshwater Biomonitoring and Benthic Macroinvertebrates. Chapman and Hall, NY.
Stebbins, R.C. 2003. A Field Guide to Western Reptiles and Amphibians, 3rd edition Houghton Mifflin Harcourt, Boston, MA.
Stuart, J.D., and Sawyer, J.O. 2001. Trees and Shrubs of California. University of California Press, Berkeley, CA.
United States Army Corps of Engineers (USACE). 2018. National Wetland Plant List, version 3.4. Engineer
Research and Development Center Cold Regions Research and Engineering Laboratory. Hanover,
NH. http://wetland-plants.usace.army.mil/nwpl_static/v34/home/home.html
Voshell, J.R. Jr. and Wright, A.B. 2002. A Guide to Common Freshwater Invertebrates of North America.
McDonald and Woodward Publishing Company, Blacksburg, VA.

48
Appendix A. Glossary of terms Term Definition
Abdomen The terminal section of an arthropod body.
Algae A large and diverse group of photosynthetic single- and multi-cellular organisms that live in waterbodies. Algae may grow suspended in water (i.e., phytoplankton), or, more typical for streams, attached to stable substrate, such as rocks or submerged logs (i.e., periphyton). For the SDAM AW, this group includes diatoms, cyanobacteria, green algae, and red algae. Vascular plants, mosses, and non-photosynthetic bacteria or fungi are not considered algae.
Active channel A portion of the valley bottom that can be distinguished based on the three primary criteria of (i) channels defined by erosional and depositional forms created by river processes, (ii) the upper elevation limit at which water is contained within a channel, and (iii) portions of a channel without mature woody vegetation. Braided systems have multiple threads and channel bars that are all part of the active channel.
Alluvial Refers to natural, channelized runoff from terrestrial terrain, and the material borne or deposited by such runoff.
Assessment reach The length of reach, ranging from 40 m to 200 m, where SDAM AW indicators are measured.
Bank The side of an active channel, typically associated with a steeper side gradient than the adjacent channel bed, floodplain, or valley bottom.
Bankfull elevation The elevation associated with a shift in the hydraulic geometry of the channel and the transition point between the channel and the floodplain. In unconstrained settings this is the height of the water in the channel just when it begins to flow onto the floodplain.
Braided system A stream with a wide, relatively horizontal channel bed over which during low flows, water forms an interlacing pattern of splitting into numerous small conveyances that coalesce a short system downstream.
Benthic macroinvertebrates
Invertebrate organisms found at the bottom of waterbodies and visible without the use of a microscope (i.e., > 0.5 mm body length).
Canal An artificial or formerly natural waterway used to convey water between locations, possibly in both directions. Same as ditch.
Catchment An area of land, bounded by a drainage divide, which drains to a channel or waterbody. Synonymous with watershed.
Cerci The tail-like filaments at the posterior end of some arthropods’ abdomens. Singular: cerucs.
Channel A feature in fluvial systems consisting of a bed and its opposing banks which confines and conveys surface water flow. A braided system consists of multiple channels, including inactive or abandoned channels.
Confinement The degree to which levees, terraces, hillsides, or canyon walls prevent the lateral migration of a fluvial channel.
Culvert A drain or covered channel that crosses under a road, pathway, or railway.
Ditch An artificial or formerly natural waterway used to convey water between locations, possibly in both directions. Same as canal.
Ephemeral Ephemeral streams are channels that flow only in direct response to precipitation. Water typically flows at the surface only during and/or shortly
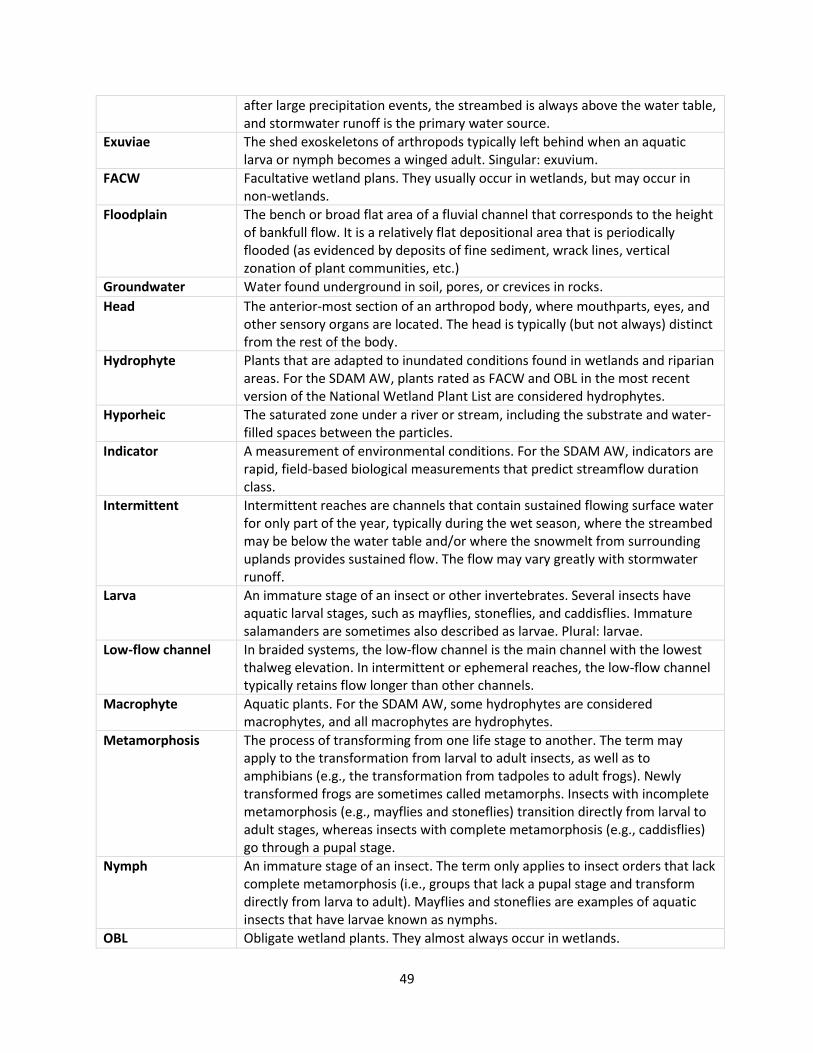
49
after large precipitation events, the streambed is always above the water table, and stormwater runoff is the primary water source.
Exuviae The shed exoskeletons of arthropods typically left behind when an aquatic larva or nymph becomes a winged adult. Singular: exuvium.
FACW Facultative wetland plans. They usually occur in wetlands, but may occur in non-wetlands.
Floodplain The bench or broad flat area of a fluvial channel that corresponds to the height of bankfull flow. It is a relatively flat depositional area that is periodically flooded (as evidenced by deposits of fine sediment, wrack lines, vertical zonation of plant communities, etc.)
Groundwater Water found underground in soil, pores, or crevices in rocks.
Head The anterior-most section of an arthropod body, where mouthparts, eyes, and other sensory organs are located. The head is typically (but not always) distinct from the rest of the body.
Hydrophyte Plants that are adapted to inundated conditions found in wetlands and riparian areas. For the SDAM AW, plants rated as FACW and OBL in the most recent version of the National Wetland Plant List are considered hydrophytes.
Hyporheic The saturated zone under a river or stream, including the substrate and water-filled spaces between the particles.
Indicator A measurement of environmental conditions. For the SDAM AW, indicators are rapid, field-based biological measurements that predict streamflow duration class.
Intermittent Intermittent reaches are channels that contain sustained flowing surface water for only part of the year, typically during the wet season, where the streambed may be below the water table and/or where the snowmelt from surrounding uplands provides sustained flow. The flow may vary greatly with stormwater runoff.
Larva An immature stage of an insect or other invertebrates. Several insects have aquatic larval stages, such as mayflies, stoneflies, and caddisflies. Immature salamanders are sometimes also described as larvae. Plural: larvae.
Low-flow channel In braided systems, the low-flow channel is the main channel with the lowest thalweg elevation. In intermittent or ephemeral reaches, the low-flow channel typically retains flow longer than other channels.
Macrophyte Aquatic plants. For the SDAM AW, some hydrophytes are considered macrophytes, and all macrophytes are hydrophytes.
Metamorphosis The process of transforming from one life stage to another. The term may apply to the transformation from larval to adult insects, as well as to amphibians (e.g., the transformation from tadpoles to adult frogs). Newly transformed frogs are sometimes called metamorphs. Insects with incomplete metamorphosis (e.g., mayflies and stoneflies) transition directly from larval to adult stages, whereas insects with complete metamorphosis (e.g., caddisflies) go through a pupal stage.
Nymph An immature stage of an insect. The term only applies to insect orders that lack complete metamorphosis (i.e., groups that lack a pupal stage and transform directly from larva to adult). Mayflies and stoneflies are examples of aquatic insects that have larvae known as nymphs.
OBL Obligate wetland plants. They almost always occur in wetlands.

50
Ordinary high-water mark (OHWM)
The line on the shore established by the fluctuations of water and indicated by physical characteristics, such as a clear natural line impressed on the bank, shelving, changes in the character of the soil, destruction of terrestrial vegetation, the presence of litter and debris, or other appropriate means that consider the characteristics of the surrounding areas. See 33 CFR 328.3(c)(7), 40 CFR 120.2(3)(vii). An OHWM is required to establish lateral extent of USACE jurisdiction in non-tidal streams. See 33 CFR 328.4.
Perennial Perennial reaches are channels that contain flowing surface water continuously during a year of normal rainfall, often with the streambed located below the water table for most of the year. Groundwater typically supplies the baseflow for perennial reaches, but the baseflow may also be supplemented by stormwater runoff and/or snowmelt.
Pool A depression in a channel where water velocity is slow and suspended particles tend to deposit. Pools typically retain surface water longer than other portions of intermittent or ephemeral streams.
Proleg Leg-like extensions on the abdomen (never the thorax) of some insect larvae. Typically, prolegs are unsegmented.
Pupa An immature stage of insect orders with complete metamorphosis, occurring between the larval and adult stage. Pupal stages are typically immobile. Caddisflies are an example of an aquatic insect order with a pupal stage. Plural: pupae.
Reach A length of stream that generally has consistent geomorphological and biological characteristics.
Riffle A shallow portion of a channel where water velocity and turbulence is high, typically with coarse substrate (cobble and gravels). Riffles typically dry out earlier than other portions of intermittent or ephemeral streams, and harbor higher abundance and diversity of aquatic invertebrates.
Riparian A transitional area between the channel and adjacent terrestrial ecosystems.
Runoff Surface flow of water caused by precipitation or irrigation over saturated or impervious surfaces.
SAV Submerged aquatic vegetation. This class is treated the same as OBL in current versions of the National Wetland Plant List.
Sclerotized Hardened, as in the tough plates covering various body parts in some arthropods.
Scour Concentrated erosive action of flowing water in streams that removes and carries material away from the bed or banks. Algal and invertebrate abundance is typically depressed after scouring events.
Secondary channel A subsidiary channel that branches from the main channel and trend parallel or subparallel to the main channel before rejoining it downstream.
Streambed The bottom of a stream channel between the banks that is inundated during baseflow conditions.
Thalweg The line along the deepest flowpath within the channel.
Thorax The middle section of an arthropod body where legs and wing pads (if present) are attached.
Tributary A stream that conveys water and sediment to a larger waterbody downstream.
Uplands Any portion of a drainage basin outside the river corridor.

51
Valley width The portion of the valley within which the fluvial channel is able to migrate without cutting into hill slopes, terraces, or artificial structures.
Watershed An area of land, bounded by a drainage divide, which drains to a channel or waterbody. Synonymous with catchment.

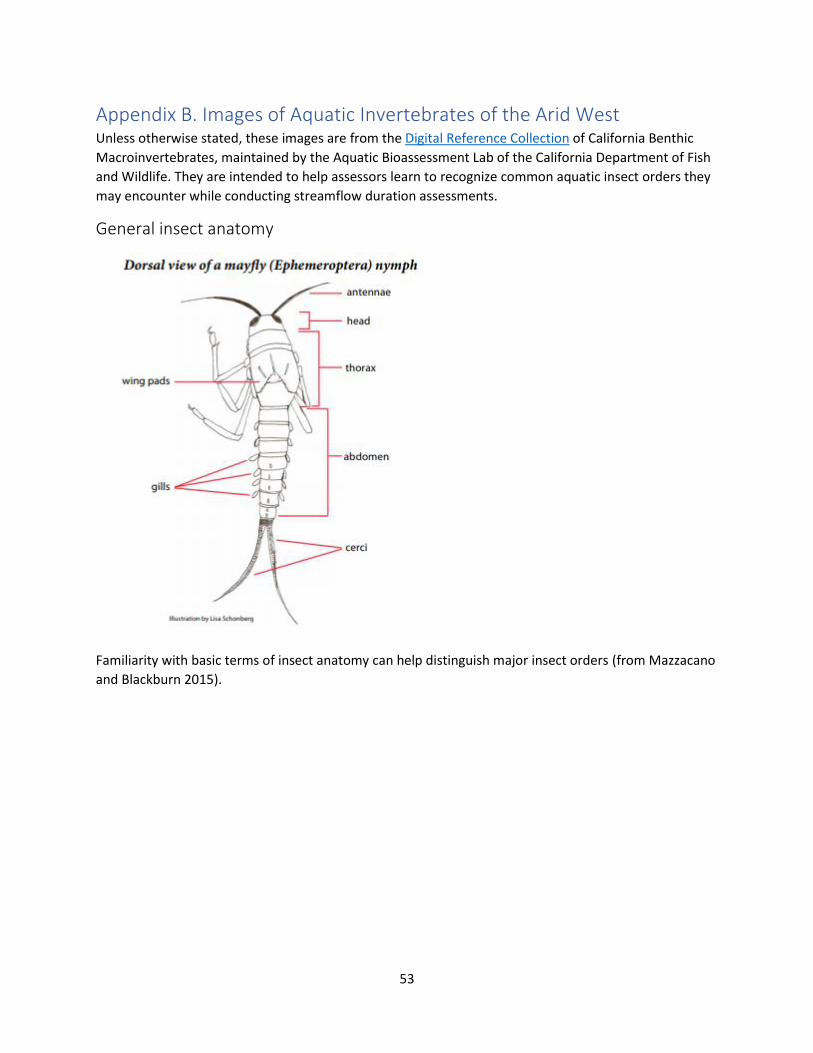
53
Appendix B. Images of Aquatic Invertebrates of the Arid West Unless otherwise stated, these images are from the Digital Reference Collection of California Benthic
Macroinvertebrates, maintained by the Aquatic Bioassessment Lab of the California Department of Fish
and Wildlife. They are intended to help assessors learn to recognize common aquatic insect orders they
may encounter while conducting streamflow duration assessments.
General insect anatomy
Familiarity with basic terms of insect anatomy can help distinguish major insect orders (from Mazzacano
and Blackburn 2015).

54
Ephemeroptera, Plecoptera, and Trichoptera (EPT)
Assessors need to learn to identify EPT orders in the field. With a bit of practice, recognizing these
orders and differentiating them from other aquatic insect orders is relatively easy. These photos are
intended to familiarize novices with the diversity of forms and appearances of these groups.
Ephemeroptera (mayfly) larvae
Baetidae (small minnow mayflies). This family has a streamlined appearance and appears to swim like a
minnow. The abdominal gills and three cerci (tails) are conspicuous in this photo. Wing pads are usually
visible. This specimen is Baetis. In some species of Baetis, only two cerci are evident.
Three
cerci Abdominal
gills
Wing pads

55
Heptageniidae (flat-headed mayflies). Some mayflies have a flattened appearance, and cling to the
undersides of cobbles in fast-flowing water. Still, they have the single tarsal claws, abdominal gills, and
three cerci typical of mayflies. This specimen is Rhithrogena.
Abdominal
gills
Three
cerci
Single
tarsal
claw

56
Leptohyphidae (little stout crawler mayflies). This family of mayflies has a pair of enlarged, hardened
(i.e., sclerotized) abdominal gills that can cover the smaller, translucent abdominal gills. The family
typically has three cerci, but the right one has broken off in this specimen. This specimen is a species of
Tricorythodes.
Single
tarsal
claw
Enlarged
plate-like
abdominal gill

57
Ephemeridae (burrowing mayflies). This family of mayflies prefers to burrow in soft, silty sediments.
Although it is more common in lakes, it may be found in pools and slow-moving portions of rivers. The
long feathery gills and single tarsal claws make this recognizable as a mayfly. This specimen is Hexagenia
limbata.
Feather-like
abdominal gills

58
Plecoptera (stonefly) larvae
Perlidae (common stoneflies). Stoneflies have tuft-like gills on the thorax (not along the abdomen), two
(not one) tarsal claw at the end of each leg, and always has two (never three) cerci, making them easily
distinguished from mayflies. This family is large and conspicuous, often with ornate patterns on the
head and thorax. Wing pads are usually visible. This specimen is Claasenia sabulosa.
Two tarsal
claws
Two cerci
Thoracic
gills

59
Nemouridae (nemourid stoneflies). This family is relatively small and contains species that are well
adapted to intermittent streams in the Arid West. This specimen is a species of Soyedina.
Thoracic
gills
Two cerci
Wing pads

60
Peltoperlidae (roach-like stoneflies). Even more so than other stonefly families, peltoperlids have a
roach-like appearance. This specimen is a species of Sierraperla.
Two cerci
Wing pads

61
Trichoptera (caddisfly) larvae and pupae
Limnephilidae (northern case-makers). Limnephilids are a large group of roaming caddisflies that build
cases out of diverse materials, such as pebbles, sand, leaf segments, and twigs. They all have
filamentous gills on the ventral side of the abdomen (as opposed to the plate-like gills on the dorsal side
of the abdomen, as seen with mayflies). Their abdomen ends in two anal prolegs, each with a sclerotized
hook, rather than long tail-like cerci. No wing pads are visible, but the thorax is usually dark and
hardened (i.e., sclerotized) on the top, with the abdomen being completely membranous. Caddisfly
larvae are generally C-shaped (less evident in this pudgy specimen). This specimen is a mature
Dicosmoecus gilvepes and its case.
Abdominal
gills
Anal proleg with
sclerotized hooks
Sclerotized
thorax
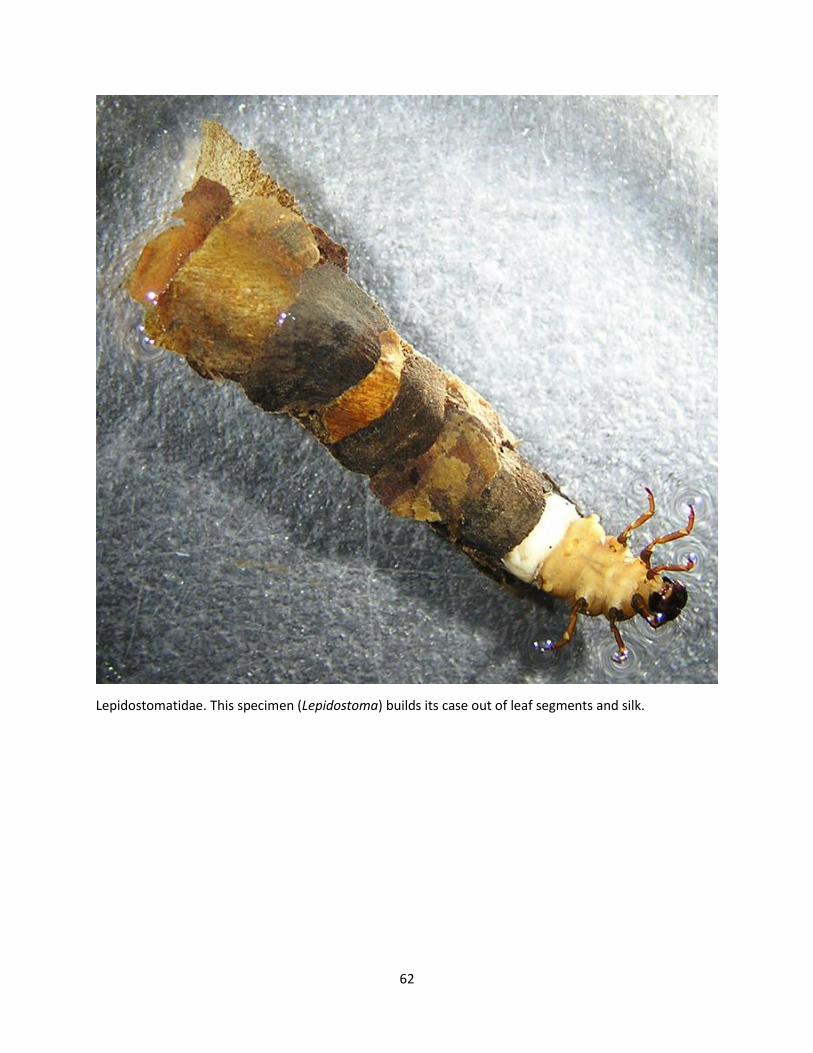
62
Lepidostomatidae. This specimen (Lepidostoma) builds its case out of leaf segments and silk.

63
Lepidostomatidae. This specimen (Lepidostoma) has a case made out of twigs.

64
Rhyacophilidae (free-roaming caddisflies). This family is usually found wandering freely on the
undersides of boulders and cobbles, actively hunting for prey. Abdominal gills are present, but not
evident in this photo. Notice the long anal prolegs, which have large sclerotized claws. Some species of
this family have a striking blue-green coloration, which may fade when preserved in alcohol.
Two anal
prolegs with
sclerotized
hooks
Sclerotized
thoracic
segment
Unsclerotized
thoracic
segments

65
Hydroptilidae (micro caddisflies). These are small caddisflies (2-4 mm long) that build purse-like cases
out of sand grains. They may be very abundant, but hard to see due to their size. This specimen is a
species of Hydroptila.
Sclerotized
thoracic
segments

66
Helicopsychidae (snail case-makers) are unusual in that they build spiral-shaped, snail-like cases. This
specimen is Helicopsyche borealis.
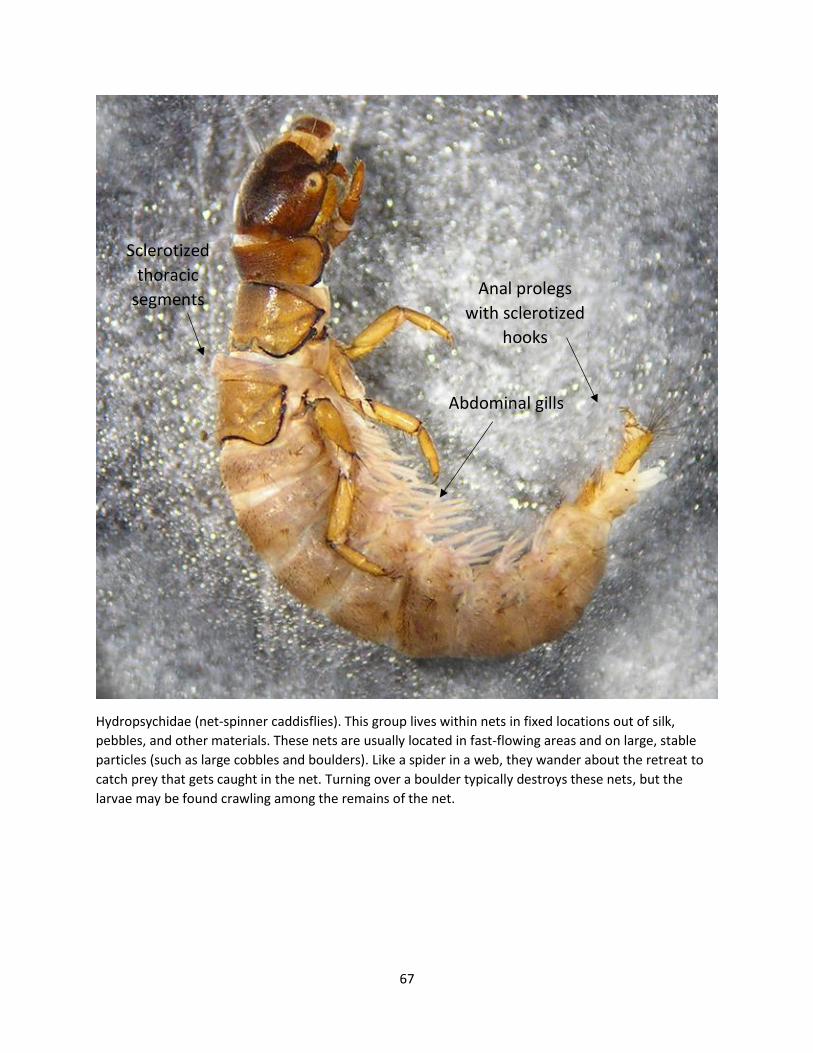
67
Hydropsychidae (net-spinner caddisflies). This group lives within nets in fixed locations out of silk,
pebbles, and other materials. These nets are usually located in fast-flowing areas and on large, stable
particles (such as large cobbles and boulders). Like a spider in a web, they wander about the retreat to
catch prey that gets caught in the net. Turning over a boulder typically destroys these nets, but the
larvae may be found crawling among the remains of the net.
Sclerotized
thoracic
segments
Abdominal gills
Anal prolegs
with sclerotized
hooks

68
Other Insect Orders
Assessors need to recognize other aquatic insect orders, and differentiate them from the EPT orders
shown above. A few commonly encountered insects are shown here. These organisms contribute to the
total count of aquatic invertebrates, but are not counted towards the EPT indicator.
Dytiscidae (diving beetles). Larvae of this group lack the gills and tarsal claws that characterize mayflies
and stoneflies. Their thorax is not as strongly sclerotized as with caddisflies; conversely, caddisfly larvae
never have sclerotized abdomens, unlike most beetle larvae. This specimen is a species of Agabus.

69
Elmidae (riffle beetles). These small insect larvae have a completely sclerotized body, unlike caddisflies
which only have the thorax sclerotized. Also, there are no gills along the abdomen, as in the caddisflies.
Instead, gills are found at the tip of the abdomen (where the caddisfly’s two anal prolegs with hooks
would be found).

70
Chironomidae (non-biting midges). Superficially, the larvae of this family of true flies resembles those of
caddisflies, thanks to the C-shaped body and the posterior prolegs that resemble hooks. Furthermore,
several species are found in tubes of silk lined with silt and muck, which can resemble a caddis case.
While generally smaller, the sizes of the two groups can overlap considerably. Chironomidae are best
distinguished from caddisflies by the lack of abdominal gills, the soft thorax, and the lack of true legs
(i.e., three pairs of sclerotized, jointed legs). Some chironomids have bright red bodies, thanks to
hemoglobin pigment, which helps them survive in low-oxygen conditions.

71
Corydalidae (hellgrammites, dobsonflies). This large, centipede-like insect larva has distinctive lateral
filaments along the sides of the abdomen. They lack the C-shaped bodies of caddisflies, and the lateral
filaments contrast with the gills on the ventral side of the abdomens of caddisflies. Although most
species are associated with perennial streams, some species in California and Arizona persist in
intermittent streams by building a chamber in sandy substrate beneath boulders, where they wait out
the dry season; as a result, they are among the first invertebrates to be observed after the onset of flow.
Lateral filaments
on abdomen
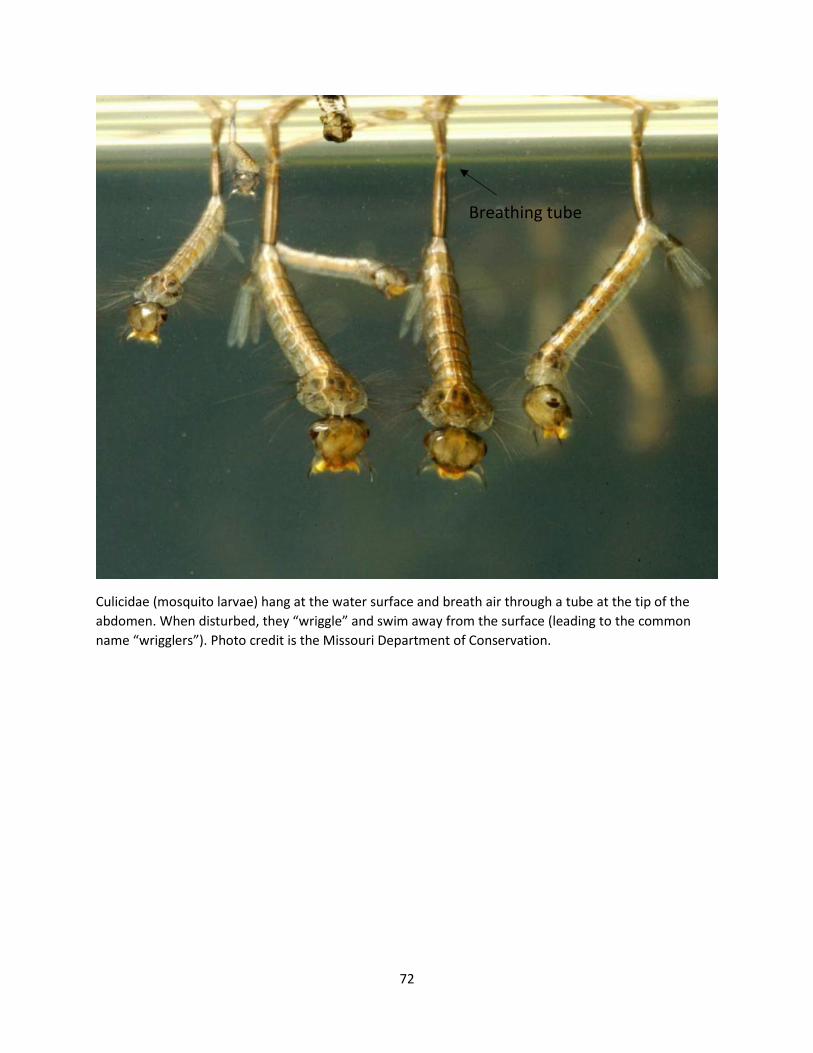
72
Culicidae (mosquito larvae) hang at the water surface and breath air through a tube at the tip of the
abdomen. When disturbed, they “wriggle” and swim away from the surface (leading to the common
name “wrigglers”). Photo credit is the Missouri Department of Conservation.
Breathing tube

73
Other invertebrates
Anodonta californiensis (California floater) is a freshwater mussel found in streams throughout the
West. Most freshwater mussels are imperiled and should not be collected or disturbed during
assessments. Photo credit: Michael Bogan.

Appendix C. Field Forms

Field form for the beta Arid Streamflow Duration Assessment Method
Revision Date December 8, 2020 Page 1 of 4
Beta Arid West Streamflow Duration Assessment Method
General site information
Project name or number:
Site code or identifier:
Assessor(s):
Waterway name:
Visit date:
Current weather conditions (check one)
□ Storm/heavy rain
□ Steady rain
□ Intermittent rain
□ Snowing
□ Cloudy (___ % cover)
□ Clear/Sunny
Notes on current or recent weather
conditions (e.g., precipitation in previous
week):
Coordinates at downstream end
(decimal degrees):
Lat (N):
Long (W):
Datum:
Surrounding land-use within 100 m (check one or two):
□ Urban/industrial/residential
□ Agricultural (farmland, crops, vineyards, pasture)
□ Developed open-space (e.g., golf course)
□ Forested
□ Other natural
□ Other: ____________________________________
Describe reach boundaries:
Mean channel width (m)
Reach length (m): 40x width; min 40 m; max 200 m.
Enter photo ID, or check if completed
Top down: __________
Mid up: _____________
Mid down: ___________
Bottom up: __________
Disturbed or difficult conditions (check all that apply): □ Recent flood or debris flow
□ Stream modifications (e.g., channelization)
□ Diversions
□ Discharges
□ Drought
□ Vegetation removal/limitations
□ Other (explain in notes)
□ None
Notes on disturbances or difficult site conditions:
Observed hydrology:
______ % of reach with surface flow
______ % of reach with sub-surface or surface flow
______ # of isolated pools
Comments on observed hydrology:
Site sketch:

Field form for the beta Arid Streamflow Duration Assessment Method
Revision Date December 8, 2020 Page 2 of 4
1. Hydrophytic plant species Record up to 5 hydrophytic plant species (FACW or OBL in the Arid West regional wetland plant list) within the assessment
area: within the channel or up to one half-channel width. Explain in notes if species has an odd distribution (e.g., covers less
than 2% of assessment area, long-lived species solely represented by seedlings, or long-lived species solely represented by
specimens in decline), or if there is uncertainty about the identification. Enter photo ID, or check if photo is taken.
Check if applicable: □ No vegetation in assessment area □ No hydrophytes in assessment area
Species
Odd
distribution? Notes
Photo
ID
Notes on hydrophytic vegetation:
2 and 3. Aquatic invertebrates
2. How many aquatic
invertebrates are
quantified in a 15-minute
search?
3. Is there evidence of aquatic stages of EPT (Ephemeroptera, Plecoptera
and Trichoptera)?
Yes / No
Number of
individuals
quantified:
(Do not
count
mosquitos)
□ None
□ 1 to 19
□ 20 +
Photo ID:__________________ Ephemeroptera larva Image credit: Dieter Tracey
Plecoptera larva Tracey Saxby
Trichoptera larva Tracey Saxby
Notes on aquatic invertebrates:
4. Algal Cover Are algae found on the
streambed?
□ Check if all observed
algae appear to be deposited
from an upstream source.
□ Not detected
□ Yes, < 10% cover
□ Yes, ≥ 10% (check
Yes in single
indicator below)
Notes on algae cover: Photo ID:
5. Are single indicators observed?
Indicator Present Notes Photo ID
Fish □ Yes
□ No, no fish
□ No, only non-native mosquitofish
Algae cover ≥ 10% □ Yes
□ No

Field form for the beta Arid Streamflow Duration Assessment Method
Revision Date December 8, 2020 Page 3 of 4
Supplemental information E.g., aquatic or semi-aquatic amphibians, snakes, or turtles; iron-oxidizing bacteria and
fungi; etc.
Photo log
Indicate if any other photos taken during the assessment
Photo ID Description
Additional notes about the assessment:

Field form for the beta Arid Streamflow Duration Assessment Method
Revision Date December 8, 2020 Page 4 of 4
Classification: ________________________________
Shading provided to enhance readability by increasing the contrast between neighboring cells; empty cells indicate the classification will not change with additional information however it is recommended that all five indicators be measured and recorded during every assessment.
1. Hydrophytic
plant species
2. Aquatic
invertebrates
3. EPT
taxa
4. Algae 5. Single indicators
• fish present
• algae cover ≥ 10%
Classification
None
None Absent
Absent Absent Ephemeral
Present At least intermittent
Present Absent Need more information
Present At least intermittent
Few (1-19)
Absent
Absent Absent Need more information
Present At least intermittent
Present Absent Need more information
Present At least intermittent
Present At least intermittent
Many (20+)
Absent
Absent Absent Need more information
Present At least intermittent
Present Absent Need more information
Present At least intermittent
Present At least intermittent
Few (1-2)
None Absent Absent
Absent Need more information
Present At least intermittent
Present At least intermittent
Few (1-19)
Absent Absent Intermittent
Present At least intermittent
Present At least intermittent
Many (20+)
Absent Absent Intermittent
Present At least intermittent
Present Absent At least intermittent
Present Intermittent
Many (3+)
None Absent Absent
Absent Need more information
Present At least intermittent
Present At least intermittent
Few (1-19)
Absent At least intermittent
Present Perennial
Many (20+)
Absent At least intermittent
Present Perennial