using 3d geographic information system to improve … · 2014-07-03 · using 3d geographic...
TRANSCRIPT

Using 3D Geographic Information System to Improve Sales Comparison Approach for Real Estate Valuation, (7057) Haicong Yu, Ying Liu and Cunye Zhang (China, PR) FIG Congress 2014 Engaging the Challenges – Enhancing the Relevance Kuala Lumpur, Malaysia 16 – 21 June 2014
1/14 Using
Using 3D Geographic Information System to Improve Sales Comparison Approach for Real Estate Valuation
Haicong YU, Ying LIU and Cunye ZHANG, China Key words: Geographic Information System, 3D GIS; sales comparison approach, real estate valuation, spatial analysis. SUMMARY Geographic Information System (GIS) provides valuers with analysis tools to enhance real estate valuation. The objective of this paper is to illustrate how to use GIS with three-dimensional visualization technology to improve real estate valuation. In order to do that, an integrated database for real estate valuation was built with real estate data, spatial data and valuation thematic data. The integrated database provides professional data support for valuation. Then, an improved sales comparison approach was proposed as the demonstration of the combination of valuation methods and 3D GIS. In this approach, a new procedure of selecting comparable sales was introduced. Moreover, a 3D GIS valuation model was proposed. In this model, the impact factors of the property value were determined at first. Then quantitative analysis was used to form a quantitative table for further analysis. Next, by utilizing spatial analysis, the performance value of both regional and individual impact factors was conducted. According to the analysis results and quantitative table, each impact factor can be calculated. The performance value was represented as a matrix. Through dimensionless treatment, detailed comparison approach among comparable sales in each factor can be executed, as well as the similarity analysis between the subject property and comparable sales. Eventually, the most relevant comparable sales can be determined and the adjustments can also be conducted for final valuation. At last, a 3DGISSPV system was introduced to illustrate the proposed approach. Actual data of Shenzhen, China have been used. And the system shows grate benefits for using GIS with three-dimensional visualization.
Using 3D Geographic Information System to Improve Sales Comparison Approach for Real Estate Valuation, (7057) Haicong Yu, Ying Liu and Cunye Zhang (China, PR) FIG Congress 2014 Engaging the Challenges – Enhancing the Relevance Kuala Lumpur, Malaysia 16 – 21 June 2014
2/14 Using
Using 3D Geographic Information System to Improve Sales Comparison Approach for Real Estate Valuation
Haicong YU, Ying LIU and Cunye ZHANG, China
1. INTRODUCTION Sales comparison approach is one of the three widely adopted approaches for real estate valuation. Besides the expert knowledge of valuers, this approach requires sufficient transaction records in the market, feasible selection method of comparable evidence and adequate impact factors analysis for value adjustment. However, in data aspect, valuers are often unable to gather enough and adequate information to support the valuation, especially when the market changing with time. The data utilized in this approach encompasses not only from real estate itself, but also from architecture, urban planning, environmental engineering, surveying, geography, finance, economy and so on. Otherwise, most of the data are unstructured spatial and non-spatial data with multi-source, multi-scale and big volume, which leaves great challenges in data integrity and data fusion. In technology aspect, the current valuation approaches are vulnerable in analysis, especially when it comes to spatial related analysis. Furthermore, it is mostly an experience oriented process, in which subjective judgment of valuers takes important role. In informatization aspect, neither information collection nor analysis is efficient by manual. The lack of valuation standardization and unified platform for efficient management and analysis may put off the development of real estate industry. Geographic information system (GIS) was specially designed for handling spatial data and is capable of performing manipulation, analyzing and presentation spatial relationships (Fung and Kung, 1995; Zeng and Zhou, 2001). All kinds of information would be integrated effectively and efficiently though GIS no matter the difference of data source, data scale or data structure. However, the functional parts of a GIS include not just database management, but also visualization, mapping, and spatial analysis. With three-dimensional (3D) data model and visual reality technology, the real 3D environment can be built to repentant the real world with not only the 3D surface but also the 3D buildings. Moreover, compare to two-dimensional (2D) GIS, 3D GIS can provide more professional decision making assistant for real estate business (Yang and Putra et al., 2007; Yu and Han et al., 2007; Wallner, 2012). Literature shows that GIS has already been used in real estate related studies and plays an important role (Fung and Kung, 1995; Rodriguez and Sirmans et al., 1995; Wofford and Thrall, 1997; Ron and Prill et al., 2001). Thrall (1998) assessed the effect of GIS in real estate and related industries, and pointed out that the market would move to higher levels of efficiency after realizing the full potential of GIS. The application of GIS technology improved the analysisof many research questions (Rodriguez and Sirmans et al., 1995) and enhanced the problem solving techniques (Wofford and Thrall, 1997; Clapp and Rodriguez, 1998). Basic GIS spatial analysis tools are used in real estate automatic location positioning (Fung and Kung, 1995), real estate markets pattern change and distribution change detection
Using 3D Geographic Information System to Improve Sales Comparison Approach for Real Estate Valuation, (7057) Haicong Yu, Ying Liu and Cunye Zhang (China, PR) FIG Congress 2014 Engaging the Challenges – Enhancing the Relevance Kuala Lumpur, Malaysia 16 – 21 June 2014
3/14 Using
(Fung and Kung, 1995), distance calculation(Rodriguez and Sirmans et al., 1995; Clapp and Rodriguez, 1998), and accessibility area determination (Wyatt, 1997; Zeng and Zhou, 2001) and so on. With the development of GIS, comprehensive analysis can be realized and used in real estate study, such as, visibility analysis (Lake and Lovett et al., 2000; Bishop and Lange et al., 2004), optimal site selection (Zeng and Zhou, 2001; Heng and Ling et al., 2005) and average selling price analysis (Chen and Shelley et al., 2011) and so on. Thus,the challenges facing in front of traditional valuation approaches, such as comparable evidence selection and impact factors analysis for value adjustment, could also be solved by using GIS. Moreover, another benefit of applying GIS in real estate valuation is that it is easily to build a unified valuation platform based on the standard valuation producers to promote the accuracy and efficiency of real estate valuation. The objective of this paper is to illustrate how GIS with three-dimensional visualization can improve traditional real estate valuation approaches. This paper is mainly concentrate on the challenges of traditional valuation approaches. The integrated database for real estate valuation was introduced in Section 2 for data support. Then, an improved 3D GIS sales comparison approach was proposed in Section 3. To illustrate the proposed approach, a real estate valuation system was implemented. And this paper will be closed with some conclusions. 2. REAL ESTATE VALUATION DATABASE Real estate valuation work requires a lot of data support from not only real estate field but also related industries. It includes feature data that reflects the characteristics of real property itself and index data which reflects the influence from one of the elements of real property value, and. Weather the data preparation is adequate or the data quality suits the requirements will directly affect the accuracy of measurement results, and further affect the valuation results. To gather all kinds of data and make sure it is suitable for valuation is a hard task for valuers. However, experienced valuers know how to use information from the records they have done earlier, because the subject may share the same environment information as in some cases, or undertake the similar impact by similar reasons. It shows great potential and necessity to build a database for real estate valuation. In general, real estate database can be divided into three categories: valuation essential data, spatial data and valuation thematic data. 2.1 Valuation Essential Data This is the essential part of real estate valuation, and includes:
― Real estate sales records data: includes real estate attribute data and real estate price data. The former refers to non-spatial data associated with the characteristics of the real estate itself, such as land, community, building and apartment etc.; the latter refers to prices related data from presale registration, secondhand market, rental registration and self-defined record, and so on.
― Valuation parameters data: refers to technical specifications related parameters,

Using 3D Geographic Information System to Improve Sales Comparison Approach for Real Estate Valuation, (7057) Haicong Yu, Ying Liu and Cunye Zhang (China, PR) FIG Congress 2014 Engaging the Challenges – Enhancing the Relevance Kuala Lumpur, Malaysia 16 – 21 June 2014
4/14 Using
coefficients, indices and interest rates, such as general/regional factor description parameters, housing prices coefficients, construction cost indices, valuation approach parameters, loan interest rate, land remaining term adjustment parameters ,etc.
2.2 Spatial Data Spatial data contains not only the directly related spatial information of real estate but also other spatial data that have impact on real estate market. According to the valuation purpose and data type, it contains:
― Land data: includes the present situation of land use map and cadastre that describes the ownership, usage, location, and area information of land plots.
― Building data: describes the spatial characteristics of buildings, the location, ID, floor number, area, height, function, structure and parking lot number and so on.
― Road data: often represented as line or polygon, which can be used for network analysis, frontage influence analysis, etc.
― Multilevel administration zone data: describes administration area in different scales, such as district zone, street zone and community zone and so on, which often associate with statistics.
― Remote sensing image: mainly refers to aerial images and satellite images. Data includes high-resolution digital orthophoto maps on different timeslices, and multi-resolution remote sensing satellite photos, etc. It is important data when value at a certain historical time.
― Topographic map: shows topography, or land contours, by means of contour lines.
― Land benchmark price data: government published average valuation price according to different land use.
― Point of interests: include science and technology, education, transportation facilities, shopping centers, sports centers, health institutions, restaurant, utilities, financial institutions, government agencies, etc. they are the major data source for various impact factor analysis.
2.3 Valuation Thematic Data This group of data refers to various types of valuation objects, including:
― Building attribute data: stores name, structure, and the corresponding cost and pictures.
― Structures and fixtures attribute database: stores name, type, engineering calculation rules, corresponding price and pictures.
― Plants and trees data: records different species, name, pricing and pictures.
― Decoration data: stores name, engineering calculation rules, and corresponding prices and

Using 3D Geographic Information System to Improve Sales Comparison Approach for Real Estate Valuation, (7057) Haicong Yu, Ying Liu and Cunye Zhang (China, PR) FIG Congress 2014 Engaging the Challenges – Enhancing the Relevance Kuala Lumpur, Malaysia 16 – 21 June 2014
5/14 Using
pictures.
― Construction cost data: records construction cost and related technical and economic indicators.
2.4 Data Integration Through database all relevant data can be stored and managed for valuation purpose. For better supporting of analysis, data fusion of spatial and non-spatial data is conducted. And all the data is organized by the unified LAND-BUILDING-APARTMENT data model. In this model, BUILDINGis the connection center of all kinds. The connection between LANDand BUILDINGcan be established through geospatial or attribute link, while the connection between BUILDINGand APARTMENTis more rely on analysis, such as geocoding, semantic matching, and spatial overlay, etc. Other data can also build connections to LAND, BUILDor APARTMENT. 3. A 3D GIS-BASED SALES COMPARISON APPROACH The improved 3D GIS basedsales comparison approach is using GIS spatial analysis for comparable sales selection and impact factors analysis also known as comparable sales adjustment. All the analysis is served for the determination of selected comparable sales. The comparable sales will not be determined until the final calculation. And the adjustment process will be executed in a larger number of records and also support for decision making. The purpose of this procedure is to make sure the adequate sales are selected. In the meanwhile, the adjustment procedure has been done before final determination of comparable sales, which makes the final calculation more straightforward. With the combination of GIS, computationalburden and spatial analysis deficiency will no longer be a hard task, and it is capable to dealing with lager amount of sales process. This approach encompasses two basic models: the comparable sales direct selection model, which selects the potential sale records in the first round, and the 3D GIS valuation model, which analyzes each impact factors, values their performance, and calculates the final results. 3.1 The Direct Comparable Sales Selection Model This model is designed to select comparable sales generally according to the location and basic attributes of subject property. The flow chart of the model is shown in Figure 1. Property sales dataset can be derived on the bases of real estate valuation database. According to the location of subject property, buffer zone can be generated at a certain distance by using buffer analysis, which built a spatial restriction for searching sales. All the sales records within this zone will be considered for the next process. Then, parallel analysis is used to establish the attributes scope for filtering attributes such as valuation purpose, date of value, usage, property rights and interests, class, scale, and structure and so on. The remaining sales records will be considered as the first round selection results if the amount of the records fits the predefined scope requirement. If less qualified sales left, there are several options, the valuer may choose to expand searching area or relax some restrictions to run the process again

Using 3D Geographic Information System to Improve Sales Comparison Approach for Real Estate Valuation, (7057) Haicong Yu, Ying Liu and Cunye Zhang (China, PR) FIG Congress 2014 Engaging the Challenges – Enhancing the Relevance Kuala Lumpur, Malaysia 16 – 21 June 2014
6/14 Using
or to add self-defined sales records which qualified in the particular situation. The selection results generated by this selection model are grouped into so called direct comparable sales set.
Buffer analysis
Parallel analysis
Comparable sales number 5<n≤10
Add self-defined sales records
Direct comparable sales set
Property salesdata set Subject property
Expanding search area
No No
Yes
Figure 1. The flow chart of the comparable sales direct selection model
3.2 The 3D GIS Valuation Model The 3D GIS valuation model (as shown in Figure 2) is used for analysis the impact performance of property value.
Direct comparable sales set
Impact factors determination
Quantitative table formulation
Impact factors analysis based on spatial analysis
Performance matrix formulation
Similarity calculation
Comparable sales determination
Comparable value calculation
Subject property value calculation
Figure 2. The flow chart of the3D GIS valuation model

Using 3D Geographic Information System to Improve Sales Comparison Approach for Real Estate Valuation, (7057) Haicong Yu, Ying Liu and Cunye Zhang (China, PR) FIG Congress 2014 Engaging the Challenges – Enhancing the Relevance Kuala Lumpur, Malaysia 16 – 21 June 2014
7/14 Using
3.2.1 Impact factors determination Many factors have been proved to have impact to real estate value. Generally, the characteristics of the real estate can be classified into two major categories regional factors and individual factors. Nevertheless, for different type of real properties, the impact factors concerned differ. Take location for instance, for residential properties the influence of the distance to main street is not the same as for commercial properties. In this section, we take residential properties for example to illustrate the analysis. For residence, regional factors concern impacts from regional planning, regional prosperity, transportation convenience, landscape, environmental condition, fundamental infrastructure and public facility conditions. The specific descriptions are listed in Table 1. Individual factors include the plot ratio, project scale, ages, related service facilities, the rest of the land use term and decoration and so on.
Table 1. Regional impact factors table Impact
factors Descriptions Data involved Analysis methods
Regional factors
Regional planning
Urban master planning and detailed planning etc.
Urban master planning and detailed planning documents, maps, planning data
Spatial query, spatial overlay
Regional prosperity
Distance to multilevel business area
Business area data Spatial measurement, network analysis
Transportation convenience
The number of public transportation facilities (such as bus stop, subway stations, etc.) and distance as well as road network service capabilities
Bus stop, subway station, MRT, airport, train station, port and pier, and road network data with carriage information
Spatial measurement, network analysis, road network accessibility analysis, spatial statistics
Landscape The view of quality and distance to ocean, lake, mountain, green, forest park or golf course etc.
Ocean, lake, mountain, green, forest park and golf course data
Visibility analysis, spatial measurement, spatial statistics
Environmental condition
The air condition, noise, pollution, wasteyard, incineration plant, power station, high-voltage power lines, etc. and the sunshine time
Environmental monitoring data, road network, traffic, pollution monitoring data, wasteyard, incineration plant, power station, high-voltage power lines, and 3D buildings and so on
Spatial query, noise propagation analysis, pollutants diffusion analysis, visibility analysis, solar shadow analysis, spatial statistics
Using 3D Geographic Information System to Improve Sales Comparison Approach for Real Estate Valuation, (7057) Haicong Yu, Ying Liu and Cunye Zhang (China, PR) FIG Congress 2014 Engaging the Challenges – Enhancing the Relevance Kuala Lumpur, Malaysia 16 – 21 June 2014
8/14 Using
Fundamental infrastructure
The surrounded fundamental infrastructure, such as, water, electricity, gas, communications, cable, internet, wireless local area network, etc.
Under ground water pipe, electricity line, gas pipe, communications, cable, internet, wireless local area network and so on
Spatial query, spatial statistics
Public facility conditions
The distance to public facilities such as school, park, sport center, hospital, bank, ATM, supermarket, shopping mall, convenience store, theatre, etc.
Point of interests in all category
Spatial query, spatial statistics
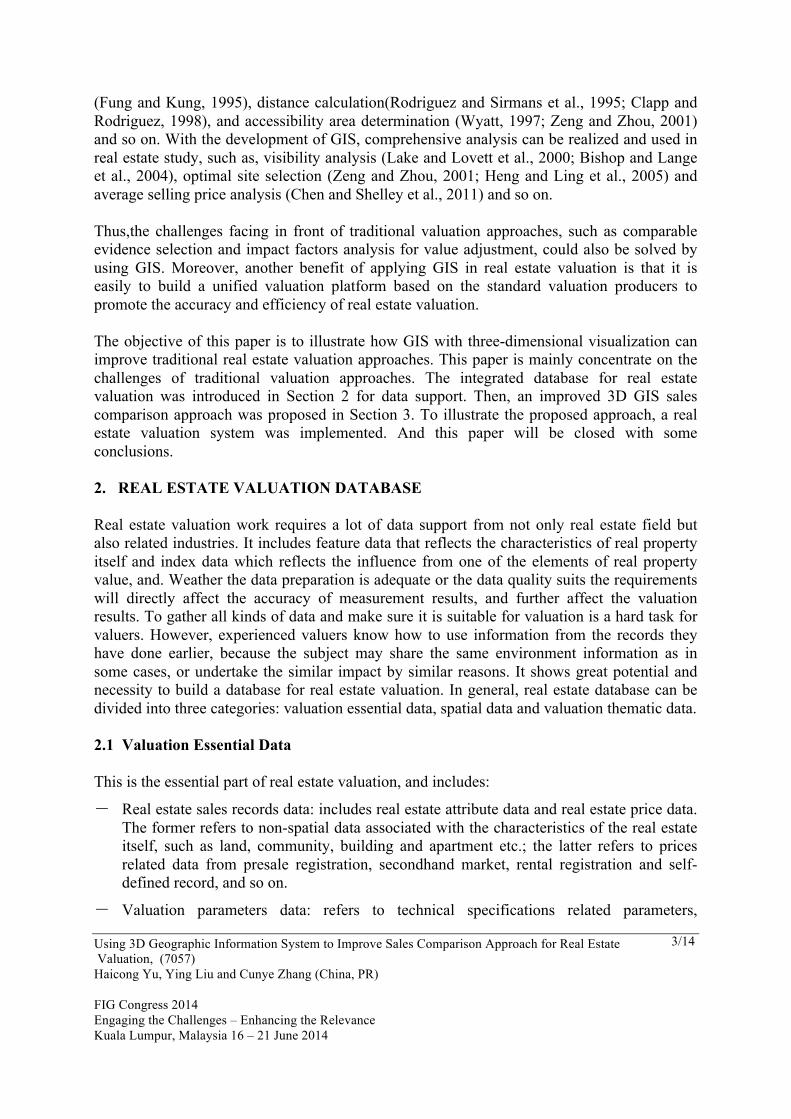
3.2.2 Quantitative table formulation Quantification study of impact factors is crucial to the accuracy of valuation results. Traditional methods mainly depend on experts’ experience and field survey which is a time and labor consuming job and could not always gather enough data. In this model, 3D GIS data management and analysis tools associate with decision making methods are used to help quantification study. The specific quantitative methods are listed below. 1) Directly adopt analysis results, or through simple transformation. This method is more operable when using spatial query and spatial statistics for factor analysis, such as the number of bus stops in 200 meters, etc. 2) Utilize Likert scale. This kind is used for those situations that variable factors can not be quantified, such as decoration. Apply GIS analysis first and then the results can be grade into a certain value. 3) Utilize comprehensive measurement index system, and scores the results. Variables such as living facilities, education facilities, environment, etc., can use this method, and spatial query, buffer analysis and spatial statistics are usually utilized in the meantime. Through the above mentioned methods, the quantitative table associated with the impact factors can be formulized. 3.2.3 Impact factors analysis based on spatial analysis GIS spatial analysis with professional analysis models are used in each factor valuation. Table 1 summarizes the analysis methods in each factor analysis process. Spatial query is a special type of database query with spatial information, which support query by location and query by attribute. An overlay operation is much more than a simple merging of different layers. All the attributes of the features taking part in the overlay are carried through. Spatial measurement calculates straight line distance and polygon area. Network analysis calculates the distance relied on network such as road network and river network. It further can realize accessibility analysis with the proper data support. Spatial statistics locate the analysis results by spatial information as well as mapping the results. Visibility analysis often used in DEM to calculate wether two points can see each other directly without any obstacles. Basically, solar shadow analysis is a kind of visibility analysis. It also considers the solar angle changing with
Using 3D Geographic Information System to Improve Sales Comparison Approach for Real Estate Valuation, (7057) Haicong Yu, Ying Liu and Cunye Zhang (China, PR) FIG Congress 2014 Engaging the Challenges – Enhancing the Relevance Kuala Lumpur, Malaysia 16 – 21 June 2014
9/14 Using
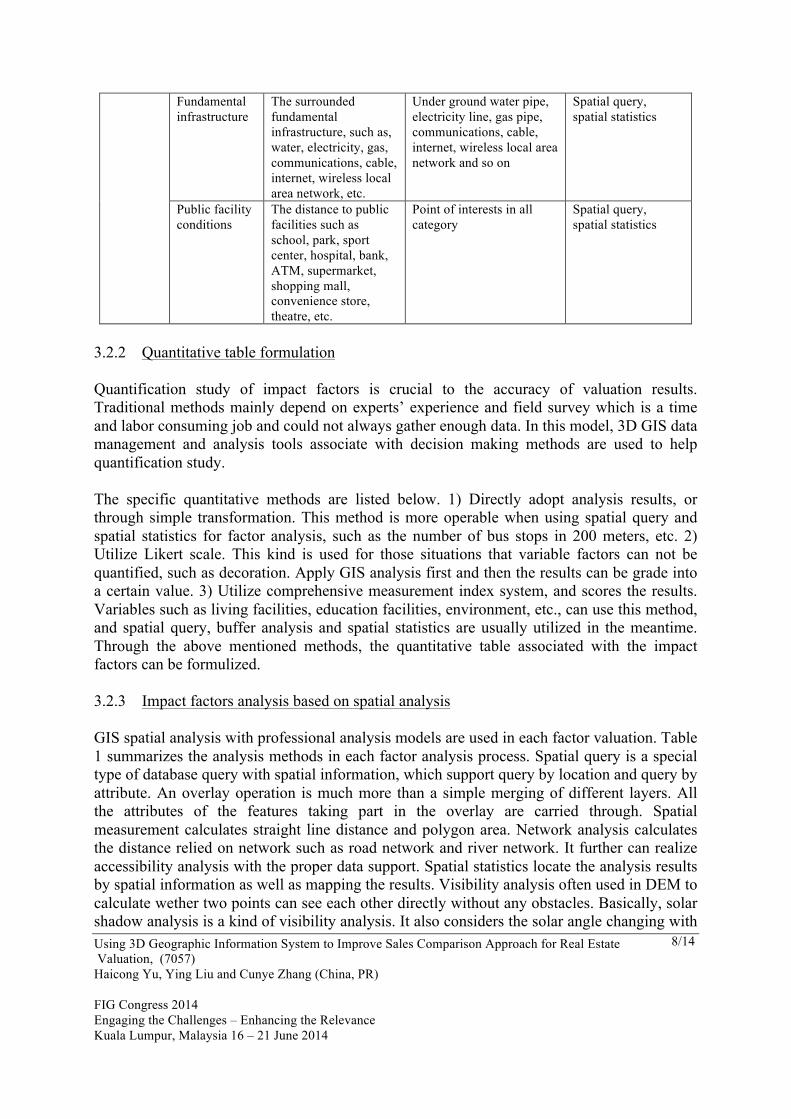
time and need DEM and 3D building data support. The noise propagation analysis and pollutants diffusion analysis are supported by professional analysis models with GIS to simulate the procedure. 3.2.4 Performance matrix formulation After analysis of each factors, the performance value are generated based on the quantitative table mentioned above. And the results are formulated as a matrix (as shown in Formula 1). In the matrix, each column represents one sale property record, while each row depicts one variable or impact factor, the performance value is represented as q.
0 1 2
1 10 11 12 1
2 20 22 22 2
0 1 2
...
...
...... ... ... ... ......
...
n
n
n
m m m m mn
A A A AB q q q qB q q q q
B q q q q
⎛ ⎞⎜ ⎟⎜ ⎟⎜ ⎟⎜ ⎟⎝ ⎠
(1)
For comparison purpose, the reference record, which defines the compare basis, should be appointed before any process. Without loss of generality, in this model, A0 is assumed as the subject property and thus assigned as the reference record. Then, due to the different performance value range in each factor, dimensionless treatment should be conducted for comparison. The practical method used in this study is to divide the performance value of subject property in each factor (as shown in Formula 2).
'
0
ijij
i
q= (2)
3.2.5 Similarity calculation After the dimensionless treatment, the comparison matrix transformed as below (omit the first column in Formula 3):
' ' '11 12 1' ' '21 22 2
' ' '1 2
...
...
...... ... ...
...
n
n
m m mn
q q qq q q
q q q
⎛ ⎞⎜ ⎟⎜ ⎟⎜ ⎟⎜ ⎟⎜ ⎟⎝ ⎠
(3)
where 'ijq describes the relevant performance of comparison sale j to subject property in
impact factor i. Thus, similarity can be calculated based on multiply of each standardized performance value.
And the similarity of sale j to the subject property is represented as '
1
m
j ijiqδ
==∏ .
Using 3D Geographic Information System to Improve Sales Comparison Approach for Real Estate Valuation, (7057) Haicong Yu, Ying Liu and Cunye Zhang (China, PR) FIG Congress 2014 Engaging the Challenges – Enhancing the Relevance Kuala Lumpur, Malaysia 16 – 21 June 2014
10/14
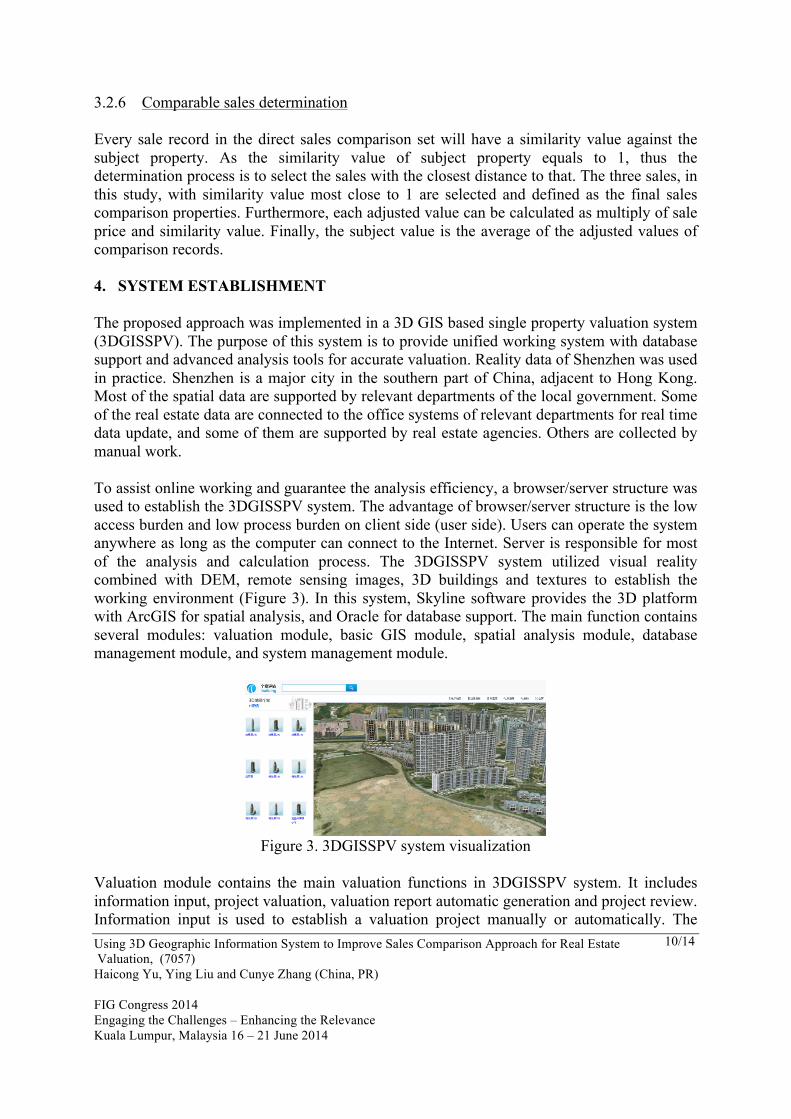
3.2.6 Comparable sales determination Every sale record in the direct sales comparison set will have a similarity value against the subject property. As the similarity value of subject property equals to 1, thus the determination process is to select the sales with the closest distance to that. The three sales, in this study, with similarity value most close to 1 are selected and defined as the final sales comparison properties. Furthermore, each adjusted value can be calculated as multiply of sale price and similarity value. Finally, the subject value is the average of the adjusted values of comparison records. 4. SYSTEM ESTABLISHMENT The proposed approach was implemented in a 3D GIS based single property valuation system (3DGISSPV). The purpose of this system is to provide unified working system with database support and advanced analysis tools for accurate valuation. Reality data of Shenzhen was used in practice. Shenzhen is a major city in the southern part of China, adjacent to Hong Kong. Most of the spatial data are supported by relevant departments of the local government. Some of the real estate data are connected to the office systems of relevant departments for real time data update, and some of them are supported by real estate agencies. Others are collected by manual work. To assist online working and guarantee the analysis efficiency, a browser/server structure was used to establish the 3DGISSPV system. The advantage of browser/server structure is the low access burden and low process burden on client side (user side). Users can operate the system anywhere as long as the computer can connect to the Internet. Server is responsible for most of the analysis and calculation process. The 3DGISSPV system utilized visual reality combined with DEM, remote sensing images, 3D buildings and textures to establish the working environment (Figure 3). In this system, Skyline software provides the 3D platform with ArcGIS for spatial analysis, and Oracle for database support. The main function contains several modules: valuation module, basic GIS module, spatial analysis module, database management module, and system management module.
Figure 3. 3DGISSPV system visualization
Valuation module contains the main valuation functions in 3DGISSPV system. It includes information input, project valuation, valuation report automatic generation and project review. Information input is used to establish a valuation project manually or automatically. The

Using 3D Geographic Information System to Improve Sales Comparison Approach for Real Estate Valuation, (7057) Haicong Yu, Ying Liu and Cunye Zhang (China, PR) FIG Congress 2014 Engaging the Challenges – Enhancing the Relevance Kuala Lumpur, Malaysia 16 – 21 June 2014
11/14
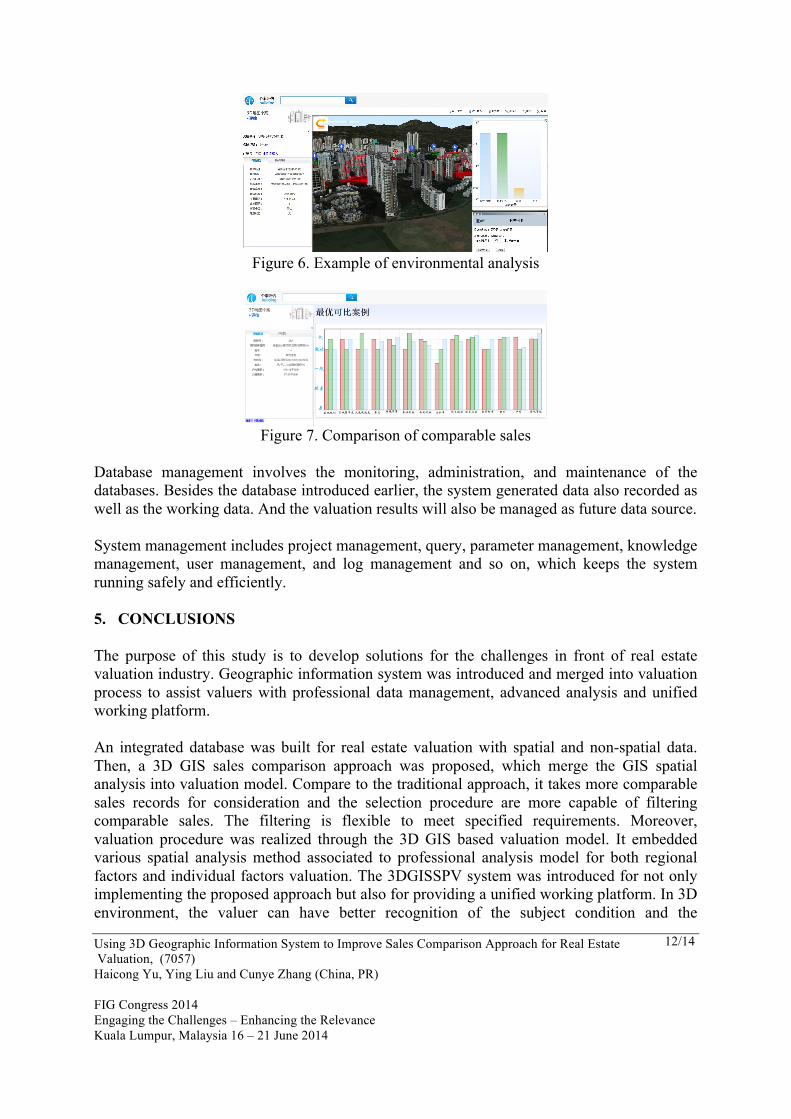
project information is stored for the record. Project valuation provides the process of valuing properties. Different valuation approaches are provided for different types of real property. And all the valuation working process is stored including data, formulae, and parameters and so on. Valuation report generation generates valuation report automatically according to different purposes and different type. It includes calculation process document, summary report, technique report and final report and so on. Then project review is an administrative process. Basic GIS module provides common functions in 3D GIS. Users can zoom into the 3D environment, browse in any view for 360 degree or fly along a predefined route, add data and control the visibility of each layer. Spatial analysis module provides all analysis functions. In 3D environment, valuation project can be located. It can query information from different layer, analyze impact factors, and select comparable sales on the map, and compare sales and so on. Figure 4-6 show some examples of analysis and Figure 7 compares the comparable sales in each factor.
Figure 4. Example of regional planning analysis
Figure 5. Example of view analysis
Using 3D Geographic Information System to Improve Sales Comparison Approach for Real Estate Valuation, (7057) Haicong Yu, Ying Liu and Cunye Zhang (China, PR) FIG Congress 2014 Engaging the Challenges – Enhancing the Relevance Kuala Lumpur, Malaysia 16 – 21 June 2014
12/14
Figure 6. Example of environmental analysis
Figure 7. Comparison of comparable sales
Database management involves the monitoring, administration, and maintenance of the databases. Besides the database introduced earlier, the system generated data also recorded as well as the working data. And the valuation results will also be managed as future data source. System management includes project management, query, parameter management, knowledge management, user management, and log management and so on, which keeps the system running safely and efficiently. 5. CONCLUSIONS The purpose of this study is to develop solutions for the challenges in front of real estate valuation industry. Geographic information system was introduced and merged into valuation process to assist valuers with professional data management, advanced analysis and unified working platform. An integrated database was built for real estate valuation with spatial and non-spatial data. Then, a 3D GIS sales comparison approach was proposed, which merge the GIS spatial analysis into valuation model. Compare to the traditional approach, it takes more comparable sales records for consideration and the selection procedure are more capable of filtering comparable sales. The filtering is flexible to meet specified requirements. Moreover, valuation procedure was realized through the 3D GIS based valuation model. It embedded various spatial analysis method associated to professional analysis model for both regional factors and individual factors valuation. The 3DGISSPV system was introduced for not only implementing the proposed approach but also for providing a unified working platform. In 3D environment, the valuer can have better recognition of the subject condition and the

Using 3D Geographic Information System to Improve Sales Comparison Approach for Real Estate Valuation, (7057) Haicong Yu, Ying Liu and Cunye Zhang (China, PR) FIG Congress 2014 Engaging the Challenges – Enhancing the Relevance Kuala Lumpur, Malaysia 16 – 21 June 2014
13/14
environment before field work. In addition, more accuracy analysis results can be achieved. The practical use of 3DGISSPV system shows that more relevant data can be well collected and managed, which further promotes the data usage and data sharing in real estate field. Second, it highly improves the working efficiency and the valuation accuracy, which further enhances the credibility of real estate valuation work. To sum up, the combination of 3D GIS with real estate valuation shows great benefits to promote valuation approaches, and eventually, it will promote the informatization of the entire property valuation industry. REFERENCES Bishop, I. D. and Lange, E., et al., 2004, Estimation of the influence of view components on high-rise apartment pricing using a public survey and GIS modeling, Environment and Planning B: Planning and Design, 31, 439-452. Chen, K. and Shelley, G., et al., 2011, A Geospatial Analysis of the Average Selling Price for New Apartments in Hangzhou, China, Journal of Housing Research, 20, 19-34. Clapp, J. and Rodriguez, M., 1998, Using a GIS for Real Estate Market Analysis: The Problem of Spatially Aggregated Data, Journal of Real Estate Research, 16, 35-56. Fung, D. S. and Kung, H., 1995, The application of GIS to mapping real estate values, Appraisal Journal, 63, 445. Heng, L. and Ling, Y., et al., 2005, A GIS-based site selection system for real estate projects., Construction Innovation (Sage Publications, Ltd. ), 5, 231-241. Lake, I. R. and Lovett, A. A., et al., 2000, Using GIS and large-scale digital data to implement hedonic pricing studies, International Journal of Geographical Information Science, 14, 521-541. Rodriguez, M. and Sirmans, C. F., et al., 1995, Using Geographic Information Systems to Improve Real Estate Analysis, Journal of Real Estate Research, 10, 163-174. Ron, F. and Prill, E., et al., 2001, The use of Geographic Information Systems by corporate real estate executives, Journal of Real Estate Research, 22, 153-164. Thrall, G. I., 1998, GIS applications in real estate and related industries, Journal of Housing Research, 9, 33-59. Wallner, R., 2012, GIS Measures of Residential Property Views, Journal of Real Estate Literature, 20, 225-224. Wofford, L. and Thrall, G., 1997, Real Estate Problem Solving and Geographic Information Systems: A Stage Model of Reasoning, Journal of Real Estate Literature, 5, 177-201. Wyatt, P. J., 1997, The development of a GIS-based property information system for real estate valuation, International Journal of Geographical Information Science, 11, 435-450. Yang, P. P. and Putra, S. Y., et al., 2007, Viewsphere: a GIS-based 3D visibility analysis for urban design evaluation, Environment and Planning B: Planning and Design, 34, 971-992. Yu, S. and Han, S., et al., 2007, Modeling the value of view in high-rise apartments: a 3D GIS approach, Environment and Planning B: Planning and Design, 34, 139-153. Zeng, T. Q. and Zhou, Q., 2001, Optimal spatial decision making using GIS: a prototype of a real estate geographical information system (REGIS), International Journal of Geographical Information Science, 15, 307-321.

Using 3D Geographic Information System to Improve Sales Comparison Approach for Real Estate Valuation, (7057) Haicong Yu, Ying Liu and Cunye Zhang (China, PR) FIG Congress 2014 Engaging the Challenges – Enhancing the Relevance Kuala Lumpur, Malaysia 16 – 21 June 2014
14/14
BIOGRAPHICAL NOTES Haicong Yu obtained his PhD from Chinese Academy of Sciences in 2012. He joined Center for Assessment and Development of Real Estate, Shenzhen in 2012 as GIS engineer. His current research focuses on GIS applications in Real Estate, spatial analysis and modeling. Ying Liu is the deputy manager of department of regional assessment, Center for Assessment and Development of Real Estate, Shenzhen. She obtained her B. Eng. from Shenzhen University. She is a senior engineer, certified real estate appraiser,CREA member, and registered cost engineer. Cunye Zhang is purchasing his M.Eng. at Wuhan University major in GIS. He will graduate in June, 2014. He jointed Center for Assessment and Development of Real Estate, Shenzhen in 2013 as an intern. His current research focuses on GIS application and Remote Sensing image processing. CONTACTS Dr. Haicong Yu Department of Regional Assessment Center for Assessment and Development of Real Estate, Shenzhen 8007 Honglixi Road, Futian District Shenzhen, Guangdong P. R. China 518040 Tel. +86 755 23930580 Fax + 86 755 83139019 Email: [email protected] Web site: www.szpgzx.com