using 4d modeling to advance construction visualization in
TRANSCRIPT
Computer Integrated Construction Research Program Department of Architectural Engineering
The Pennsylvania State University 104 Engineering Unit A
University Park, PA 16802
USING 4D MODELING TO ADVANCE CONSTRUCTION VISUALIZATION IN ENGINEERING EDUCATION
by Lingyun Wang
Technical Report No. 51
May 2007
© 2003 Lingyun Wang
iii
ABSTRACT
Students in construction and engineering disciplines typically learn how to
develop a building construction schedule by visualizing 2D design documents for a
building project. This learning process is difficult since a student first needs to associate
components in the 2D documents with their related construction activities, and then
mentally visualize the construction sequence. 4D modeling technologies, visually
representing the construction schedule time along with the 3D model components, has the
potential to aid this learning process by providing a common visual language for students.
This research examines the value of implementing 4D modeling technologies in
construction engineering education for learning how to develop building construction
schedules, and the associated concepts regarding sequencing and resource utilization.
This research also targeted the development of a new process for creating a 4D model
which is implemented in the Virtual Construction Simulator (VCS) application. This
approach allows a student to generate a construction schedule directly from a 3D model
without first creating a critical path method (CPM) schedule, which is required by current
commercial 4D modeling applications.
To assess the effectiveness of using 4D modeling to visualize a construction
schedule, a case study research project was performed where small student groups
developed a construction schedule with the aid of a 4D learning module. The 4D
learning modules were developed using two different 4D modeling applications (a
commercial 4D modeling application and the VCS). An experiment was conducted to
assess, compare and determine the pedagogical value of the two applications.
The 4D learning modules were found to be beneficial based on quality of the
resulting solutions presentation effectiveness, and the perception of the students. The
VCS application was more valuable than the commercial 4D application since it
encouraged more collaborative group work, engaged students, and provided a greater
focus on solution development.

iv
TABLE OF CONTENTS
LIST OF FIGURES .....................................................................................................viii
LIST OF TABLES.......................................................................................................x
Chapter 1 Introduction ..............................................................................................1
1.1 Current Construction Schedule Visualization in Engineering Education......3 1.2 Current 4D Model Generation Process..........................................................4 1.3 Description of the Research Problem ............................................................6
1.3.1 Research Goal......................................................................................6 1.3.2 Objectives ............................................................................................7 1.3.3 Research Approach..............................................................................8 1.3.4 Research Steps.....................................................................................9 1.3.5 Research Contributions .......................................................................11 1.3.6 Research Scope....................................................................................11
1.4 Thesis Organization .......................................................................................12
Chapter 2 Research Methodology.............................................................................14
2.1 Research Methods Introduction......................................................................14 2.2 Research Techniques ......................................................................................15
2.2.1 Case Study ............................................................................................15 2.2.2 Controlled Experiment .........................................................................16 2.2.3 Direct Observation................................................................................17 2.2.4 Survey...................................................................................................18 2.2.5 Content Analysis ..................................................................................19 2.2.6 Inter-rater Reliability Test ....................................................................19
2.3 Research Process ............................................................................................22 2.3.1 Literature Review .................................................................................22 2.3.2 Development, Incorporation and Evaluation of a Preliminary 4D
Learning Module ....................................................................................22 2.3.3 Identification of Assessment Parameters..............................................23 2.3.4 Development and Incorporation of the VCS ........................................23 2.3.5 Assessment of the VCS ........................................................................24 2.3.6 Documentation of Conclusions and Lessons Learned..........................24
Chapter 3 Literature Review.....................................................................................25
3.1 Construction Schedule Visualization.............................................................25 3.1.1 Traditional 2D CAD & CPM Scheduling ...........................................25
v
3.1.2 3D CAD Visualization ........................................................................27 3.1.3 4D CAD...............................................................................................28
3.1.3.1 Definition of 4D CAD...............................................................28 3.1.3.2 Development of A 4D Model....................................................29 3.1.3.3 Benefits of 4D CAD..................................................................29 3.1.3.4 4D CAD Applications in Construction Projects .......................32
3.2 Design and Construction Team Communication...........................................35 3.3 Virtual Reality ...............................................................................................40
3.3.1 Definition of Virtual Reality ...............................................................40 3.3.2 Virtual Reality Display........................................................................41 3.3.3 VR Used in Engineering Education ....................................................43
3.4 Summary........................................................................................................45
Chapter 4 Case Study and Preliminary 4D Learning Module ..................................47
4.1 The Case Study Project..................................................................................47 4.1.1 SIPS Method Introduction...................................................................47 4.1.2 MGM Grand Hotel Renovation Project ..............................................48
4.2 Previous Offering of the MGM Grand Hotel SIPS Assignment ...................49 4.3 The Preliminary 4D Learning Module ..........................................................50
4.3.1 Development of the Preliminary 4D Learning Module.......................50 4.3.2 Incorporation of the Preliminary 4D Learning Module ......................51 4.3.3 Assessment of the Preliminary 4D Learning Module .........................52
4.3.3.1 Assessment of the Final Solution Quality .................................52 4.3.3.2 Observation of the SIPS Presentation and Discussion ..............54 4.3.3.3 Student Perceptions ...................................................................55
4.4 Metrics for Future Module Assessment.........................................................56
Chapter 5 Virtual Construction Simulator ................................................................58
5.1 The Interface..................................................................................................58 5.1.1 Basic Components ...............................................................................59 5.1.2 Main Program Functions .....................................................................61
5.2 The Development Process .............................................................................66 5.2.1 The Modeling ......................................................................................66 5.2.2 The Programming................................................................................68 5.2.3 The SQL Database...............................................................................69 5.2.4 Summary of the Development Process................................................75
Chapter 6 Assessment of the Virtual Construction Simulator ..................................77
vi
6.1 The Experiment .............................................................................................77 6.1.1 Display Systems ..................................................................................77 6.1.2 Experiment Procedures........................................................................79
6.2 Data Collection ..............................................................................................82 6.2.1 Data for Measuring Group Process .....................................................82 6.2.2 Data for Measuring Group Product .....................................................85 6.2.3 Data for Measuring Student Perspectives............................................86
6.3 Data Analysis & Results................................................................................87 6.3.1 Video Analysis & Results ...................................................................87
6.3.1.1 Coding Scheme .........................................................................87 6.3.1.2 Reliability Test ..........................................................................92 6.3.1.3 Video Analysis Results .............................................................94
6.3.2 Quality of the Initial Schedule, Final Schedule and SIPS Assignment.............................................................................................96
6.3.3 Survey Results .....................................................................................97 6.3.4 Summary of the Experiment Results ...................................................105
Chapter 7 Conclusions ..............................................................................................107
7.1 Research Summary .........................................................................................107 7.2 Research Contributions...................................................................................108
7.2.1 Identification of the Value of 4D learning Modules in Engineering Education................................................................................................108
7.2.2 Advancement of the Current 4D Model Generation Process ...............109 7.2.3 Time Study of Group Communications for Two Different 4D
Generation Processes..............................................................................109 7.3 Limitations......................................................................................................110
7.3.1 Limited Case Study Application ..........................................................110 7.3.2 VCS Interface Limitations....................................................................111
7.4 Future Research ..............................................................................................111 7.4.1 An Improved VCS................................................................................111 7.4.2 Paper-based Scheduling Process Communication................................112 7.4.3 Effect of the 3-Screen Display System.................................................113 7.4.4 Construction Plan Communication......................................................113 7.4.5 Implementation of the VCS on Complex Projects ..............................113
7.5 Concluding Remarks ......................................................................................114
Bibliography ................................................................................................................115
Appendix A MGM Assignment Scoring Rubrics.....................................................121
Appendix B Schedule Evaluation Sheet ...................................................................122

vii
Appendix C AE 473 SIPS Exercise Survey I ...........................................................123
Appendix D AE 473 SIPS Exercise Survey II..........................................................126

viii
LIST OF FIGURES
Figure 1: Current 4D Modeling Process ......................................................................5
Figure 2: The Virtual Construction Simulator as a Schedule Generation Tool...........6
Figure 3: Figure 3 Sequence of Design Activities for Two Design Teams during the Same Design Session ..............................................................................36
Figure 4: Current and Future Communication Diagram..............................................38
Figure 5: Time Spent of Decision Making Tasks on Design Development, Scheduling and Value Engineering Meetings...............................................39
Figure 6: ICon Lab Rendering .....................................................................................43
Figure 7: MGM Grand Hotel Construction Site ..........................................................49
Figure 8: 2D Plan of a Typical Floor ...........................................................................50
Figure 9: 3D Model of a Typical Floor and Schedule Template in MS Project..........51
Figure 10: A Student Group Presentation in the ICon Lab from 2005........................52
Figure 11 Student Perception Surveys from 2005 Regarding the Benefits of 4D Modeling.......................................................................................................57
Figure 12: Virtual Construction Simulator Interface ...................................................59
Figure 13: Group Function...........................................................................................62
Figure 14: Create Function ..........................................................................................63
Figure 15: Sequence Function .....................................................................................64
Figure 16: MGM Grand Hotel 3D Model....................................................................67
Figure 17: Lisp Editor in Deep Creator .......................................................................68
Figure 18: Object Table of the Database .....................................................................71
Figure 19: Activity Table of the Database...................................................................72
Figure 20: Relationship of the Four Tables .................................................................73
Figure 21: Sequence Table of the Database.................................................................74

ix
Figure 22: Timer Table of the Database ......................................................................75
Figure 23: Workflow of the VCS Development Process.............................................76
Figure 24: Display Systems in the ICon Lab ...............................................................78
Figure 25: One Control Group.....................................................................................80
Figure 26: One Experimental Group............................................................................81
Figure 27: Group Presentation of a 4D Model in Class...............................................82
Figure 28: Audio & Video Recording Equipment.......................................................84
Figure 29: Group Process Coding Scheme ..................................................................88
Figure 30: Inter-rater Reliability Test Result...............................................................94
Figure 31: Comparison of the 3D Model Value ..........................................................99
Figure 32: Comparison of the 3D Model Utilization...................................................100
Figure 33: Comparison of Idea Generation .................................................................100
Figure 34: Comparison of the Group Communication ................................................101
Figure 35: Comparison of the Group Common Focus.................................................101
Figure 36: Comparison of the Initial Confidence ........................................................102
Figure 37: Comparison of effectiveness of the Schedule Review ...............................102
Figure 38: Comparison of the Extent Students Enjoyed the Schedule Development Process ........................................................................................................103
Figure 39: Ease of Presenting Solutions ......................................................................103
Figure 40: Ease of Understanding Alternatives ...........................................................104
Figure 41: Ease of Understanding SIPS.......................................................................104
x
LIST OF TABLES
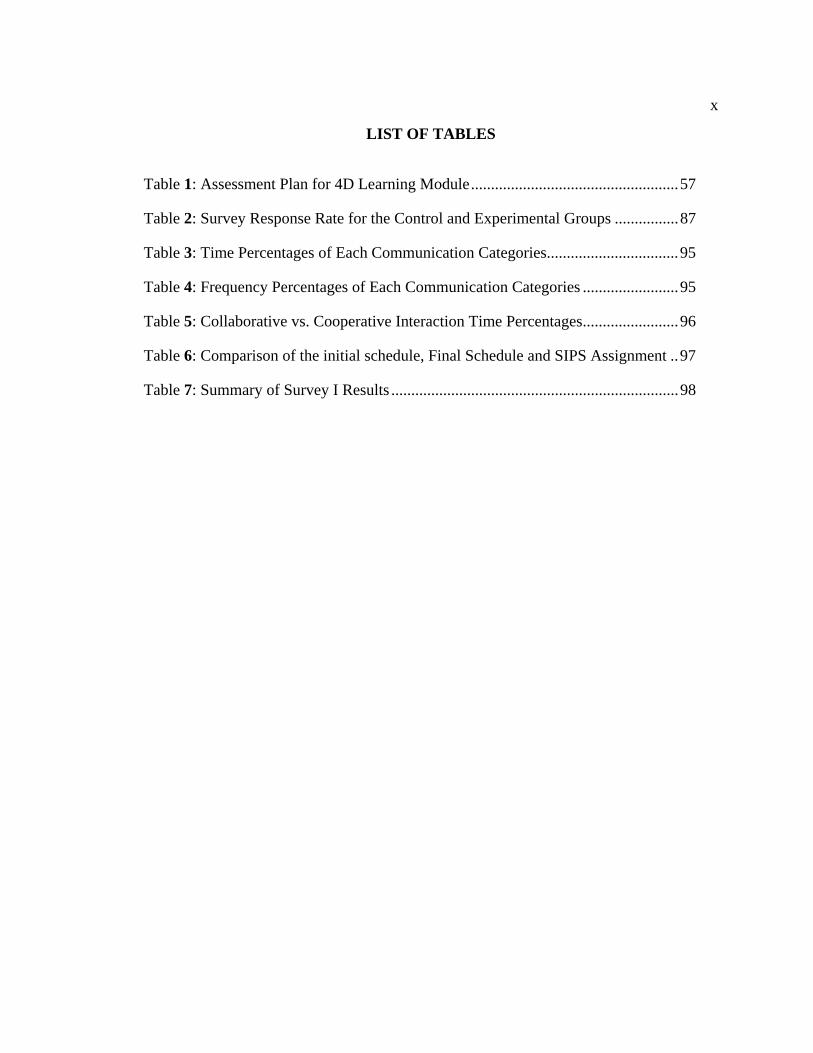
Table 1: Assessment Plan for 4D Learning Module....................................................57
Table 2: Survey Response Rate for the Control and Experimental Groups ................87
Table 3: Time Percentages of Each Communication Categories.................................95
Table 4: Frequency Percentages of Each Communication Categories ........................95
Table 5: Collaborative vs. Cooperative Interaction Time Percentages........................96
Table 6: Comparison of the initial schedule, Final Schedule and SIPS Assignment ..97
Table 7: Summary of Survey I Results ........................................................................98

xi
ACKNOWLEDGEMENTS
I would like to thank all those who gave me the opportunity to complete this
thesis. I would like to express my deep and sincere gratitude to my advisor, Dr. John
Messner. His deep knowledge, insights regarding this research, stimulating suggestions
and compassion have been of great value for me. His encouragement and support have
provided strong motivation for all the time put into my research and writing this thesis.
Sincere thanks to Dr. David Riley and Dr. John Wise for showing great
enthusiasm in my research, providing their valuable suggestions and managing to provide
such thorough feedback on my thesis.
This research would not have been possible without the friendship, support and
help of the all the CIC Research group members: Rob Leicht, Kurt Maldovan, Russ
Manning, Dragana Nikolic, Nevena Zikic and Alexandre Zolotov. I also would like to
thank Clement Fung who helped me with my MGM Grand Hotel model and all of the
undergraduate students who participated in my research.
I am very grateful to my friend, Qiankun Zhao, who helped me with my
programming. Special thanks to my friends, Hien T. Nguyen and Kyu Yon Lim, for
stimulating discussions of my research.
Finally, I want to say 'thank-you' to all my friends and family. I am most
grateful to my husband, Guoliang Jiang and my parents for their everlasting
encouragement and support.

Chapter 1
Introduction
When a student in design and engineering disciplines is learning to develop a
construction schedule for a building, they will typically develop the schedule by
interpreting 2D drawings, identifying activities and building a logic sequence network.
Developing a construction schedule is difficult since one has to construct the building
step-by-step in their mind after visualizing the 2D drawings. 4D modeling technologies,
visually representing the construction schedule time along with the 3D model
components, can provide a common visual language for students when learning how to
develop construction schedules for buildings.
Benefits of 4D modeling technology used in the Architecture, Engineering and
Construction (AEC) Industry have been studied and documented in recent years. 4D
modeling allows project teams to visualize construction plans; identify construction
consequences and space conflicts; identify safety issues; and improve communication of
the project team members (Koo and Fischer 2000). While there are an increasing
number of successful applications of 4D modeling in the AEC Industry, its
implementation in engineering education is still limited. This research focused on the
implementation of this visualization tool in construction engineering education and the
quantitative assessment establishing its effectiveness.
In addition to investigating the effectiveness of the implementation of current 4D
modeling tools in construction engineering education, this research also focused on

2
advancing the current 4D model generation process by developing a Virtual Construction
Simulator (VCS) application. This VCS allows a student group to generate a
construction schedule directly from a 3D model instead of first having to develop a CPM
schedule for a project, and then perform an additional step to connect the schedule to the
3D model components. The educational value of the VCS in construction engineering
education was assessed in comparison to a current commercial 4D modeling application.
To assess the effectiveness of using a 4D model to visualize a construction
schedule, a case study research project was undertaken where small student groups
developed a construction schedule with the aid of a 4D learning module. The value of
the 4D model learning module was examined by investigating a small student group
activity. The value was assessed by investing the groups effectiveness based on their
group communication and interaction; evaluating their final activity results; and
investigating the student perception of their learning experience and the impact of the
technology.
This chapter introduces the current construction schedule visualization techniques
used in engineering education and the current status of 4D modeling process, and
describes the limitations of using these techniques and process. Then, it provides a
description of this research study with a discussion of the research goal, objectives,
research questions, research steps, research contributions and scope. It concludes with a
discussion of the thesis organization.
3
1.1 Current Construction Schedule Visualization in Engineering Education
2D drawings and Critical Path Method (CPM) schedules are the traditional tools
used in the construction engineering discipline to analyze a project design and plan the
construction of the project. Individuals require training to interpret 2D drawings and
visualize projects based on their previous experience and knowledge. With building
geometry getting more and more complex, even experienced construction planners can
misinterpret the designer’s intention, which can lead to poor construction plans which
cause an increase in time and project cost.
To generate a CPM schedule from a set of 2D drawings, construction planners
need to associate components in 2D drawings with their related construction activities
and build their sequential relationships mentally. Such schedules force planners to
visualize and interpret the activity sequence in their minds. Also, some planners will
have different interpretations of the same schedule, which makes it difficult to
communicate and discuss whether a certain problem actually existed or not. So it is
difficult to conceptualize the construction process and detect problems by viewing the
CPM schedule alone, especially for a novice with limited construction experience.
With recent advancements in 4D modeling technologies, it is now possible to
provide our students with visual models that allow them to experience and experiment
with 3D and 4D virtual models of construction projects. This advanced visual
communication can significantly improve the ability of students to comprehend, learn,
and gain experience with reviewing designs for constructability and planning the
construction of complex building and infrastructure projects. The models can also help

4
students improve their visualization skills so that they will be more prepared to interpret
and visualize 2D drawings in 3D.
4D model development has already been implemented in undergraduate
Architectural Engineering Department at Penn State. In a previous study, the
educational value of having students develop 4D models for a building project using a
desktop computer monitor was assessed, and it was found that the 4D models can
enhance the ability for students to understand typical planning documents (Messner et al.
2003). By using 4D models, students can visualize the built environment and gain
experience and intuition related to construction method selection, construction
sequencing, site planning, and site logistics.
1.2 Current 4D Model Generation Process
The current process used to develop a 4D model is:
1. Develop or obtain a 3D model;
2. Develop a construction CPM schedule;
3. Separate the 3D model into appropriate construction assemblies; and
4. Link the 3D model components with their corresponding activities specified in
the CPM schedule in a 4D modeling application.
Once the 3D model and the schedule are linked, the 4D model can be viewed as a visual
simulation of the construction process for the project.
One limitation of the current 4D modeling process is that it requires additional
time to develop the model since a planner must first generate a schedule, and then link
5
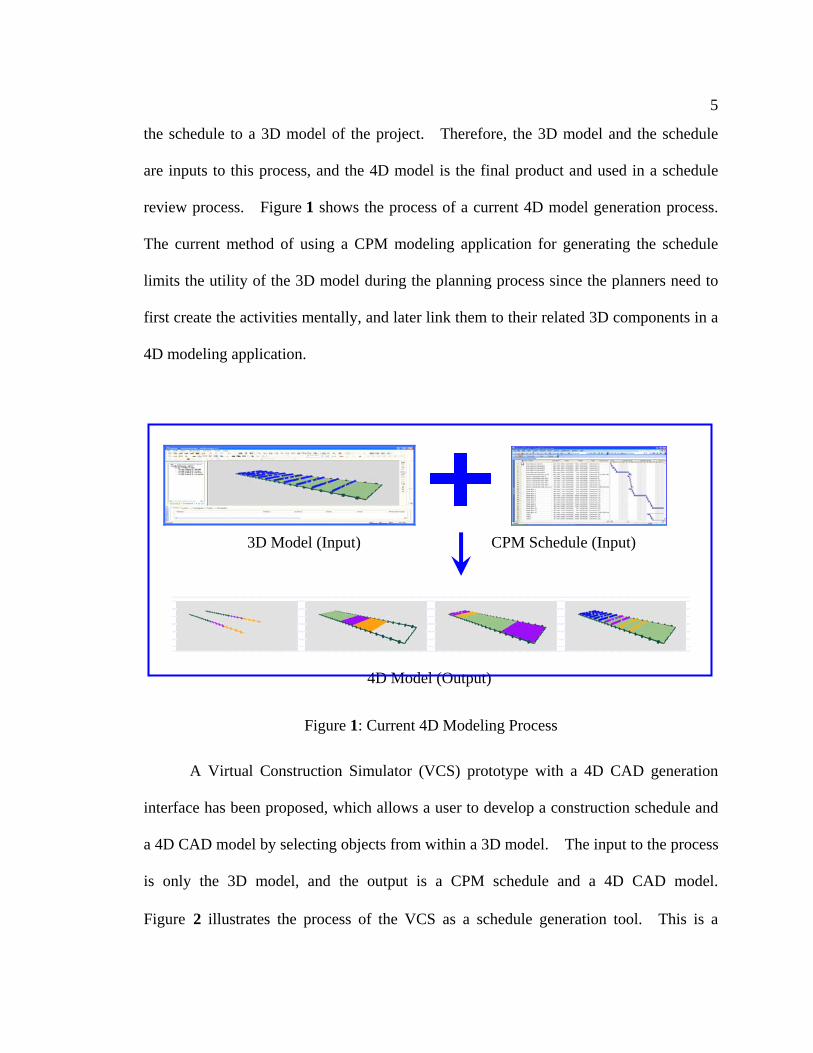
the schedule to a 3D model of the project. Therefore, the 3D model and the schedule
are inputs to this process, and the 4D model is the final product and used in a schedule
review process. Figure 1 shows the process of a current 4D model generation process.
The current method of using a CPM modeling application for generating the schedule
limits the utility of the 3D model during the planning process since the planners need to
first create the activities mentally, and later link them to their related 3D components in a
4D modeling application.
3D Model (Input) CPM Schedule (Input)
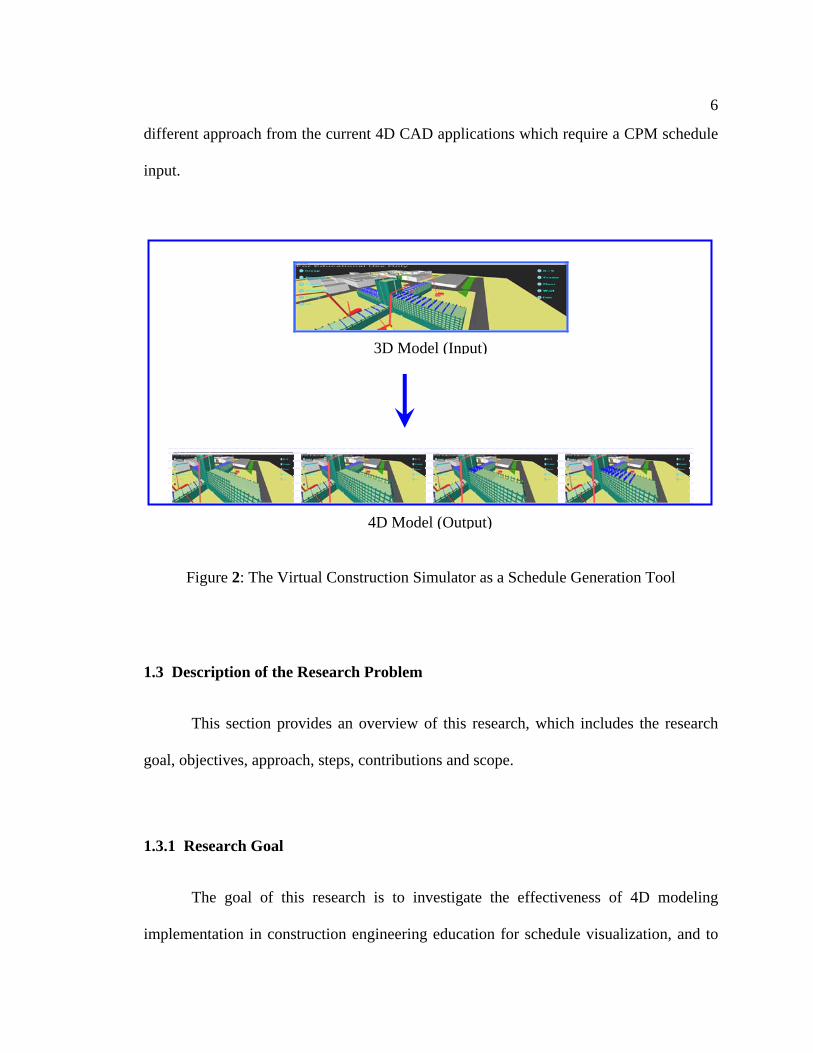
A Virtual Construction Simulator (VCS) prototype with a 4D CAD generation
interface has been proposed, which allows a user to develop a construction schedule and
a 4D CAD model by selecting objects from within a 3D model. The input to the process
is only the 3D model, and the output is a CPM schedule and a 4D CAD model.
Figure 2 illustrates the process of the VCS as a schedule generation tool. This is a
4D Model (Output)
Figure 1: Current 4D Modeling Process
6
different approach from the current 4D CAD applications which require a CPM schedule
input.
3D Model (Input)
4D Model (Output)
Figure 2: The Virtual Construction Simulator as a Schedule Generation Tool
1.3 Description of the Research Problem
This section provides an overview of this research, which includes the research
goal, objectives, approach, steps, contributions and scope.
1.3.1 Research Goal
The goal of this research is to investigate the effectiveness of 4D modeling
implementation in construction engineering education for schedule visualization, and to

7
advance the current state of 4D modeling techniques by developing a Virtual
Construction Simulator (VCS) prototype application for implementation in engineering
education.
1.3.2 Objectives
To achieve the goal of this research, the following objectives were completed:
1. Investigate the value of current 4D modeling tools used for schedule
visualization in construction engineering education. A preliminary 4D
learning module was developed and implemented in an advanced project
management course at Penn State to aid students in the development of a
construction schedule. An initial assessment plan was used to evaluate the
effectiveness of the 4D learning module in comparison to paper based
schedule generation.
2. Develop a VCS that advances the current 4D model generation process.
The VCS was developed to allow students to interactively generate a
construction schedule (in a 4D model format) directly from a 3D model.
The objective is to allow rapid 4D model generation for alternative
construction schedules so that the schedule can be visualized, assessed,
justified and optimized in an efficient and visual manner.
3. Assess the impact of the VCS compared to the current 4D modeling process
in engineering education. Based on the experience of implementing the
preliminary 4D learning module, assessment metrics were identified and a
8
detailed assessment plan was utilized to evaluate the value of the VCS
compared to current 4D modeling applications used in construction
engineering education. This was performed through a case study evaluation
of small group effectiveness.
1.3.3 Research Approach
Since 4D model implementation in engineering education is limited, this research
was first established as an exploratory investigation to study the value of 4D model
implementation for schedule visualization through a case study methodology. Through
this exploratory study, the value of 4D modeling and important metrics for assessing its
effectiveness were identified.
In addition to exploring the educational value of current 4D modeling tools, A
VCS was developed and its value in engineering education was assessed. A hypothesis
testing method was used to evaluate the effectiveness of the VCS in construction
engineering education in comparison to current 4D modeling applications. The
hypothesis for this research is that the VCS application, when compared with a current
4D modeling application, is more effective in improving small student group
communication and interaction; help students develop higher quality construction
schedules, and contribute to the student enjoyment during the schedule learning
experience.
The following questions were set forth for this research:
9
1. How effective are current 4D modeling tools for aiding students to
visualize and develop construction schedules? What are the potential
opportunities for improving the current 4D modeling tools?
2. What parameters should be used to examine the value of 4D modeling in
construction schedule visualization?
3. What are the additional values gained by using the proposed VCS for
learning scheduling in construction engineering education?
4. What is the perception of students towards 4D modeling tools?
1.3.4 Research Steps
This research aims to evaluate the value of 4D modeling used in construction
schedule visualization and advance the current 4D process. The research steps are as
follows:
1. Literature review: A literature review was conducted in the areas of
construction schedule visualization, design and construction team
communications, virtual reality, and virtual reality applications in
engineering education.
2. Development, incorporation and evaluation of a preliminary 4D learning
module: A preliminary 4D learning module was developed which required
students to use a commercial 4D modeling application for analyzing their
construction sequence solution for an assignment. This assignment was
implemented in a 5th year project management course at Penn State. The
10
value of the learning module was assessed and student perspectives of this
technique were investigated.
3. Identification of assessment parameters: By conducting the exploratory
research, the researcher was able to identify critical parameters that can be
used to evaluate 4D modeling learning modules used in engineering
education.
4. Development, incorporation and evaluation of the VCS: The VCS was
developed using a commercial 3D game engine. The interface was
assessed through an experiment where 5 student groups used the VCS and
5 groups used a commercial 4D modeling application for reviewing a
schedule generated in a CPM application.
5. Data collection and analysis: While performing Step 4, student group
activities were observed and videotaped. A detailed content analysis was
conducted to analyze the videos. Quantitative and qualitative surveys
were taken to measure students’ perspectives of two different interfaces
and the quality of the final schedules was assessed.
6. Documentation of conclusions and lessons learned: By conducting a
preliminary study and an experiment to compare the VCS and the current
4D modeling process, the value of the VCS and the current 4D model
applications used in engineering education was identified. Suggestions
and recommendations for improvements were documented in the results.
This will help guide future research and implementation efforts.
11
1.3.5 Research Contributions
The primary research contributions of this research are:
1. A VCS prototype which advances the current process of 4D model generation.
Instead of focusing on improving the efficiency of developing a 4D model from a
3D model and an existing construction schedule, the VCS prototype allows a user
to generate a CPM schedule and a 4D model by interacting with a 3D model of a
building.
2. An assessment plan used to evaluate the effectiveness of a 4D modeling learning
activity.
3. A detailed study of student group meetings which describes the frequencies/time
of different categories of communications.
4. Documentation of the experiences and lessons learned from the student exercise,
including students’ perceptions of 4D learning tools and suggestions for
improvements.
1.3.6 Research Scope
This research focuses on understanding the value of 4D modeling in engineering
education, specifically for construction schedule visualization. Two different 4D
modeling interfaces: a commercial 4D modeling application and the VCS were evaluated
regarding their values in aiding engineering students in the scheduling and planning
process. Though the case study selected was a special repetitive scheduling method (the
Short Interval Production Scheduling (SIPS) technique), the 4D model generation process
12
would be the same for a non-repetitive scheduling activity. It is also important to note
that both interfaces have only been tested through the detailed analysis of one case study
project and they have not been tested on a large scale project.
1.4 Thesis Organization
This thesis is divided into three sections. The first three chapters explain the
concept and need for 4D model implementation and advancement in construction
engineering education. This chapter has presented an overview of this research.
Chapter Two describes the detailed research techniques used for this study. Chapter
Three summarizes the existing relevant literature for this study, including literature on 4D
modeling, design and construction plan communication, and virtual reality displays and
applications in engineering education.
The second section of the thesis consists of Chapters Four through Seven, which
focus on the development, implementation and evaluation of 4D modeling (current 4D
modeling and VCS) learning modules. Chapter Four describes the case study project
and the preliminary 4D learning module development and incorporation. Chapter Five
presents the interface and the development process of the VCS. Chapter Six introduces
the experiment conducted to evaluate the value of the VCS in comparison to a current 4D
modeling tool. Chapter Seven describes the data collection and analysis process and
results.

13
The final section of the thesis is contained in Chapter Eight. This chapter
provides a summary of research results, the research limitation, and an outline for future
research in this area.

Chapter 2
Research Methodology
This chapter describes the methods and techniques used for conducting this
research. The basis for the selection of the research methods is also presented. This
chapter concludes with a detailed description of the research process.
2.1 Research Methods Introduction
Research can be divided into three main categories: exploratory, hypothesis
testing and problem solving (Phillips and Pugh 2000). The research methods designed
for this research are a hybrid of exploratory and hypothesis testing approaches.
Exploratory research is often conducted because a problem has not been clearly
defined as yet, or its real scope is as yet unclear at the outset of the project. It is usually
used to investigate little understood problems, identify important variables or generate
hypotheses for future research. This research aims to investigate the value of using 4D
modeling in construction engineering education. Since limited research has been
conducted in this area, an exploratory research method was extensively used in this
research. Two common research strategies used in an exploratory research are field
studies and case studies (Marshall and Rossman 1999). With consideration of this
specific research topic, a case study method was selected.
15
Hypothesis testing research usually takes place in a structured environment with
clear measurement criteria. A hypothesis predicts an experimental outcome and it is
made without knowing whether or not it is correct. An experiment is usually performed
to support or deny a hypothesis. The hypothesis for this research is that the VCS
interface is more effective in improving small student group effectiveness in schedule
visualization than a current 4D modeling application. To test this hypothesis, an
experiment was conducted, where 5 student groups using the VCS interface and 5 groups
using a current 4D modeling application generated a SIPS for a case study project.
2.2 Research Techniques
Research techniques used in the research process are detailed in the following
sections. These techniques include a case study, controlled experiment, direct
observations, surveys, content analysis, and reliability test.
2.2.1 Case Study
“A case study is an empirical inquiry that investigates a contemporary
phenomenon within its real-life context, especially when the boundaries between
phenomenon and context are not clearly evident” (Yin 2003). It encourages in-depth
investigations of particular instances within the research subject (Fellows and Liu 2003).
The case study method is very useful for exploratory research since an exploratory case
study is theory-driven. A case study may be selected when it is “a representative

16
sample, demonstrates particular facets of the topic, or shows the spectrum of alternatives”
(Yin 2003). The case study used for this research is the construction planning process
for the precast concrete structure systems of the MGM Grand Hotel in Las Vegas,
Nevada. Though the case study selected was a specific repetitive scheduling method
(the Short Interval Production Scheduling (SIPS) technique), the 4D model generation
process would be the same for a non-repetitive scheduling activity. Therefore, this case
study can be stated as a representative sample of the research topic. It investigated the
effectiveness of 4D modeling applications in helping students learn scheduling and the
project planning process.
2.2.2 Controlled Experiment
An experiment is usually conducted to test a hypothesis about the role of the
independent variable on the dependent variable. A controlled experiment generally
compares the results obtained from an experimental sample against a control sample.
Two or more sample groups are created at the beginning of an experiment, which are
probabilistically equivalent. This equivalency is determined by the amount of variation
between individuals and the number of individuals in each group. Once equivalent
groups have been formed, they will be treated identically by the experimenter except for
the one independent variable.
In this research, students from a senior level construction management class (AE
473) were randomly assigned to ten small groups. The groups were generated by using
the “Random Team Generator” tool in ANGEL, Penn State's Course Management
17
System (CMS). Then five student groups were assigned randomly to the control group
and the other five were in the experimental group. Among these ten groups, two groups
consisted of 4 students each, and the other eight groups consisted of 3 students each.
Due to the absence of some students, there was a 2-student group in each of the control
and the experimental group. The treatment for the control group was a current 4D
modeling interface which aided students to develop a construction schedule for the case
study project. The treatment for the experimental group was the VCS interface which
helped students to develop a construction schedule for the same project. Student group
effectiveness in schedule visualization was examined to compare the impact of these two
4D modeling tools in engineering education.
2.2.3 Direct Observation
Direct observation is a simple method to gather data about how users interact with
products (Yin 2003). It is powerful for gaining user insight. To gain maximum
benefit, careful planning is needed. Without care, observation may affect what people
do and bias results may produce. It is important to make the person being observed
comfortable with the process. Observation can be combined with video for better data
capture.
There are two types of direct observation methods: structured observation and
unstructured observation (Yin 2003). A structured observation is used when the
researcher determines what behaviors are to be observed before the observation starts.
Usually the research uses a standard checklist or a certain theoretical framework to record

18
the frequency or time of the behaviors observed over a specified time period. In an
unstructured observation, there is no predetermined plan about what to be observed.
The researcher records behaviors as they occur and analyze them afterwards.
In the implementation of the preliminary 4D learning module, unstructured
observation techniques were used to observe student presentations and discussions since
no research had been done in this area and the researcher had no predetermined plan
about what to be observed. When comparing the VCS and a current 4D modeling
application, a theoretical framework was used to examine student group communication.
Structured observation was used to observe the student group meeting process since the
researcher predetermined what to be observed from the available theoretical framework.
2.2.4 Survey
A survey is a process of examining a social phenomenon involving an individual
or a group, by gathering information through observation or asking (Corbetta 2003).
Commonly, surveys are conducted through questionnaires and interviews (Fellows and
Liu 2003).
Questions have two primary types, open and closed. Open questions are
designed to allow the respondents to answer in whatever form and content they wish.
This kind of questions is easy to ask but difficult to analyze the data. Closed questions
have a set number of predetermined responses that respondents can choose.
Questionnaire surveys were used in this research. Closed questions were asked
to measure student perceptions regarding the value of 4D learning module in the group
19
meeting and presentation process. These questions were measured on a Likert scale
(Corbetta 2003). Open questions were designed to investigate the challenges of using
4D modeling that students encountered and suggestions for future improvements of the
module.
2.2.5 Content Analysis
Content analysis is defined as "any technique for making inferences by
objectively and systematically identifying specified characteristics of messages" (Holsti
1969). Content analysis is a widely accepted technique to systematically analyze data
obtained through qualitative research. It is a phase of information processing in which
communication content is transformed, through objective and systematic application of
categorization rules, into data that can be summarized and compared.
A content analysis was performed for each video recorded from student group
meetings. The specific method that was used to develop the content analysis was to use
a video analysis application to document the frequency/time for each category that was
predefined by a coding scheme. Following coding, quantitative scales were derived for
further analysis.
2.2.6 Inter-rater Reliability Test
Inferences drawn from the content analysis need to be verified and the reliability
must be tested. There are three types of reliability for content analysis (Milne et.al. 1998):

20
1. Stability refers to the ability of the same coder to code data the same way over
time. The coder usually experiences a test-retest procedure.
2. Reproducibility (inter-rater reliability) is to measure the extent to which
coding produces the same results when the content is coded by multiple
coders. This type of reliability measure is usually referred to as inter-rater
reliability. The measurement involves assessing the proportion of coding
errors between various coders. The reliability is verified by either reporting
that the discrepancies between the coders are few, or that the discrepancies
have been reanalyzed or the differences have been resolved.
3. Accuracy involves assessing the coding performance of coders against a set of
predetermined standard. Such a standard is set by a panel of experts, or
known from previous studies.
In this study, there were 10 videos recorded, with an average duration of 3 hours
for each video. The researcher coded the videos and performed a stability test. Later,
an inter-rater reliability test was performed. Since each minute of the video took
approximately 4 minutes to code on average, it is unrealistic to have other coders test the
reliability of the entire data set. Therefore a 12-minute video was randomly identified
and three other coders coded the video. Included amongst the three coders, the
researcher’s academic advisor has experience in content analysis and expertise in 4D
modeling and construction planning, and two graduate students in the construction
engineering and management option have familiarity with 4D modeling techniques but
limited experience with content analysis.

21
The co-agreement levels reached among coders were used to test the reliability.
The measure of the co-agreement level is the coefficient of agreement or percentage of
agreement. The coefficient of agreement involves calculating a ratio of coding
agreements to the total number of coding decisions taken by all the coders.
Reliability is usually tested by meeting a certain standard of reliability.
However, it does not necessarily require a formal calculation of reliability. If multiple
coders are used on the entire data set and all the discrepancies are examined and resolved
or they observe very few discrepancies, the research can feel assured that the data set is
reliable for those researchers. Determining an appropriate level of inter-rater reliability
should be very careful since “defining an acceptable level of acceptable level of
reliability is one of the many problems in content analysis for which there is no single
solution” (Holsti 1969). The reliability standards need to be answered within the
context of a given research problem (Krippendorff 1980). A detailed description of the
reliability test is provided in Chapter 6.
2.3 Research Process
Detailed descriptions of the major research processes for this study are introduced
in this section.
22
2.3.1 Literature Review
To provide a background for this research, a literature review was conducted in
the areas of construction schedule visualization, design and construction team
communications, virtual reality, and virtual reality applications in engineering education.
2.3.2 Development, Incorporation and Evaluation of a Preliminary 4D Learning Module
An exploratory study was conducted, where a preliminary 4D learning module
was developed using a current 4D modeling application and implemented into an
advanced project management course (AE 473) in 2005 at Penn State. The module was
used to help students learn Short Interval Production Scheduling (SIPS) for a typical floor
of the MGM Grand Hotel precast structural system. Final 4D model solutions were
exported into video files so that student groups could present their solutions to their
classmates and the instructor.
A scoring rubric was used to compare the quality of the final solutions with the
previous year’s solutions, when a paper-based 2D drawing was used to develop the
schedule. Student group presentations and discussions in class were directly observed,
and a preliminary survey was conducted to investigate student perspectives of the 4D
learning module. The results of this module implementation are presented in Chapter 4.
23
2.3.3 Identification of Assessment Parameters
From the implementation of the preliminary module, the researcher was able to
identify important parameters that can be used to evaluate the value of the 4D learning
modules. These parameters were identified by direct observation of student group
presentations and in class discussions; analysis of the survey results; and the development
of a summary of lessons learned from this research.
2.3.4 Development and Implementation of the VCS
The VCS was developed using a 3D game engine. It allows students to generate
a construction schedule and a 4D model by interacting with a 3D model. The VCS
learning module and a 4D learning module in a current 4D application of the MGM
Grand Hotel project were incorporated into the same advanced project management
course in 2006. The AE 473 class was randomly divided into eight small groups of 3
and two groups of 4 students. The control group consisted of 5 student groups that used
the current 4D modeling interface, and the experimental group consisted of 5 groups that
used the VCS application. The experiment was conducted in the Immersive
Construction (ICon) Lab where students can visualize the 3D and 4D model on a large
3-screen display system. The experiment was observed and videotaped with student
permissions for further analysis.

24
2.3.5 Assessment of the VCS
Data were collected both during and after the experiment for examining the
student group process, group product and perception towards the learning modules. The
experiment for each group was observed and recorded so that the student group process
could be analyzed. Initial schedules, final submitted schedules and overall SIPS
assignments were documented so that their quality could be compared between the
control and experimental groups. Surveys were conducted after the experiment and
student presentations to gain their perceptions.
The videos were analyzed using content analysis techniques. Student group
communications were coded and quantitative data were obtained by conducting
frequency/time studies of different communication categories predefined by a coding
scheme. Initial schedules, final submitted schedules and overall SIPS assignment were
graded using scoring rubrics. Qualities were evaluated by comparing the grades.
Survey results were used to examine and compare student perspectives from both control
and experimental groups. The results are presented in Chapter 6.
2.3.6 Documentation of Conclusions and Lessons Learned
The benefits and limitations of the 4D learning module used in engineering
education were identified through this study. Conclusions as well as lessons learned
were documented. Suggestions for future improvement of learning modules were
provided, and directions for further research were recommended.
Chapter 3
Literature Review
This chapter provides an overview of significant literature related to this research.
Construction schedule visualization, design and construction team communications,
virtual reality (VR) display system, and virtual reality applications in engineering
education are covered.
3.1 Construction Schedule Visualization
To understand the value of 4D visualization technologies for schedule
visualization, it is very important to know the traditional schedule visualization methods
and their limitations, and background knowledge of 4D modeling. This section
introduces traditional 2D and CPM scheduling methods, 3D visualization, the concept
and process of 4D modeling, and the applications and values of 4D modeling in the AEC
Industry.
3.1.1 Traditional 2D CAD & CPM Scheduling
2D drawings and CPM scheduling are the traditional tools used in the
Architecture, Engineering and Construction (AEC) Industry to analyze project designs
and plan their construction. Designers use 2D drawings to describe their ideas to other
project participants. Visualization of the facility is communicated using 2D drawings

26
and project information is primarily exchanged via paper documents. Individuals need
training to interpret 2D drawings and visualize projects based on their previous
experience and knowledge. With building geometry getting more and more complex,
even experienced personnel misinterpret the designer’s intention, which can lead to
additional time and cost.
CPM was invented by the aerospace industry and has been adopted in the
construction industry since late 1950s. Though it has been well served in this industry
in many aspects, the CPM has been widely criticized in terms of its inability to cope with
non-precedence constraints, difficulty to evaluate and communicate interdependencies,
and inadequacy for work-face productions (Sriprasert and Dawood 2002). They use
only titles to designate activities and numbers to indicate activity durations. They are
separated from the visualization of the planned construction (Collier 1996).
Schedulers need to interpret the 2D drawings, identify activities and build a
logical sequence network. Then they determine activity and project durations. This
process results in a CPM network or a Gantt chart. Developing a construction schedule
is hard since one has to build a project step-by-step in their mind after visualizing the 2D
drawings.
It is difficult to conceptualize the construction process and detect problems by
viewing the CPM schedule alone, especially for a novice with limited construction
experience. Such schedules force users to visualize and interpret the activity sequence
in their minds. Components in 2D drawings have to be associated with their related
activities mentally. The processes are a sequence of events not physical objects,
therefore, it is more difficult to validate and evaluate them (Retik 1993). Sometimes a

27
novice cannot even detect problems from a small CPM schedule. Also people have
different interpretations of the same schedule, which makes it difficult to communicate
and discuss whether a certain problem actually existed or not.
3.1.2 3D CAD Visualization
Simulation modeling and visualization are used to overcome the deficiencies of
the traditional scheduling techniques. Advanced visualization techniques such as 3D
visualization, 4D models and virtual reality models can be utilized for more effective
generation, communication and evaluation of schedule information.
3D modeling has been around for more than three decades, and it is becoming a
more useful and economically viable tool. 3D modeling can better present the physical
reality of a structure than 2D drawings. 3D models have been increasingly used in a
number of different areas such as automobiles, aerospace vehicles, buildings and so on.
Various computer-based 3D visualization activities have been used for construction
planning. Kamat et al. (2001) described a 3D visualization system for construction
operations simulation. The construction system can be analyzed at the operation level
of detail to plan the construction process. Interactions of various resources, such as
materials, labor, equipment and temporary structures can be viewed when the building is
being virtually constructed.
Thabet (2001) proposed a virtual construction model to integrate the design and
construction process to improve project constructability during the pre-construction stage.
The model allows the users to virtually and interactively construct 3D models of the

28
projects from predefined construction CAD assemblies or components. The
construction process can be rehearsed, which allows the users to analyze and criticize
designs as well as perform what-if scenarios.
Songer et al. (2001b) quantified the benefits of 3D models and walk-thrus for
schedule development for construction projects. Completeness, reasonable activity
duration and valid activity relationships were used to measure the “correctness” of a
schedule. Critical path and total float, workflow and resource use were used to define
“goodness”. Schedulers can generate more correct and better construction schedules by
using a 3D model and a walk-thru than by using 2D plans. The walk-thru model
enhanced the spatial comprehension, which enabled the schedulers to schedule
concurrent activities without the fear that they were scheduling too many activities in the
same area or at the same time. The walk-thru enabled experienced schedulers to
develop correct schedules, as well as effectively minimized the disadvantage of
inexperience.
3.1.3 4D CAD
3.1.3.1 Definition of 4D CAD
A 4D CAD model results from the linking of 3D graphical images to the fourth
dimension of time (Koo and Fischer 2000). The idea of linking 3D CAD models to the
construction schedules began in Bechtel Corporation in 1986-87 when they collaborated
with Hitachi Ltd. to develop the Construction 4D-Planner (Smith 2001). While the
29
spatial and temporal dimensions of construction schedules are not effectively represented
and communicated by traditional bar charts and network diagrams, a 4D model simulates
the construction schedule and actually shows which pieces of projects will be constructed
in what sequence (Adjei Kumi and Retik 1997). By combining 3D models with
construction activities, 4D CAD animations can display the progression of construction
over time, which provides the opportunity to improve the quality of construction plans
and schedules (Rischmoller et al. 2001).
3.1.3.2 Development of A 4D Model
The current process used to develop a 4D model is:
1. Develop or obtain a 3D CAD model.
2. Develop a construction schedule. This information is captured from the
experience and knowledge of the construction planner.
3. Separate the 3D model into appropriate construction elements or assemblies.
4. Link the components of the 3D model with their activities specified by a CPM
schedule in a 4D CAD schedule. Once they are linked, the 4D model can be
viewed as a simulation of the construction plan.
3.1.3.3 Benefits of 4D CAD
4D CAD models enable more people to understand a schedule quickly and
identify potential problems, since it allows people to visualize the construction process as

30
it would be actually built before the construction starts. Koo et al. (2000) studied the
effectiveness of a 4D model in conveying a construction schedule. 4D models are useful
in conveying which components are being built at a certain time and location. 4D CAD is
effective in:
• verifying the completeness of the schedule;
• finding inconsistencies in the level of detail among the schedule activities;
• discovering any impossible schedule sequences;
• identifying potential time-space conflicts; and
• anticipating accessibility problems.
4D models are effective in evaluating the executability of a construction schedule.
They allow users to detect mistakes or potential problems prior to construction. The
main benefits that a 4D model provides are as a
• visualization tool- ability to convey planning information;
• analysis tool - enhance collaboration among project participants; and
• integration medium - support users to conduct additional analyses.
4D modeling also enables the identification of potential conflicts between
building elements and work spaces, safety hazards created due to proximity of
construction activities, and the visualization of construction plans (McKinney et al.
1998).
Songer (2001a) quantifies the advantages of 3D/4D presentations for schedule
review of construction projects. Once a schedule has been created, 4D animation is
useful to review and analyze it. 4D media can improve a schedule reviewer’s ability to

31
identify the “correctness” and “goodness” of the schedule. With the aid of 4D CAD
animation, missing activities and logic errors in the schedule are dramatically reduced,
safety and overcrowding issues are easily identified, and better work flow can be
achieved. 4D animation is a valuable tool for schedule analysis, especially for
analyzing portions of the schedule that involve complex design drawings, which are
difficult in 2D review.
4D Planning and Scheduling (4D-PS) uses 4D models to accomplish project
construction planning and scheduling tasks (Rischmoller et al. 2001). It allows
simulating and interacting with construction schedule through graphic display devices.
The application of 4D-PS to a case study shows that 4D model reviews can help
construction planners to optimize construction sequences, identify and resolve schedule
conflicts, and provide feedback from construction teams to design teams. It also gives
planners the ability to track and manage workers and resources. By allowing planners
to make important decisions regarding deadlines, sequence and resource utilization ahead
of time, 4D model reviews can dramatically improve project constructability and avoid
rework.
4D CAD modeling offers the opportunity for planners to perform detailed trade
sequencing and production planning (Riley 1998). Workspace congestion and inference
between crews and stored materials can be predicted and minimized through visual
analysis of construction sequences, so that productivity rates can be maximized.
32
3.1.3.4 4D CAD Applications in Construction Projects
3D and 4D models have been used on large projects and process plants. More
and more companies realized the benefits and began to explore the possibilities of this
tool as a means to increase their competitiveness. The Center for Integrated Facility for
Engineering (CIFE) at Stanford University has lead several significant research projects
related to 4D CAD in construction industry.
4D modeling was used on the Walt Disney Concert Hall Project to test the
benefits and challenges of using 4D models for projects with complex geometry
(Haymaker and Fischer 2001). 4D models benefited the project in the following
aspects:
• Schedule creation: The GC used the 4D models to assist in planning the
laydown areas for the enclosure contractor, to visualize overall project access at
critical junctures in the project, to refine the interior and exterior scaffolding
strategy, and to plan the installation of the complex ceiling of the main concert
hall.
• Schedule analysis: The GC’s project management team used 4D models to
discover several conflicts in the schedule which were not discovered in the
CPM-based Gantt chart.
• Communication: The GC used the 4D models in training sessions with as many
as 40 people, where subcontractors, owners, designers, and the GC reviewed
the models and discussed the strategy and constraints for erecting the project

33
• Team building: The 4D models helped the construction team find many
schedule inconsistencies, resolve access, scaffolding and hoisting issues for the
exterior and interior construction in a timely manner, inform more stakeholders
of the approach to construction and of the schedule, and engage subcontractors
in the scheduling process.
Challenges encountered in building the 4D models included:
• Geometry issues: Inconsistencies, lack of data, level of detail, and too much
data.
• Schedule issues: Inconsistencies and lack of data.
• Issues with linking of 3D model and schedule: Inconsistencies, other data, and
representation of activities with no geometry.
The documentation of the use of 4D modeling on small projects is very limited.
The San Mateo County Health Center project is an example of using 4D modeling and
animation on a daily basis on a small project. 4D schedule animation is a good tool in
explaining the proposed construction sequence. Even people with minimal previous
involvement were able to view the animation and quickly understand the impact of the
planned construction on their department, office and daily operation. Video of the
animation can be created and used to disseminating the construction information to a
large number of people (Collier 1996).
Disney's Imagineers found tremendous value of 4D in terms of increased
productivity and decreased waste on job sites. The main value is conflict resolution
since 4D allows visualization of construction sequence. Another benefit is the ability to
run what-if scenarios to determine optimum scheduling and resource management.
34
Also, all project stakeholders, from the owner to the tiling subcontractor, can see how the
project is supposed to progress by using 4D.
In another case study by Staub et al. (1999), a 4D CAD model was used for the
most extensive and difficult construction work of a pharmaceutical plant, leading to
fewer unanticipated problems during construction. The results of using 4D on this
project were:
• The piping and mechanical subcontractors fabricated all the large and
expensive ducts and pipes directly from the 3D CAD model, and both
reported far greater productivity and virtually no rework.
• There was only one contractor-initiated change order on the work that had
been modeled in 3D.
• Requests for information were reduced by 60% percent compared with a
similar project designed and built by traditional means.
The model benefited various trades on the project. It lowered the construction
cost by helping subcontractors to avoid sequencing conflicts. The project manager
found the 4D model valuable in coordinating construction tasks and communicating the
intent of the schedule. The project designer could make modifications to one model
when the design changed, whereas they had to change plans, sections, and elevations
when using traditional 2D drawings.
These cases have shown that more project stakeholders can benefit from 4D
models. They can understand a construction schedule more quickly and completely
with 4D visualization than with the traditional construction management tools, and they
have much better communication with different trades related to the project. With

35
successful applications of 4D CAD in the industry, it is feasible that 4D CAD may be
very beneficial in construction engineering education. It can provide the opportunity to
improve construction engineering education by allowing students to experience the
dynamic nature of construction.
3.2 Design and Construction Team Communication
This research will investigate the value of the VCS by comparing with traditional
4D modeling tools. One critical evaluation parameter that will be used is the team
communication effectiveness. This section provides a review of important work in
design and construction team meeting communication.
Different criteria are available in defining communication types during design and
construction team meetings. There are two main theoretical frameworks that were
reviewed for this research: design team meetings by Stempfle and Badke-Schaub (2002)
and construction project team meetings by Liston (2000).
Stempfle et al. (2002) discussed the four basic thinking operations (exploration,
generation, comparison and selection) and analyzed design team meetings and defined six
steps concerned with the communication content of a design team meeting:
1. Goal clarification: goal related communicative acts;
2. Solution generation: a solution concerning the design task;
3. Analysis: question, answer, hypothesis, exchange of information concerning
a solution;
4. Evaluation: positive and negative evaluations of a proposed solution;

36
5. Decision: decisions for or against a solution idea; and
6. Control: Control of the implementation of a solution idea.
Stempfle’s research shows that the most frequent types used by the design teams
are analysis and evaluation in a collective design process.
Rao and Kremer (2005) used the four basic thinking operations discussed by
Stempfle et al. and studied design team communications by audio recording design team
meetings. Recorded audio was transcribed to text and the transcriptions were categorized into
one of the four basic design activities of exploration (of concepts and analysis of designs),
generation (of alternate concepts and solutions), comparison (of concepts and solutions) and
selection (of viable design solutions). They studied the sequence of design activities to
examine how information sources were utilized. Two design team communications were
analyzed and Figure 3 shows the sequences of design activities for these two groups.
One design group spent smaller amounts of time on each activity, but iterates much more
frequently between the different activities. Both teams spent most of their time on comparison,
then exploration, generation and selection in descending order.
Figure 3 Sequence of Design Activities for Two Design Teams during the Same Design Session
Source: Rao and Kremer (2005)
37
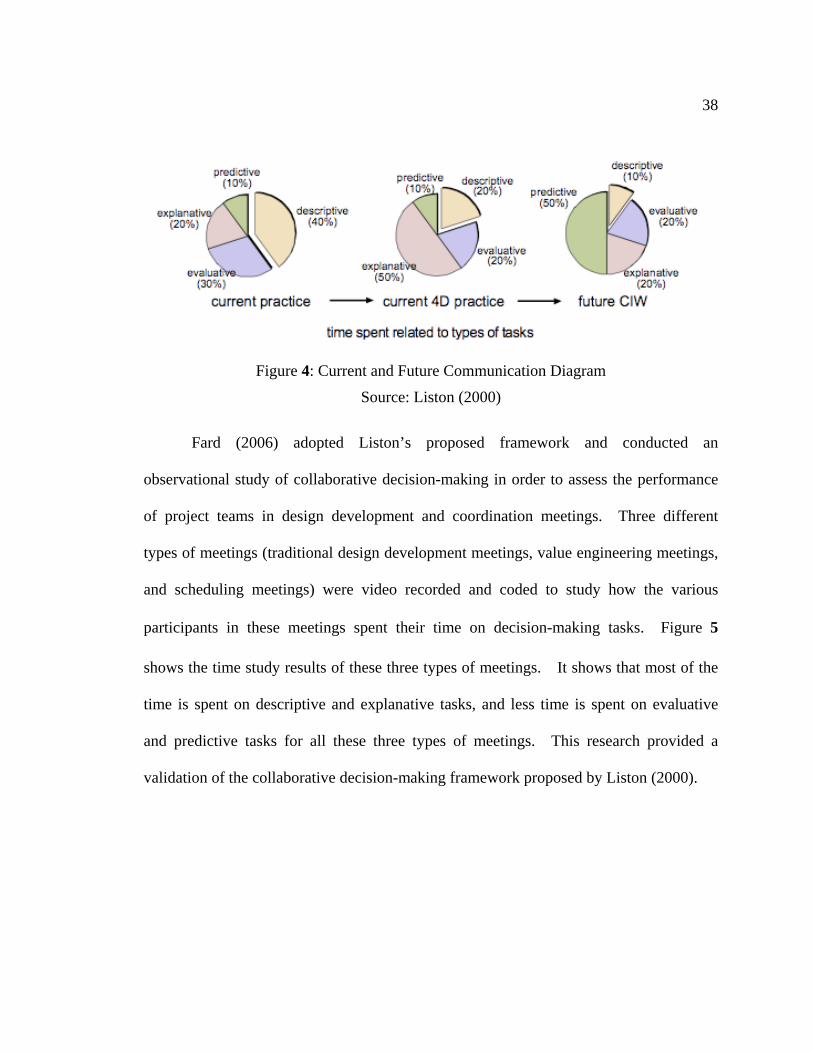
Liston (2000) analyzed the amount of time spent on different categories of
communication types (descriptive, explanative, evaluative and predictive) in a
construction project team meeting.
• Descriptive: describing various tasks and asking questions like “who, what, when,
where, how” of a project.
• Explanative: explaining project decisions or schedule rationale. Questions like
“why, why not” are usually discussed.
• Evaluative: Evaluating the project goals and checking that project requirements
are met. This consists of the assessment of possible alternatives to a problem or
situation.
• Predictive: predicting the possible consequences of a decision or estimating the
value of an unknown variable during a meeting.
According to Liston’s study, it has been observed that significant time during the
meetings is involved in describing various tasks (Descriptive) to other participants. 4D
CAD modeling and immersive virtual environment can enhance the construction
planning and plan communication process (Yerrapathruni 2003). It can also serve as an
excellent tool for communication among the project participants, stakeholders and
potential customers (Gopinath 2004). This fact illustrates an opportunity to introduce
advanced visualization techniques and to make improvement in the way project
information is communicated. A new type of Construction Information Technology
(CIT) was proposed by Liston (2000) to change the time spent on the communication
categories in the future Construction Information Workspaces (CIW). The current and
future communication diagram by Liston is shown in Figure 4.
38
Figure 4: Current and Future Communication Diagram
Source: Liston (2000)
Fard (2006) adopted Liston’s proposed framework and conducted an
observational study of collaborative decision-making in order to assess the performance
of project teams in design development and coordination meetings. Three different
types of meetings (traditional design development meetings, value engineering meetings,
and scheduling meetings) were video recorded and coded to study how the various
participants in these meetings spent their time on decision-making tasks. Figure 5
shows the time study results of these three types of meetings. It shows that most of the
time is spent on descriptive and explanative tasks, and less time is spent on evaluative
and predictive tasks for all these three types of meetings. This research provided a
validation of the collaborative decision-making framework proposed by Liston (2000).

39
Figure 5 Time Spent of Decision Making Tasks on Design Development, Scheduling and
Value Engineering Meetings
Source: Fard (2006)
In this research, student group meetings were examined using Stempfle’s
theoretical framework, because students were trying to develop a construction schedule
for a project and they functioned more like a design team to design a process (a
construction schedule). Liston’s categories were considered, but the detailed
categorization of discussions of student groups performing the scheduling task was
difficult.

40
3.3 Virtual Reality
In the experiment conducted for this research, the Immersive Construction (ICon)
Lab was extensively used, which provided students a virtual environment to interact with
the 3D and 4D model. This section introduces the concept of virtual reality (VR),
various types of VR display systems, and the applications of VR in engineering
education.
3.3.1 Definition of Virtual Reality
Virtual reality (VR) is an experience in which a person is “surrounded by a
three-dimensional computer-generated representation, and is able to move around in the
virtual world and see it from different angles, to reach into it, grab it, and reshape it
(Rheingold 1991).” VR includes graphics applications that allow users to walk through
a simulated environment and, possibly, to interact with objects in it. Interactivity means
“the interaction between computer and user which takes place through changes of viewed
locations, typed commands, voice commands, mouse clicks, or other means of interfacing
(Shiratuddin et al. 2004).” Interactivity is the most important features of VR and relates
what people see in the virtual environment to the real world. An effective virtual
environment must give the user as much control as possible over their surroundings.
VR has been used in the design process and found to be more efficient to check
the design solutions than the traditional media (Petric et al. 2002). VR used in
construction equipment simulation provides the planners visualization of assembly
sequences and real-time virtual interactive modeling of construction equipment (Bosch
41
and Hastak 2002). VR was also used to visualize construction plans and schedules
(Waley and Thabet 2003; Whisker et al. 2003), enable architectural walk-through
(Shiratuddin et al. 2004), optimize site facility layout (Tam 2002) and communicate with
project teams (Haymaker and Fischer 2001).
VR can enhance the simulation by providing (Petric et al. 2002):
• Immersion: Users are completely surrounded by the environment;
• Presence: Users have the sense of being in the environment;
• Interactivity: The environment allows the participant to be involved and the result
of the actions done by the participant can be visualized in the VE;
• Autonomy: Participants are neither constrained in paths nor in views preset by
others. They have the freedom and autonomy to explore any single part of the
environment;
• Collaboration: Multiple users are able to take part and to interact in the same VE.
3.3.2 Virtual Reality Display
While previous construction visualization mainly focused on the enhancement of
product design, a significant amount of work has been done to develop graphic display
techniques which allow users to view and interact with 3D models. The graphical
interface between computers and humans has greatly improved. Virtual environments
use stereo-graphics, audio and several other input devices to provide users the ability to
visualize and interact with data in 3D (Nelson et al. 1999).

42
Non-immersive desktop VR and Immersive VR have been used to simulate the
construction process (Retik 1993). A desktop monitor is used by the user to interact
with a virtual model in desktop VR. For immersive VR, a large scale display or head
mounted display is used to immerse the user in the virtual environment. Kasik et al.
(2002) summarized 14 different displays and their characteristics.
CAVE (CAVE Automatic Virtual Environment), which was designed in 1991,
was the first large immersive projection display (Cruz-Neira 1993). It is a 10’×10’×10’
theater with three rear-projection screens for walls and a down-projection screen for the
floor. A user’s head and hand are tracked with electromagnetic sensors.
Stereographics’ LCD stereo shutter glasses are used to provide user 3D visual effect.
CAVE and CAVE-like facilities have been successfully used in research for visualizing
various complex systems. Usually these systems are used on a limited number of
high-end research projects (Kalisperis et al. 2002). Due to the high cost and limited
footprint of these display systems, they are not viable to be used for large scale
educational purpose.
This research focuses on the use of an affordable, open footprint, three screen
passive stereoscopic display system in the Immersive Construction (ICon) Lab at Penn
State. Figure 6 is a rendering of the ICon Lab. The three screens, each is 6’ high by
8’ wide, provide a panoramic virtual reality environment by using rear projectors.
Students can use all three screens to display a construction project to get the feeling of
presence. Alternatively, they can use two screens to display the building geometry and
the third screen to display construction schedule. The three screens can also be utilized Left Screen Middle Screen Workstati

43
as an effective presentation system to show the audience more information than regular
one screen displays.
Figure 6: ICon Lab Rendering
3.3.3 VR Used in Engineering Education
The use of immersive VR displays has primarily been limited to specialized
research labs and those with large computing budgets, such as the military.
Development of inexpensive hardware and software VR products in recent years has
brought virtual reality within reach of the average researcher (Bell and Fogler 1995).
VR has been used in engineering education in different academic curricula. VR
was used to integrate the fundamental concepts of design, analysis and manufacturing in
introductory courses in Mechanical Engineering to positively impact student motivation
and conceptual understanding of mechanical engineering concepts (Impelluso and
44
Metoyer-Guidry 2001). First-person simulation of lab accidents was used in
undergraduate chemical engineering to address the importance of following proper lab
safety procedures (Bell and Fogler 1995; Bell and Fogler 2003). VR was used to bridge
the gap between classroom lecture and industrial experience. Whitman et al. (2002)
used a virtual reality model of a real world manufacturing line to integrate a
manufacturing engineering curriculum. The virtual reality models of the manufacturing
line allows students to view the process and interrogate the process details, make changes
and observe the effects, and gain a better understanding of concepts and their
interrelationships. The use of a series of case studies from the real world in the
curriculum enabled students to synthesize the knowledge and skills gained in different
courses.
The use of VR in construction engineering education is currently very limited.
Construction site visits are widely recognized as a great way for students to get first hand
experience and gain a better understanding of the construction process. However, there
are various difficulties of logistics and cost, such as the site is not at a specific stage of
construction, large group visits to construction sites are not always welcomed, and
transportation and time can be difficult to coordinate. VR allows educators to place
their students in computer generated environments and present student with an
educational experience difficult or impossible to achieve by using other methods. It is a
useful tool to complement conventional construction site visit or site training. VR is
especially beneficial as classroom substitute for field experience with hazard construction
operations. Hadipriono et al. (1996) proposed the Construction Operations using
Virtual Reality (COVR), which was used to educate and train undergraduate students in

45
performing a construction operation without subjecting them to the real on-site
construction hazards.
Haque (2001) describes a 3-D animation and walkthrough integrated virtual
construction site to teach reinforced concrete structure construction, which can help
construction engineering and management students to better visualize the sequence of
operations and design details of reinforced concrete buildings, so that they can design,
manage, estimate and schedule more effectively.
Sawhney et al. (2000) proposed an Internet-based Interactive Construction
Management Learning System (ICMLS) aiming at enhancing construction management
education. The ICMLS uses interactive and adaptive learning environments to train
students in areas of construction methods, equipment and processes, so that practical
content can be incorporated into the construction curricula thus bridging the gap between
the classroom and the construction site.
3.4 Summary
The effectiveness of 4D CAD has been demonstrated in real-life construction
projects. 4D CAD is useful in the graphical presentation and communication of the
construction schedule. It assists planners to visualize the construction process and
compare different decisions made. 4D models have been used as a supporting tool, a
checking tool, a communication tool, and as a parallel effort to help improve construction
plans and schedules that were developed with conventional tools (Rischmoller et al.
2001). 4D models are generated by linking a 3D model and an existing construction
46
schedule. The 3D model and the schedule are inputs to this process, and the 4D model
is the final product and used as a schedule review tool.
Traditional ways of generating a schedule limit the utilization of the 3D model
and the potential benefits of the 4D model. Just like using the 2D drawing, schedulers
still need to create the activities mentally, and link them to their related 3D components
later. They can’t generate a schedule activity by selecting its corresponding component
in a 3D model, which can translate their thinking into schedule activities directly. This
research proposed to develop an interactive module, which allows students to generate a
construction schedule directly from the 3D model. The output is a CPM schedule and a
4D CAD model.
VR technology has been used in construction engineering education, but has yet
to achieve widespread use. There has been limited investigation of the effectiveness of
visualization in engineering education in terms of student learning experience. VR
technology allows two or more users, such as student project teams, to concurrently share
and interact with the same VR environment. Allowing students to use 4D CAD to
visualize the construction process, we may expect new forms of interaction and
communication. It enabled students to work in multidisciplinary teams and to
effectively communicate and understand concepts from various perspectives. This
research identified the educational value and limits of allowing construction engineering
students to generate 4D models in a wide format display system.
Chapter 4
Case Study and Preliminary 4D Learning Module
This chapter presents in detail the case study used for this research. A
preliminary 4D learning module of the case study project was developed and provided to
students. The focus of this study was to understand the impact of the 4D learning
module on the student learning experience based on their use of the module.
T4.1 The Case Study Project
The case study chosen for this research was a course assignment in a senior level
construction management course (AE 473) in the Architectural Engineering Department
at Penn State, where students were required to develop a Short Interval Production
Schedule (SIPS) for the MGM Grand Hotel Renovation.
4.1.1 SIPS Method Introduction
Short Interval Production Schedule (SIPS) is a scheduling method used to
organize construction work. Different from conventional scheduling, which breaks a
project into operations, SIPS breaks an operation into detailed repeatable activities.
Usually the operation is a critical sequence that is repeated throughout one phase of the
project and has a significant impact on the overall duration. Three major attributes that
distinguish a SIPS from convention scheduling procedures are (Burkhart 1989):
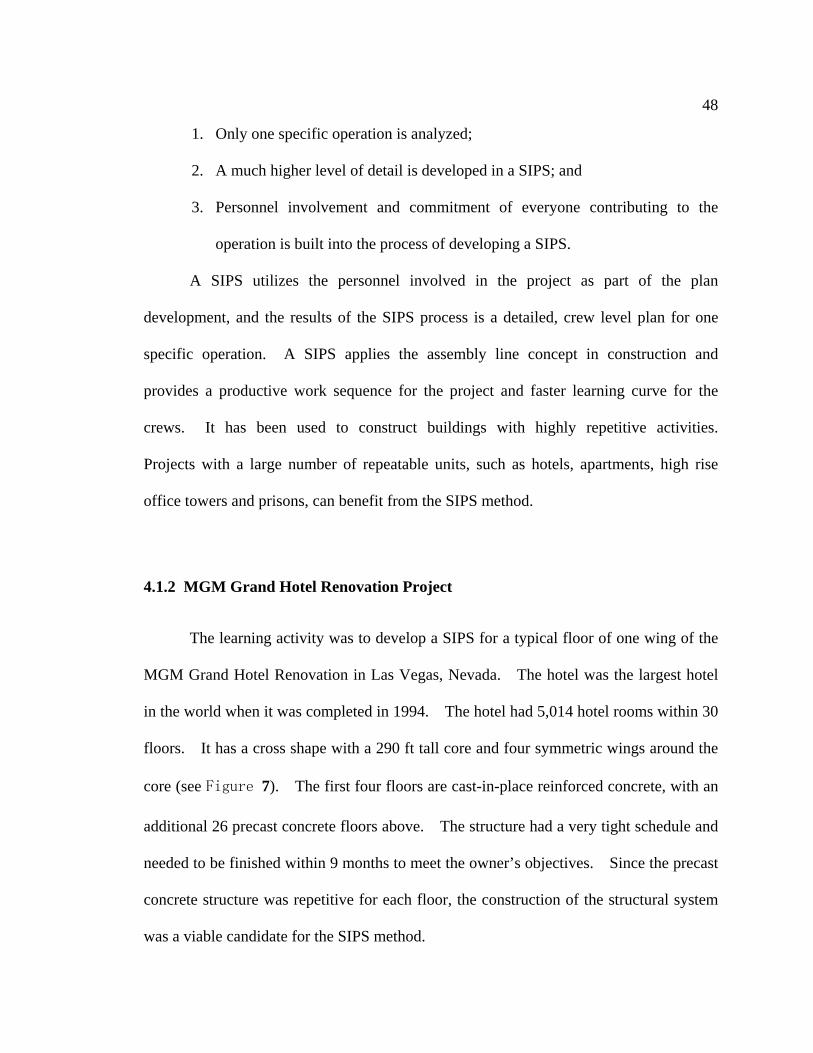
48
1. Only one specific operation is analyzed;
2. A much higher level of detail is developed in a SIPS; and
3. Personnel involvement and commitment of everyone contributing to the
operation is built into the process of developing a SIPS.
A SIPS utilizes the personnel involved in the project as part of the plan
development, and the results of the SIPS process is a detailed, crew level plan for one
specific operation. A SIPS applies the assembly line concept in construction and
provides a productive work sequence for the project and faster learning curve for the
crews. It has been used to construct buildings with highly repetitive activities.
Projects with a large number of repeatable units, such as hotels, apartments, high rise
office towers and prisons, can benefit from the SIPS method.
4.1.2 MGM Grand Hotel Renovation Project
The learning activity was to develop a SIPS for a typical floor of one wing of the
MGM Grand Hotel Renovation in Las Vegas, Nevada. The hotel was the largest hotel
in the world when it was completed in 1994. The hotel had 5,014 hotel rooms within 30
floors. It has a cross shape with a 290 ft tall core and four symmetric wings around the
core (see Figure 7). The first four floors are cast-in-place reinforced concrete, with an
additional 26 precast concrete floors above. The structure had a very tight schedule and
needed to be finished within 9 months to meet the owner’s objectives. Since the precast
concrete structure was repetitive for each floor, the construction of the structural system
was a viable candidate for the SIPS method.

49
4.2 Previous Offering of the MGM Grand Hotel SIPS Assignment
This course assignment required students to develop a SIPS for constructing the
precast concrete structural system for a typical floor of the hotel within time, crew, and
equipment constraints. In previous offering of this assignment, students were given a
2D plan (see Figure 8) of a typical floor, together with some pictures taken from the
construction site to visualize the structural system and develop their SIPS. Students
submitted their final solutions using paper-based CPM schedules. The solutions were
reviewed by the teaching assistant and the course instructor. Issues found in the
solutions were addressed to the class by the instructor.
Figure 7: MGM Grand Hotel Construction Site
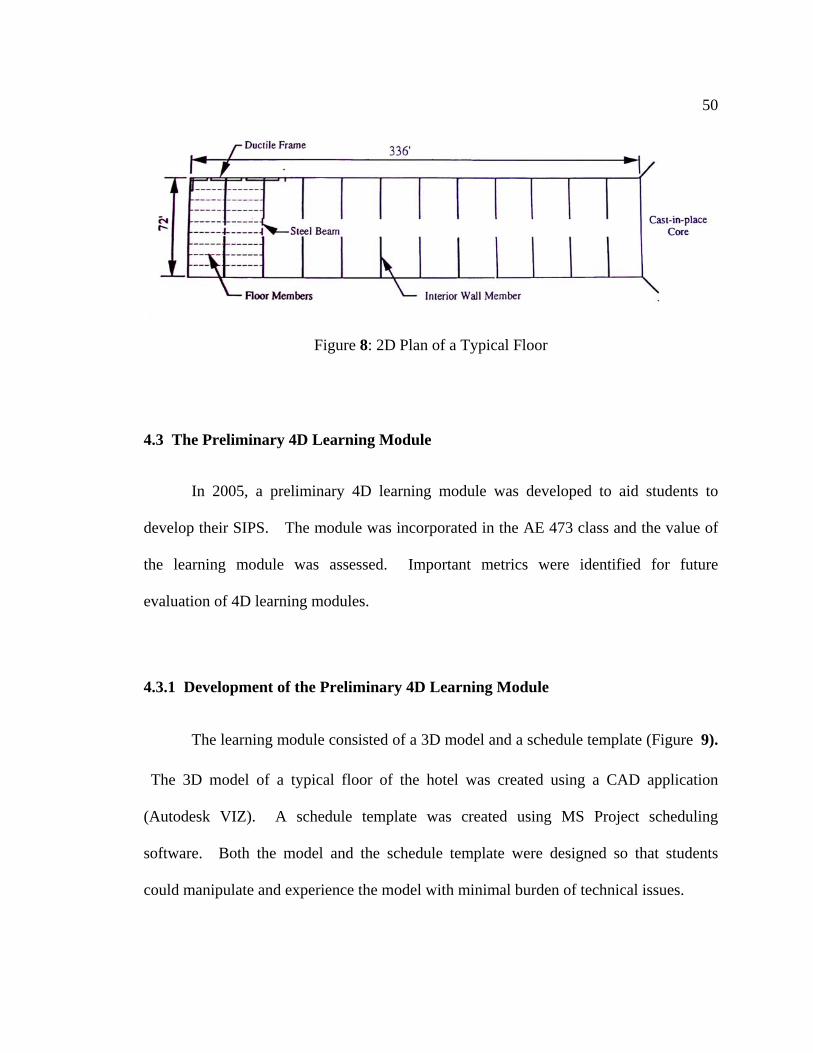
50
Figure 8: 2D Plan of a Typical Floor
4.3 The Preliminary 4D Learning Module
In 2005, a preliminary 4D learning module was developed to aid students to
develop their SIPS. The module was incorporated in the AE 473 class and the value of
the learning module was assessed. Important metrics were identified for future
evaluation of 4D learning modules.
4.3.1 Development of the Preliminary 4D Learning Module
The learning module consisted of a 3D model and a schedule template (Figure 9).
The 3D model of a typical floor of the hotel was created using a CAD application
(Autodesk VIZ). A schedule template was created using MS Project scheduling
software. Both the model and the schedule template were designed so that students
could manipulate and experience the model with minimal burden of technical issues.

51
Figure 9: 3D Model of A Typical Floor and Schedule Template in MS Project
4.3.2 Incorporation of the Preliminary 4D Learning Module
After the 4D learning module was developed, it was incorporated into AE 473
class. Students were taught how to use the NavisWorks with TimeLiner 4D CAD
application (NavisWorks, 2007) prior to the SIPS assignment. They started with a
simple model of an office building to learn how to import a 3D model and a schedule into
the software and then link them together. This allowed students to become familiar with
the software and gain the necessary skills they needed to finish the assignment.
When the students were familiar with the 4D CAD software, they started to work
on their SIPS assignment. They developed a SIPS using the schedule template, and linked
their schedule with the given 3D model using the 4D CAD software. The 4D CAD
application allowed students to review and test their solutions. Final solutions were
exported into video files for submission with the written assignment. Student groups
also presented their solutions to their classmates and the instructor in the ICon Lab on a
large 3-screen display system (see Figure 10).
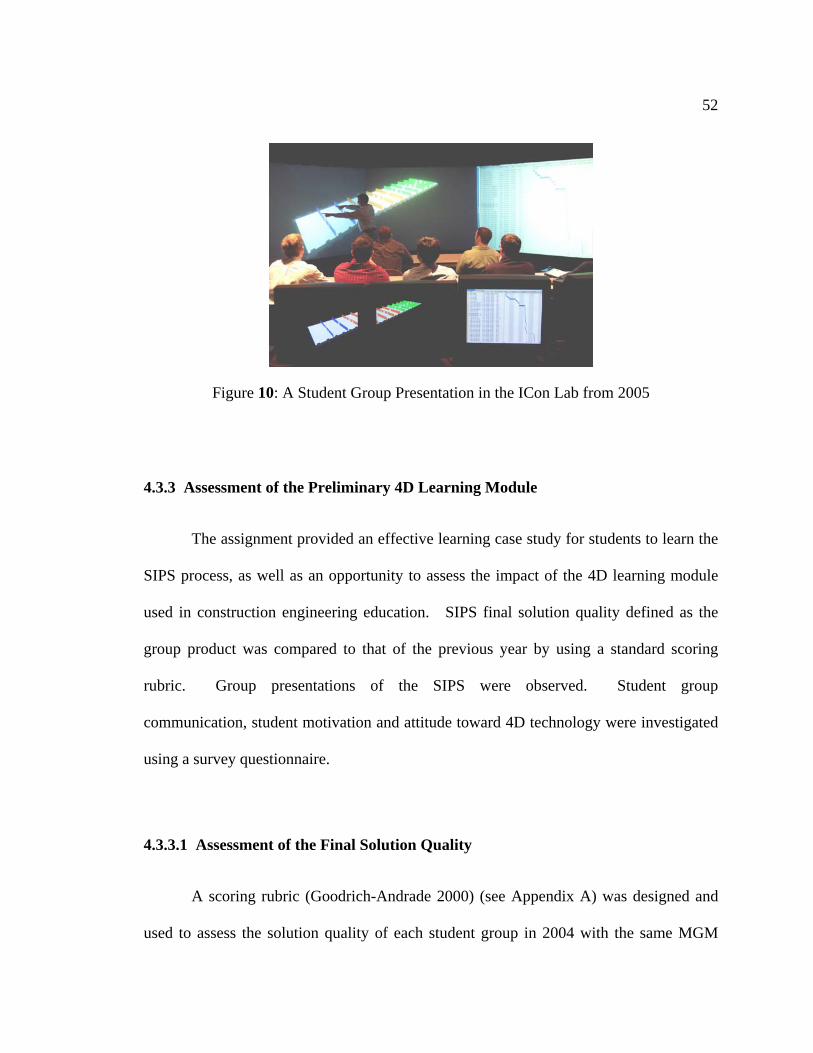
52
Figure 10: A Student Group Presentation in the ICon Lab from 2005
4.3.3 Assessment of the Preliminary 4D Learning Module
The assignment provided an effective learning case study for students to learn the
SIPS process, as well as an opportunity to assess the impact of the 4D learning module
used in construction engineering education. SIPS final solution quality defined as the
group product was compared to that of the previous year by using a standard scoring
rubric. Group presentations of the SIPS were observed. Student group
communication, student motivation and attitude toward 4D technology were investigated
using a survey questionnaire.
4.3.3.1 Assessment of the Final Solution Quality
A scoring rubric (Goodrich-Andrade 2000) (see Appendix A) was designed and
used to assess the solution quality of each student group in 2004 with the same MGM
53
assignment. The baseline of the group performance was measured using the traditional
2D drawing and CPM schedule. The same rubric was used to evaluate the performance
of each group after the module was implemented in the fall 2005 semester. Though the
average grade in year 2005 (86.75) was lower than that in 2004 (89.41), a higher overall
solution quality in the schedules developed using the 4D learning module was observed.
For example, 6 out of 9 student groups identified that there are some activities that can be
overlapped when using the 4D model, while there were only 3 out of 9 groups that
overlapped these activities in the previous year. More groups also identified that there
are some activities that cannot be conducted during the night shift in 2005. The 4D
model allowed students to review their solutions and helps them easily identify sequence
conflicts, which were difficult to identify in the CPM schedule, so that they could revise
their SIPS and determine a logical sequence for each activity. All these factors helped
the student groups achieve a higher solution quality than the previous year. The course
instructor felt the decrease in the average grade was due to poor written assignment
quality. Students paid more attention to the 4D modeling part of the assignment.
Some groups even didn’t submit a CPM schedule in their final submission. Statistical
significance of comparison between the two years was not tested due to the number of the
students (<30) for each year was small. It also should be noted that group equivalence
through the two years was not tested when comparing the final solution quality.
54
4.3.3.2 Observation of the SIPS Presentation and Discussion
Student presentations and discussions were observed when student groups
presented their solutions on a large, 3-screen display in the ICon Lab. In the previous
year, the instructor reviewed all the solutions from student groups, and then discussed
with students the most common problems they had in their solutions. With the help of
the 4D model, each student group explained their SIPS to other students and the
instructor in class in 2005. Since the 4D model graphically presented the SIPS, students
could review the SIPS developed by other groups and experience multiple outcomes for
the same project. And each group could get immediate feedback on their solution.
The 4D model made the learning activity more interactive by allowing students to review
and critique different solutions.
From in class discussion, it was noted that the model development improved the
planning process by identifying additional issues that were not noted before. For
example, the 3D model of one typical floor has two ends, and one end is connected to the
core of the building. Some student groups did not notice or did not understand the
impact of this and started constructing the floor from outside toward the core. This was
noticed during the review process, and students started discussing issues related to the
site planning and site access introduced by this problem. Other topics related to
construction methods of grouting exterior wall connections were also discussed when
students discovered that the necessary equipment would not be available.
55
4.3.3.3 Student Perceptions
After students finished the assignment and presented the solutions in the ICon
Lab, they were asked to provide feedback on the 4D learning module by completing a
survey. The survey investigated the value of the 4D learning module vs. 2D drawings
and a CPM schedule; the communication style of the group when they worked on the
assignment with the 4D module; the ease of reviewing and revising the schedule they
developed; the ease of presenting solutions to the class and the instructor; and to what
extent the students understood the SIPS process by using the 4D model. At the same
time they were asked to state what challenges they encountered when they worked on the
assignment and suggest improvements for the 4D module offered to them.
The survey results (see Figure 11) showed that students felt the 4D learning
module improved their understanding of the SIPS process. The students felt that they
were able to (1) communicate with their group members more efficiently; (2) easily
review their developed schedule; and (3) present their solutions to the class and the
instructor in a more interactive manner. It also helped them understand other groups’
solutions and learn about alternative schedules by graphically stepping through the
schedules in the class. Students provided positive feedback regarding the 4D modeling
activity and regarding the assignment design. While the survey showed the value of the
4D learning model, it also illustrated the difficulties that students had in fully
understanding the construction plan by reviewing a traditional CPM schedule.
The researcher also conducted informal discussions with the students, the
teaching assistant, and the instructor about the learning module. Informal discussions
56
with some students show that students were engaged by the 4D component implemented
into this course. They realized the benefits of the 4D technology and would like to use
this technology on their other appropriate course projects and future work. The teaching
assistant (who took this course in 2003, and acted as teaching assistant in both 2004 and
2005), said the 4D videos helped him a lot in identifying which groups more clearly
understand the constraints and how to use the resources to schedule the project. He
identified the most valuable part of the modules as the in-class discussion, which allowed
student groups to get feedback directly from their peers and the instructor.
4.4 Metrics for Future Module Assessment
In this study, the preliminary 4D learning module helped students achieve higher
quality solutions, enabled schedule presentations and on time feedback, and students
considered it as a beneficial and engaging tool for schedule visualization. Students also
stated that the 4D learning module improved their group communication in the
development of the SIPS schedule, which illustrated its potential value in improving the
group process. Based on this exploratory study, a more detailed 4D learning module
assessment plan was established, which examines the learning process, learning product,
and student perceptions. The group process can be examined by directly observing
student group meetings. For better data capture and analysis, observation can be
combined with video recording the group process. The assessment plan is shown as
following in Table 1:
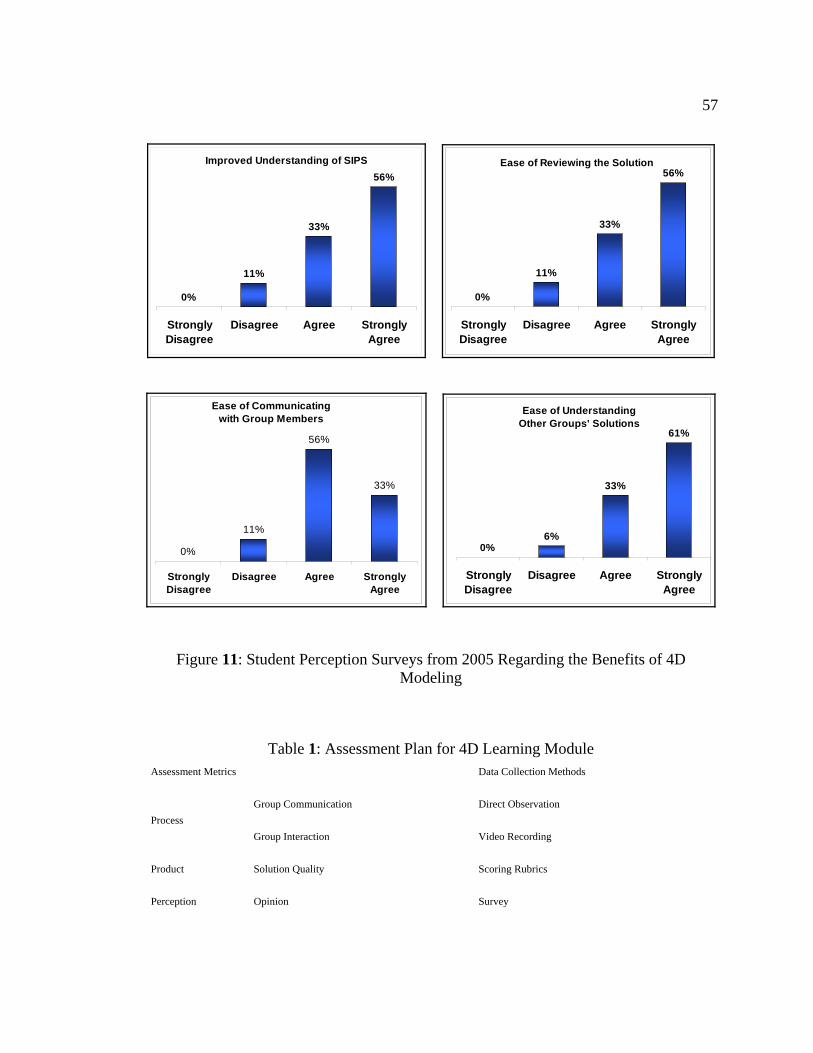
57
Improved Understanding of SIPS
0%
11%
33%
56%
StronglyDisagree
Disagree Agree StronglyAgree
Ease of Reviewing the Solution
0%
11%
33%
56%
StronglyDisagree
Disagree Agree StronglyAgree
Ease of Communicatingwith Group Members
0%
11%
56%
33%
StronglyDisagree
Disagree Agree StronglyAgree
Ease of UnderstandingOther Groups' Solutions
0%6%
33%
61%
StronglyDisagree
Disagree Agree StronglyAgree
Figure 11: Student Perception Surveys from 2005 Regarding the Benefits of 4D Modeling
Table 1: Assessment Plan for 4D Learning Module Assessment Metrics Data Collection Methods
Group Communication Direct Observation Process
Group Interaction Video Recording
Product Solution Quality Scoring Rubrics
Perception Opinion Survey
Chapter 5
Virtual Construction Simulator
The preliminary 4D learning module illustrates the value of the development of
4D models for visualizing the construction sequence. But the current 4D modeling
process requires additional time to develop the model since a planner must first generate
a schedule, and then link the schedule to a 3D model of the project. A VCS application
was developed, which allows a user to develop a construction schedule and a 4D CAD
model by selecting objects from within a 3D model. This chapter defines the interface
and the development process of the VCS prototype application.
5.1 The Interface
The VCS prototype allows for the grouping of 3D components into construction
assemblies, the development of activities from within the 3D interface, and the
sequencing of the activities. Following the development of the 4D schedule, the user
can review and revise the activities and their sequence. It considers the process of a
CPM schedule generation (create activities and sequence them), as well as the process of
a traditional 4D CAD model generation (group construction assemblies and link them
with the schedule). But it eliminates the linking process by allowing direct selection of
the corresponding objects of an activity and its successors from within the model.

59
5.1.1 Basic Components
The interface consists of a number of basic components including various sets of
buttons and pop up windows. Figure 12 shows the interface layout.
A: Mode Buttons
B: Execution Button
C: Pop Up Window
D: Layer Buttons
Mode Buttons
The mode buttons allow a user to go to one specific working mode. There are 6
mode buttons: Group (create a group), Ungroup (undo a group), Create (create an activity
for a group), Sequence (sequence activities), Finish (generate a CPM schedule and
calculate timers) and 4D (generate and review the 4D model).
Figure 12: Virtual Construction Simulator Interface
A D
B
C
60
For the first four working modes, the two main functions of the mode buttons are
to pop up the execution button and to make objects selectable. A selected object will
change color depending on the status of the current working mode. When no mode
button is selected, no execution button shows up, and the objects in the model are
non-selectable. For the Finish and 4D mode buttons, no execution button will pop up
when they are picked, since their mode buttons combine the function of the mode button
and the execution button for that mode.
Execution button
The execution buttons allow the execution of the tasks under a specific working
mode. There are four execution buttons: Group, Ungroup, Create and Sequence. They
are named the same as their corresponding working modes. The execution buttons are
designed to activate the pop up windows.
Pop Up Window
A pop up window consists of a number of texts, edit boxes and buttons. It
allows a user to input values and save these values by clicking an OK button. There are
three types of pop up windows: Group Name, Activity and Sequence. The use of these
three windows will be introduced in detail in Section 5.1.2.
Layer buttons
A layer button is used to hide/show a set of objects in the model. Organizing the
building into layers makes it easier to view, select and group similar building elements
while other layers are turned off. There are five layer buttons in this interface: H/S
(hide/show the background building), Frame (hide/show exterior ductile frames), Floor
(hide/show floor planks), Wall (hide/show interior wall members), and Con (hide/show
61
cast-in-place connections between ductile frames). These buttons are specific to the
MGM Grand Hotel 3D model for the prototype.
Navigation Mode Buttons (not in the interface)
The model can be zoomed, panned and rotated. A set of navigation mode
buttons were initially created for the interface, but they did not function properly due to
the limitation of the 3D game engine application. So in the final version of the VCS
prototype, there is no navigation mode button. Different navigation modes are achieved
by using a mouse instead of clicking buttons in the interface: holding the middle button
and dragging the mouse will zoom in/out the model; holding the right button and
dragging the mouse will pan the model; and holding the left button and dragging the
mouse will rotate the model.
5.1.2 Main Program Functions
The VCS is designed to allow a user to interact with the 3D model, group building
elements, create activities, sequence activities, and generate a 4D model and a CPM
schedule. This section will introduce the six main functions and how they are achieved
using the interface.
Group Building Elements
Building elements in the 3D model can be grouped into construction assemblies.
Figure 13 shows the steps a user follows to group a set of ductile frames:

62
1
4 3 2
Figure 13: Group Function
1. Click the “Group” mode button. This will pop up the “Group” execution
button and make the objects in the model selectable.
2. Select ductile frames one by one from the 3D model. When one frame is
selected, its color changes from the model color (dark green) to grey.
3. Click the “Group” execution button after selecting all the objects in the
group. The “Group Name” pop up window will appear.
4. Type in the group name in the edit box on the “Group Name” pop up
window. Click the OK button and a group is created.
Ungroup Building Elements
If a user changes her/his perspective about any previous grouping, the “Ungroup”
function will undo the grouping. The user performs the following steps:
1. Click the “Ungroup” mode button.
2. Pick any object in a group.
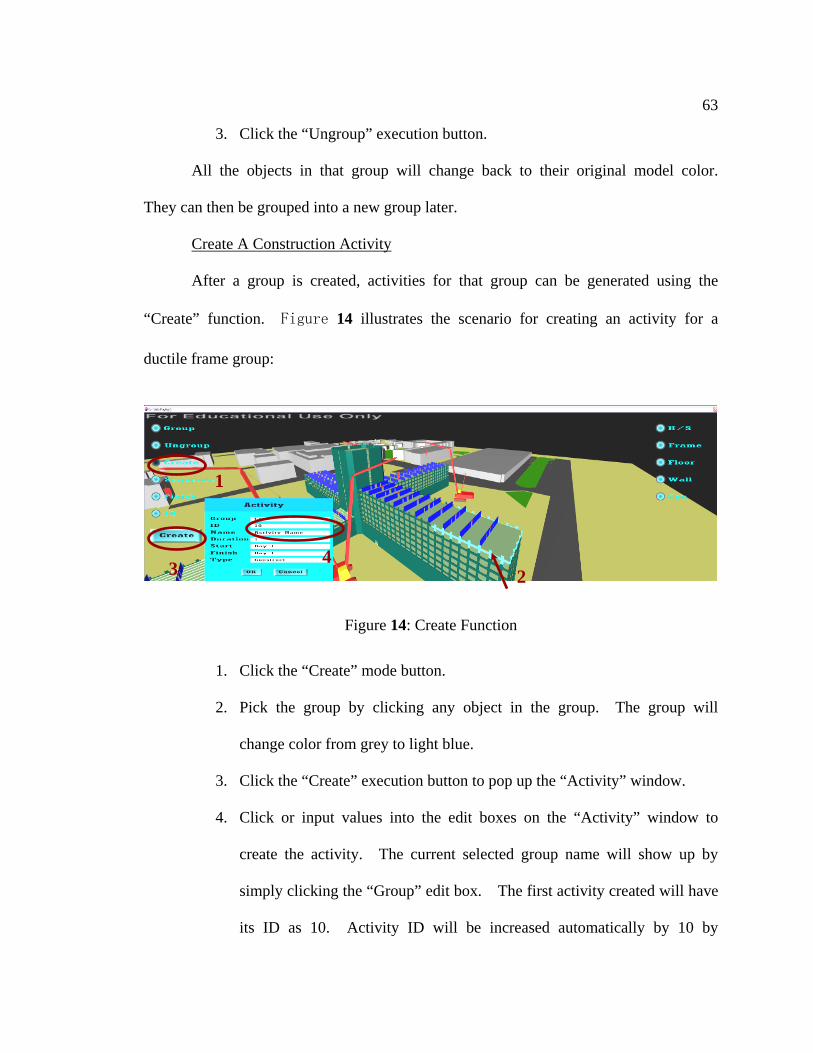
63
3. Click the “Ungroup” execution button.
All the objects in that group will change back to their original model color.
They can then be grouped into a new group later.
Create A Construction Activity
After a group is created, activities for that group can be generated using the
“Create” function. Figure 14 illustrates the scenario for creating an activity for a
ductile frame group:
1
4 3 2
Figure 14: Create Function
1. Click the “Create” mode button.
2. Pick the group by clicking any object in the group. The group will
change color from grey to light blue.
3. Click the “Create” execution button to pop up the “Activity” window.
4. Click or input values into the edit boxes on the “Activity” window to
create the activity. The current selected group name will show up by
simply clicking the “Group” edit box. The first activity created will have
its ID as 10. Activity ID will be increased automatically by 10 by
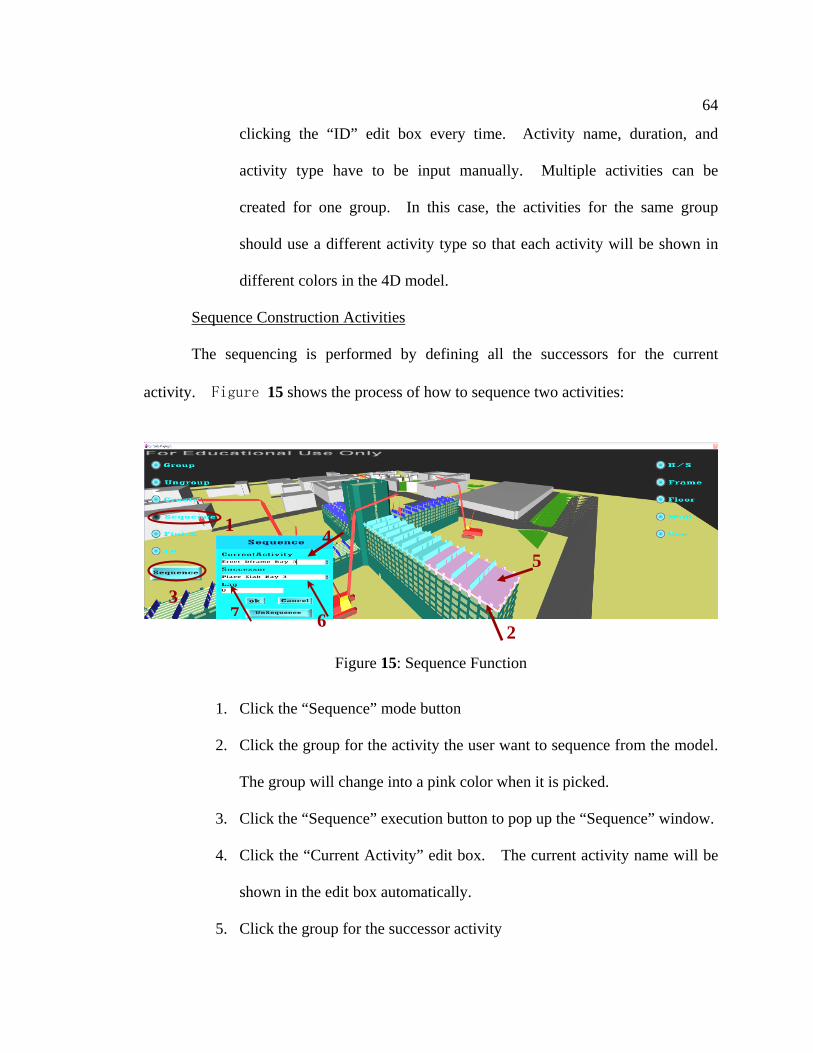
64
clicking the “ID” edit box every time. Activity name, duration, and
activity type have to be input manually. Multiple activities can be
created for one group. In this case, the activities for the same group
should use a different activity type so that each activity will be shown in
different colors in the 4D model.
Sequence Construction Activities
The sequencing is performed by defining all the successors for the current
activity. Figure 15 shows the process of how to sequence two activities:
1 4 5
3 7 6 2
Figure 15: Sequence Function
1. Click the “Sequence” mode button
2. Click the group for the activity the user want to sequence from the model.
The group will change into a pink color when it is picked.
3. Click the “Sequence” execution button to pop up the “Sequence” window.
4. Click the “Current Activity” edit box. The current activity name will be
shown in the edit box automatically.
5. Click the group for the successor activity

65
6. Click the “Successor” edit box. The successor activity name will be
shown in the edit box automatically. There is a spinner at the end of the
“Current Activity” and “Successor” edit box. When there are multiple
activities for one group, the spinner can be used to look up different
activities in that group.
7. If there is a lag between the two activities, the user can input the lag in the
“Lag” edit box. The lag can be either a negative or positive number. A
relationship between the two picked activities is created when the OK
button is clicked.
An “Unsequence” button is available to undo the sequencing when necessary.
The procedure is the same as that of the “Sequence” except the user must select the
“Unsequence” button in step 7 instead of the “OK” button.
Finish
The “Finish” mode button can be clicked after the building elements are grouped
and the activities are created and sequenced. When this button is clicked, the model will
disappear, and the CPM schedule and timer for each activity will be generated.
Each activity has a timer. When the timer is activated for an activity, the group
for that activity will appear. The timers are calculated in the “Finish” mode and
activated in the “4D” mode.
The schedule can either be generated as a .txt file, or an Excel file. A final CPM
schedule in Microsoft Project can be easily developed by mapping the Excel file to MS
Project, or by copying individual task information from the .txt file and pasting to MS
Project.

66
4D Model Playback
When clicking the “4D” mode button, the timer for each activity is activated
(timers for concurrent activities will be activated at the same time) and the 4D model is
generated to show the progress of the construction. A user can review the generated
schedule by looking at the 4D model, and make changes to the schedule by creating new
groups, generating new activities, and establishing new sequencing.
5.2 The Development Process
The VCS prototype is developed by using three applications: a 3D modeling
software (Autodesk VIZ), a 3D game engine (Deep Creator) and a database (Microsoft
SQL Server). This section will describe the process of how the prototype was
developed using these applications.
5.2.1 The Modeling
The modeling was separated into two parts. One part is the 3D construction
elements, and the other part is the user interface panels including buttons, windows, edit
boxes and 2D texts.
The 3D construction elements were modeled in Autodesk VIZ. The model was
improved from the preliminary model, which had one typical floor of the building. In
2005, students made several mistakes that may have been caused by not visualizing the
overall construction environment. In 2006, new elements were added to the model to

67
provide students a more realistic environment and more accurate detailed model.
Figure 16 is a screenshot of the 3D model. The core and four symmetrical wings of the
building were modeled, with each wing showing different progress of the construction.
The main construction equipment (cranes), staging area with construction materials, and
the surrounding buildings were modeled by referencing the construction photos and
Google Earth. The active part of the model is still one single floor. It consists of 27
ductile frames, 22 interior walls, 11 steel beams, 108 floor planks and 28 cast-in-place
connections between ductile frames. The other part of the model is grouped into one
element, so that it can be easily turned on and off.
Figure 16: MGM Grand Hotel 3D Model
The 3D VIZ model was converted to a .3ds file and imported into the Deep
Creator game engine. 2D objects such as 2D text blit, 2D screen blit, edit box, buttons,
radio buttons, and spinners were directly modeled in Deep Creator. They were put
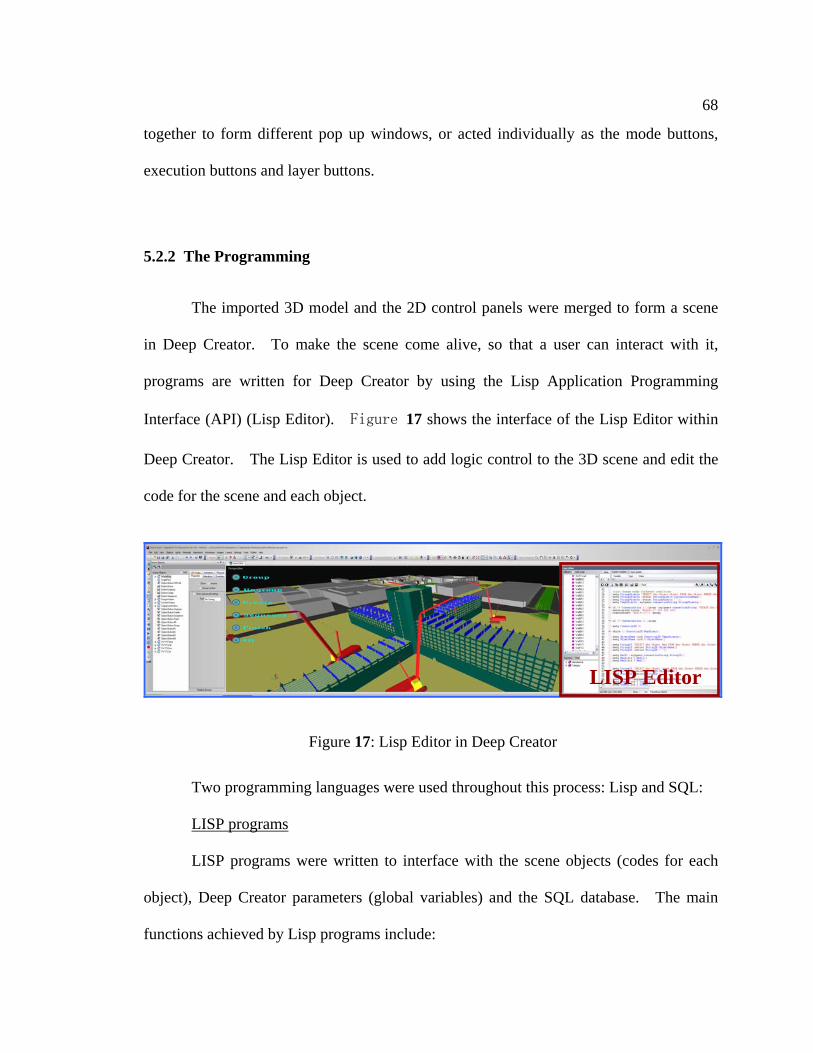
68
together to form different pop up windows, or acted individually as the mode buttons,
execution buttons and layer buttons.
5.2.2 The Programming
The imported 3D model and the 2D control panels were merged to form a scene
in Deep Creator. To make the scene come alive, so that a user can interact with it,
programs are written for Deep Creator by using the Lisp Application Programming
Interface (API) (Lisp Editor). Figure 17 shows the interface of the Lisp Editor within
Deep Creator. The Lisp Editor is used to add logic control to the 3D scene and edit the
code for the scene and each object.
LISP Editor
Figure 17: Lisp Editor in Deep Creator
Two programming languages were used throughout this process: Lisp and SQL:
LISP programs
LISP programs were written to interface with the scene objects (codes for each
object), Deep Creator parameters (global variables) and the SQL database. The main
functions achieved by Lisp programs include:
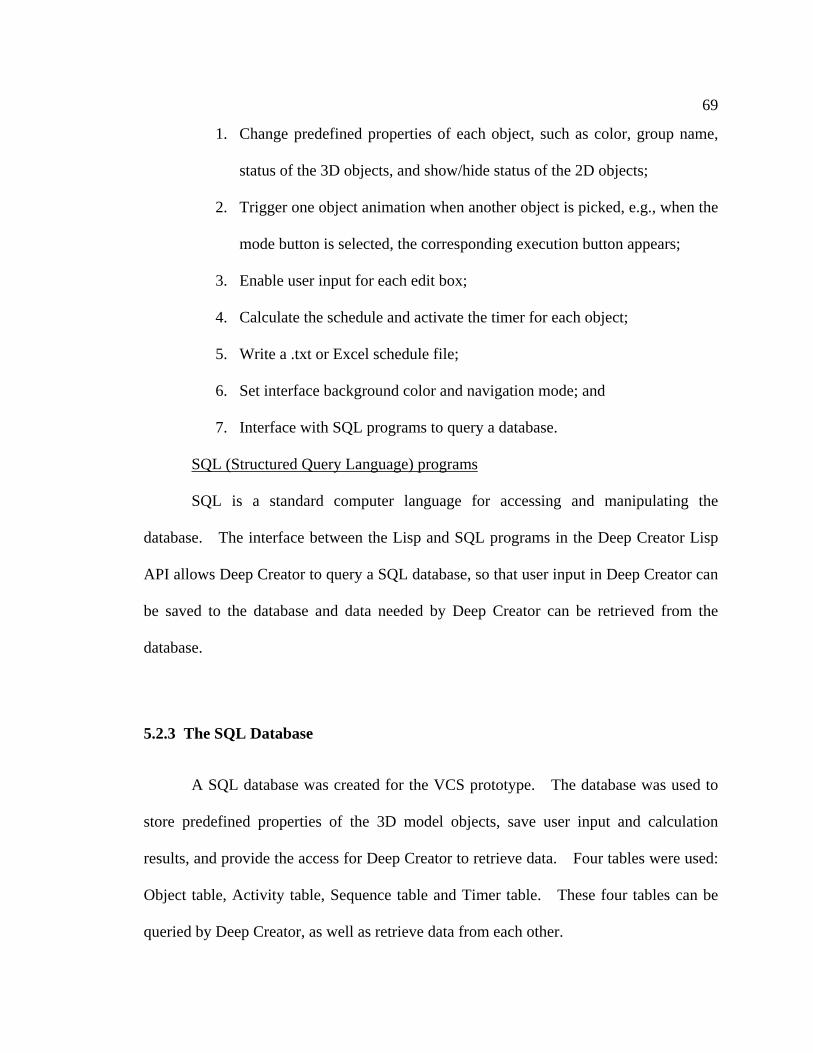
69
1. Change predefined properties of each object, such as color, group name,
status of the 3D objects, and show/hide status of the 2D objects;
2. Trigger one object animation when another object is picked, e.g., when the
mode button is selected, the corresponding execution button appears;
3. Enable user input for each edit box;
4. Calculate the schedule and activate the timer for each object;
5. Write a .txt or Excel schedule file;
6. Set interface background color and navigation mode; and
7. Interface with SQL programs to query a database.
SQL (Structured Query Language) programs
SQL is a standard computer language for accessing and manipulating the
database. The interface between the Lisp and SQL programs in the Deep Creator Lisp
API allows Deep Creator to query a SQL database, so that user input in Deep Creator can
be saved to the database and data needed by Deep Creator can be retrieved from the
database.
5.2.3 The SQL Database
A SQL database was created for the VCS prototype. The database was used to
store predefined properties of the 3D model objects, save user input and calculation
results, and provide the access for Deep Creator to retrieve data. Four tables were used:
Object table, Activity table, Sequence table and Timer table. These four tables can be
queried by Deep Creator, as well as retrieve data from each other.

70
Object Table
The Object table is used to store the predefined properties of the 3D objects,
including object ID, name, group name, status (object is under which working mode) and
RGB color.
The object name and group name are the same at the beginning, so that one object
can be a group by itself. Only when a user groups one object with other objects and
enter a new group name from the “Group Name” pop up window, all the objects in that
group will change their group name into the user defined name. In Figure 18, the
object Fr11 had the group name Fr11 before it was grouped. Following the grouping
with Fr12, Fr13 and Fr14, the group name for all these four objects changed to the user
defined group name of Bay 6 & 7 Frame.
The Status column shows which working mode an object is currently under, so
that the object can change color accordingly when it is selected. The default Status is 0,
which means the object is in its original model color. When the object status is 1, it
means the object is under the “Group” working mode and its color will change to grey
when picked. Status 2 and 3 are for “Create” and “Sequence” mode separately, and an
object will change to light blue under status 2 and pink under status 3.
The last three columns are the RGB color of the objects. When the status of an
object is changed, the number in these columns will change accordingly, so that the
object color is changed. These numbers are updated by the Lisp programs in Deep
Creator.
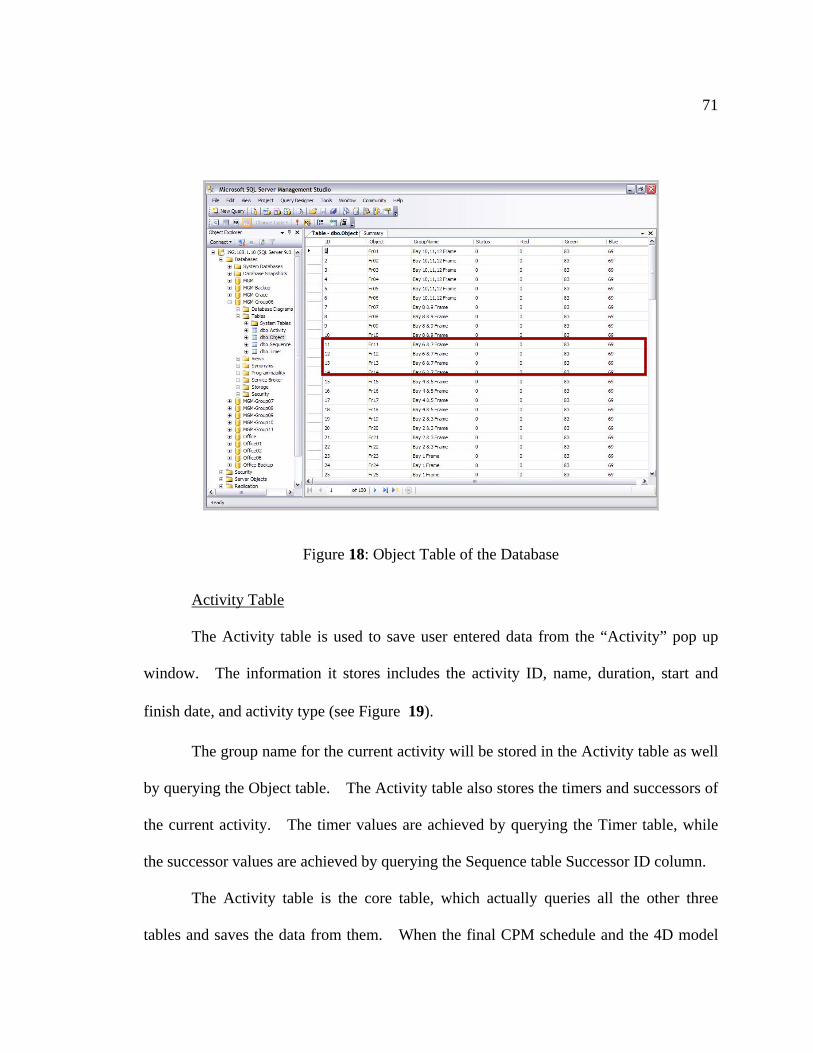
71
Figure 18: Object Table of the Database
Activity Table
The Activity table is used to save user entered data from the “Activity” pop up
window. The information it stores includes the activity ID, name, duration, start and
finish date, and activity type (see Figure 19).
The group name for the current activity will be stored in the Activity table as well
by querying the Object table. The Activity table also stores the timers and successors of
the current activity. The timer values are achieved by querying the Timer table, while
the successor values are achieved by querying the Sequence table Successor ID column.
The Activity table is the core table, which actually queries all the other three
tables and saves the data from them. When the final CPM schedule and the 4D model
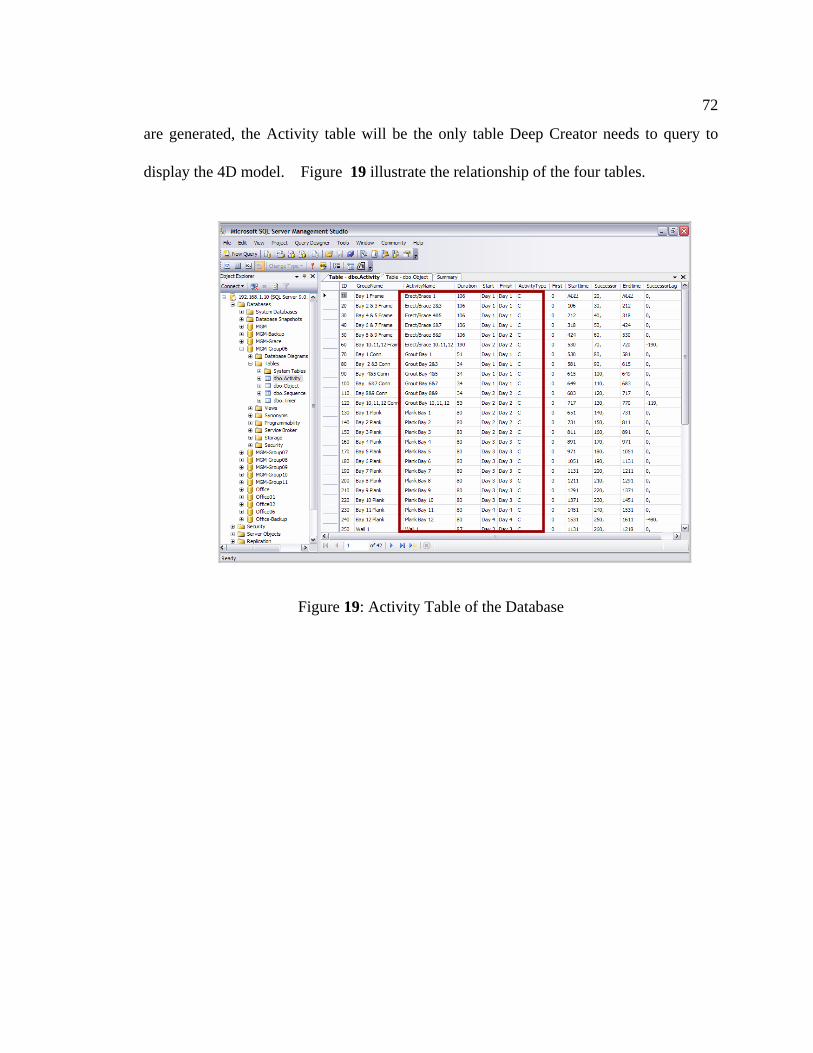
72
are generated, the Activity table will be the only table Deep Creator needs to query to
display the 4D model. Figure 19 illustrate the relationship of the four tables.
Figure 19: Activity Table of the Database
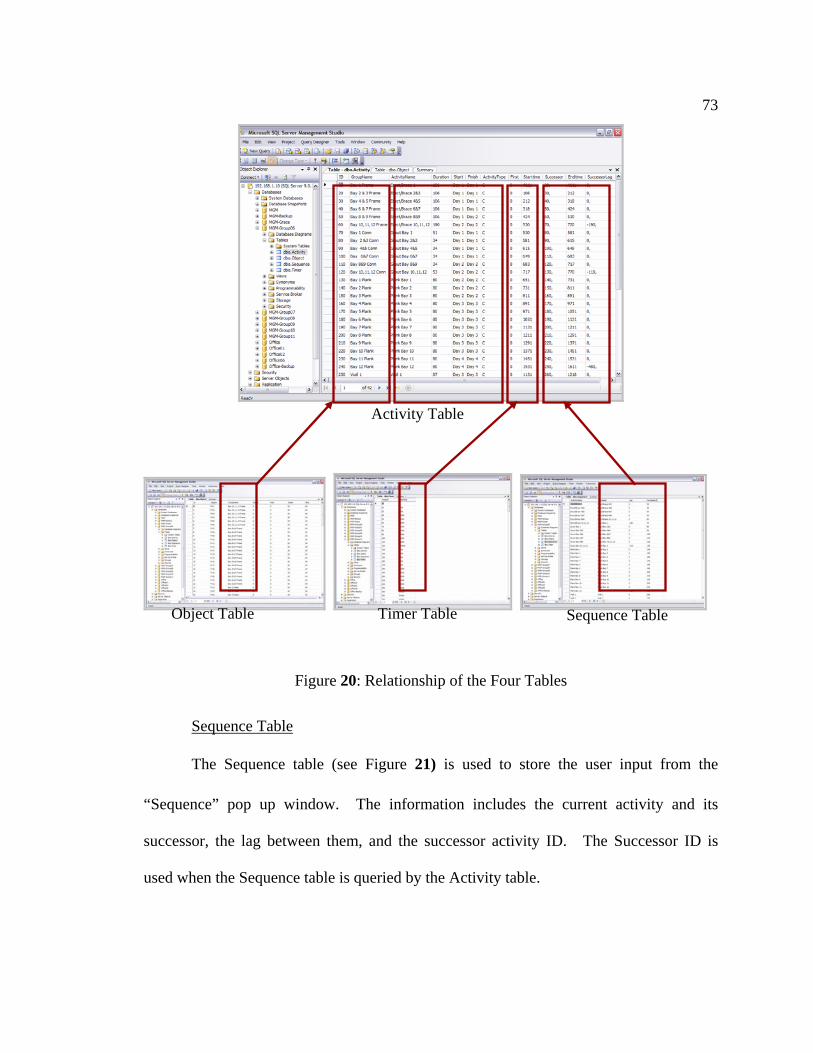
73
Sequence Table
The Sequence table (see Figure 21) is used to store the user input from the
“Sequence” pop up window. The information includes the current activity and its
successor, the lag between them, and the successor activity ID. The Successor ID is
used when the Sequence table is queried by the Activity table.
Activity Table
Object Table Timer Table Sequence Table
Figure 20: Relationship of the Four Tables

74
Figure 21: Sequence Table of the Database
Timer Table
The Timer table (see Figure 22) is used to store timers for each activity. When
the “Finish” radio button is clicked, the LISP program will calculate timers for each
activity, then save all the timers into the Timer table. This table will be queried by the
Activity table to retrieve the timer for each activity.

75
Figure 22: Timer Table of the Database
5.2.4 Summary of the Development Process
Figure 23 summarizes the workflow of the development process: the 3D VIZ
model was imported into Deep Creator and formed a scene with the 2D control panels
modeled in Deep Creator. Lisp codes were written for the scene and each object to
achieve the functions of the prototype, while SQL codes were used to save user input and
retrieve data from the database. A SQL database was created with four data tables for
Deep Creator to query data.

76
Lisp
SQL The Programming
Activity Table
Figure 23: Workflow of the VCS Development Process
Object Table Timer Table Sequence Table
The Modeling
The Database
Chapter 6
Assessment of the Virtual Construction Simulator
An experiment was performed to assess the potential value gained by using the
VCS prototype. The experiment was designed to compare the VCS prototype with a
traditional 4D CAD interface by examining the student learning process (student
communications, interactions, use of the 3D model), learning product (the quality of
generated construction schedules) and student perspectives when they used the two
different interfaces to develop a SIPS schedule for the MGM Grand Hotel project. This
chapter describes the experiment details, data collection, data analysis and results.
6.1 The Experiment
6.1.1 Display Systems
The experiment was conducted by using the 3-screen display system and a
SMART Board interactive whiteboard as the fourth display in the ICon Lab at Penn State.
Figure 24 shows the display systems.
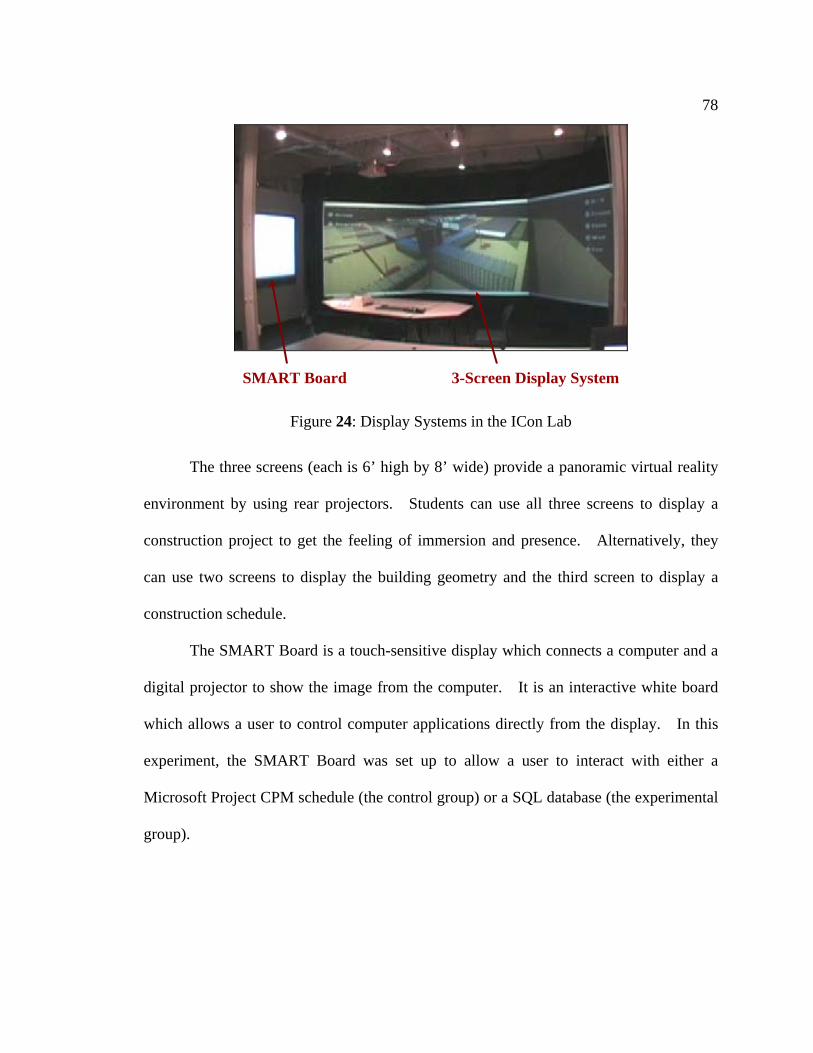
78
3-Screen Display System SMART Board
Figure 24: Display Systems in the ICon Lab
The three screens (each is 6’ high by 8’ wide) provide a panoramic virtual reality
environment by using rear projectors. Students can use all three screens to display a
construction project to get the feeling of immersion and presence. Alternatively, they
can use two screens to display the building geometry and the third screen to display a
construction schedule.
The SMART Board is a touch-sensitive display which connects a computer and a
digital projector to show the image from the computer. It is an interactive white board
which allows a user to control computer applications directly from the display. In this
experiment, the SMART Board was set up to allow a user to interact with either a
Microsoft Project CPM schedule (the control group) or a SQL database (the experimental
group).
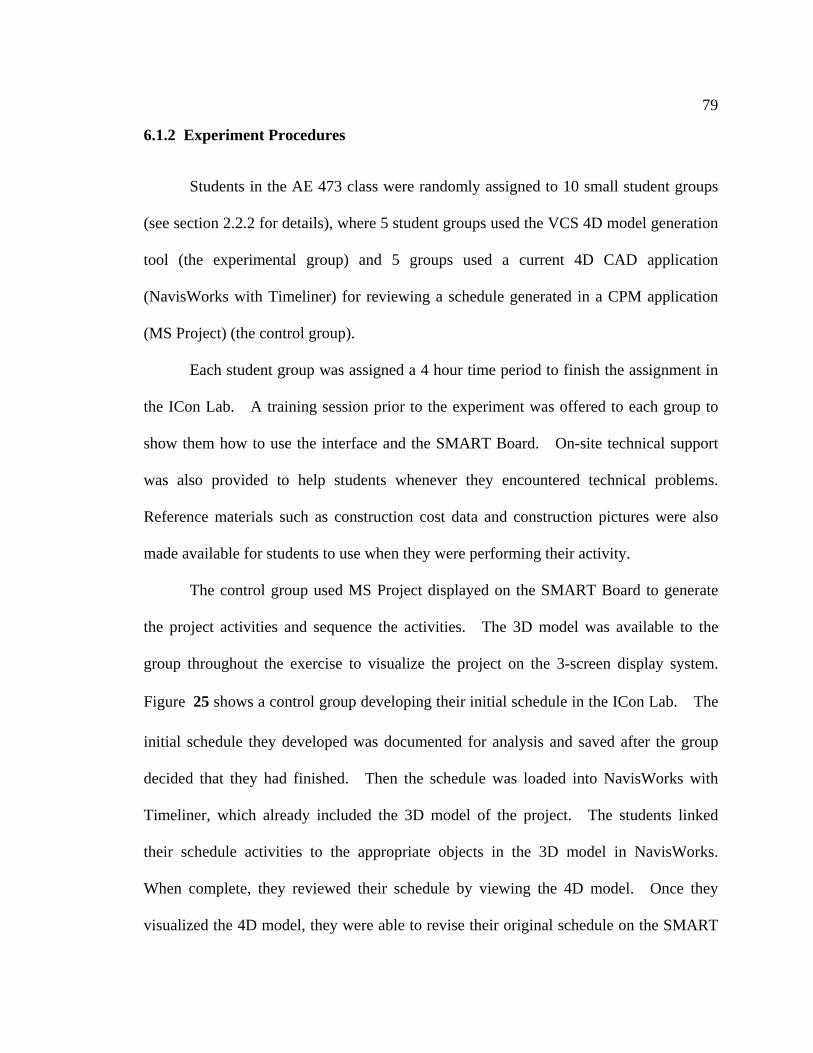
79
6.1.2 Experiment Procedures
Students in the AE 473 class were randomly assigned to 10 small student groups
(see section 2.2.2 for details), where 5 student groups used the VCS 4D model generation
tool (the experimental group) and 5 groups used a current 4D CAD application
(NavisWorks with Timeliner) for reviewing a schedule generated in a CPM application
(MS Project) (the control group).
Each student group was assigned a 4 hour time period to finish the assignment in
the ICon Lab. A training session prior to the experiment was offered to each group to
show them how to use the interface and the SMART Board. On-site technical support
was also provided to help students whenever they encountered technical problems.
Reference materials such as construction cost data and construction pictures were also
made available for students to use when they were performing their activity.
The control group used MS Project displayed on the SMART Board to generate
the project activities and sequence the activities. The 3D model was available to the
group throughout the exercise to visualize the project on the 3-screen display system.
Figure 25 shows a control group developing their initial schedule in the ICon Lab. The
initial schedule they developed was documented for analysis and saved after the group
decided that they had finished. Then the schedule was loaded into NavisWorks with
Timeliner, which already included the 3D model of the project. The students linked
their schedule activities to the appropriate objects in the 3D model in NavisWorks.
When complete, they reviewed their schedule by viewing the 4D model. Once they
visualized the 4D model, they were able to revise their original schedule on the SMART

80
Board and then update their schedule (using the update function in NavisWorks) so that
they could see the revisions. The final schedule and the 4D model were saved and
provided to the student group for future use in completing the class assignment.
3-Screen Display with 3D/4D Model SMART Board with CPM Schedule
NavisWorks MS Project
Figure 25: One Control Group
The experimental group used the Deep Creator game engine prototype for
grouping 3D elements, developing the activities, sequencing the activities, and
visualizing the 4D model. They had the 3D model on the three large screen display
system. They were able to pick 3D objects in the model and group them. They were
also able to generate activities and sequence them from within the 3D model. Data from
using the VCS was saved to the SQL database (SQL Management Studio) and displayed
on the SMART Board, which allowed the group to review the activities and the sequence
they generated. Figure 26 shows students in an experimental student group discussing
sequencing alternatives when they were developing their initial schedule. After
developing their initial sequence, the group was able to review the 4D model using the
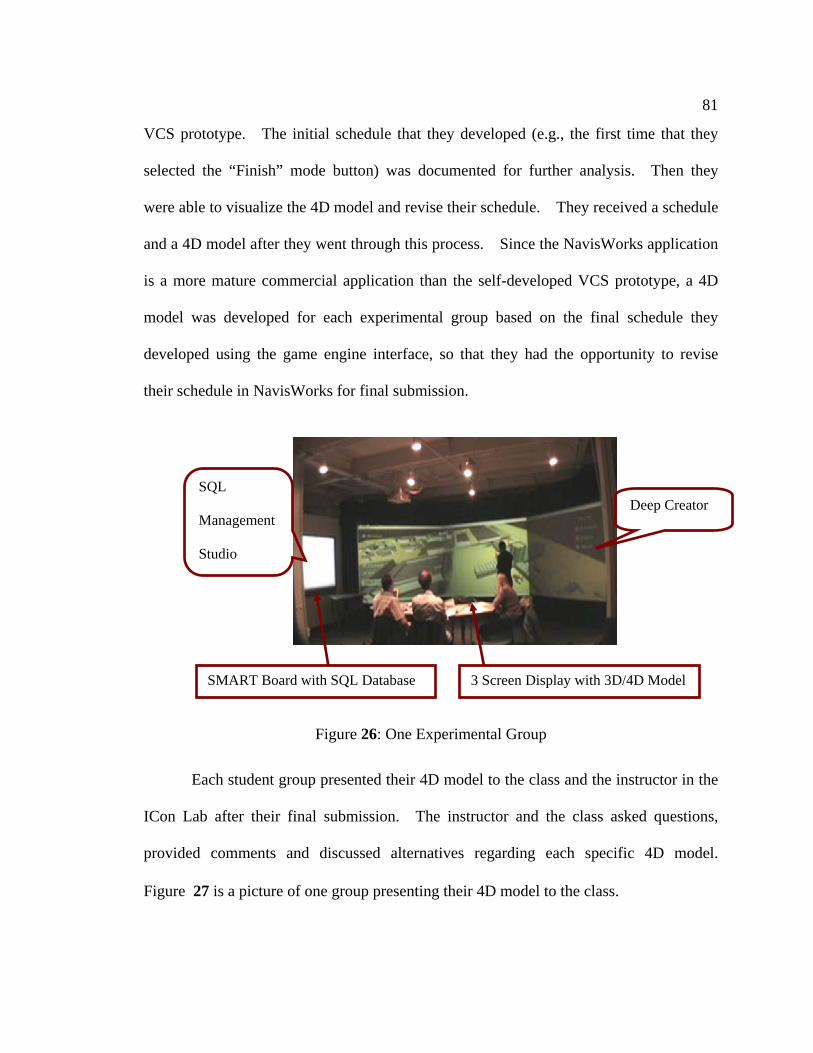
81
VCS prototype. The initial schedule that they developed (e.g., the first time that they
selected the “Finish” mode button) was documented for further analysis. Then they
were able to visualize the 4D model and revise their schedule. They received a schedule
and a 4D model after they went through this process. Since the NavisWorks application
is a more mature commercial application than the self-developed VCS prototype, a 4D
model was developed for each experimental group based on the final schedule they
developed using the game engine interface, so that they had the opportunity to revise
their schedule in NavisWorks for final submission.
3 Screen Display with 3D/4D ModelSMART Board with SQL Database
Deep Creator SQL
Management
Studio
Figure 26: One Experimental Group
Each student group presented their 4D model to the class and the instructor in the
ICon Lab after their final submission. The instructor and the class asked questions,
provided comments and discussed alternatives regarding each specific 4D model.
Figure 27 is a picture of one group presenting their 4D model to the class.

82
Figure 27: Group Presentation of a 4D Model in Class
6.2 Data Collection
Various types of data were collected during and after the experiment. This
section introduces the data collection process.
6.2.1 Data for Measuring Group Process
One objective of this experiment was to examine the group process for both the
control group and the experimental group. To achieve this objective, group activities
and communications were observed and videotaped when student groups were working
on the project in the ICon Lab. A video analysis software (Studiocode) was used to live
capture the observations. The videos were captured and saved directly onto an Apple
Macintosh computer hard drive. Since the communications of the students would be
analyzed, it was very important to get high quality audio during the capture. A pair of

83
Pressure Zone Microphones (PZM) was used to accurately record audio. They were put
on the flat surface table that students sit around and picked sound from the entire room
with good accuracy. Figure 28 shows the audio and video capture equipment and the
Macintosh computer used in the experiment.

84
Camcorder for Video Capture
PZM for Audio Capture
Macintosh Computer
Figure 28: Audio & Video Recording Equipment

85
6.2.2 Data for Measuring Group Product
Three types of group product data were collected: the initial schedule, the final
schedule, and the SIPS assignment. Initial schedules of both groups were documented,
so that the quality of the initial schedules that were developed using different interfaces
could be compared. For the control groups, they used MS Project to develop the
schedules. When a group decided they had finished developing the schedule, they were
asked to save two copies of the schedule. One copy was for research purpose and saved
as the initial schedule, and another copy was used to develop the 4D model in
NavisWorks. For the experimental groups, the initial schedule was generated
automatically when they clicked the “Finish” mode button. The initial schedule in an
Excel file was documented by the researcher. Then the group could proceed to revise
the schedule after they reviewed the 4D model they developed.
The quality of the initial schedules was evaluated by the course teaching assistant
using a standard schedule evaluation form (See Appendix B). The researcher created
4D models using the initial schedule that each group generated, so that it was easier for
the teaching assistant to review the schedules and evaluate their quality. Since the
researcher created 4D models for the control group in NavisWorks 4D modeling tool, and
the experimental group had the 4D models in Deep Creator, the grading was not blind.
The teaching assistant felt that the experimental group had better planning than the
control group.
The grading was blind for both the final schedule and the SIPS assignment. The
teaching assistant did not know which group the assignment was from. Data showing

86
the quality of the final schedule were obtained from the teaching assistant who graded the
assignment using a standard scoring rubric. The average scores of the final schedule
portion of the control group and the experimental group were calculated to compare the
quality of the final schedule.
The final scores of the SIPS assignment for each group were obtained from the
teaching assistant as well. The average scores for the SIPS assignment for the control
group and the experimental group were also calculated to compare the quality of the
overall SIPS assignment.
6.2.3 Data for Measuring Student Perspectives
Surveys were conducted after the experiment (See Appendix C-Survey I) and
following the SIPS in class presentation (See Appendix D-Survey II) to obtain
perceptions of the students from both experiment groups. The survey questions
consisted of both quantitative and qualitative questions.
The quantitative data in the surveys consisted of the responses of the participants
to several questions on a Likert scale of 1 to 5 (1-strongly disagree to 5-strongly agree).
For Survey I, all 16 students in the control group returned the questionnaire, which made
the response rate 100%; 16 out of 18 students from the experimental group returned the
questionnaire at a response rate of 89%. For Survey II, 14 out of 16 students returned
the questionnaire, which made the response rate 87.5%; and 16 out of 18 students from
the experimental group returned the questionnaire, which made the response rate 89%.
Table 2 shows the response rate of each group.

87
Table 2: Survey Response Rate for the Control and Experimental Groups Control Group (16 Students) Experimental Group (18 Students)
# Returned Response Rate # Returned Response Rate
Survey I 16 100% 16 89%
Survey II 14 87.5% 16 89%
The qualitative data included questions asking students the challenges they
encountered, what they liked about the experience, and comments and suggestions for
future improvement of the assignment.
6.3 Data Analysis & Results
6.3.1 Video Analysis & Results
The videos were analyzed by using Studiocode to examine student group process.
The video analysis results are presented in this section.
6.3.1.1 Coding Scheme
A multi-level coding scheme was developed to code the time spent on different
categories when students were developing their SIPS in the ICon Lab. Figure 29 shows
the coding scheme. The coding scheme examines student group communications and
interactions.

88
Figure 29: Group Process Coding Scheme
The group communication portion of the scheme was adopted from a theoretical
framework used in examining group communications in the design process (Stempfle et
al., 2002). When used in this research, the communication categories were defined
according to project related content, technical content and others. Details are in the
following section:
1. Project content related communications
Goal Clarification: Questions, answers, or statements which clarify the goals
and objectives which the group needs to achieve along with the requirements
which they need to fulfill. Examples taken from the experiment include:
“So, we are doing the entire building, right? No, just one wing, one floor.”
“First we are going to figure out how long the ductile frames will take.”
“Our final goal was 4.23 days, wasn’t it?”
89
Solution Generation: Questions or statements which propose potential
solutions or new ideas that were not proposed previously within the group’s
discussion. Some solutions could be more detailed solutions of the previous
ones. As long as it is not exactly the same as the previous one, it is counted as a
new solution generation. These solutions can be related to meeting any of the
goals within the project, including activity duration, division of work, resource
utilization, or activity sequencing. Examples taken from the experiment include:
"I think we need to work around the clock”
“Are we going to put up the two walls, then put up the connecting piece?”
“Do you want to break them up into two bays a time?”
Analysis: Questions, answers or statements which clarify, explain, or develop
additional information regarding a proposed solution. Examples taken from the
experiment include:
• Clarification Questions for a proposed solution: For example, if a
student says, “I think we should construct the walls by bays” (a Solution
Generation statement), then a student may follow this with a question such
as “Are we going to perform the construction by two bays or three bays?”
(An Analysis question)
• Explanation of one’s solution idea when others ask questions about the
idea
• Clarify the given piece of information in the assignment or in the model.
For example, “There’s one crane for each wing. So for our purpose, we
really only have one crane to work with.”
90
• Calculations of durations for activities
“If we did like a bay, we almost have less than a half day per bay.”
“There will be more frames in the group C, so we need to leave more time for
this group”
• Hypothesis:
“So, we are going to assume 7 work days?”
Evaluation: Questions, answers or statements which provide or seek a value
judgment related to a proposed solution or a comparison of multiple solutions.
When students had different evaluations on one specific solution, even if they
happened at the same time, they should be counted as two instances. Examples
taken from the experiment include:
• Questioning the proposed ideas:
For example, “Are you sure we can work on weekends?”
• Comparison of multiple alternatives
• Positive evaluation:
For example, “That looks good”
• Negative evaluation:
For example, “I would rather do it in one direction rather than going back
and forth”
• Expression of uncertainty:
“I’m not sure if we can do it in this way”

91
Decision: Statements related to conclusive decisions for or against a solution.
The decision should be a final decision agreed upon by the entire group. It is
noted throughout the communication that in many cases, one student will express
the decision and others will silently agree. This has to be decided by looking at
if the group had additional discussion about the current topic or finally executed it
or not. If the group finally didn’t do it in this way, it should be an evaluation
instance instead of a decision instance. An example taken from the experiment
includes:
“Ok, we are going to pick this element first.” (There was not additional discussion
from the group)
2. Technical communications: Questions, answers or statements which focus on
the use of the technology tools and applications. Technology such as the SMART
Board, Microsoft Project and 4D CAD applications (NavisWorks with Timeliner
and the Deep Creator Game Engine module) were used in this experiment.
Students were not familiar with the technology. Even though they were
provided a brief training session before they started the experiment, they were still
confronted with different technology issues when they used the tools. Students
talked among themselves about these technical issues, as well as asked for
assistance from the on-site technical support personnel. Communications related
to these issues are categorized as technical communication. Students are not
supposed to asked questions about the project. In very few cases, when some
groups ask project related questions, it was counted in this category as well, since
the assistant usually would not answer those questions.
92
3. Other: All other communications not included in the previously defined
categories. For example, students may discuss unrelated topics such as the
weather or unrelated course information. Note that silence was excluded from all
categories so there is no categorization of silence. Natural brief silence in the
flow of communication is counted into the same category of the flow.
The group interaction was also examined since the researcher observed
differences in the interactions between the control groups and experimental groups in the
experiment. In the coding scheme, two types of group interaction are defined as:
1. Collaborative Interaction: Mutual engagement of students in a coordinated effort
to solve a problem.
2. Cooperative Interaction: Division of labor so that different people are responsible
for portions of the work.
The hypothesis for this research is that a collaborative process produces a more
effective group learning experience since in collaborative interaction, all members in the
group focus on the same topic and all of them learn more about that topic at the same
time through discussions. In cooperative learning, each individual focuses on their own
task, it is an effective way to finish a task faster, but it may not allow all members in a
group to achieve a maximum learning experience.
Though not shown in Figure 29, the average time of using the 3D model during
the overall schedule generation time was also coded.
93
6.3.1.2 Reliability Test
A stability test and an inter-rater reliability test were performed to verify the video
analysis results. The researcher performed a stability test by recoding the videos until
she agreed with herself. Later, an inter-rater reliability test was performed to measure
the extent to which coding produces the same results when the video was coded by
multiple coders. A 12-minute video was randomly identified, and the researcher’s
advisor and two graduate students in the construction engineering and management
option coded the video. Each of them was provided basic training for using Studiocode.
Then a copy of the coding scheme description was made available to them. They coded
the video by referencing the description in the coding scheme. During this process, no
questions related to the coding scheme were answered, and the researcher only provided
technical support for using Studiocode. The coders had to code the video based on their
understanding of the descriptions in the coding scheme.
When the coders finished coding the video, their video analysis results were
compared with that of the researcher. A discussion was conducted to examine and
resolve the discrepancies. The co-agreement level was measured by calculating the
percentage of agreement between different coders. The percentage of agreement
involved calculating the ratio of coding agreement durations to the total duration of the
video. The agreement level is 93% on average among the 4 coders after the discussion.
Figure 30 shows the extent to which the 4 coders agree with each other after the
discussion.
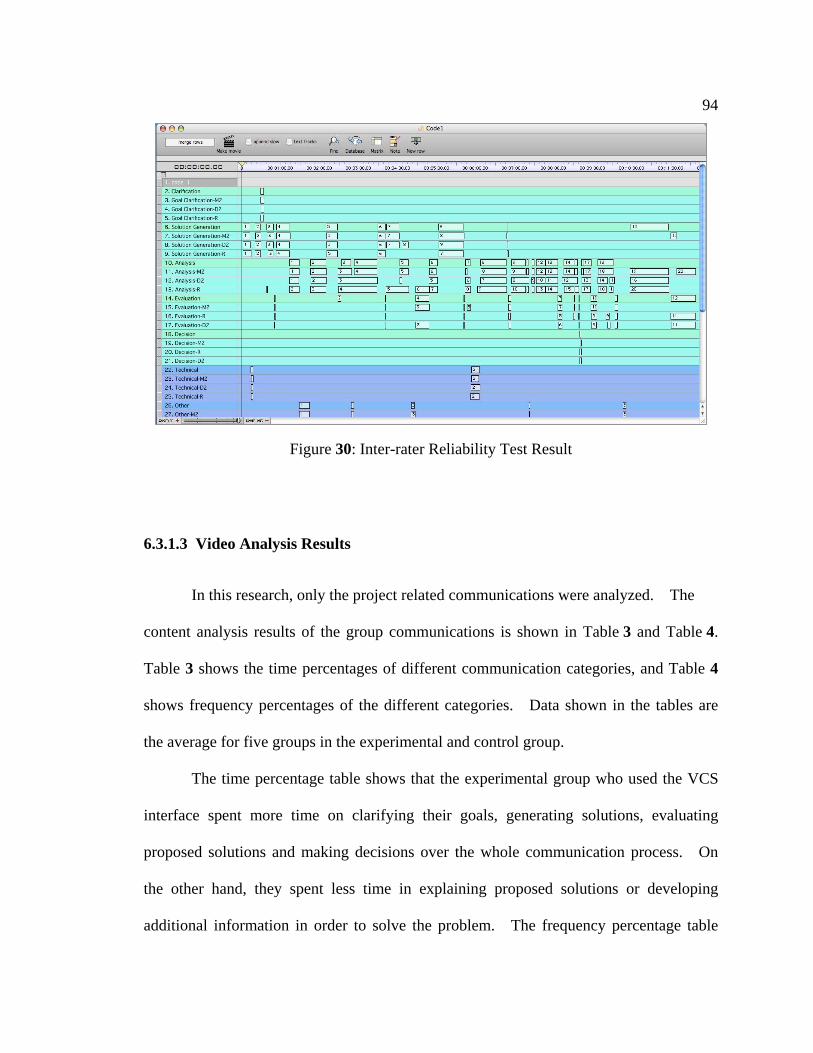
94
Figure 30: Inter-rater Reliability Test Result
6.3.1.3 Video Analysis Results
In this research, only the project related communications were analyzed. The
content analysis results of the group communications is shown in Table 3 and Table 4.
Table 3 shows the time percentages of different communication categories, and Table 4
shows frequency percentages of the different categories. Data shown in the tables are
the average for five groups in the experimental and control group.
The time percentage table shows that the experimental group who used the VCS
interface spent more time on clarifying their goals, generating solutions, evaluating
proposed solutions and making decisions over the whole communication process. On
the other hand, they spent less time in explaining proposed solutions or developing
additional information in order to solve the problem. The frequency percentage table
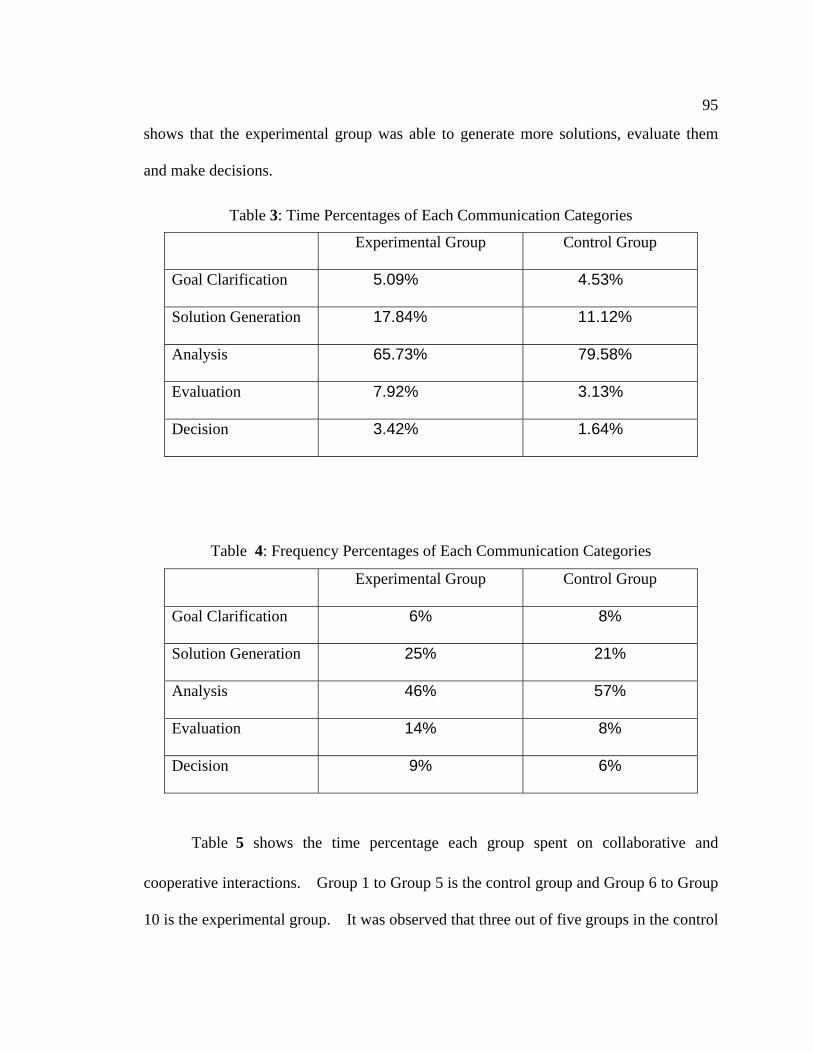
95
shows that the experimental group was able to generate more solutions, evaluate them
and make decisions.
Table 3: Time Percentages of Each Communication Categories
Experimental Group Control Group
Goal Clarification 5.09% 4.53%
Solution Generation 17.84% 11.12%
Analysis 65.73% 79.58%
Evaluation 7.92% 3.13%
Decision 3.42% 1.64%
Table 4: Frequency Percentages of Each Communication Categories
Experimental Group Control Group
Goal Clarification 6% 8%
Solution Generation 25% 21%
Analysis 46% 57%
Evaluation 14% 8%
Decision 9% 6%
Table 5 shows the time percentage each group spent on collaborative and
cooperative interactions. Group 1 to Group 5 is the control group and Group 6 to Group
10 is the experimental group. It was observed that three out of five groups in the control

96
group had cooperative interactions throughout the process. One group spent a
significant amount of time using cooperative interaction (56% of the overall process).
Though the other two groups did not have large amounts of cooperative interaction, it
was still important to note that no cooperative interaction was observed in any of the
experimental groups.
6.3.2 Quality of the Initial Schedule, Final Schedule and SIPS Assignment
Quality of the initial schedules, the final submitted schedules and the SIPS
assignment were evaluated. Table 6 summaries the results of the quality comparison
between the control group and the experimental group. Since the amount of students in
each group was small (16 and 18 separately), no statistical test was conducted. The
average score was compared between the two groups. Based on a 30-point scale, the
average score for the control group was a 20.80, and the average score for the
experimental group was a 21.16. The quality of the final submitted schedule was
compared between the two groups as well. Based on a 30-point scale, the average score
Table 5: Collaborative vs. Cooperative Interaction Time Percentages Control Group (NavisWorks) (%) Experimental Group (VCS) (%)
Group G1 G2 G3 G4 G5 G6 G7 G8 G9 G10
Collaborative 44 97 98 100 100 100 100 100 100 100
Cooperative 56 3 2 0 0 0 0 0 0 0
Group Size 4 3 3 3 2 2 3 4 3 3
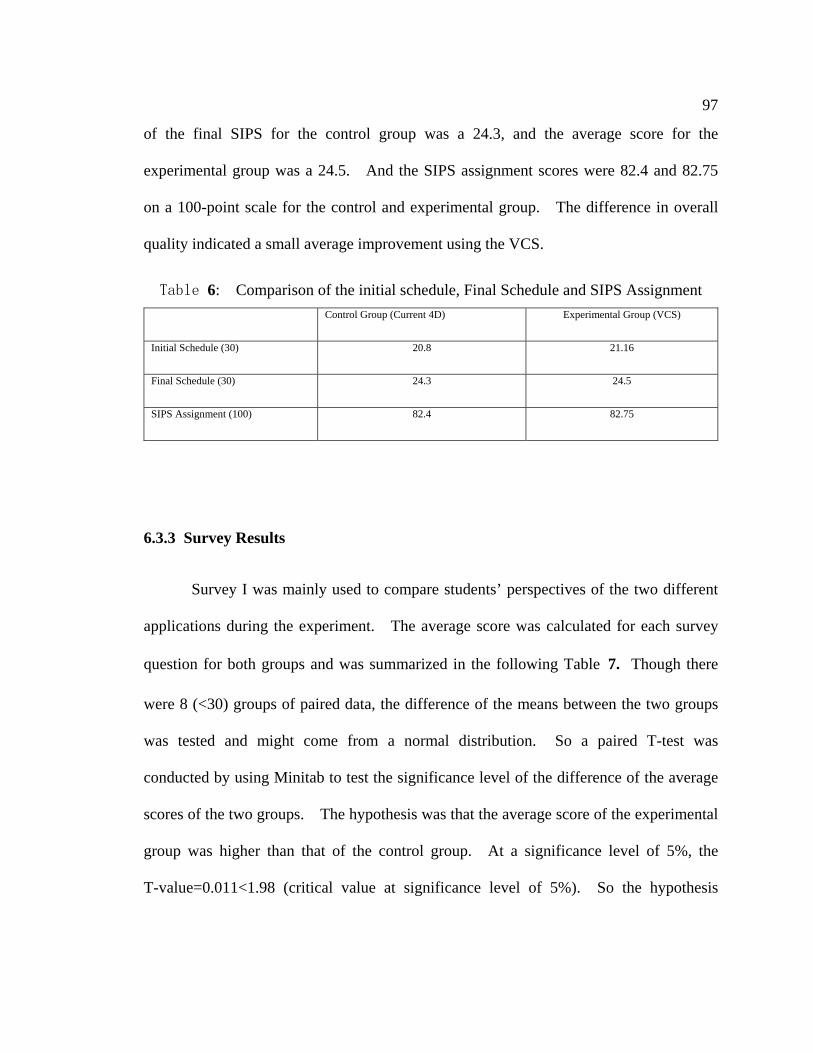
97
of the final SIPS for the control group was a 24.3, and the average score for the
experimental group was a 24.5. And the SIPS assignment scores were 82.4 and 82.75
on a 100-point scale for the control and experimental group. The difference in overall
quality indicated a small average improvement using the VCS.
6.3.3 Survey Results
Survey I was mainly used to compare students’ perspectives of the two different
applications during the experiment. The average score was calculated for each survey
question for both groups and was summarized in the following Table 7. Though there
were 8 (<30) groups of paired data, the difference of the means between the two groups
was tested and might come from a normal distribution. So a paired T-test was
conducted by using Minitab to test the significance level of the difference of the average
scores of the two groups. The hypothesis was that the average score of the experimental
group was higher than that of the control group. At a significance level of 5%, the
T-value=0.011<1.98 (critical value at significance level of 5%). So the hypothesis
Table 6: Comparison of the initial schedule, Final Schedule and SIPS Assignment Control Group (Current 4D) Experimental Group (VCS)
Initial Schedule (30) 20.8 21.16
Final Schedule (30) 24.3 24.5
SIPS Assignment (100) 82.4 82.75

98
could not be rejected, and the average score of the experimental group was higher than
that of a control group, and the difference was significant.
Table 7: Summary of Survey I Results
Difference
(VCS-NW) Survey Questions NavisWorks VCS
1. It was valuable to have a large scale 3D model
when developing our schedule 4.13 4.69 0.56
2. Our group adequately utilized the 3D model when
developing our schedule 3.31 4.19 0.88
3. The 3D model helped me in generating ideas and
evaluating other people’s ideas 3.81 4.31 0.50
4. The 3D model provided a common media to keep
the whole group focused throughout the process of
developing the schedule
3.94 4.25 0.31
5. The 4D model made it easier for me to
communicate with my team members when we
worked on the assignment.
4.14 4.25 0.11
6. The 4D model in the ICon Lab was helpful for
examining the schedule we developed. 4.56 4.44 -0.13
7. I felt more confident in our schedule after
reviewing the 4D model. 4.06 4.00 -0.06
8. The 4D modeling activity helped me gain a better
understanding of the SIPS process. 4.06 3.94 -0.13
Some detailed results from Survey I are included in the following figures. These
results show that students using the VCS (experimental group) feel that the 3D model is
more valuable (Figure 31) and fully utilized (Figure 32) in helping them develop the
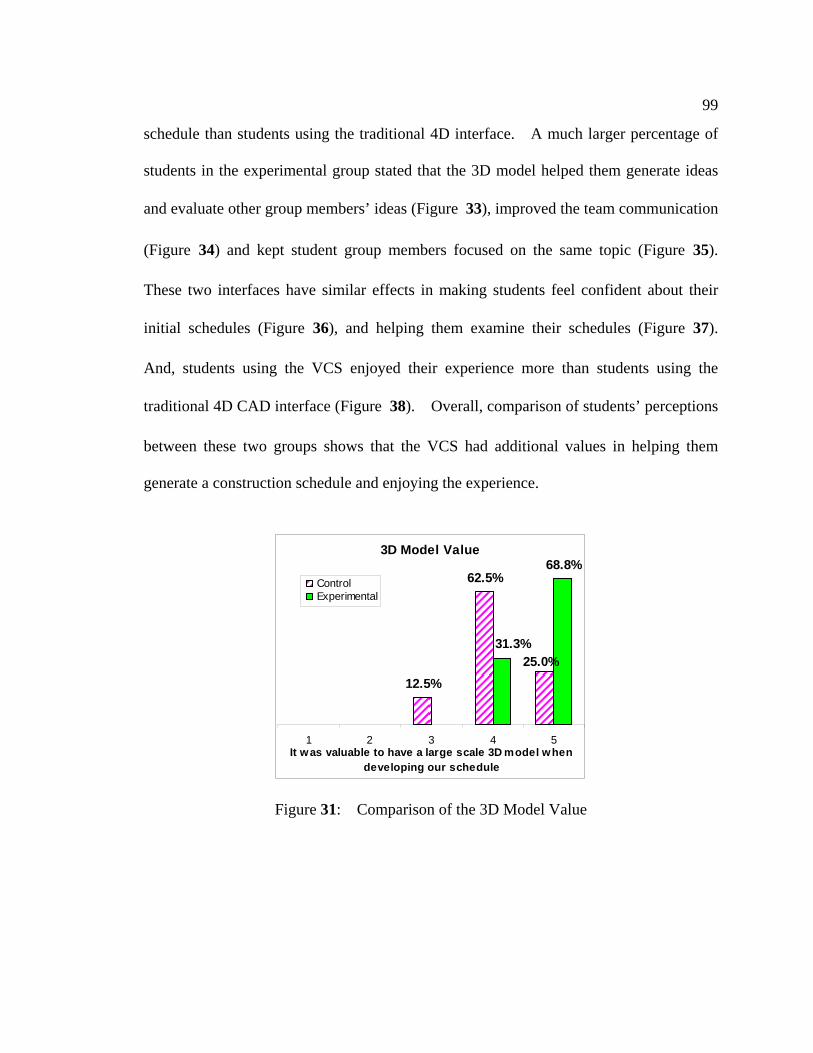
99
schedule than students using the traditional 4D interface. A much larger percentage of
students in the experimental group stated that the 3D model helped them generate ideas
and evaluate other group members’ ideas (Figure 33), improved the team communication
(Figure 34) and kept student group members focused on the same topic (Figure 35).
These two interfaces have similar effects in making students feel confident about their
initial schedules (Figure 36), and helping them examine their schedules (Figure 37).
And, students using the VCS enjoyed their experience more than students using the
traditional 4D CAD interface (Figure 38). Overall, comparison of students’ perceptions
between these two groups shows that the VCS had additional values in helping them
generate a construction schedule and enjoying the experience.
3D Model Value
12.5%
62.5%68.8%
25.0%31.3%
1 2 3 4 5It was valuable to have a large scale 3D model when
developing our schedule
ControlExperimental
Figure 31: Comparison of the 3D Model Value

100
3D Model Utilization
6.3%
43.8%
25.0%25.0%
37.5%
50.0%
6.3%6.3%
1 2 3 4 5Our group adequately utilized the 3D model when
developinn our schedule
ControlExperimental
Figure 32: Comparison of the 3D Model Utilization
Idea Generation
6.3%
37.5%
56.3%
25.0% 31.3%
6.3%
37.5%
1 2 3 4 5The 3D model helped me in generating ideas
and evaluating other people’s ideas
ControlExperimental
Figure 33: Comparison of Idea Generation
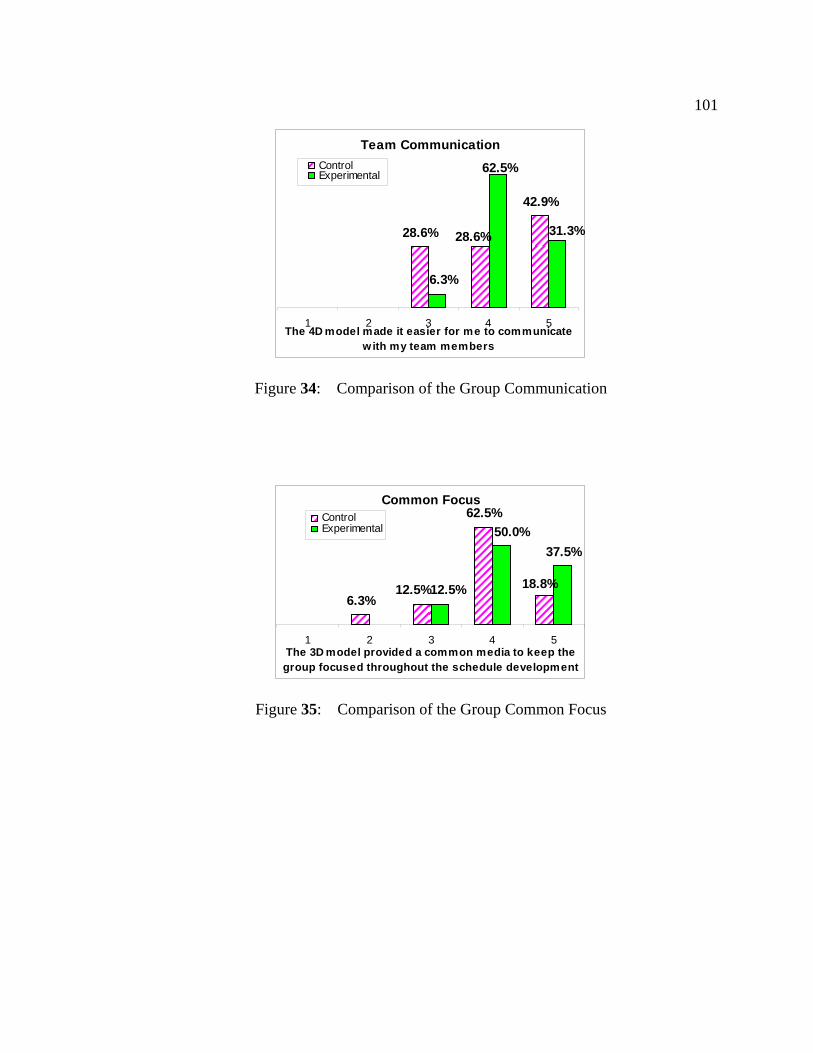
101
Team Communication
28.6%
42.9%
28.6% 31.3%
62.5%
6.3%
1 2 3 4 5The 4D model made it easier for me to communicate
with my team members
ControlExperimental
Figure 34: Comparison of the Group Communication
Common Focus
6.3%
62.5%
37.5%
18.8%12.5%
50.0%
12.5%
1 2 3 4 5The 3D model provided a common media to keep thegroup focused throughout the schedule development
ControlExperimental
Figure 35: Comparison of the Group Common Focus
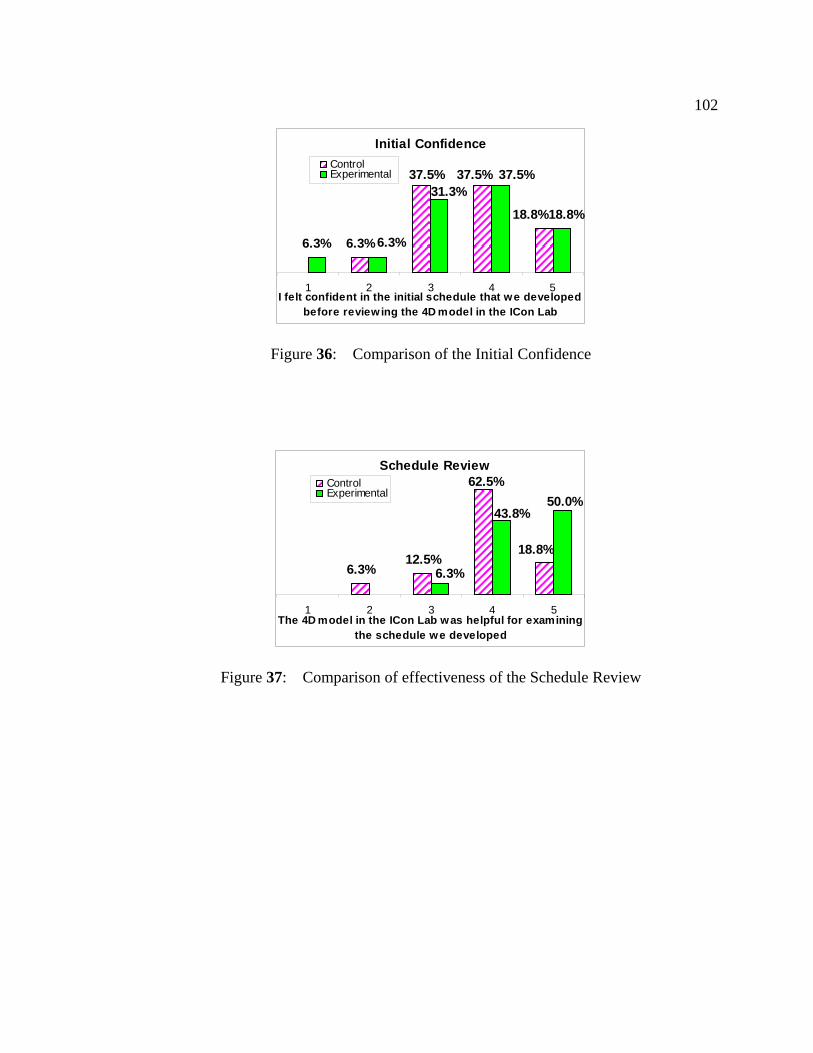
102
Initial Confidence
6.3%6.3%
18.8%
37.5% 37.5%
18.8%
37.5%31.3%
6.3%
1 2 3 4 5I felt confident in the initial schedule that we developed
before reviewing the 4D model in the ICon Lab
ControlExperimental
Figure 36: Comparison of the Initial Confidence
Schedule Review
6.3%12.5%
18.8%
62.5%50.0%
43.8%
6.3%
1 2 3 4 5The 4D model in the ICon Lab was helpful for examining
the schedule we developed
ControlExperimental
Figure 37: Comparison of effectiveness of the Schedule Review

103
Enjoyment
6.3%
25.0% 31.3%37.5%
18.8%
75.0%
6.3%
1 2 3 4 5I enjoyed performing the exercise in the ICon Lab
ControlExperimental
Figure 38: Comparison of the Extent Students Enjoyed the Schedule Development Process
Survey II was used to investigate the value of the 4D model in aiding student
presentations and in class discussions. Since students in both groups finished their final
4D model using NavisWorks following the experiment and developed it into a video file,
they were using the same tool for the presentations and discussions. So there was no
comparison between the two groups. Figure 39, Figure 40 and Figure 41 show that
4D modeling was considered a very effective tool in helping students present their
solutions, understand alternatives, and understand the overall SIPS planning process.
Ease of Presenting Solution
0.0% 0.0% 0.0%
26.7%
73.3%
0.0%10.0%20.0%30.0%40.0%50.0%60.0%70.0%80.0%
1 2 3 4 5
The 4D model made it easier for us to present our group’s solution to other students in the class
Figure 39: Ease of Presenting Solutions
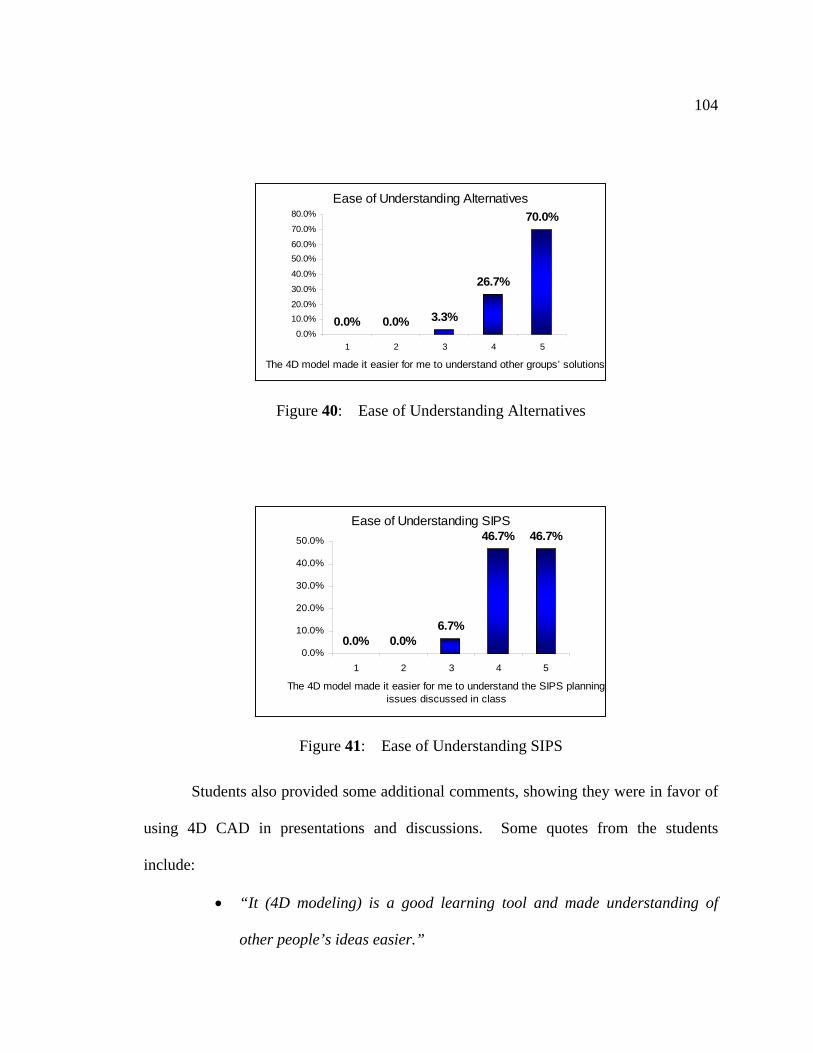
104
Ease of Understanding Alternatives
0.0% 0.0% 3.3%
26.7%
70.0%
0.0%
10.0%20.0%
30.0%
40.0%
50.0%60.0%
70.0%
80.0%
1 2 3 4 5
The 4D model made it easier for me to understand other groups’ solutions
Figure 40: Ease of Understanding Alternatives
Ease of Understanding SIPS
0.0% 0.0%6.7%
46.7% 46.7%
0.0%
10.0%
20.0%
30.0%
40.0%
50.0%
1 2 3 4 5
The 4D model made it easier for me to understand the SIPS planning issues discussed in class
Figure 41: Ease of Understanding SIPS
Students also provided some additional comments, showing they were in favor of
using 4D CAD in presentations and discussions. Some quotes from the students
include:
• “It (4D modeling) is a good learning tool and made understanding of
other people’s ideas easier.”
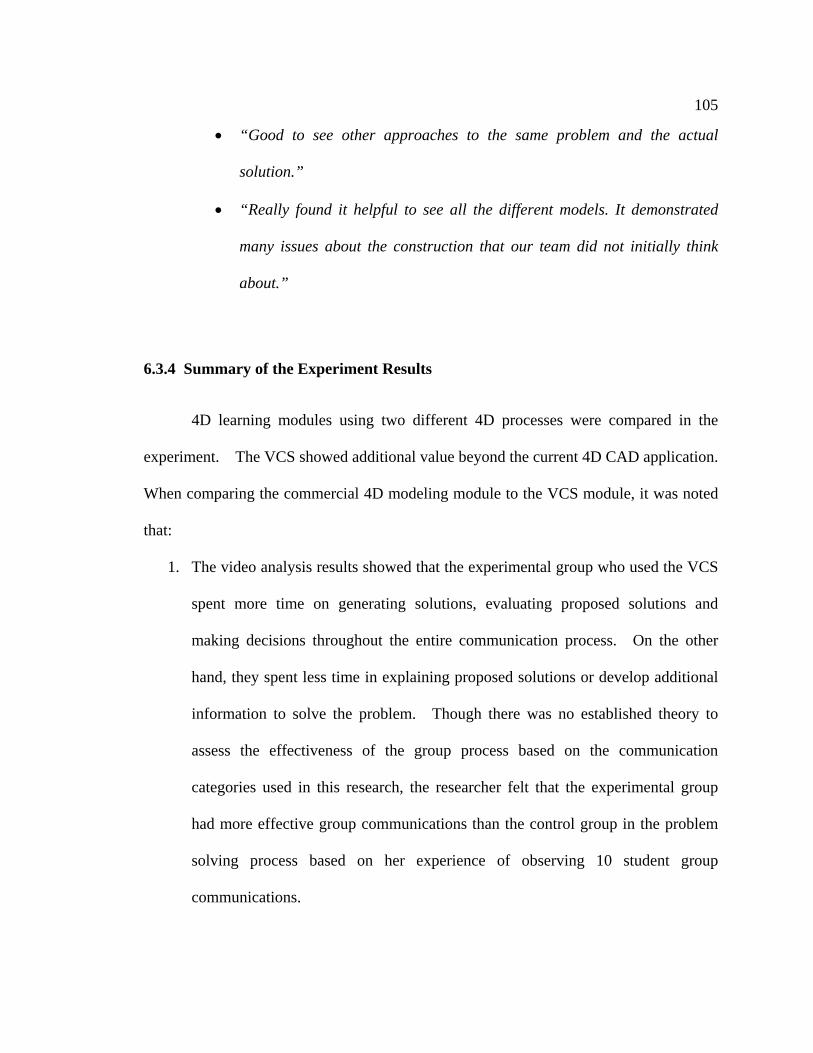
105
• “Good to see other approaches to the same problem and the actual
solution.”
• “Really found it helpful to see all the different models. It demonstrated
many issues about the construction that our team did not initially think
about.”
6.3.4 Summary of the Experiment Results
4D learning modules using two different 4D processes were compared in the
experiment. The VCS showed additional value beyond the current 4D CAD application.
When comparing the commercial 4D modeling module to the VCS module, it was noted
that:
1. The video analysis results showed that the experimental group who used the VCS
spent more time on generating solutions, evaluating proposed solutions and
making decisions throughout the entire communication process. On the other
hand, they spent less time in explaining proposed solutions or develop additional
information to solve the problem. Though there was no established theory to
assess the effectiveness of the group process based on the communication
categories used in this research, the researcher felt that the experimental group
had more effective group communications than the control group in the problem
solving process based on her experience of observing 10 student group
communications.
106
2. Both the quality of the initial schedule and the final schedule developed using the
VCS interface were slightly higher than using a traditional 4D modeling
application. Though the differences were small, it was important that students
could develop a higher quality construction schedule at the beginning of the
project.
3. Significant differences were found in student perceptions towards these two
applications. Students using the VCS interface felt that they were able to
generate more solution ideas, focused on the common topic more easily with
other group members, and had better communications with their group members.
It was important that the VCS groups enjoyed this experience more than the
groups using the current 4D application. They had more fun when performing
the exercise using the VCS, and achieved the same or higher quality schedules.

Chapter 7
Conclusions
This chapter first provides a summary of this research. Then, it introduces the
contributions and limitations of this research. A discussion of future research in the
application of 4D learning modules in construction engineering education is presented.
Finally, concluding remarks are provided.
7.1 Research Summary
This research aimed to investigate the effectiveness of 4D modeling used in
construction engineering education for schedule visualization. A longitudinal study was
conducted to examine the value of 4D learning modules in aiding students to develop a
construction schedule.
At the outset of this research, an exploratory study was performed to investigate
the value of a preliminary 4D learning module developed using a current 4D modeling
application (NavisWorks with Timeliner). An initial assessment plan was used to
evaluate the value of the preliminary learning module. The preliminary learning module
improved the schedule quality, enabled interactive schedule presentation and discussion,
and was deemed by the students as a beneficial and engaging tool.
Later, a VCS prototype application was developed, which advanced the current
4D model generation process by allowing the generation of a 4D model and a

108
construction schedule by directly interacting with a 3D model. An experiment was
conducted to examine the value of the VCS prototype by comparing it with the current
4D modeling process. The experiment results showed that the VCS helped students
develop a slightly higher quality schedule on average, and students enjoyed the learning
experience more using this application compared to the current 4D modeling process.
Therefore, both 4D learning modules are an effective learning aid for schedule
visualization in engineering education, and the VCS 4D modeling process has additional
values beyond the current 4D modeling generation process.
7.2 Research Contributions
Various contributions of this research are discussed below.
7.2.1 Identification of the Value of 4D Learning Modules in Engineering Education
While there are an increasing number of successful applications of 4D modeling
in the AEC Industry, its implementation in engineering education is currently limited.
This research implemented this visualization tool in construction engineering education
and conducted quantitative and qualitative assessment to identify its value in engineering
education. At the same time, an assessment plan was identified to evaluate the
effectiveness of 4D learning modules.

109
7.2.2 Advancement of the Current 4D Model Generation Process
The current 4D modeling process mainly functions as a schedule review tool. It
still requires a person to generate a CPM schedule first. The current method of using a
CPM application for generating the schedule limits the utility of the 3D model during the
planning process since the planners need to first create the activities mentally, and later
link them to their related 3D components in a 4D modeling application. From the
experiment, it was found that the average 3D model use was 21% during the overall
schedule generation time when using the current 4D model generation process.
The developed VCS is a schedule generation and review tool. It allows the
generation of a 4D model and a construction schedule by directly interacting with a 3D
model. It eliminates both the mental linking process, and the manual linking process
of 3D model objects and schedule activities. This process makes it possible to better
utilize the 3D model. From the experiment, we found an average 3D model use was
75% during the overall schedule generation time when using the VCS 4D generation
process.
7.2.3 Time Study of Group Communications for Two Different 4D Generation Processes
A content analysis was conducted to analyze the student group communications
for each recorded video. The time percentages of different types of communications
(goal clarification, solution generation, analysis, evaluation, and decision) were
documented for both 4D generation processes when students were planning the
110
construction process and generating a schedule. Though there was no established theory
to evaluate the effectiveness of the group communication based on the communication
categories used in this research, the documentations of the time percentages of different
communication categories for this case study has started to build a knowledge base for
future research in this area.
7.3 Limitations
The limitations of the research are described in this section.
7.3.1 Limited Case Study Application
This research presents the results from the study performed on one case study
project. There is little research in this area, so the researcher conducted an exploratory
study on one detailed case study before implementing a large scale investigation. The
case study selected may be an inadequate representation of diversity. Different case
studies may result in different results. Therefore, the findings from this single case
study may not be generalized.
Another limitation of this case study was that the 4D module was developed when
the research started. Since we wanted all the students to have the opportunity to work
on their schedule using the 4D learning module, there was no chance to compare the
group process between the more traditional paper-based scheduling process and 4D
scheduling process.
111
7.3.2 VCS Prototype Limitations
The developed VCS prototype has several limitations:
• Each object in the 3D model has to be coded to achieve all the required
functions. This limited the large scale implementation of the VCS due to
the time needed to develop larger simulation.
• User entered data was stored in a SQL database. Users needed to check
the database from time to time to retrieve needed information, and the
SQL database interface is not very user friendly.
• The user interface had some limitations due to the game engine
implementation.
At the same time, these limitations increased the time spent on technical
communications.
7.4 Future Research
Suggestions for future research related to the use of 4D modeling in engineering
education are presented in this section.
7.4.1 An Improved VCS
To make the interface more valuable and smooth, the VCS needs to be improved:
• Other 3D game engines, which can define a global parameter for all
objects in the 3D model, could be used to develop a similar application, so
112
that there is no need to code each single object in the model and make
large scale implementation easier;
• Use a more user friendly database for the application, so that students can
easily manipulate the interface without onsite technical support;
• Find a way to map the construction schedule from the database to
Microsoft Project directly;
• Automate the sequencing process. The current sequencing process is to
find the successor of a current activity. An improved VCS could make
this process automatic by sequencing activities automatically according to
the order in which they were selected.
• Add resource components into the VCS, such as crews and cranes, so that
students can pick the resources from the module and assign the resources
to specific construction tasks. This could then allow for the visualization
of the resource loading.
7.4.2 Paper-based Scheduling Process Communication
This research compares the group process of using two different 4D interfaces.
It would be valuable to obtain the paper-based scheduling process data as a baseline. In
the case study project used in this research, we intended to have all students try the 4D
learning module, so there was no paper based group process data. Other courses that
have scheduling assignment but do not use a 4D learning module yet, could be
considered as candidates to measure the paper-based group process data.
113
7.4.3 Effect of the 3-Screen Display System
The 3-screen display system provides students a one to one large scale model,
which makes students have the feeling of presence of a real construction site. The effect
of the large 3-screen display system vs. desktop monitor on student group process could
be investigated.
7.4.4 Construction Plan Communication
From the video analysis, the time percentages of different communication
categories defined in the coding scheme were obtained. But currently there is no
established theory existing to measure the effectiveness of the communications by
looking at the percentage of these communication categories. We need to develop a more
detailed understanding of construction plan communication and we still have much to
learn in this area.
7.4.5 Implementation of the VCS on Complex Projects
In this research, the VCS was used on a relatively simple project, and no
significant differences were found when comparing the developed construction schedule
quality. Currently the developed VCS limited large scale implementation since each
object in the 3D model has to be coded to achieve all the required functions. If this
limitation is addressed and the VCS is implemented on a more complex project, bigger
differences in schedule quality may be observed.

114
7.5 Concluding Remarks
Students in engineering disciplines usually work in small groups to solve
problems. When students are solving their problems, instructors usually are not present,
which makes it difficult to coach student group problem solving competences.
Visualization technology enables students to walk through a construction projects and
obtain a better understanding of the building system. It provides a common language,
which can help students achieve better communication. 4D modeling also allows students
to experience the dynamic nature of the construction by showing the progress of a
construction project. 4D modeling is a valuable tool to aid students in their problem
solving process and is important for supporting their learning. More 4D learning
modules could be created to aid engineering students to learn engineering concept.
Bibliography
Adjei Kumi, T., and Retik, A. (1997). "Library-based 4D visualization of construction
processes." Proceedings of the Information Visualization Conference, Piscataway,
NJ, 315-321.
Bell, J., and Fogler, S. (1995). "The Investigation and Application of Virtual Reality as
an Educational Tool." Proceedings of the American Society for Engineering
Education 1995 Annual Conference, Anaheim, CA.
Bell, J. T., and Fogler, S. (2003). "Implementing Virtual Reality Laboratory Accidents
Using the Half-Life Game Engine, WorldUp, and Java3D." Proceedings of the
2003 American Society for Engineering Education Annual Conference &
Exposition.
Bloom, B. S. (1966). Taxonomy of Educational objectives: The Classification of
Educational Goals, David McKay Company, New York.
Bosch, A. O. D., and Hastak, M. (2002). "Virtual reality environment for design and
analysis of antomated construction equipment." Computing in Civil Engineering
Automated comstruction equipment.
Camp, G. (1996). "Problem-Based Learning: A Paradigm Shift or a Passing Fad?"
Collier, E., and Fischer, M. (1996). "Visual-based scheduling: 4D modeling on the San
Mateo County Health Center." Proceedings of the 3rd Congress on Computing In
Civil Engineering, New York, NY, 800-805.

116
Corbetta, P. (2003). Social research: theory, methods and techniques, SAGE, 2003,
Thousand Oaks, CA.
Cruz-Neira, C., Sandin, D.J., DeFanti, T.A. (1993). "Surround-screen projection-based
virtual reality: The design and implementation of the CAVE." Computer Graphics
Proceedings of SIGGRAPH '93, 135-142.
De Camargo Ribeiro, L. R., and Mizukami, M. D. G. N. (2005). "Student assessment of a
problem-based learning experiment in civil engineering education." Journal of
Professional Issues in Engineering Education and Practice, 131(1), 13-18.
Fellows, R., and Liu, A. (2003). Research methods for construction, Blackwell Science,
Malden, MA.
Hadipriono, F. C., Larew, R. E., and Tsay, T.-c. (1996). "Interactive and Immersive
Training in a Virtual Environment for Construction Students." Proceedings of the
1996 American Society for Engineering Education Annual Conference &
Exposition.
Haque, M. E. (2001). "Web-based Visualization Techniques for Structural Design
Education." Proceedings of the 2001 American Society for Engineering Education
Annual Conference & Exposition.
Haymaker, J., and Fischer, M. (2001). "Challenges and benefits of 4D modeling on the
Walt Disney Concert Hall Project." Working Paper #064, January 18, CIFE,
Stanford University, Stanford, CA.
Hoffmann, B., and Ritchie, D. (1997). "Using multimedia to overcome the problems with
problem based learning." Instructional Science, 25(2), 97-115.
117
Honebein, P. C., Duffy, T. M., and Fishman, B. J. (1993). "Constructivism and the design
of learning environments: Context and authentic activities for learning."
Designing environments for constructive learning, T. M. Duff, J. Lowyck, and D.
H. Jonassen, eds., Springer-Verlag, Heidelberg, 87-108.
Impelluso, T., and Metoyer-Guidry, T. (2001). "Virtual reality and learning by design:
tools for integrating mechanical engineering concepts." Journal of Engineering
Education, 91(4), 527-534.
Kalisperis, L. N., Otto, G., Muramoto, K., Gundrum, J. S., Masters, R., and Orland, B.
(2002). "An affordable immersive environment in beginning design studio
education." Proceedings of ACADIA 2002, Thresholds Between Real and Virtual:
Design Research, Education, and Practice in the Space Between the Physical and
the Virtual, Pomona, CA, 49-56.
Kamat, V. R., and Martinez, J. C. (2001). "Visualizing simulated construction operations
in 3D." Journal of Computing in Civil Engineering, ASCE, 15(4), 329-337.
Kasik, K. J., Troy, J. J., Amorosi, S. R., Murray, M. O., and Swamy, S. N. (2002).
"Evaluating graphics displays for complex 3D models." Graphics in Advanced
Computer-Aided Design, IEEE.
Koo, B., and Fischer, M. (2000). "Feasibility study of 4D CAD in commercial
construction." Journal of Construction Engineering and Management, ASCE,
126(4), 251-260.
Marshall, C., and Rossman, G. (1999). Designing qualitative research, Sage Publications,
Inc., Newbury Park, CA.

118
McKinney, K., Fischer, M., and Kunz, J. (1998). "Visualization of construction planning
information." January 6-9, San Francisco, CA.
Messner, J. I., Yerrapathruni, S. C. M., Whisker, V. E., and Baratta, A. J. (2003). "Using
virtual reality to improve construction engineering education." 2003 ASEE Annual
Conference, Nashville, TN.
Nelson, L., cook, d., and Cruz-neira, C. (1999). "XGobi vs the C2: Results of an
experiment comparing data visualization in a 3-D immersive virtual reality
enviroment with a 2-D workstation display." Computational Statistics, 14:39 - 51.
Pantelidis, V. S. (1997). "Virtual reality and engineering education." Computer
Applications in Engineering Education, 5(1), 3-12.
Petric, J., Maver, T., Conti, G., and Ucelli, G. (2002). "Virtual Reality in the Service of
User Participation in Architecture." International Council for Research and
Innovation in Building and Construction CIB w78 conference 2002.
Phillips, E., and Pugh, D. S. (2000). How to get a PhD: a handbook for students and their
supervisors, Open University Press, c2000, Philadelphia.
Retik, A. (1993). "Visualization for decision making in construction planning."
Visualization and intelligent design in engineering and architecture, J.J. Connor
et al., eds., Elsevier Science(New York, NY), 587-599.
Rheingold, H. (1991). Virtual reality, Summit, New York, NY.
Riley, D. R. (1998). "4D space planning specification development for construction work
spaces." International Congress on Computing in Civil Engineering, 354-363.
119
Rischmoller, L., Fischer, M. A., Fox, R., and Alarcon, L. (2001). "4D planning and
scheduling (4D-PS): Grounding construction IT research in industry practice." IT
in Construction in Africa - CIB W78, Mpumalanga, South Africa, 1-11.
Sawhney, A., Koczenasz, B., Bashford, J., and Mund, A. (2000). "Internet-Based
Interactive Construction Management Learning System." Proceedings of the 2000
American Society for Engineering Education Annual Conference & Exposition.
Shiratuddin, M. F., Thabet, W., and Bowman, D. (2004). "Evaluating the effectiveness of
virtual environment displays for reviewing construction 3D models." CONVR
2004, Lisbon, Portugal, 87-98.
Smith, S. (2001). "4D CAD Goes Beyond Mere Representation, "4D is far ahead of
where most of the construction industry is willing to think"-Dr. Joel Orr."
Songer, A. D., Diekmann, J. E., and Karet, D. (2001a). "Animation-based construction
schedule review." Construction Innovation, 2001(1), 181-190.
Songer, A. D., Diekmann, J. E., Rasheed, K.-A., and Hays, B. (2001b). "Construction
schedule using 3-D CAD and walk-thru." Construction Innovation, 2001(1),
191-207.
Sriprasert, E., and Dawood, N. (2002). "Requirement Identification for 4D
constraint-based construction planning and control system." Distributing
Knowledge In Building, CIB W78 International Conference, The Aarhus School
of Architecture, Denmark.
Staub, S., Fischer, M., and Spradlin, M. (1999). "Into the fourth dimension." Civil
Engineering, 69(5), 44-47.

120
Tam, C. M. L., Arthur W.T. (2002). "Genetic algorithm modeling aided with 3D
visualization in optimizing construction site facility layout." Distributing
Knowledge In Building, CIB W78 International Conference., The Aarhus School
of Architecture, Denmark.
Thabet, W. Y. (2001). "Design/Construction Integration thru Virtual Construction for
Improved Constructability."
Waley, A. F., and Thabet, W. Y. (2003). "A virtual construction environment for
preconstruction planning." Automation in Construction, 12(2).
Whisker, V. E., Baratta, A. J., Yerrapathruni, S., Messner, J. I., Shaw, T. S., Warren, M.
E., Rotthoff, E. S., Winters, J. W., Clelland, J. A., and Johnson, F. T. (2003).
"Using immersive virtual environments to develop and visualize construction
schedules for advanced nuclear power plants." 2003 International Congress on
Advances in Nuclear Power Plants (ICAPP), Córdoba, Spain.
Whitman, L., Madhavan, V., Malzahn, D., Twomey, J., and Krishnan, K. (2002). "Using
Virtual Reality to Address Competency Gaps." Proceedings of the 2002 American
Society for Engineering Education Annual Conference & Exposition.
Yin, R. K. (2003). Case study research: design and methods, Sage Publications,
Thousand Oaks, CA.
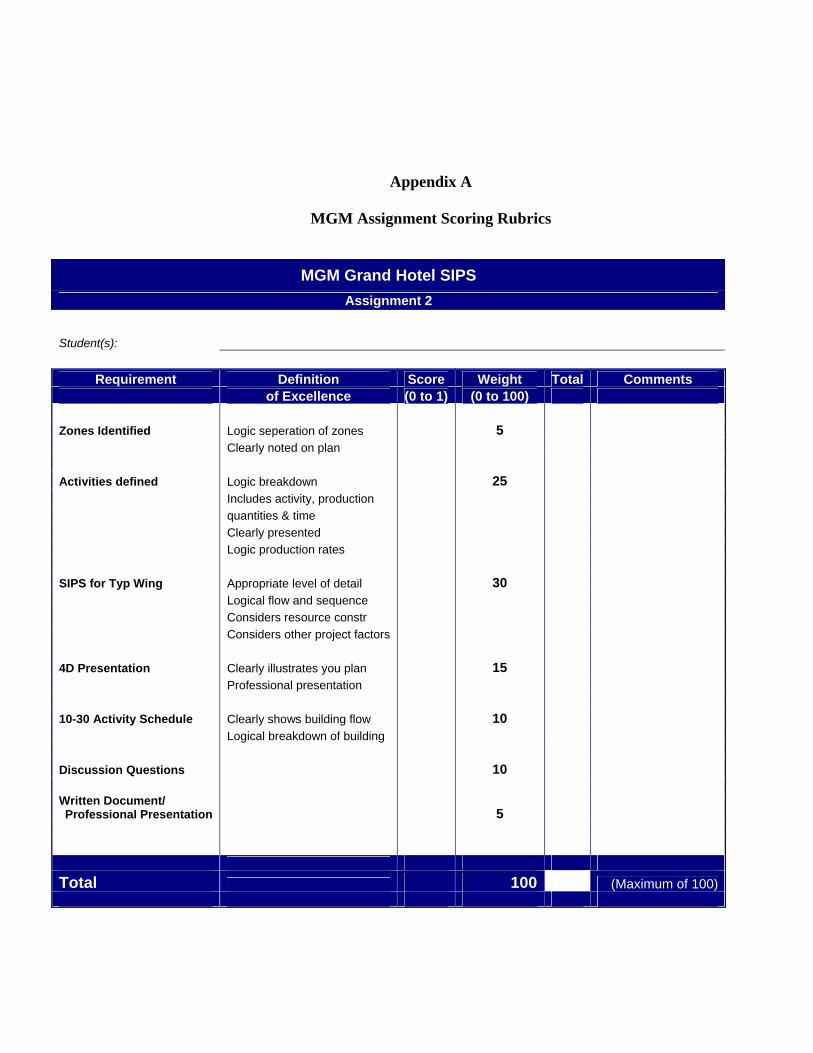
Appendix A
MGM Assignment Scoring Rubrics
MGM Grand Hotel SIPS Assignment 2
Student(s):
Requirement Definition Score Weight Total Comments of Excellence (0 to 1) (0 to 100)
5 Zones Identified Logic seperation of zones Clearly noted on plan 25 Activities defined Logic breakdown Includes activity, production quantities & time Clearly presented Logic production rates 30 SIPS for Typ Wing Appropriate level of detail Logical flow and sequence Considers resource constr Considers other project factors 15 4D Presentation Clearly illustrates you plan Professional presentation 10 10-30 Activity Schedule Clearly shows building flow Logical breakdown of building 10 Discussion Questions
Written Document/ 5 Professional Presentation
Total 100 (Maximum of 100)

Appendix B
Schedule Evaluation Sheet
MGM Grand Hotel Schedule Evaluation Sheet
Evaluation Parameters Weight Score
50 Correctness
Have all required activities with appropriate level Completeness
Durations should be based on logic production rate Reasonable Duration
Ductile frames go before the floor planks
A wall sits between two adjacent floor plank bays, so the wall should go after both bays finish
All grout should occur at once Logic Sequence
Grout cannot go over night
Start from the core toward outside
40 Goodness
More concurrent activities with consideration of available space
Minimized Critical Path No overcrowding
No possible discontinuity of the work flow due to worker or equipment availability or too small work zones
Crane logistic-not too many crane activities at one time Smooth Work Flow
Consider productivity-If break the whole floor into 12 single bays and finish each bay separately, the productivity will be poor
Safety No potential safety issues
10 Creativeness
Creative Sequence
Total
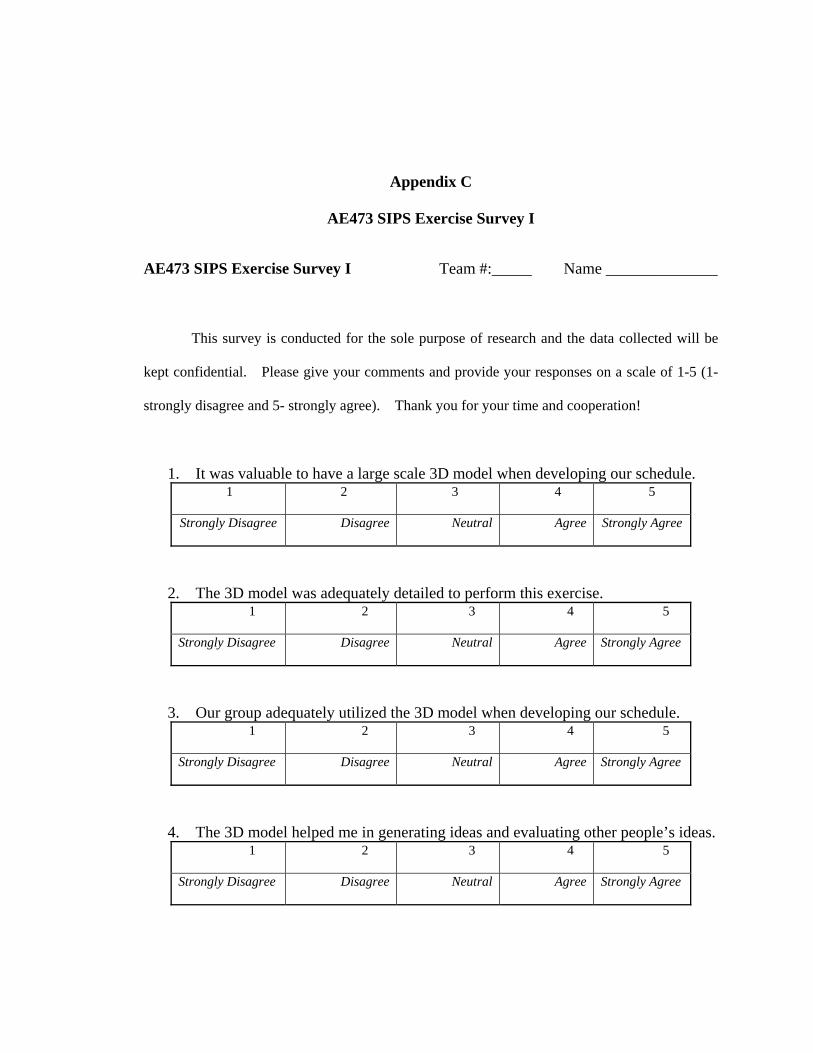
Appendix C
AE473 SIPS Exercise Survey I
AE473 SIPS Exercise Survey I Team #:_____ Name ______________
This survey is conducted for the sole purpose of research and the data collected will be
kept confidential. Please give your comments and provide your responses on a scale of 1-5 (1-
strongly disagree and 5- strongly agree). Thank you for your time and cooperation!
1. It was valuable to have a large scale 3D model when developing our schedule. 1 2 3 4 5
Strongly Disagree Disagree Neutral Agree Strongly Agree
2. The 3D model was adequately detailed to perform this exercise. 1 2 3 4 5
Strongly Disagree Disagree Neutral Agree Strongly Agree
3. Our group adequately utilized the 3D model when developing our schedule. 1 2 3 4 5
Strongly Disagree Disagree Neutral Agree Strongly Agree
4. The 3D model helped me in generating ideas and evaluating other people’s ideas. 1 2 3 4 5
Strongly Disagree Disagree Neutral Agree Strongly Agree

124
5. The 3D model provided a common media to keep the whole group focused throughout the process of developing the schedule.
1 2 3 4 5
Strongly Disagree Disagree Neutral Agree Strongly Agree
6. I felt confident in the initial schedule that we developed before reviewing the 4D model in the ICon Lab.
1 2 3 4 5
Strongly Disagree Disagree Neutral Agree Strongly Agree
7. The 4D model in the ICon Lab was helpful for examining the schedule we developed.
1 2 3 4 5
Strongly Disagree Disagree Neutral Agree Strongly Agree
8. I felt more confident in our schedule after reviewing the 4D model. 1 2 3 4 5
Strongly Disagree Disagree Neutral Agree Strongly Agree
9. The 4D modeling activity helped me gain a better understanding of the SIPS process.
1 2 3 4 5
Strongly Disagree Disagree Neutral Agree Strongly Agree
10. I enjoyed performing the exercise in the ICon Lab. 1 2 3 4 5
Strongly Disagree Disagree Neutral Agree Strongly Agree

125
11. What challenges did you have when you performing this exercise?
_______________________________________
_______________________________________
12. What did you like about the SIPS activity in the ICon Lab?
_______________________________________
_______________________________________
13. What additional items would you like to see included in the model or the SIPS exercise?
_______________________________________
_______________________________________
14. Please provide any additional comments.
_______________________________________
_______________________________________
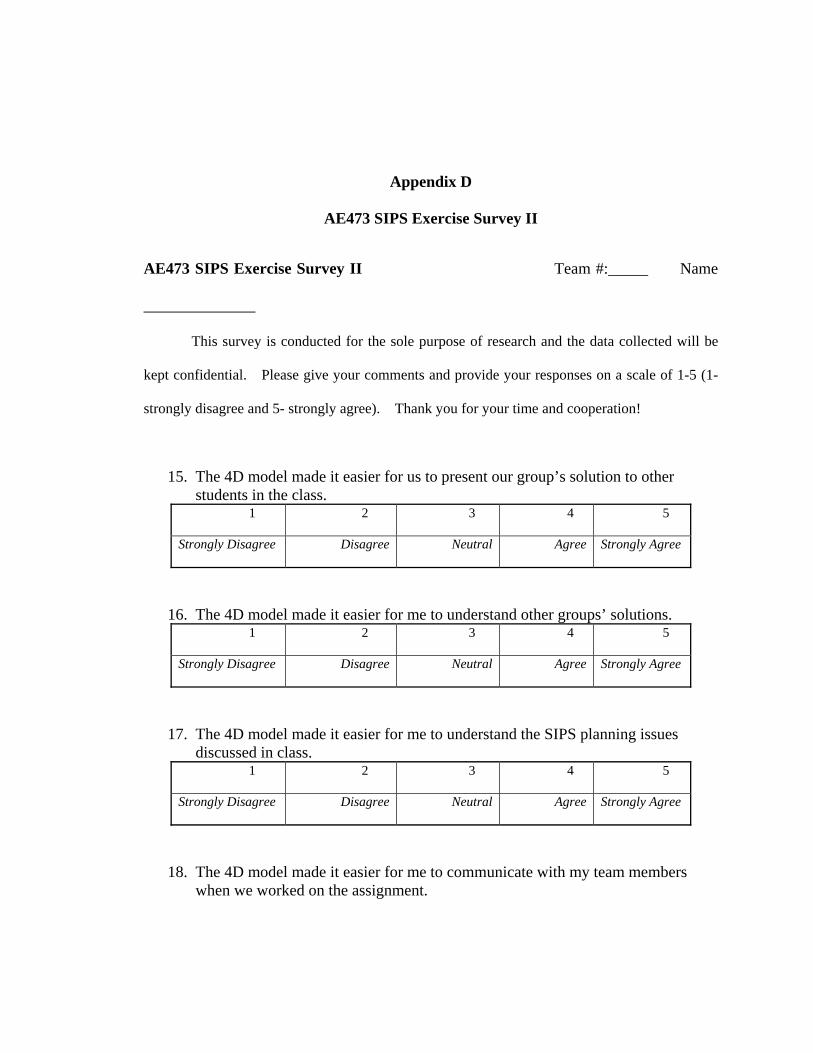
Appendix D
AE473 SIPS Exercise Survey II
AE473 SIPS Exercise Survey II Team #:_____ Name
______________
This survey is conducted for the sole purpose of research and the data collected will be
kept confidential. Please give your comments and provide your responses on a scale of 1-5 (1-
strongly disagree and 5- strongly agree). Thank you for your time and cooperation!
15. The 4D model made it easier for us to present our group’s solution to other students in the class.
1 2 3 4 5
Strongly Disagree Disagree Neutral Agree Strongly Agree
16. The 4D model made it easier for me to understand other groups’ solutions. 1 2 3 4 5
Strongly Disagree Disagree Neutral Agree Strongly Agree
17. The 4D model made it easier for me to understand the SIPS planning issues discussed in class.
1 2 3 4 5
Strongly Disagree Disagree Neutral Agree Strongly Agree
18. The 4D model made it easier for me to communicate with my team members when we worked on the assignment.

127
1 2 3 4 5
Strongly Disagree Disagree Neutral Agree Strongly Agree
19. Additional comments about the presentations and in class discussions?
_______________________________________
_______________________________________
_______________________________________