using a flowchart simulator in a introductory programming ... · using a flowchart simulator in a...
TRANSCRIPT

Flowchart Simulator 1
Using a Flowchart Simulator in a Introductory Programming Course
Thad Crews
Western Kentucky University 1 Big Red Way (270) 745-4643
[email protected] Abstract Right From the Start is a project at Western Kentucky University designed to provide novice students with a foundation for later programming study through a series of interactive design tasks involving fundamental logic structures. To support this goal, the instructional tool Visual has been developed and used in classroom settings. (To obtain copies of the Visual software and related support materials for academic use, visit http://cis1.wku.edu/visual ). Visual is an instructional tool designed for novice programmers and is intentionally easy to learn and use. When using this tool, students may design, develop, test and evaluate computer programs before introducing any traditional high -level language. This paper reports the results of an experimental design involving the use of Visual during the first five weeks of an introductory course. The results suggest instructional benefits for students who use interactive flowcharts to emphasize logic and design early in the first programming course.
Introduction
According to a recent National Academy of Sciences report, a number of essential elements
are necessary for a person to achieve fluency with information technology (NAS, 1999). One of
the essential elements identified in the report is exposure to computer programming. The report
concludes that programming knowledge and experience is beneficial to everyone in an
information society. “The continual use of abstract thinking in programming can guide and
discipline one's approach to problems in a way that has value well beyond the information
technology-programming setting. In essence, programming becomes a laboratory for discussing
and developing valuable life skills, as well as one element of the foundation for learning about
other subjects.” (NAS, 1999, p. 48).
National Science Foundation (NSF) researchers suggest that programming instruction should
not be limited to students in computer departments, noting that learning to program has been
PDF created with FinePrint pdfFactory trial version http://www.fineprint.com

Flowchart Simulator 2
shown to have benefits ranging from teaching general-purpose problem solving and thinking
skills to helping students appreciate and understand how computers work (Soloway, 1993). Over
two decades ago, MIT computer scientist Seymour Papert reported that a deep understanding of
programming, in particular the design activity of successive decomposition as a mode of analysis
and debugging of trial solutions, results in significant educational benefits in many domains of
discourse, including those unrelated to computers and information technology per se. By
transforming abstractions into concrete representations via programming, students "build their
own intellectual structures with materials drawn from surrounding culture" (Papert, 1980, pp. 31-
32).
While programming is considered a valuable learning activity, it is also a complex task and is
often difficult for novices to master (Sleeman, 1986; Spohrer & Soloway, 1986; Malik, 2000).
The following section provides an overview of previous attempts to improve the process of
learning to program. This is followed by a report of two studies examining programming
instruction using simple, intuitive flowcharts to abstract fundamental concepts that are
foundational to all programming languages. Experimental investigations of the utility of
flowcharts for novice programmers and the impact of a flowchart based learning tool on students
understanding of fundamental programming activities are presented, followed by a general
discussion of the results and its implications for educational technology.
Prior Research on Programming as Design
Advocates of programming as a learning activity are often not supportive of traditional
programming courses which emphasize programming languages such as C++, Java, Visual Basic
or Pascal (Saret, 2001; Sprankle, 1998). Rather, these advocates of programming as a learning
activity emphasize the design process over the subtleties of syntax (Farrell, 1999; Kafai, 1995).
PDF created with FinePrint pdfFactory trial version http://www.fineprint.com

Flowchart Simulator 3
There have been numerous efforts to improve the programming process by minimizing the
complexity of the syntax and increasing design activities (NAS, 1999; Robertson, 2000). The
following section presents several examples of related studies that have received considerable
attention and form the basis for this research project.
Using Mini-Languages to Teach Novice Programmers
One popular approach to teaching computer programming involves the use of mini-
languages. The mini-language uses a programming environment with relatively few
instructions/commands (e.g., Brusilovsky, Calabrese, Hvorecky, Kouchnirenko & Miller, 1997).
Mini-languages are designed to be intuitive to novice programmers, allowing them to freely
explore the problem-solving context without being burdened by syntax construction. These
environments do not introduce any of the complex commands typically found in traditional high-
level languages. Instead, the programmer is provided with a set of basic commands that may be
used to create simple solutions.
One of the earliest examples of this approach was the Logo programming language as
described in the book Mindstorms (Papert, 1980). Originally designed for children, Logo allows
computer novices to create unusual geometric designs and cartoon drawings by controlling a
programmable turtle with a small number of simple commands (e.g., “forward,” “back,” “left
turn”). The Logo language has been well received for two decades, with various adaptations
along the way.
Another significant contribution to the simplified syntax effort was Karel the Robot (Pattis,
1981). It was designed specifically to provide “a gentle introduction to programming.” In 1996,
Karel++ (Bergin et al., 1997) was developed to provide a similarly simple introduction to
object-oriented programming. Logo, Karel, Karel++ and similar tools attempt to address the
PDF created with FinePrint pdfFactory trial version http://www.fineprint.com

Flowchart Simulator 4
design/syntax problem by making the design environment intuitive and the syntax simple.
However, while reading the first programming chapter in Karel++, a novice is exposed to the
following: punctuation rules, grammar rules, instructions, messages, classes, reserved words
(e.g., void, task, class), special symbols, main task block, delimiters, declarations, error shutoff,
lexical error, syntax error, execution error, intent error, and debugging. Some novices may
disagree that this represents a “gentle introduction.”
Iconic Programming
An alternative to languages with a simplified syntax uses graphics instead of textual
instructions. Calloni, Bagert, and Haiduk (1997) address the problem of minimizing syntactic
detail though the use of BACCII, an iconic programming environment. All program constructs
(including variables) are represented through icons. After the student builds a program solution
using a logical series of appropriate icons, BACCII generates syntactically correct source code
for the program in a traditional high-level programming language. The drawback is that the
student must then compile the source code, execute and test it in the high-level language
environment. Furthermore, all error messages and debugging requirements are communicated to
the student using the syntax of the high level language rather than the familiar iconic
representation.
Pseudo Programming
Another popular approach to programming instruction uses a procedural language, but
relaxes the strict syntactical rules that often confuse students. Shackelford (1998) has developed
an approach whereby novices use a pseudo language to develop their algorithms. The psuedo-
language allows students to write programs using common English words of their choosing.
Pseudo-languages do not have to follow strict syntax rules making them easier to work with by
PDF created with FinePrint pdfFactory trial version http://www.fineprint.com

Flowchart Simulator 5
novices. Since the pseudo-language cannot be executed, students spend more time on designing
a solution than dealing with implementation details. The limitation of this approach is the
inability to actually execute the program results in a lack of real-time feedback to the student.
The pseudo-language approach requires human evaluation for feedback, typically provided by
the TAs or the instructor. There are also concerns regarding the consistency of human
evaluations of pseudo-language solutions.
The Utility of Flowcharts
Supporters of programming in education are constantly looking for ways to emphasize the
valuable learning activities of logic, design, problem solving, critical reflection, and self-
expression. A common goal of many computing educators is to somehow capture the essence of
solution design without introducing the complexity of a high-level implementation language.
One representational technique that has long been used to capture the essence of procedures is
flowcharting. A flowchart is a diagram that shows step-by-step progression through a procedure.
In computer programming, flowcharts allow a conceptual representation of important issues such
as input, output, assignments, conditions, and loops. Some anecdotal data suggests that novice
students perform better, faster and with more confidence when they examine designs represented
as flowcharts rather than high-level language syntax.
Apparently this observation is not unique, as the majority of introductory programming
textbooks have traditionally used flowcharts when introducing important concepts. The potential
value of flowcharts is further supported in the educational-psychology literature. Bloom’s
Cognitive Taxonomy (Bloom, 1956) is a classification of levels of activities for human learning.
Mastering the syntax of a traditional high level programming language primarily involves
memorizing and recalling particular language details. Such activities are at Bloom’s lowest level
PDF created with FinePrint pdfFactory trial version http://www.fineprint.com

Flowchart Simulator 6
of learning. Flowcharts can be used to minimize the detail of language syntax while allowing
students to work at a conceptual level—thereby supporting higher level learning activities.
A number of studies have been conducted that examine the utility of flowcharts for various
purposes and with various audiences (e.g., Higgins, 1987; Kammann, 1975; Ramsey, Atwood, &
Van Doren, 1983; Scanlan, 1989; Shneiderman, 1975; Vessey & Weber, 1986; Wright & Reid,
1973). However, none of these studies compare flowcharts to language syntax with respect to
novice programming students. The goal of these studies is to address this missing knowledge
area, examining the utility of flowcharts for novice programmers for understanding computer
algorithms.
PROCEDURE
Two experiments were conducted as part of the present study. The goal of the experiments is
to examine the utility of flowcharts versus program code for novice students’ understanding of
computer algorithms.
Hypothesis 1.1: Novice programming students will develop more accurate program solutions
using flowcharts than with structured code.
Hypothesis 1.2: Novice programming students will develop program solutions more quickly
using flowcharts than with structured code.
Hypothesis 1.3: Novice programming students will have higher confidence in their program
solutions using flowcharts than with structured code.
Hypothesis 1.4: The benefits of flowcharts will be more pronounced as the problem
algorithms become more complex.
PDF created with FinePrint pdfFactory trial version http://www.fineprint.com

Flowchart Simulator 7
Method
Participants
The participants for this study were 58 undergraduate students from two 100-level
introductory Quick Basic (QBasic) programming courses. Both the instructors were computer
science professors, and they used the same textbook, lesson plans, and pedagogy. Students in the
courses came from different backgrounds and had different majors. There was an equal mix of
males and females.
Apparatus
Using a methodology based on that of Scanlan (1989), the experiment required subjects to
determine output solutions for three different problems—each more difficult than the last. Each
problem had a flowchart representation and a Basic syntax representation. Each of the six
representations was printed on a separate sheet of paper. Figures 1 - 3 show the flowchart and
structured-coded representation of each problem. The contents of the flowchart symbols were a
random placement of the same conditions and print statements as in the related program code.
They are not reproduced in the figures due to size constraints. Each answer sheet contained three
sets of values representing inputs to the computer program with corresponding space for the
program output. Each answer sheet also contained a place for subjects to record the time when
they finished from a digital clock clearly projected on a large screen throughout the experiment.
Each answer sheet also contained space for subjects to identify how confident they were about
their solutions.
Insert Figure1 (Simple Problem) About Here
Insert Figure 2 (Medium Problem) About Here
PDF created with FinePrint pdfFactory trial version http://www.fineprint.com

Flowchart Simulator 8
Insert Figure 3 (Complex Problem) About Here
Procedure
The experiment was conducted in the seventh week of the 3-hour course, approximately
halfway through the course. Participants had been introduced to input, output, assignment and
conditional statements, and flowcharts had been used in both classes to illustrate the semantics
each statement type. The experiment took place during a regular class meeting time.
Participants were randomly assigned an initial representation (either flowchart or structured
code) for the “simple” problem along with a random answer sheet. Participants determined the
output for each of the three program inputs provided on the answer sheet. After determining the
three outputs for the problem, the subjects recorded the time as displayed on the projection
screen. Finally, participants recorded their confidence level for their solutions on a 5-point scale
(1 = not confident, 5 = very confident). All participants were given sufficient time to complete
the task. Then subjects were given the alternate representation of the “simple” algorithm, a new
answer sheet, and again determined the three problem outputs, recorded the overhead time, and
rated their confidence in their solutions. This process was repeated for the two “medium” and
two “complex” problems.
Results
The correctness score was determined by awarding one correctness point for each of the three
outputs that was correct per solution sheet. The time data was recorded as the number of seconds
required for determining the outputs for each given input. The confidence score was recorded
PDF created with FinePrint pdfFactory trial version http://www.fineprint.com

Flowchart Simulator 9
from the 5-point scale. This grading process was the same for each of the six answer sheets
provided by each participant.
Independent sample t-tests verified there were no differences attributed to teacher or method.
Scores for correctness, confidence and time were then analyzed as paired-samples for significant
differences.
Hypothesis 1.1 suggests that novice programmers will generate more accurate solutions for
computer problems represented as flowcharts than represented as structured program code.
Support was provided for this hypothesis as participants’ flowchart-representation correctness
scores were significantly higher (p <= 0.05) at each level, simple, medium and complex, as
shown in Figure 4.
Insert Figure 4 (Correctness Results) About Here
Hypothesis 1.2 suggests that novice programmers will generate solutions faster when
working with flowcharts rather than structured code. Participants’ completion times when using
the flowchart representations were significantly lower (p <= 0.05) at each level, simple, medium
and complex, as shown in Figure 5.
Insert Figure 5 (Time to Completion Results) About Here
Hypothesis 1.3 suggests that novice programmers will have higher confidence in their
solutions when working with flowcharts rather than structured code. In support of this
hypothesis, participants’ confidence ratings were significantly higher (p <= 0.05) for the
flowchart representation than for the structured-code representation at each level, as shown in
Figure 6.
Insert Figure 6 About Here
PDF created with FinePrint pdfFactory trial version http://www.fineprint.com

Flowchart Simulator 10
Hypothesis 1.4 suggests that novice programmers will see an increased benefit when working
from a flowchart representation versus a structured code representation as the complexity of the
algorithms increases. In support of this hypothesis, the differences in scores between the two
representations increased with complexity for each of the measurements (accuracy, time, and
confidence, as shown in Figures 4-6). It is further interesting to note that the “complex”
algorithm flowchart scores were better than the structured-code “simple” algorithm scores in all
three measurements.
Discussion
The results of this experiment support the hypothesis that introductory programming students
are better at processing computer algorithm-based problems represented as flowcharts rather than
as a set of structured-code instructions. The study found significant benefits with respect to
solution accuracy, time to completion, and subject confidence. When using the flowchart
representation, participants made fewer errors, spent less time determining answers, had more
confidence in their answers. The results also suggest that the observed benefits of flowcharts
over structured-code increase as algorithm complexity increased.
The Flowchart Interpreter
The results of the first study clearly suggest that novice programming students benefit from a
flowchart representation over structured code representation of the same problem. This
experiment measured subjects’ ability to work through pre-defined algorithms and calculate
solutions for given input data. The second experiment seeks to identify whether flowcharts
provide similar benefit when subjects are asked to develop their own unique algorithms.
PDF created with FinePrint pdfFactory trial version http://www.fineprint.com

Flowchart Simulator 11
In addition to requiring subjects to develop program solutions in the traditional QBasic
environment, a graphical CASE tool was used to support the construction of flowcharts. FLINT
(Flowchart Interpreter) allows users to create flowcharts using the popular drag-and-drop
approach common on tools such as ABC Flowcharter and VISIO. However, FLINT also
provides a simulated interpretation of the flowchart in real-time.
FLINT is an instructional tool designed specifically to provide user interaction with solution
design activities. When using this tool, subjects may design, develop, test and evaluate computer
programs without any need for a traditional high-level programming language. FLINT is
designed for novice programmers and is intentionally easy to learn and use. FLINT avoids the
complexity of a high level programming language by utilizing flowcharts to represent logical
solutions.
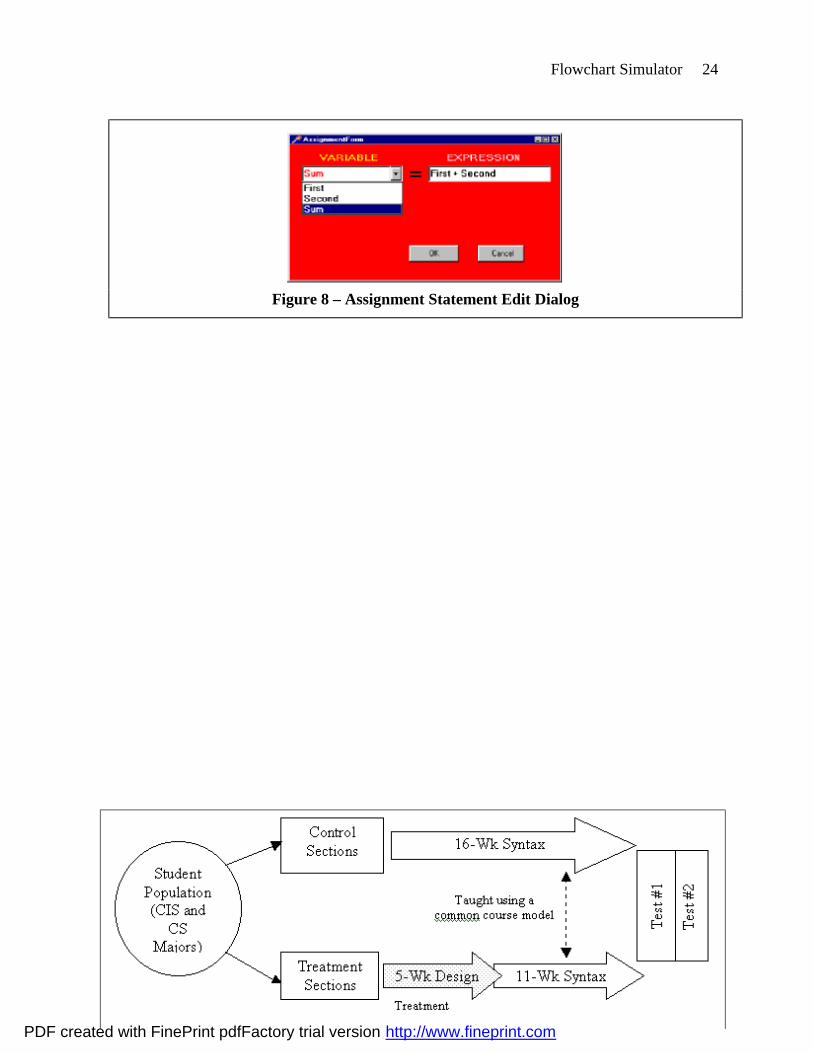
When using FLINT, subjects develop their solutions by adding, deleting and moving
flowchart elements incrementally using a drag-and-drop interface. Figure 7 shows the flowchart
design window with a single input, assignment, and output element. The contents of the
flowchart elements may be edited by double-clicking on the element. Figure 8 shows the edit
dialog window for an assignment statement.
Insert Figure 7 (FLINT Flowchart Design Window) About Here
Insert Figure 8 (FLINT Edit Dialog Box) About Here
One of the most powerful features of FLINT is its ability to provide automated feedback of
graphical (e.g., flowchart) designs. Users may evaluate their design by pressing the
“EXECUTE” button. The flowchart solution behaves as a compiled implementation of a
PDF created with FinePrint pdfFactory trial version http://www.fineprint.com

Flowchart Simulator 12
traditional high-level language, pausing only for user-input commands. For debugging and
pedagogical purposes, the user may execute the design one element at a time. This functionality
is supported through the “STEP” button. Memory values (variables) change dynamically as each
flowchart node is interpreted. Figure 9 shows the complete FLINT system interface. When the
user is satisfied with the validity of the design, the flowchart may be printed and used as a model
for the actual implementation.
Insert Figure 9 (FLINT System Interface) About Here
STUDY 2
The first study had no treatment group. The objective of the second experiment was to
compare the end-of-semester effect of a flowcharting intensive treatment versus the traditional
textbook approach.
Hypothesis 2.1: The treatment group will develop a superior understanding of programming
logic.
Hypothesis 2.2: The treatment group will develop superior ability to write computer
programs.
Method
Participants
The subjects for this study were 73 undergraduate students at a comprehensive public
university with a traditional 16-week semester. The courses were 200-level introductory Visual
Basic (VB) programming taught by two professors. None of the subjects from the first
experiment participated in the second experiment. Furthermore, the second experiment involved
a different pair of professors. Students in the courses came from different backgrounds and had
PDF created with FinePrint pdfFactory trial version http://www.fineprint.com

Flowchart Simulator 13
different majors. Both instructors employed similar textbooks and course content except for the
treatment. Subject assignment to class sections was semi-random as registration priority was
done on the basis of last-name order.
Apparatus
The programming logic component of the experiment was again modeled after Scanlan
(1989), involving three program output problems classified as “simple”, “medium”, and
“complex”. However, there are two major differences from the first study. First, the problems
were only presented in Visual Basic code representation. By design, treatment subjects used
flowcharts at the beginning of the term. However, the experiment took place at the end of the
term when all subjects, regardless of treatment, were expected to have developed proficiency
with the Visual Basic language. The second difference from the first experiment is increased
difficulty at each problem level. Specifically, looping constructs were included in this
experiment (see Table 1). The increased difficulty was appropriate since the measurements were
given at the end of the semester and the subjects were therefore presumably more proficient.
Similar to the first study, answer sheets contained three sets of input values with corresponding
space for the program output.
Insert Table 1 About Here
The solution design task involved writing a non-trivial computer program. Specifically,
students were to write a program to function as a grade-book application (keep track of exam
scores, calculate grades, etc.). This task was chosen because the context is well known to the
subjects. A successful program solution to this problem would require the use of numerous
PDF created with FinePrint pdfFactory trial version http://www.fineprint.com

Flowchart Simulator 14
programming constructs presented throughout the course (e.g., assignments, conditions,
iterations, complex calculations, accumulators, record processing, report generation).
Procedure
In the first experiment there was no treatment. In this experiment, students assigned to the
treatment group exclusively used the FLINT instructional tool during the first five weeks of the
course. Simple problem-solving activities using FLINT were assigned as homework. No VB
instruction was provided during this time. Students assigned to control group were instructed in
the traditional manner, beginning the first week with chapter 1 of the course textbook. After the
first five weeks, the treatment group sections began using the same pedagogy and materials as
the control group, beginning with chapter 1 of the textbook. Because the treatment group
received exposure to key concepts (e.g., variables, conditions, loops, etc.) during the first five
weeks using FLINT, they were able to cover textbook material more quickly, and they finished
the semester covering the same textbook chapters as the control group. Therefore the difference
between the treatment and control groups was a five-week introduction with FLINT followed by
11 weeks with the textbook for the treatment group versus 16 weeks with the textbook for the
control group. The measurements occurred at the end of the semester during a regular class
meeting (see Fig. 10).
FIGURE 10 (Research Process) HERE
Results
Hypothesis 2.1
As with the first experiement, one correctness point was awarded for each of the three
outputs that were correct per solution sheet. Hypothesis 2.1 suggests that the 5 week exposure to
PDF created with FinePrint pdfFactory trial version http://www.fineprint.com

Flowchart Simulator 15
problem solving with flowcharts using FLINT will result in the treatment group demonstrating a
superior understanding of programming logic. When tested at the end of the semester, the
treatment group scored significantly better than the control group on all three problems (p <=
0.05). The results for all three programs are shown in Figure 11.
Insert Figure 11 (End of Semester Solution Results) About Here
Hypothesis 2.2
The solution design task required the subject to write a computer program to implement a
grade-book application. The program solution required ten essential elements: 1) report heading
output, 2) record processing loop, 3) record input, 4) record grade calculation, 5) record letter
grade selection, 6) record output, 7) record accumulation, 8) class grade calculation, 9) class
letter grade selection, and 10) report footing output. These ten elements could have various
syntax implementations. For example, the record-processing loop could be accomplished with
FOR/NEXT, DO/WHILE or DO/UNTIL. The selection events could utilize a discrete
compound IF/THEN, nested IF/THEN/ELSE, or SELECT CASE statement. For this reason,
subjects were awarded 1 point for attempting to code each essential activity regardless of the
syntax or statement structure used.
Hypothesis 2.2 suggests that the treatment group will demonstrate a superior ability to write
computer programs. In support of this hypothesis, the treatment group outperformed the control
group in correctly identifying each of the ten essential program solution elements (see Figure
12). Furthermore, ANOVA analysis shows that the solution element identification difference
was strongly significant for nine of the ten cases (p <= 0.05, see Table 2).
Insert Figure 12 (Solution Element Identification Results) About Here
PDF created with FinePrint pdfFactory trial version http://www.fineprint.com

Flowchart Simulator 16
Insert Table 2 (Statistical Analysis of Solution Element Identification Results) About Here
General Discussion
In this study, we examine the effect that flowcharts can have on novice programmers as they
work through abstract computer programs. The first study found significant benefits of
flowchart representations over structured code with respect to solution accuracy, time to
completion, and subject confidence. When using the flowchart representation, participants made
fewer errors, spent less time determining answers, had more confidence in their answers. The
results also suggest that the observed benefits of flowcharts over structured-code increase as
algorithm complexity increased. The second study suggests that students who use a flowchart
based learning tool in an introductory programming course may show significant improvements
in logic and code writing skills. Collectively, these findings suggest that using an appropriate
flowcharting tool with automated feedback in an appropriately designed pedagogy may improve
the learning experience of novice programmers.
In considering the results of the two present studies, several issues are clear. First, it must be
recognized that an introductory programming course has many learning outcomes in addition to
logic and design skills. Other reported benefits include problem solving, critical thinking,
analysis and debugging, computer self-efficacy, and an overall increase in computer literacy. As
newer and more powerful instructional software tools are developed, it is extremely important
for educational technology researchers to pursue a systemic evaluation of the multiple measures
of this fertile learning opportunity.
PDF created with FinePrint pdfFactory trial version http://www.fineprint.com

Flowchart Simulator 17
Second, it is important that the approach described in this paper—using a computer assisted
learning tool to support flowchart based logic and design at the beginning of the first
programming course—be adapted and tested in different venues. As the Computing Curriculum
2001 report states, “given enough enthusiasm, almost any pedagogical approach will succeed as
long as its proponents remain committed to that vision. The real test is whether the initial
success can be sustained when the approach is adopted by others.” (CC2001, section 7.5).
Finally, it is worth pointing out that progress in developing instructional technology can only
occur through the exploration and assessment of existing instructional technology tools. For
example, the development of FLINT was heavily influenced by the successes and limitations of
many other instructional technology tools to support novice programming students. Mini
languages such as Logo, Karel, and Karel++ avoid using a traditional high level programming
language by introducing an alternative language syntax, which unfortunately is often just as
complex. FLINT uses an intuitive representation (flowcharts) that novices find easier to
understand and use than traditional language syntax, but with the advantage that flowcharts are
fully transferable to traditional languages when the student is ready for the details. Iconic
approaches such as BACCII allow students to begin their design process without any traditional
language interaction. However, execution requires an intermediate step at the traditional
language level. FLINT interprets flowcharts and provides feedback without any traditional
language usage whatsoever, thereby allowing students to put off a high level language
indefinitely. Pseudo languages allow students to focus on design rather than syntax, but do not
provide immediate or consistent feedback. FLINT provides the user with immediate, accurate
feedback at the users request. It is only through a thorough analysis of the strengths and
PDF created with FinePrint pdfFactory trial version http://www.fineprint.com

Flowchart Simulator 18
weaknesses of the current state-of-the-art that we can hope to move forward rather than
repeatedly stumble over documented obstacles.
References
Bergin, J., Stehlik, M., Roberts, J., & Pattis, R. (1997). Karel++: A gentle introduction to the
art of object-oriented programming. New York: Wiley and Sons, Inc.
Bloom B. (1956). Taxonomy of Educational Objectives, the classification of educational
goals – Handbook I: Cognitive Domain, New York: McKay.
Brusilovsky, P., Calabrese, E., Hvorecky, J., Kouchnirenko, A., & Miller, P. (1997). Mini-
languages: a way to learn programming principles. Education and Information Technologies 2
65-83.
Calloni, B., Bagert, D., & Haiduk, H. (1997). Iconic programming proves effective for
teaching the first year programming sequence. Proceedings of the twenty-eighth SIGCSE
technical symposium on Computer science education, 262-266.
Computing Curriculum 2001, Ironman Report (2001). [On-Line]. Available:
http://www.computer.org/education/cc2001/
Farrell, J. (1999). A Guide to Programming Logic and Design. Cambridge, Thompson
Publishing Co.
Higgins, G. (1987). Alternatives to Flowcharts: II. Structure Charts. Computer Language,
Jan. 1987, 45-48
Kafai, Y. (1995). Minds in Play: Computer Game Design as a Context for Children’s
Learning. Lawrence Erlbaum Associates, Hillsdale, NJ.
Francisco, CA: Morgan Kaufmann.
PDF created with FinePrint pdfFactory trial version http://www.fineprint.com

Flowchart Simulator 19
Kammann, R. (1975). The Comprehensibility of Printed Instructions and the Flowchart
Alternative. Human Factors, Feb., 183-191.
Malik, M. (2000). Technical opinion: on the perils of programming. Communications of the
ACM(43)12, 95-97.
National Academy of Sciences. (1999). Being fluent with information technology.
Washington, DC: Author.
Papert, S. (1980). Mindstorms: Children, computers and powerful ideas. New York: Basic
Books.
Ramsey, H., Atwood, M., and Van Doren J. (1983). Flowcharts versus Program Design
Languages: An Experimental Comparison. Communications of the ACM, 26(6), 445-449.
Robertson, L. (2000). Simple Program Design – A Step-By-Step Approach, Third Edition.
Course Technology, Cambridge, MA
Scanlan, D. (1989). Structured Flowcharts Outperform Pseudocode: An Experimental
Comparison. IEEE Software, Sept., 28-36.
Shackelford, R. (1998). Introduction to Computing and Algorithms. Reading, MA: Addison
Wesley Longman.
Shneiderman, B. (1975). Experimental testing in programming languages, stylistic
considerations and design techniques. Proceedings AFIPS NCC, Montvale, N.J.: AFIPS Press,
653-656.
Sleeman, D. (1986). The Challenges of Teaching Computer Programming. Communications
of the ACM, 29(9), 840-841.
Soloway, E. (1993). Should We Teach Students to Program? Communications of the ACM
36(10), 21-24.
PDF created with FinePrint pdfFactory trial version http://www.fineprint.com

Flowchart Simulator 20
Spohrer, J., and Soloway, E. (1986). Novice Mistakes: Are the Folk Wisdoms Correct?
Communications of the ACM, 29(7), 624-632.
Sprankle, M. (1998). Problem Solving and Programming Concepts (4th ed.). New Jersey:
Prentice Hall.
Saret, L. (2001). Programming logic for business (4th ed.). Boston: McGraw-Hill Irwin.
Vessey, I., and Weber, R. (1986). Structured Tools and Conditional Logic: An Empirical
Investigation. Communications of the ACM, 29(1), 48-57.
Wright P. & Reid, F. (1973). Written Information: Some Alternatives to Prose for Expressing
the Outcomes of Complex Contingencies. Journal of Applied Psychology, Feb., 160-166.
PDF created with FinePrint pdfFactory trial version http://www.fineprint.com

Flowchart Simulator 21
IF A < D THEN PRINT A ELSE PRINT D IF B < C THEN PRINT B ELSE PRINT C END IF END IF
Figure 1. The simple algorithm (2 conditions)
IF D > A THEN IF B > D THEN PRINT A + D ELSE PRINT B + C END IF ELSE PRINT A + B IF B > C THEN IF C > A THEN PRINT C + D ELSE PRINT B + D END IF ELSE PRINT A + C END IF END IF
Figure 2. The medium algorithm (4 conditions)
PDF created with FinePrint pdfFactory trial version http://www.fineprint.com

Flowchart Simulator 22
IF B > D THEN IF A > B THEN PRINT C * C ELSE IF C > A THEN IF D > C THEN IF B > C THEN PRINT B * C ELSE PRINT C * D END IF ELSE PRINT A * B END IF ELSE PRINT A * C IF A > D THEN PRINT A * D ELSE PRINT B * D END IF END IF END IF ELSE PRINT A * A END IF
Figure 3. The complex algorithm (6 conditions)
Correctness Scores
0
1
2
3
Simple Medium ComplexFlowchart Program
Figure 4. Correctness scores for each algorithms (significant at p ≤ 0.05)
Confidence Scores
1
2
3
4
5
Simple Medium ComplexFlowchart Program
Figure 6. Confidence scores for each algorithm (significant at p ≤ 0.05)
Time Required
0255075
100125150175
Simple Medium ComplexFlowchart Program
Figure 5. Average time required in seconds to complete each algorithm (significant at p
≤ 0.05)
PDF created with FinePrint pdfFactory trial version http://www.fineprint.com

Flowchart Simulator 23
TABLE 1: PROBLEM SET FOR UNDERSTANDING PROGRAMMING LOGIC
EASY PROBLEM MEDIUM PROBLEM COMPLEX PROBLEM If A < D Then Do While A < 4 Do While B <= 6 Print D If A < D Then If D > B Then Else Print B Do While C >= 2 Print A Else Print C If B < C Then Print A C = C – 1 Print C If C < B Then Loop Else If A < B Then If A < B Then Print B Print C Print D End If Else End If End If Print D Else End If Print B Else If B < C Then Print A If A < B Then End If Print A End If Else A = A + 1 Print B Loop End If Print C Print C Else Print D If A < B Then Print B End If End If End If B = B + 1 Loop Print C
Figure 7 – Simple Flowchart Solution
PDF created with FinePrint pdfFactory trial version http://www.fineprint.com
Flowchart Simulator 24
Figure 8 – Assignment Statement Edit Dialog
PDF created with FinePrint pdfFactory trial version http://www.fineprint.com

Flowchart Simulator 25
Figure 9 – Sample FLINT Execution
PDF created with FinePrint pdfFactory trial version http://www.fineprint.com

Flowchart Simulator 26
0
0.5
1
1.5
2
2.5
3
Simple Medium Complex
Ave
rage
Sco
re
FLINT Control
Figure 11 – Program Understanding Results
0%
20%
40%
60%
80%
100%
Heade
r
Loop
Shell
Read L
oop
CalcLo
op
Selecti
on
Record
Out
Accum
ulator
OutCalc
OutSele
ct
Footer
FLINT Control
Figure 12 – Solution Generation Results
PDF created with FinePrint pdfFactory trial version http://www.fineprint.com

Flowchart Simulator 27
Table 2: Analysis of Solution Generation Elements ANOVA
9.998 1 9.998 91.817 .0007.840 72 .109
17.838 737.149 1 7.149 51.470 .000
10.000 72 .13917.149 73
2.324 1 2.324 10.929 .00115.311 72 .21317.635 73
1.686 1 1.686 15.814 .0007.678 72 .1079.365 73
.424 1 .424 9.081 .0043.360 72 4.667E-023.784 73
.286 1 .286 1.134 .29118.160 72 .25218.446 73
2.824 1 2.824 12.984 .00115.662 72 .21818.486 73
1.245 1 1.245 5.549 .02116.160 72 .22417.405 73
2.791 1 2.791 13.538 .00014.844 72 .20617.635 73
3.762 1 3.762 21.751 .00012.454 72 .17316.216 73
Between GroupsWithin GroupsTotalBetween GroupsWithin GroupsTotalBetween GroupsWithin GroupsTotalBetween GroupsWithin GroupsTotalBetween GroupsWithin GroupsTotalBetween GroupsWithin GroupsTotalBetween GroupsWithin GroupsTotalBetween GroupsWithin GroupsTotalBetween GroupsWithin GroupsTotalBetween GroupsWithin GroupsTotal
Report Header Output
Record Processing Loop
Record Input
Record Grade Calculation
Record Letter GradeSelection
Record Output
Record Accumulation
Class Grade Calculation
Class Letter GradeSelection
Report Footer Output
Sum ofSquares df
MeanSquare F Sig.
PDF created with FinePrint pdfFactory trial version http://www.fineprint.com