using choice experiments to elicit farmers preferences’ for crop
TRANSCRIPT

Using Choice Experiments to Elicit Farmers Preferences’ for Crop and Health Insurance
By
Nganje, William, Robert Hearne, Michael Orth, and Cole Gustafson1
Selected Paper Presented at the AAEA Annual Meeting Denver, Colorado, August 2004
Contact Author: William E. Nganje Assistant Professor, Agribusiness and Applied Economics 221D Morrill Hall Fargo, ND 58105 [email protected] 701/231-7459
Abstract
A random utility discrete choice experiments is used to determine farmers' preferences
for health insurance, crop insurance, and a product that switches some portion of crop
insurance subsidy to health insurance premium subsidy with access to large-pool risk
groups.
1 Copy rights reserved. Contact the authors before reproducing this document. The authors are William Nganje, Assistant Professor; Robert Hearne, Assistant Professor; Michael Orth, Graduate Research Assistant; and Cole Gustafson, Professor, all at North Dakota State University, Fargo, ND.
1
Using Choice Experiments to Elicit Farmers Preferences’ for Crop and Health Insurance
Introduction
U.S. farmers are offered a variety of subsidized crop insurance options, but as
self-employed entrepreneurs, they are at a disadvantage when purchasing health
insurance. This is due to the fact the farmers cannot form common employer groups and,
as individuals, any insurance risk pool that they would elect to join would be subject to
adverse selection. This situation is compounded by the rising cost of healthcare and the
fact that farming is considered a high-risk occupation, leading to increased health
insurance premiums. Often, traditional farm families seek off-farm employment that
provides health insurance as a benefit. This option may contribute to rural-urban
migration trends and may not be available to rural communities that have significant
distance from urban areas.
Theory suggests that farmers strive to balance all farm business and financial risks
in the context of a portfolio (Escalante and Barry, 2001). A logical extension of this
model assumes that farmers also strive to balance both business and personal health risks.
This extension implies that farmers may have different preferences for federal subsidies
that are available from federal risk mitigation programs. Individual farmers may be over-
insured in terms of federal crop insurance for yield or revenue risk, but underinsured in
terms of health risk. Many federal programs are available to farmers to mitigate crop
enterprise or business risk, but farmers have limited assistance to mitigate health risk. By
allowing farmers to reallocate federal insurance subsidy, they may be able to increase
overall risk protection while fostering program efficiency gains derived from better
allocation of federal funds.
2

A random utility discrete choice experiment is used to determine farmer’s
preferences for health insurance, crop insurance, and a holistic product that combines
crop and health insurance. The holistic product allows farmers to switch some portion of
crop insurance subsidy to health insurance subsidy and facilitate access to large-pool risk
groups. Choice experiments have been used extensively in the literature for the valuation
of non-market goods and services (Alpizar et al, 2001, Hall et al, 2002, Viney et al,
2002). Choice experiments allow researchers to value goods by using individuals stated
preferences in a hypothetical setting. Choices with alternative attributes and levels of
desired attributes were used in this study to elicit farmers’ preference for alternative
household risk mitigation strategies.
Through the use of focus groups from the health insurance industry, the crop
insurance industry, extension experts, and farmers, attributes and levels of the desirable
and workable products were selected. Types of crop insurance coverage analyzed
include: multiple peril crop insurance, crop revenue coverage, revenue assurance, and
adjusted gross revenue insurance. Crop insurance attributes include coverage level and
premium. Attributes for the analysis of health insurance benefits include: coverage type;
coinsurance; deductible; drug benefit; office visit co-pay, and premium. The premium in
the health insurance section is adjusted to reflect what a typical employer-sponsored
health plan would pay. Attributes included for the analysis of a holistic product include;
crop coverage type, coverage level, provider group, subsidy switch and premium2.
2 Attributes and levels for all insurance products (crop, health, and holistic) have been determined through the use of expert groups. Experts have illustrated ranges that would be proper for the type of experiment being conducted.
3

If all combinations of attributes and levels were presented to respondents, this
design (full factorial) would have consisted of 14,348,907 different possible product
combinations. Using the D-optimality procedure discussed later, these choices were
reduced to four blocks of nine choices and problems with orthogonality of selected
choices were eliminated without sacrificing much information other than higher order
interactions. Surveys were collected in over 21 counties throughout North Dakota and
Minnesota, representing different risk areas and different crop and livestock regions.
Most respondents were part of the North Dakota and Minnesota Farm and Ranch
Business Management Education Program3. Farmers’ preference for crop insurance,
health insurance, and a holistic product was analyzed using multinomial logit models.
Details of the multinomial logit model are presented in the method section.
This study provides several important contributions to the existing literature on
crop insurance and household risk management strategies. First, it provides baseline data
on farmers stated preference for alternative risk mitigation strategies. This is an important
first step to understand how to better formulate policies that may efficiently reallocate
federal subsidy to farmers. Second, farmer’s preference and willingness to pay for whole
farm insurance products are derived. The hypothesis that whole farm insurance products,
like adjust gross revenue (AGR), may lead to lower risks and lower premiums and
therefore should be preferred by farmers is yet to be tested empirically. Third, some
studies have made significant contributions regarding farmers’ preferences for crop
insurance attributes, but these studies have been limited by their use of conjoint analysis
3 The North Dakota and Minnesota Farm Business Management Education Programs are randomly selected groups of agricultural producers that correctly represent these state’s agricultural demographic and financial characteristics (North Dakota and Minnesota Farm and Ranch Business Management Education Reports, Multiple year).
4

and potential demand implications for new products (Sherrick et al, 2003, Sherrick et al,
2004). Using choice experiments it is possible to extend the analysis of farmers stated
preferences and derive demand functions for alternative hypothetical insurance products
and farmers willingness to pay for these products. This is particularly important in a
holistic product setting.
Literature Review
Studies on crop risk have identified health risk as an important risk attribute.
Patrick et al (1985) surveyed farmers to better understand what they perceived to be the
most challenging or important risks they faced in crop production and ways to manage
these risks. Results indicate that producers consider more than just yield and price risk
when making crop enterprise decisions, but these two remain the most important. Other
sources of crop enterprise risk important to the survey group were inflation, input cost,
disease and pests, world events, safety and health. However, empirical and theoretical
models have evaluated crop and health risk separately.
Current health risk mitigation strategies have proven to be inadequate in
managing household risks. Leno (2003) states that there are four main strategies being
used by farmers to mitigate health risks. These strategies are: to pay for health insurance
with out-of-pocket expenses, use a publicly subsidized plan, get insurance through group
or coop insurance, or have one party in the household secure employment for off-farm
employment insurance. These strategies may lead to rural-urban migration. Gripp and
Ford (1992) analyzed the determinants of holding health insurance coverage for
Pennsylvania dairy farm managers. Major results of this study were that older farmers,
higher education levels, and greater farm income all increase the probability of the
5

respondent holding health insurance. Meyer, Orazem and Wachenheim (2002) analyze
labor supply responses to employer-provided health insurance. They concluded that
employees enjoy significant benefits with employer based insurance and their large risk
pool nature. Bharadwaj and Findeis (2003) examine the motivations for off-farm work
among farm women in the United States. The researchers found that farm families with
substantial farm assets are less likely to work off-farm. While these people are less likely
to work off the farm, the paper finds that labor markets offering jobs with benefits are
attracting labor off American farms, large and small. Health benefits are one of the main
reasons for farmers and their spouses to seek off-farm employment.
Methods to evaluate farmers’ preferences for alternative risk mitigation strategies
have been limited to conjoint analysis. Sherrick et al (2003) determine farmers’
preferences for crop insurance attributes using conjoint analysis. The authors found the
most important crop insurance attributes to be coverage level and acreage flexibility.
Conjoint analysis limits the ability to explore the demand and willingness to pay for the
entire range (existing and potential) products. Using choice experiments, it will be
possible to extend stated preference analysis to understand farmers preference for
alternative risk mitigation strategies (Alpizar, Carlsson, and Martinsson, 2001). Viney,
Lancsar, and Louviere (2002) utilize discrete choice experiments as a method to elicit and
analyze individuals’ preferences for health and healthcare. The paper provides an
overview of the approach that is used and discusses issues that arise when using discrete
choice experiments to assess individual preferences for healthcare. The empirical model
used in this study extends Viney, Lancsar, and Louviere model to incorporate a holistic
product of crop and health risks.
6

Methodology
The choice experiment methodology has three main components. First, focus
groups must be conducted to assure correct attributes and levels are presented to the
survey respondents. Second, experimental design must be performed to narrow the
possible choices from the full factorial design to a design that a respondent can complete
in a reasonable amount of time. Third, an appropriate econometric model must be
determined from the distribution of the error term of the respondent’s utility function.
The proceeding section discusses this three components in detail.
It is important to present the correct attributes and levels to the farmers that are
being surveyed. In order to ensure the correct attributes and levels for crop, health and
the holistic products are being evaluated, expert focus group interviews from the crop
insurance industry and the health insurance industry were conducted. These groups
identified attributes, and attribute levels that such products must have in order to be
fundamentally sound, economically feasible, and generally accepted. The health
insurance experts group was completed on June 10, 2003. This group was asked mostly
open-ended questions. A major finding from this group was that adverse selection is a
big problem when forming health insurance groups. These groups need to be either low
cost or mandatory to avoid these problems. The crop insurance experts group was
completed on July 11, 2003. This group emphasized that a proposed holistic insurance
program must be simple to administer. Following these groups, a preliminary focus
group and survey of farmers was conducted to ensure all survey items were logical and
consistent with the targeted survey population. A preliminary farmers’ group was
completed on September 11, 2003. A second farmers’ group was completed on
7
September 23, 2003, following comments and revisions from the preliminary farmer
group.
Stated preference methods (which include choice experiments) assess the value of
non-market goods by using an individual’s stated behavior in a hypothetical setting.
Stated preference methods were used in this study because the researcher is able to
control relationships between attributes, which permits mapping of utility functions with
technologies different from existing ones, as well as being able to include existing and/or
proposed choice alternatives.
Choice experiments are being applied more and more frequently for the valuation
of non-market goods. Choice experiments give the value of a certain good by separately
evaluating the preferences of individuals for the relevant attributes that characterize the
good, and by doing this it provides much information that can be applied to the preferred
design of the good.
Individuals participating in a choice experiment are given a hypothetical setting
and asked to choose their preferred alternative among several alternatives in a choice set.
The individuals are usually asked to perform a sequence of these choice sets. Each
alternative choice available in the survey is described by a number of attributes or
characteristics. A monetary value is included as one of the attributes, along with other
attributes of importance to the alternative presented. When an individual makes a choice,
they implicitly make tradeoffs between levels of the attributes in the different alternatives
in a choice set (Alpizar, Carlsson, Martinsson, 2001). Experimental design, in this case,
is the creation of choice sets in an efficient manner. The standard approach in marketing,
transportation, and health economics has been to use orthogonal designs, where the
8

variations of the attributes of the alternatives are uncorrelated in all choice sets. A design
is developed in two steps: first, obtaining the optimal combinations of attributes and
attribute levels to be included in the experiment and, second, combining those profiles
into choice sets.
A starting point is the full factorial design, which is a design that contains all
possible combinations of the attribute levels that characterize the different alternatives. A
full-factorial design is generally very large and not tractable in a choice experiment.
Therefore, it is necessary to choose a subset of all possible combinations, while following
some criteria for optimality, and then construct the choice sets. In choice experiments,
design techniques used for linear models have been popular. Orthogonality, in particular,
has often been used as the principle part of an efficient design (Huber and Zwerina,
1996). Marketing researchers have developed design techniques based on the D-optimal
criteria for non-linear models in a choice experiment context. D-optimality is related to
the covariance matrix of the K-parameters, defined as .]|[| 1/1 −Ω=− KefficiencyD
Huber and Zwerina (1996) identify four principals for an efficient design of a choice
experiment based on a non-linear model: (i) orthogonality, (ii) level balance, (iii) minimal
overlap, and (iv) utility balance. Table 1 presents examples of the three choice set
designs that were evaluated in this paper.
The economic model presented in this section deals only with purely discrete
choices (Alpizar, Carlsson, Martinsson, 2001). Each individual’s maximization problem
is:
9
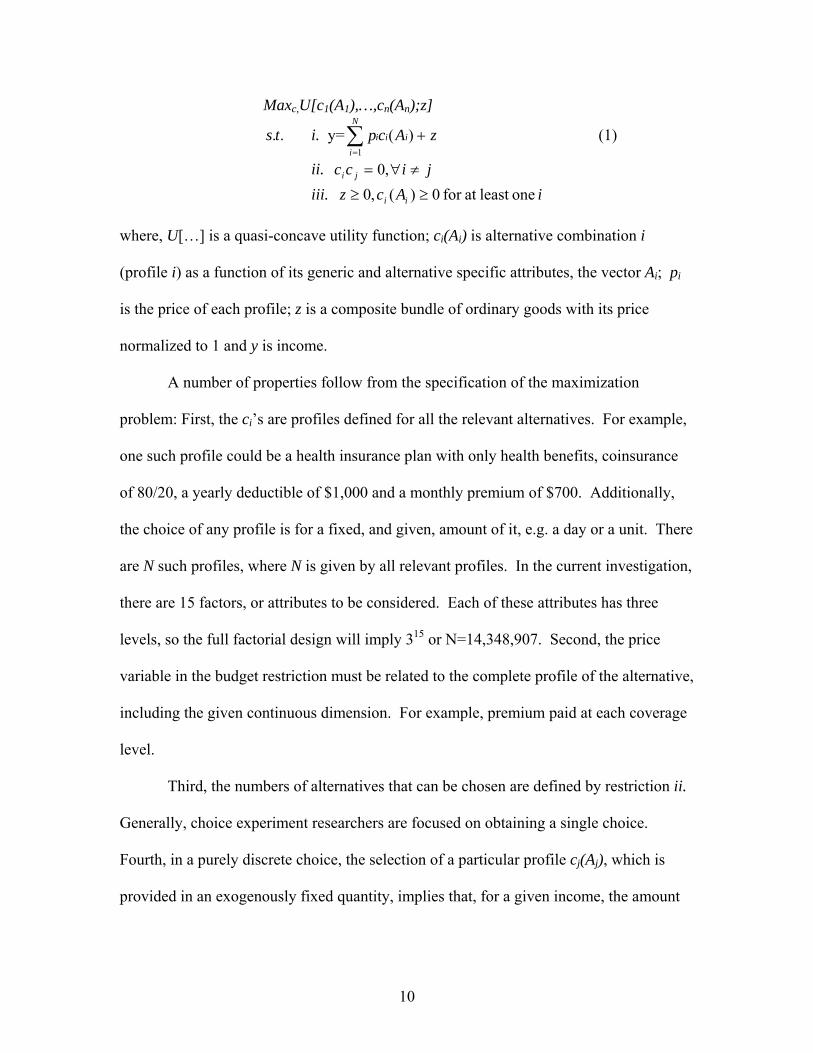
Maxc,U[c1(A1),…,cn(An);z]
..ts i. y= (1) zAcp iii
N
i+∑
=
)(1
ii. jicc ji ≠∀= ,0 iii. iAcz ii oneleast at for 0)(,0 ≥≥
where, U[…] is a quasi-concave utility function; ci(Ai) is alternative combination i
(profile i) as a function of its generic and alternative specific attributes, the vector Ai; pi
is the price of each profile; z is a composite bundle of ordinary goods with its price
normalized to 1 and y is income.
A number of properties follow from the specification of the maximization
problem: First, the ci’s are profiles defined for all the relevant alternatives. For example,
one such profile could be a health insurance plan with only health benefits, coinsurance
of 80/20, a yearly deductible of $1,000 and a monthly premium of $700. Additionally,
the choice of any profile is for a fixed, and given, amount of it, e.g. a day or a unit. There
are N such profiles, where N is given by all relevant profiles. In the current investigation,
there are 15 factors, or attributes to be considered. Each of these attributes has three
levels, so the full factorial design will imply 315 or N=14,348,907. Second, the price
variable in the budget restriction must be related to the complete profile of the alternative,
including the given continuous dimension. For example, premium paid at each coverage
level.
Third, the numbers of alternatives that can be chosen are defined by restriction ii.
Generally, choice experiment researchers are focused on obtaining a single choice.
Fourth, in a purely discrete choice, the selection of a particular profile cj(Aj), which is
provided in an exogenously fixed quantity, implies that, for a given income, the amount
10

of ordinary goods z that can be purchased is also fixed. Combining this with the
restriction that only a single profile, cj, can be chosen results in the equation:
(2) jj cpyz −=
Fifth, restriction iii specifies that the individual will choose a non-negative
quantity of the composite good and the goods being studied. If it is assumed that the
good is essential to the individual or that an environmental program must be
implemented, then the respondent made a choice (ci > 0 for at least one i).
The multinomial logit (MNL) model assumes that the random components are
independently and identically distributed with an extreme value type I distribution
(Gumbel). This distribution is characterized by a scale parameter δ4. The scale
parameter is related to the variance of the distribution such that 22 6 var µπε = . When it
is assumed that the random components are extreme value distributed, the choice
probability can be written as:
.)Vexp(
)Vexp(),S|P(j
i
jm ∑ µ
µ=β
∈ mSi
(3)
There are two basic problems with the MNL specification: first, the alternatives
are independent, and second, there is a limitation in modeling variation in taste among
respondents. The IID assumption (constant variance) causes the first problem, which
results in the independence of irrelevant alternatives (IIA) property. This property states
that the ratio of choice probabilities between two alternatives in a choice set is unaffected
by changes in that choice set. The MNL model should not be used if this assumption is
violated.
11
There are several hypotheses that are included with this project. The first is that
farmers prefer a whole farm crop insurance product and are willing to pay for this
product. The second hypothesis is that healthcare spending significantly affects farmers’
preferences for health insurance, or higher premiums will prevent farmers from obtaining
health insurance coverage. The third hypothesis is that farmers prefer a holistic product
to mitigate crop and health risk jointly and are willing to pay for this product. The fourth
hypothesis of this project is that farmers are willing to switch a portion of their federal
crop insurance subsidy to compliment health coverage.
Results
A total of 86 surveys were returned with complete and usable discrete choice
survey portions5. Farmers included in focus groups for this study believe they face
obstacles in obtaining affordable health insurance because they lack access to groups like
other employer-sponsored healthcare plans. Another finding of focus groups was that
farmers may be willing to switch some of their federal crop insurance premium subsidy
to health insurance if this switch would allow them access to large risk groups for
insurance pooling purposes. Table 2 contains descriptive information about the
respondents.
From the results of the generalized discrete multinomial logit model it is possible
to determine how each attribute and attribute level affects the probability of the
respondent’s overall choice of insurance product. The attributes affecting the probability
5 Only 60 respondents were required to satisfy the optimal design and provide a required sample size of 2160 observations (36 * 60). Another advantage of choice experiments is that smaller samples can be used to respond to several choice sets. 86 survey in this study provided a larger sample size (information set) than required, with desirable properties of large samples.
12

of the respondent’s choice of crop insurance product are the crop insurance type,
coverage level, and premium. Each of these attributes has three levels to select from.
The crop insurance section of the survey was arranged into three blocks of six. This
design was discussed previously in the experimental design section.
Hausman and McFadden (1984) proposed a specification test for the multinomial
logit model to test the assumption of the independence from irrelevant alternatives (IIA).
Independence from Irrelevant Alternatives is a consequence of the initial assumption that
stochastic terms in the utility function are independently and identically distributed. The
procedure is to first estimate the model with all choices. The alternative specification is
the model with a smaller set of choices. Thus, the model is estimated with this restricted
set of alternatives and the same model specification. The set of alternatives is reduced to
those in which one of the smaller set of choices is made. The test statistic is
][][]'[ 1ururur bbVVbbq −−−= −
where ‘r’ and ‘u’ indicate restricted and unrestricted (larger choice set) models and V is
an estimated covariance matrix for the estimates. In order to compute the coefficients in
the restricted model, it is necessary to drop those observations that choose the omitted
choice. In this case, 139 observations were skipped. The Hausman statistic is used to
carry out the test. In this case the Pr(C>c) value of 0.000000 suggests that the
independence from irrelevant alternatives assumption is satisfied.
Table 3 presents the results of the multinomial logit model for the crop insurance
stated preferences:
εαβααα
αααα
+++++
++++=
LVarCemiumvelCoverageLeacresSizeEducation
reEmployInsuNetWorthAgeearsOperationYY
LVarCemCLSizeEDU
NFPEINWAgeOpyear
/Pr)( /Pr
13

In this model, different choices of crop insurance product are influenced by
different factors. The only variables that are significant across all three choices are
education and crop insurance type, which is perfectly correlated with the choice.
Education has a positive coefficient, meaning that as this variable increases in level, so
will the probability of the respondent choosing that particular insurance product. There
are many other significant variables in the model, but these variables are not significant
across all choices. This demonstrates the respondents differing motives, business, and
personal needs when choosing crop insurance products to mitigate business and financial
risk.
When choosing MPCI, the significant variables are: net worth, paid employee
insurance, education, farm size, crop insurance type, and crop insurance coverage level.
MPCI has the most significant variables in the model, but does not include crop insurance
premium as a significant variable. This could be attributed to a number of factors.
Coverage level could be much more important when making decisions regarding MPCI
or farmers could have regarded the premium section as unbelievable in the survey
because most of the respondents already hold MPCI and know what the premium is,
negating the levels presented.
The significant variables for Crop Revenue Coverage (CRC) are: net worth,
employee insurance, education, farm size, crop and livestock variable, crop insurance
type, and crop insurance premium. The significant variables when choosing CRC
illustrated that as wealth, education, and farm size increase, there is an increased
probability of holding yield and revenue products like CRC as opposed to yield only
products like MPCI. The crop and livestock variable being negative and significant show
14

that as a producer moves from crop production to mixed crop/livestock to livestock only
production there is decreased probability of holding crop insurance. This finding makes
sense as this crop insurance product is not offered for livestock. When selecting CRC,
coverage level was not significant to the model but premium was significant and had a
negative coefficient, as expected. This demonstrates that farmers may not care about
coverage levels as much as price when selecting this type of insurance. As premiums
increase, the probability of holding CRC will decrease.
When choosing adjusted gross revenue or whole farm insurance, the variables that
are significant to the model are: education, crop and livestock variable, crop insurance
type, and crop insurance premium. These significant variables are very similar to the
significant variables for CRC. This shows that farmers may make decisions based on the
same criteria for whole-farm insurance as they do for current yield/revenue products.
Table 4 presents a model where demographic characteristics have been included
with health insurance attributes to determine what factors influence health insurance
choice decisions. The health insurance section of the survey has been broken into four
blocks of nine to make it possible for one person to rate all alternatives in a timely
fashion. The independence from irrelevant alternatives (IIA) assumption has been tested
and is satisfied in the health insurance multinomial logit model. Table 4 presents the
results of the discrete multinomial logit model for the health insurance preferences:
εββ
βββαααα
+++
++++++=
emType
CopayDRUGDEDHCSOHIBNWAgeY
emType
CopayDrugDEDHCSOHIBNWAge
PrPr
There are only two variables that are not significant when explaining the
probability of choice 80/20. These variables are the product attribute, prescription drug
15
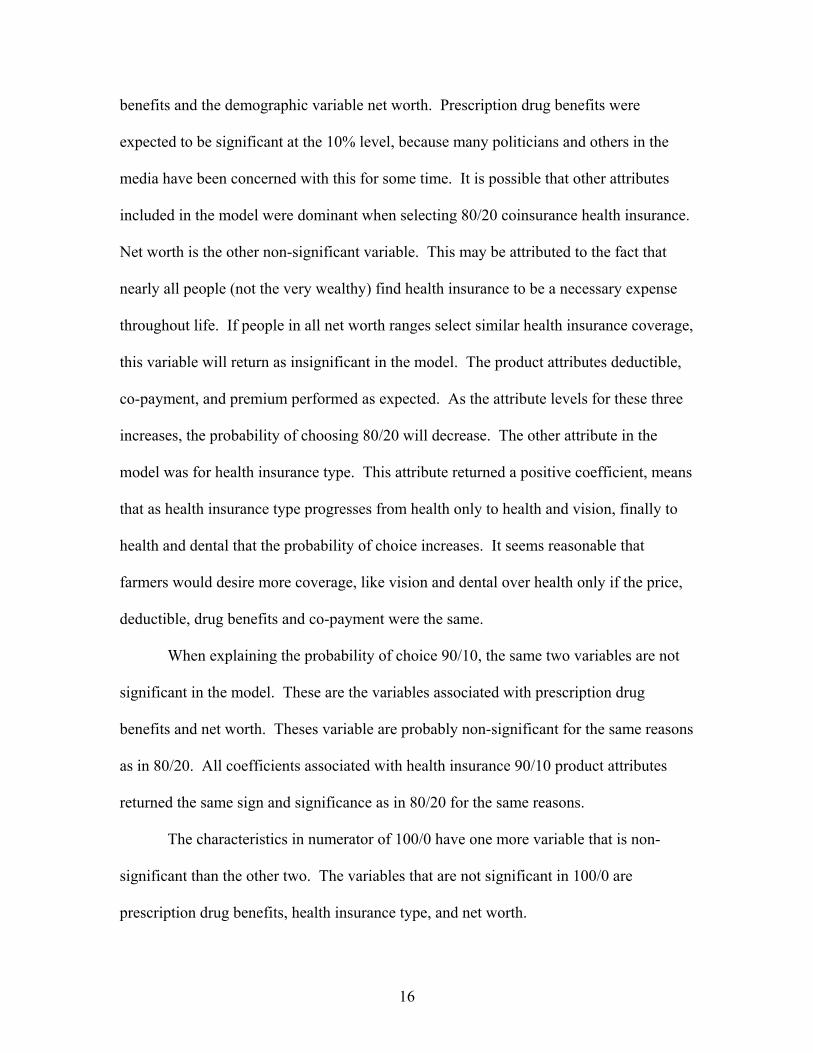
benefits and the demographic variable net worth. Prescription drug benefits were
expected to be significant at the 10% level, because many politicians and others in the
media have been concerned with this for some time. It is possible that other attributes
included in the model were dominant when selecting 80/20 coinsurance health insurance.
Net worth is the other non-significant variable. This may be attributed to the fact that
nearly all people (not the very wealthy) find health insurance to be a necessary expense
throughout life. If people in all net worth ranges select similar health insurance coverage,
this variable will return as insignificant in the model. The product attributes deductible,
co-payment, and premium performed as expected. As the attribute levels for these three
increases, the probability of choosing 80/20 will decrease. The other attribute in the
model was for health insurance type. This attribute returned a positive coefficient, means
that as health insurance type progresses from health only to health and vision, finally to
health and dental that the probability of choice increases. It seems reasonable that
farmers would desire more coverage, like vision and dental over health only if the price,
deductible, drug benefits and co-payment were the same.
When explaining the probability of choice 90/10, the same two variables are not
significant in the model. These are the variables associated with prescription drug
benefits and net worth. Theses variable are probably non-significant for the same reasons
as in 80/20. All coefficients associated with health insurance 90/10 product attributes
returned the same sign and significance as in 80/20 for the same reasons.
The characteristics in numerator of 100/0 have one more variable that is non-
significant than the other two. The variables that are not significant in 100/0 are
prescription drug benefits, health insurance type, and net worth.
16

Table 5 presents a model where demographic characteristics have been included
with holistic insurance attributes to determine what outside factors influence holistic
insurance choice decisions. The holistic insurance section of the survey has been broken
into four blocks of nine. The independence from irrelevant alternatives (IIA) assumption
has been tested and is satisfied. Table 5 presents the results of the discrete multinomial
logit model:
εββββαααα
ααα
ααααα
+++++++++
+++
++++=
emiumGroupSubSwitchelCoveraeLevFarmSizeEducationobHealthenHealthInsB
enHealthInsBSpendingHealthcaresuranceEmployeeIn
NetWorthrkFullTimeWoDependentsAgeOpYearsY
emGRPSSCL
SizeEDUSHPSHIB
OHIBHCSNFPEI
NWFTWDepAgeOpyear
PrPr2
1
Pr
The probability of choosing AGR is determined by the following significant
variables: dependents, number of workers, healthcare spending, operators health
insurance benefits, significant health problems, farm size, education, holistic subsidy
switch, group, and premium. This choice is being critically evaluated to determine if
farmers prefer some type of whole farm insurance, and what attributes of this product are
important to them when choosing this alternative. When conducting focus groups
regarding whole-farm insurance, farmers and crop insurance agents said they would be
more likely to try whole farm insurance if and only if they were presented with higher
coverage levels (>90%) to resemble other property insurance so it is interesting to note
that the only holistic product attribute that was deemed insignificant in the model was the
coverage level attribute. (This attribute was insignificant in all holistic choices) The
coefficient for subsidy switch is negative and significant at the 10% level for AGR. This
means that as subsidy switch converts premium from crop insurance to health insurance,
the respondent will be less likely to hold AGR. The coefficient for provider group is a
17
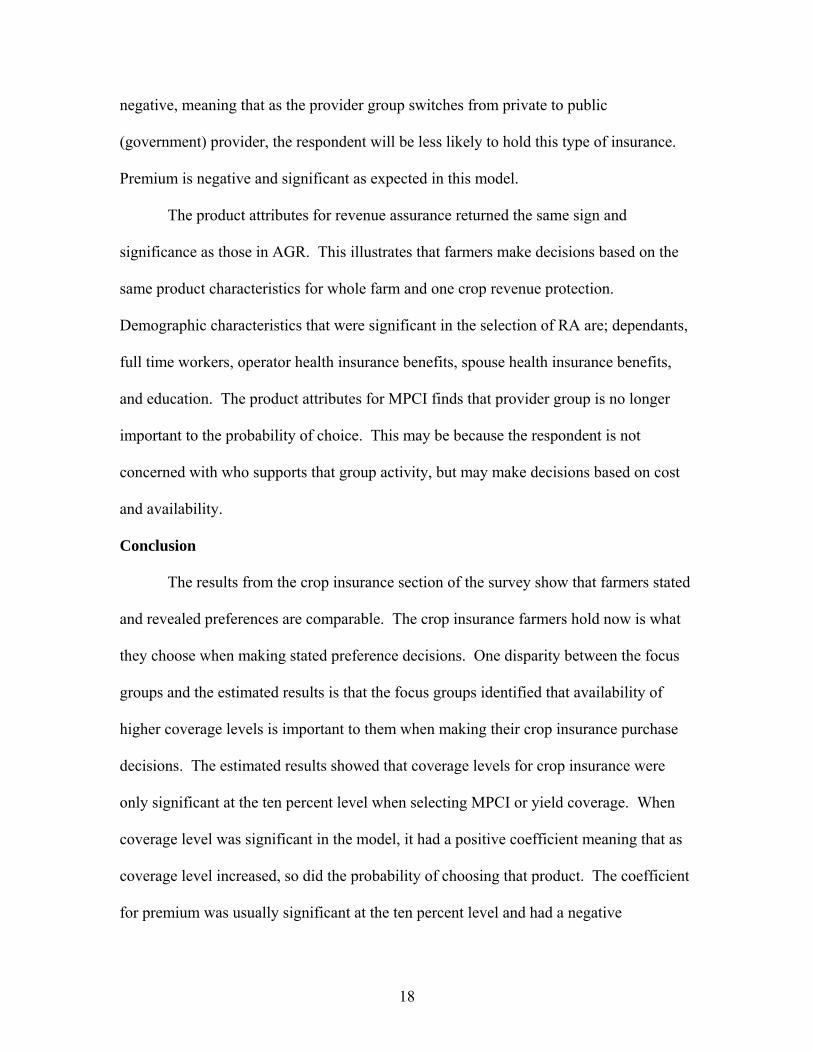
negative, meaning that as the provider group switches from private to public
(government) provider, the respondent will be less likely to hold this type of insurance.
Premium is negative and significant as expected in this model.
The product attributes for revenue assurance returned the same sign and
significance as those in AGR. This illustrates that farmers make decisions based on the
same product characteristics for whole farm and one crop revenue protection.
Demographic characteristics that were significant in the selection of RA are; dependants,
full time workers, operator health insurance benefits, spouse health insurance benefits,
and education. The product attributes for MPCI finds that provider group is no longer
important to the probability of choice. This may be because the respondent is not
concerned with who supports that group activity, but may make decisions based on cost
and availability.
Conclusion
The results from the crop insurance section of the survey show that farmers stated
and revealed preferences are comparable. The crop insurance farmers hold now is what
they choose when making stated preference decisions. One disparity between the focus
groups and the estimated results is that the focus groups identified that availability of
higher coverage levels is important to them when making their crop insurance purchase
decisions. The estimated results showed that coverage levels for crop insurance were
only significant at the ten percent level when selecting MPCI or yield coverage. When
coverage level was significant in the model, it had a positive coefficient meaning that as
coverage level increased, so did the probability of choosing that product. The coefficient
for premium was usually significant at the ten percent level and had a negative
18

coefficient, meaning that as the premiums increase, the probability of choosing that
product will decrease.
The results from the health insurance section of the survey illustrate that farmers
prefer to hold any type of health insurance that is perceived affordable to them. As
deductible levels, office visit co-payments, and premiums increase, the probability of
choosing that particular type of health insurance will decrease. These results were
expected by researchers when beginning the project. The negative coefficient for
prescription drug benefits was not expected. It would seem reasonable that as drug
benefits increased in the model, so would the probability of choosing that alternative, but
as drug benefits increase, the probability of choosing that alternative will decrease. The
mean of X for prescription drug benefits was 2.69 on a one to three scale, so nearly all
respondents chose the highest level, and other factor could be influencing this, such as
cost. Health insurance type has a positive coefficient in the model, meaning that as the
health insurance type increases from health, to health and vision, and finally health vision
and dental, the respondent will be more likely to choose that alternative.
Holistic insurance has proven to be more popular that expected. 64% of
respondents chose some type of holistic insurance product. Coverage level proved
insignificant in all alternatives, but had a mean of X of 2.89 out of three, so most chose
the >75% coverage level. Subsidy switch, provider group, and premium all had negative
coefficients meaning as these increase, the probability of that alternative choice will
decrease.
19
Limitations and Need for Further Research
This study is just the beginning for those who would like to better understand
farmers’ preferences for health, crop, and holistic insurance products. One of the major
limitations of this study is that subgroups have not been identified within the population.
If a cross tab analysis were conducted to determine the insurance preferences of those in
different counties, risk groups, or production specialties, this would provide a great
wealth of knowledge. If the study were broadened to include other states that may be
lower in crop risk, there may be increased willingness for a product that includes a
subsidy switch.
20

Reference Alpizar, F., F. Carlsson and P. Martinsson. (2001) “Using Choice Experiments for Non-
Market Valuation.” Working Papers in Economics no. 52. Department of Economics, Goteborg University.
Bharadwaj, L. and J. Findeis. (2003) “Off-farm Work Among Farm Women: Motivations, Earnings and Benefit Receipt.” American Agricultural Economics Association. Montreal, Canada. July 27-30.
Escalante, C. L. and P. J. Barry. (2001) "Risk Balancing in an Integrated Farm Risk Management Plan." Journal of Agricultural and Applied Economics, (33)3. pp. 413-29.
Gripp, S. and S. Ford. (1997)“Health Insurance Coverage for Pennsylvania Dairy Farm Managers.” Agricultural and Resource Economics Review, 26(2). pp. 174-183.
Hall, J., R. Viney, M. Haas and J. Louviere. (2002) “Using Stated Preference Discrete Choice Modeling to Evaluate Healthcare Programs.” Journal of Business Research 57(6). pp. 1-7.
Hausman, J. and D. McFadden. (1984): "Specification Tests for the Multinomial Logit Model." Econometrica. 52 (September), 1219-1240.
Huber, J. and K. Zwerina. (1996) “The Importance of Utility Balance in Efficient Choice Designs.” Journal of Marketing Research 33. pp. 307-317.
Leno, S. (2003) Focus Group Interview. June 10, 2003 Meyer, R., P. Orazem., W.A. Wachenheim. (2002) "Labor Market Implications of Rising
Costs of Employer-Provided Health Insurance," Staff General Research Papers 10016, Iowa State University, Department of Economics.
Patrick, G.R., P.N. Wilson, P.J. Barry, W.G. Boggess and D.L. Young. (1985) “Risk Perceptions and Management Responses: Producer-Generated Hypothesis for Risk Modelling.” Southern Journal of Agricultural Economics, 17(2). pp. 231-238.
Sherrick, B. J., P. J. Barry, G. D. Schnitkey, P. N. Ellinger, and B. C. Wansink. (2003) "Farmers Preferences for Crop Insurance Attributes" Review of Agricultural Economics, 25(2). pp. 415-429.
Sherrick, B.J., P.J. Barry, P.N. Ellinger, and G.D. Shnitkey. (2004) “Factors Influencing
Farmers’ Crop Insurance Decisions.” American Journal of Agricultural Economics, 86(1). pp. 103-114.
Viney, R., E. Lancsar and J. Louviere. (2002) “Discrete Choice Experiments to Measure Consumer Preferences for Health and Healthcare.” Expert Review of Pharmacoeconomics and Outcomes Research. 2(4). pp. 319-326.
21
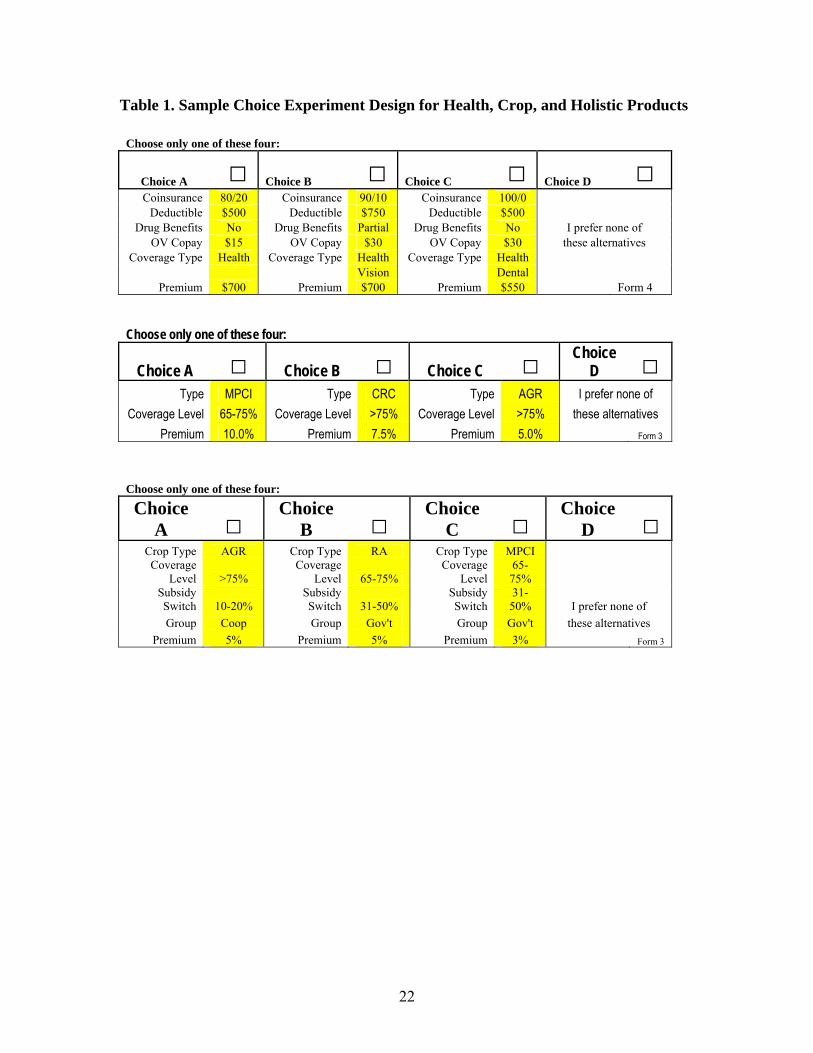
Table 1. Sample Choice Experiment Design for Health, Crop, and Holistic Products
Choose only one of these four:
Choice A Choice B Choice C Choice D Coinsurance 80/20 Coinsurance 90/10 Coinsurance 100/0
Deductible $500 Deductible $750 Deductible $500 Drug Benefits No Drug Benefits Partial Drug Benefits No I prefer none of
OV Copay $15 OV Copay $30 OV Copay $30 these alternatives Coverage Type Health Coverage Type Health Coverage Type Health
Vision Dental Premium $700 Premium $700 Premium $550 Form 4
Choose only one of these four:
Choice A Choice B Choice C Choice D
Type MPCI Type CRC Type AGR I prefer none of Coverage Level 65-75% Coverage Level >75% Coverage Level >75% these alternatives
Premium 10.0% Premium 7.5% Premium 5.0% Form 3
Choose only one of these four:
Choice A Choice
B Choice C Choice
D Crop Type AGR Crop Type RA Crop Type MPCI Coverage
Level >75% Coverage
Level 65-75% Coverage
Level 65-75%
Subsidy Switch 10-20%
Subsidy Switch 31-50%
Subsidy Switch
31-50% I prefer none of
Group Coop Group Gov't Group Gov't these alternatives Premium 5% Premium 5% Premium 3% Form 3
22

Table 2: Respondent Characteristics
Operator Age (AGE) Health Insurance Source (HIS) Under 30 8% None 3% 31-45 44% Individual/Self Funded 57% 46-60 40% Government 1% Over 61 8% Cooperatives/NGC's 3% Dependents (DEPEND) Employment Insurance 26% None 13% Other 5% 1 Dependant 20% Operator Benefits (OHIB) 2 Dependants 27% No 62% 3 Dependants 22% Yes 38% 4 Dependants 12% Spouse Benefits (SHIB) 5 Dependants 5% No 42% 6+ Dependants 2% Yes 58% Full Time Workers (FTW) Significant Health Problems (SHP) None 8% Yes 26% One 41% No 74% Two 40% Education (EDU) Three 5% High School 19% Four + 7% Some College 34% Total Assets (TA) College Grad 43% Less than $100,000 9% Grad School 5% $200,000-$499,999 26% Total Farm Size (SIZE) $500,000-$999,999 24% 1-500 Acres 3% $1,000,000-$1,999,999 26% 500-999 Acres 13% $2,000,000-$4,999,999 8% 1,000-1,999 Acres 30% Over $5,000,000 3% 2,000-2,999 Acres 24% Net Worth (NW) 3,000-3,999 Acres 13% Less than $200,000 10% 4,000 Plus Acres 13% $100,000-$249,999 19% Healthcare Spending (HCS) $250,000-$499,999 24% Less than $1,000 8% $500,000-$999,999 17% $1,000-$1,999 10% $1,000,000-$2,499,999 14% $2,000-$4,999 27% Over $2,500,000 6% $5,000-$9,999 36% Employee Insurance (NFPEI) $10,000+ 16% Yes 24% No 76%
23

Table 3. Crop Insurance Multinomial Logit Model Results
Chi Squared 1101.886 Degrees of Freedom 27 McFadden R Squared 0.79098 Variable Coefficient Standard Error b/St.Er. P[|Z|>z] Mean of X
Characteristics in Numerator of Prob[Y=1] MPCI 27% CITYPE -13.7213 1.3919 -9.8580 0.0000 2.2810
CICL 2.9091 0.9837 2.9570 0.0031 2.6143 CIPREM -0.8722 0.7901 -1.1040 0.2696 2.0717 OPYRS 0.3061 0.1838 1.6660 0.0957 25.3488
AGE -0.2809 0.1822 -1.5420 0.1231 45.9767 EDU 3.5873 1.0459 3.4300 0.0006 2.3372 NW 0.6697 0.3162 2.1180 0.0342 2.9535
NFPEI 7.8857 1.7470 4.5140 0.0000 1.9186 SIZE 0.9001 0.2817 3.1950 0.0014 3.5814
CLVAR -0.5752 0.5376 -1.0700 0.2847 1.7907 Characteristics in Numerator of Prob[Y=2] CRC 35%
CITYPE -4.4527 1.0063 -4.4250 0.0000 2.2810 CICL 1.1137 0.8280 1.3450 0.1786 2.6143
CIPREM -1.6115 0.7213 -2.2340 0.0255 2.0717 OPYRS 0.2505 0.1806 1.3870 0.1655 25.3488
AGE -0.2232 0.1679 -1.3290 0.1837 45.9767 EDU 2.5065 1.0045 2.4950 0.0126 2.3372 NW 0.4824 0.2631 1.8340 0.0667 2.9535
NFPEI 5.7208 1.6549 3.4570 0.0005 1.9186 SIZE 0.5019 0.2150 2.3350 0.0196 3.5814
CLVAR -0.8920 0.4169 -2.1400 0.0324 1.7907 Characteristics in Numerator of Prob[Y=3] AGR 17%
CITYPE 3.5637 1.2141 2.9350 0.0033 2.2810 CICL -0.6466 0.7103 -0.9100 0.3626 2.6143
CIPREM -4.1297 0.9391 -4.3970 0.0000 2.0717 OPYRS 0.2301 0.1878 1.2250 0.2205 25.3488
AGE -0.2426 0.1743 -1.3920 0.1638 45.9767 EDU 2.1144 1.1199 1.8880 0.0590 2.3372 NW 0.4208 0.2848 1.4780 0.1394 2.9535
NFPEI 2.1775 1.5663 1.3900 0.1645 1.9186 SIZE -0.3673 0.2250 -1.6320 0.1027 3.5814
CLVAR -0.9928 0.4860 -2.0430 0.0411 1.7907 Percent Correct Predicted=92.8294%
24

Table 4: Health Insurance Multinomial Logit Model Results
Chi Squared 844.2346 Degrees of Freedom 24 McFadden R Squared 0.40039 Variable Coefficient Standard Error b/St.Er. P[|Z|>z] Mean of X
Characteristics in Numerator of Prob[Y = 1] 80/20 18% AGE 0.3914 0.2140 1.8290 0.0674 45.9767 NW 0.4272 0.3284 1.3010 0.1933 2.9535
OHIB 22.8825 9.4631 2.4180 0.0156 1.9419 HCS 1.6267 0.7319 2.2220 0.0263 3.4186
HIDED -5.4683 1.9600 -2.7900 0.0053 2.3592 HIDRUG -1.0254 1.4712 -0.6970 0.4858 2.6990
HICOPAY -4.3181 1.5979 -2.7020 0.0069 2.4380 HITYPE 3.0853 1.3341 2.3130 0.0207 2.5879
HIPREM -13.3330 6.7214 -1.9840 0.0473 2.1925 Characteristics in Numerator of Prob[Y = 1] 90/10 26%
AGE 0.3790 0.2138 1.7720 0.0763 45.9767 NW 0.4925 0.3272 1.5050 0.1322 2.9535
OHIB 23.3377 9.4511 2.4690 0.0135 1.9419 HCS 1.6170 0.7318 2.2100 0.0271 3.4186
HIDED -5.3475 1.9576 -2.7320 0.0063 2.3592 HIDRUG -1.1108 1.4658 -0.7580 0.4486 2.6990
HICOPAY -4.4797 1.5950 -2.8090 0.0050 2.4380 HITYPE 2.9977 1.3427 2.2330 0.0256 2.5879
HIPREM -13.0783 6.7196 -1.9460 0.0516 2.1925 Characteristics in Numerator of Prob[Y = 1] 100/0 33%
AGE 0.3775 0.2138 1.7650 0.0775 45.9767 NW 0.4762 0.3264 1.4590 0.1445 2.9535
OHIB 23.5688 9.4566 2.4920 0.0127 1.9419 HCS 1.6518 0.7299 2.2630 0.0236 3.4186
HIDED -5.4716 1.9576 -2.7950 0.0052 2.3592 HIDRUG -1.1062 1.4639 -0.7560 0.4499 2.6990
HICOPAY -4.4161 1.5941 -2.7700 0.0056 2.4380 HITYPE 2.8626 1.3353 2.1440 0.0321 2.5879
HIPREM -12.9881 6.7219 -1.9320 0.0533 2.1925 Percent Correct Predicted=55.29%
25

Table 5: Holistic Insurance Multinomial Logit Model Results
Chi Squared 889.0262 McFadden R2 0.42937 Degrees of Freedom 42 Percent Correct Predicted=65.11 Variable Coefficient Standard Error b/St.Er. P[|Z|>z] Mean of X
Characteristics in Numerator of Prob[Y = 1] AGR 16% AGE -0.0077 0.0134 -0.5730 0.5664 45.9767
DEPEND 0.1874 0.0850 2.2050 0.0275 2.2326 FTW -0.5881 0.1891 -3.1100 0.0019 1.6279 NW -0.0228 0.1417 -0.1610 0.8721 2.9535
NFPEI -1.5368 0.8987 -1.7100 0.0873 1.9186 HCS 0.1515 0.1236 1.2260 0.2203 3.4186
OHIB 5.9576 1.2531 4.7540 0.0000 1.9419 SHIB 0.8827 0.3860 2.2870 0.0222 1.6744 SHP -0.8897 0.3892 -2.2860 0.0222 1.7442 EDU 0.9606 0.1847 5.2000 0.0000 2.3372 SIZE -0.0996 0.1541 -0.6460 0.5180 3.5814
COCL 0.0757 0.2411 0.3140 0.7536 2.8876 COSS -1.1323 0.2276 -4.9740 0.0000 2.6512
COGRP -0.8742 0.2925 -2.9890 0.0028 2.6925 COPREM -1.8341 0.3087 -5.9410 0.0000 2.4935
Characteristics in Numerator of Prob[Y = 2] RA 27% AGE -0.0078 0.0121 -0.6480 0.5168 45.9767
DEPEND 0.2456 0.0749 3.2780 0.0010 2.2326 FTW -0.6705 0.1658 -4.0430 0.0001 1.6279 NW 0.0594 0.1256 0.4730 0.6361 2.9535
NFPEI -0.7794 0.8809 -0.8850 0.3762 1.9186 HCS 0.0814 0.1175 0.6930 0.4882 3.4186
OHIB 4.9322 1.0576 4.6630 0.0000 1.9419 SHIB 1.3208 0.3767 3.5060 0.0005 1.6744 SHP -0.5097 0.3114 -1.6370 0.1016 1.7442 EDU 0.4459 0.1308 3.4100 0.0007 2.3372 SIZE 0.2111 0.1482 1.4240 0.1544 3.5814
COCL -0.1034 0.2375 -0.4350 0.6633 2.8876 COSS -1.0485 0.2091 -5.0130 0.0000 2.6512
COGRP -0.8526 0.2884 -2.9560 0.0031 2.6925 COPREM -1.7833 0.2990 -5.9650 0.0000 2.4935
Characteristics in Numerator of Prob[Y = 3] MPCI 20% AGE -0.0105 0.0130 -0.8120 0.4169 45.9767
DEPEND 0.1709 0.0861 1.9860 0.0471 2.2326 FTW -0.3198 0.1924 -1.6620 0.0965 1.6279 NW 0.1107 0.1467 0.7550 0.4504 2.9535
NFPEI -0.4396 0.9792 -0.4490 0.6535 1.9186 HCS 0.1396 0.1287 1.0850 0.2778 3.4186
OHIB 4.8458 1.2721 3.8090 0.0001 1.9419 SHIB 0.5033 0.3900 1.2900 0.1969 1.6744 SHP -0.5023 0.3233 -1.5530 0.1204 1.7442 EDU 0.6359 0.1436 4.4290 0.0000 2.3372 SIZE 0.0397 0.1693 0.2350 0.8145 3.5814
COCL -0.1715 0.2499 -0.6860 0.4926 2.8876 COSS -1.0125 0.2306 -4.3900 0.0000 2.6512
COGRP -0.6069 0.3087 -1.9660 0.0493 2.6925 COPREM -1.9623 0.3316 -5.9180 0.0000 2.4935
26