using data and performance based contracting to drive
TRANSCRIPT
Using Data and Performance Based Contracting to Drive Practice
Change for Children and Youth in Residential Care in Illinois
National Child Welfare Evaluation Summit
Washington, DC August 29, 2011
Panelists
Erwin McEwen, Director, Illinois DCFS
Brice Bloom-Ellis, Statewide Residential Quality Assurance Manager, Illinois DCFS
Mary Hollie, CEO, Lawrence Hall Youth Services
Judge Kathleen A. Kearney, Children & Family Research Center, University of Illinois

Topics Covered
Project overview
Collaborative planning process
Outcome measures
Risk adjustment model
Results
Lessons learned from implementation
History of Performance Based Contracting (PBC) in Illinois
Began in 1997 with foster care case management
Objectives included:
Reduce the # of children in substitute care through improved permanency
Improved stability of placement
Align performance incentives with desired outcomes
Credited with right sizing and reforming Illinois child welfare system
Developed predominantly by DCFS with little, if any, private sector involvement
No formal evaluation was ever done

Striving for Excellence: Can PBC make a difference in residential care?
Expands Illinois’ PBC to residential treatment, Independent Living and Transitional Living Programs
Grant from the National Quality Improvement Center on the Privatization of Child Welfare Services (QIC PCW) to document and evaluate how it is done
Ever Increasing Challenges
Fewer youth in residential care overall, but
greater proportion referred to residential care with histories reflecting severe psychiatric
and behavioral problems
High concentration of
extraordinarily challenging youth

Collaborative Planning
Existing Child Welfare Advisory Committee (CWAC) structure used to develop proposed outcome measures, fiscal structure and risk adjustment strategy
Child Care Association of Illinois holds Statewide Provider Forums to inform all private providers and get feedback
Illinois Child Welfare Data Summits held by Children & Family Research Center to engage university partners and researchers

ILLINOIS CHILD WELFARE ADVISORY COMMITTEE Organizational Structure CWAC Full Committee
Co-Chairs DCFS Director Private Agency Director
21 Members- POS Directors/Representatives/Public Guardian/Foster Parent
Steering Committee
Co-Chairs of Committee and each sub-committee and CCAI Director
Sub-Committees Co-chairs
DCFS Deputy Co-Chairs Private Agency Representative
Foster Care Infrastructure Comprehensive High End Services In-Home/Front End Services Older Adolescents/ILO Education
Finance and Administration Training Public Awareness SACWIS Ad Hoc as Needed (e.g. CFSR Planning)
Work groups assigned by Sub-Committees As Needed
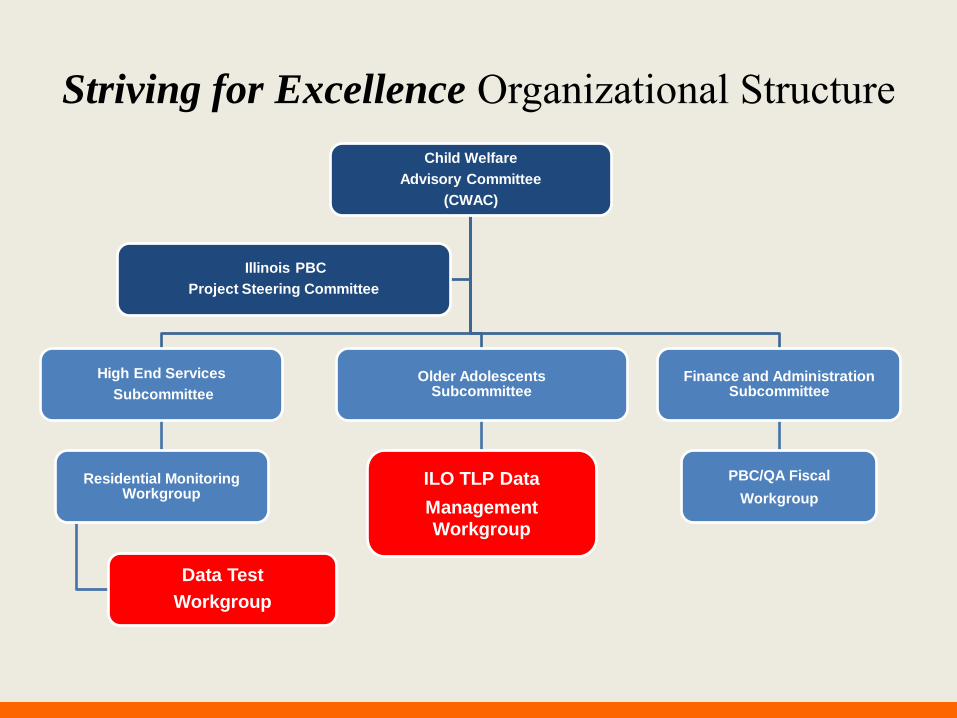
Striving for Excellence Organizational Structure Child Welfare
Advisory Committee
(CWAC)
Illinois PBC
Project Steering Committee
High End Services
Subcommittee Older Adolescents
Subcommittee Finance and Administration
Subcommittee
Residential Monitoring Workgroup
ILO TLP Data
Management Workgroup
PBC/QA Fiscal
Workgroup
Data Test
Workgroup
Collaboration & Communication Were Essential
■ 500+ collaborative meetings of since project inception with no end in sight!
■ Agency commitment to let staff travel to and participate on subcommittees & workgroups
■ Conference call capability for all meetings so those who cannot attend in person could participate
■ Performance measures continue to be refined through public/private partnership using the CWAC structure
■ Statewide Provider Forums, D-Net, provider list serve, informal monthly Residential Provider Group, and CCAI Monday Report
used as communication tools
First things first…
Getting the right service, at the right time, for the right price, for the best results
Importance of standardizing the rates first
Prior to PBC, rates were set using an individualized cost based rate methodology
Different levels of care with different staffing patterns needed to be considered
Staffing may be dependent on site specific issues, e.g. a cottage model versus a unit model
100% bed guarantee for providers
No decline policy instituted

The Numbers Involved: FY 2012
1,296 children & youth in residential treatment (institutional and group home care) out of 15,404 in substitute care
39 agencies/79 contracts
FY12 expenditures on residential treatment anticipated to account for approx. 30% of the Dept’s $591M substitute care budget

Residential Performance Measures
Goal 1: Improve Safety/Stability
During Treatment
Indicator:
* Treatment Opportunity Days Rate
Goal 2: Effectively and Efficiently
Reduce Symptoms/ Increase Functionality
Goal 3: Improve Outcomes At
And Following Discharge
(Original) Indicators: Immediate Discharge Disposition
Sustained Positive Discharge Length of Stay
Indicator:
* Sustained Favorable Discharge Rate

Treatment Opportunity Days Rate
Percentage of time in treatment during a residential stay (spell) at a facility where the child/youth is not on the run, in detention or in a psychiatric hospital
Active Days
_______________________________________________
Active Days + Interruption Days
Sustained Favorable Discharge Rate
Percentage of total residential spells resulting in sustained favorable discharges during fiscal year
“Favorable” = positive step-down to less restrictive setting or a neutral discharge in a chronic setting (e.g. mental health or DD)
“Sustained” = remain in discharge placement for 180 days or more
“Unfavorable” = negative step-up to a more restrictive setting, disrupted placement, or lateral move to another residential facility or group home
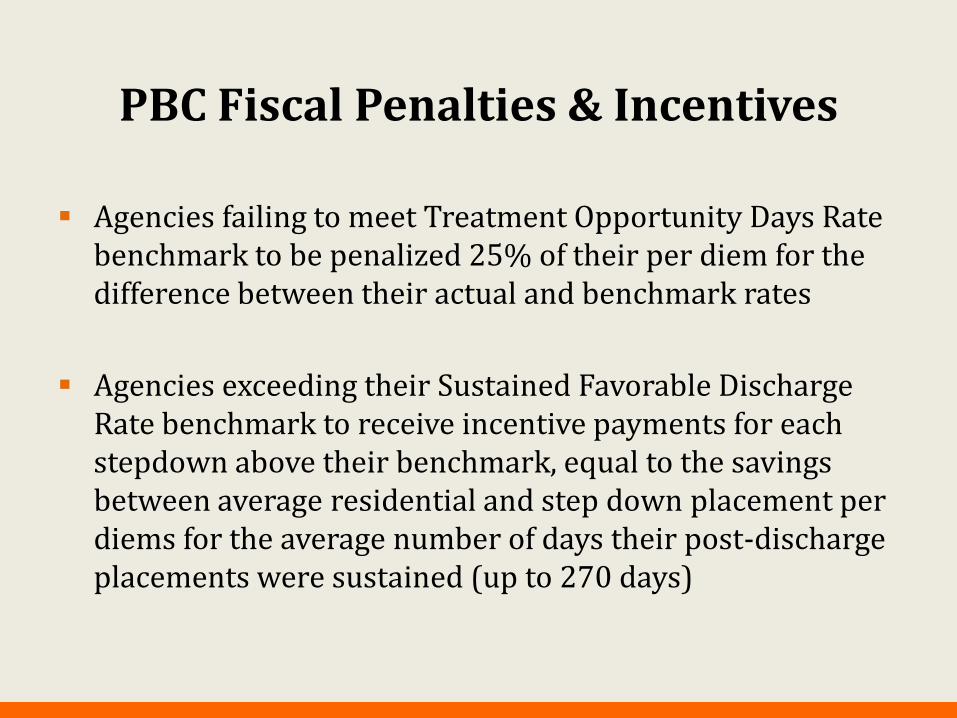
PBC Fiscal Penalties & Incentives
Agencies failing to meet Treatment Opportunity Days Rate benchmark to be penalized 25% of their per diem for the difference between their actual and benchmark rates
Agencies exceeding their Sustained Favorable Discharge Rate benchmark to receive incentive payments for each stepdown above their benchmark, equal to the savings between average residential and step down placement per diems for the average number of days their post-discharge placements were sustained (up to 270 days)
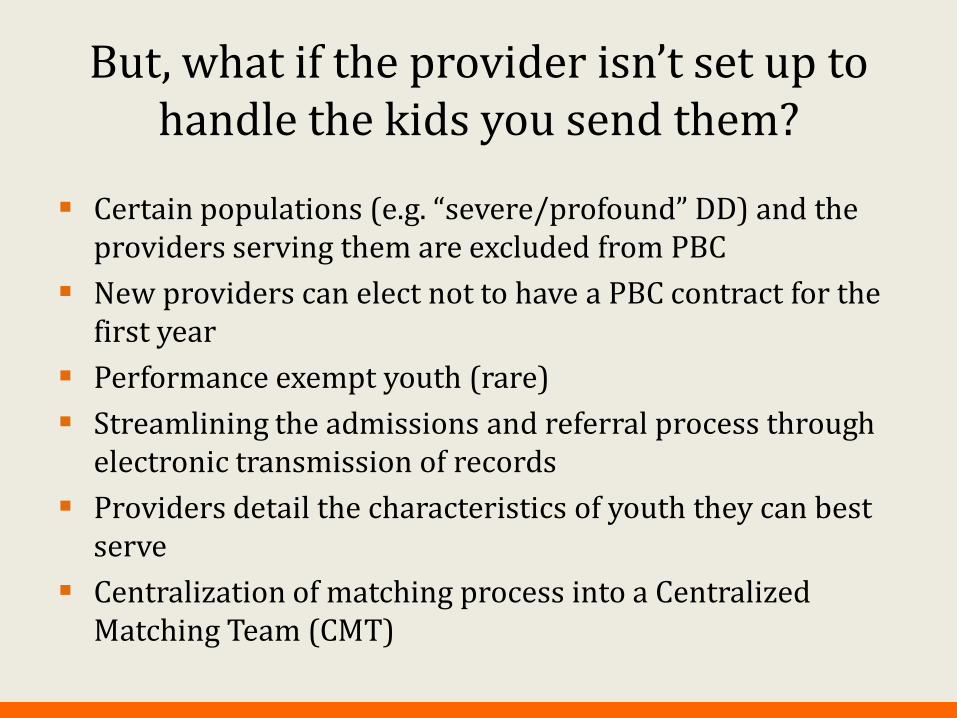
But, what if the provider isn’t set up to handle the kids you send them?
Certain populations (e.g. “severe/profound” DD) and the providers serving them are excluded from PBC
New providers can elect not to have a PBC contract for the first year
Performance exempt youth (rare)
Streamlining the admissions and referral process through electronic transmission of records
Providers detail the characteristics of youth they can best serve
Centralization of matching process into a Centralized Matching Team (CMT)

“How can you compare
my agency with others when I have the harder
to serve kids?”
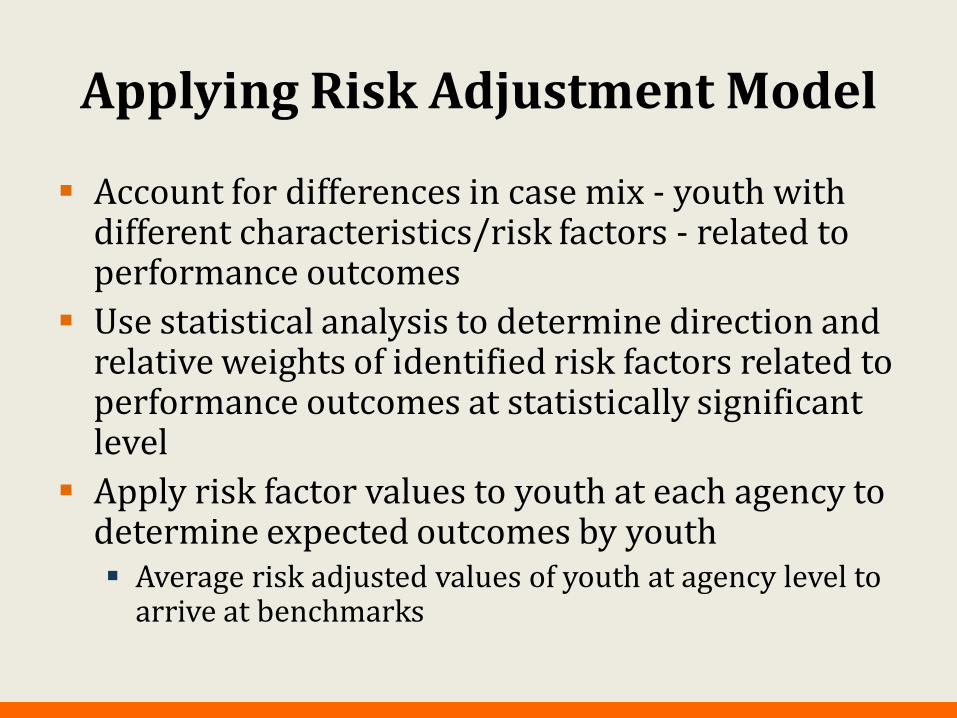
Applying Risk Adjustment Model
Account for differences in case mix - youth with different characteristics/risk factors - related to performance outcomes
Use statistical analysis to determine direction and relative weights of identified risk factors related to performance outcomes at statistically significant level
Apply risk factor values to youth at each agency to determine expected outcomes by youth Average risk adjusted values of youth at agency level to
arrive at benchmarks
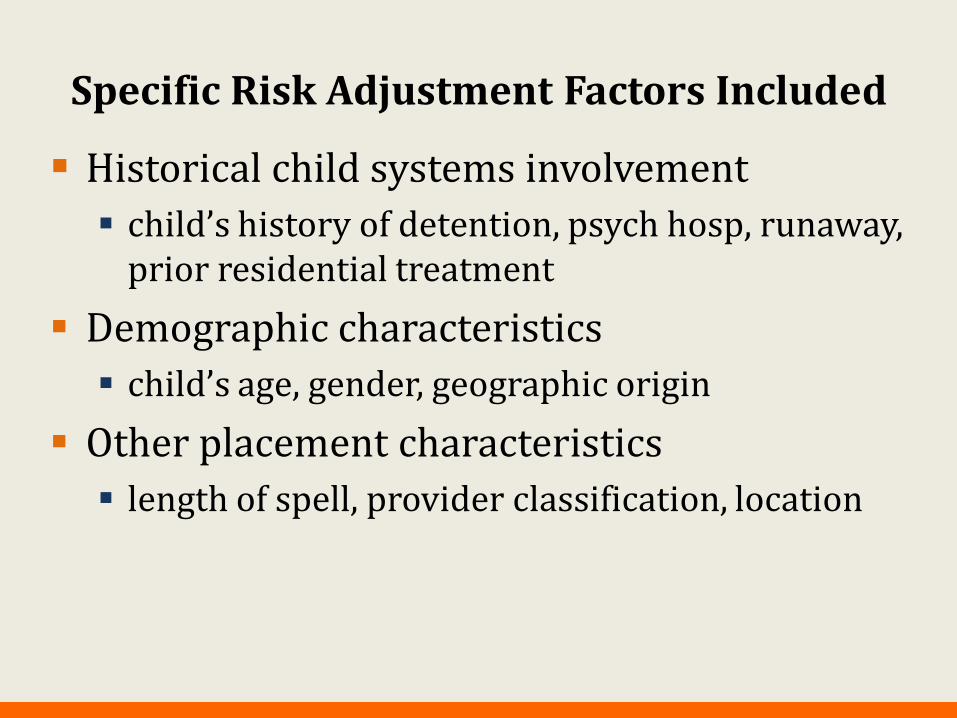
Specific Risk Adjustment Factors Included
Historical child systems involvement
child’s history of detention, psych hosp, runaway, prior residential treatment
Demographic characteristics
child’s age, gender, geographic origin
Other placement characteristics
length of spell, provider classification, location
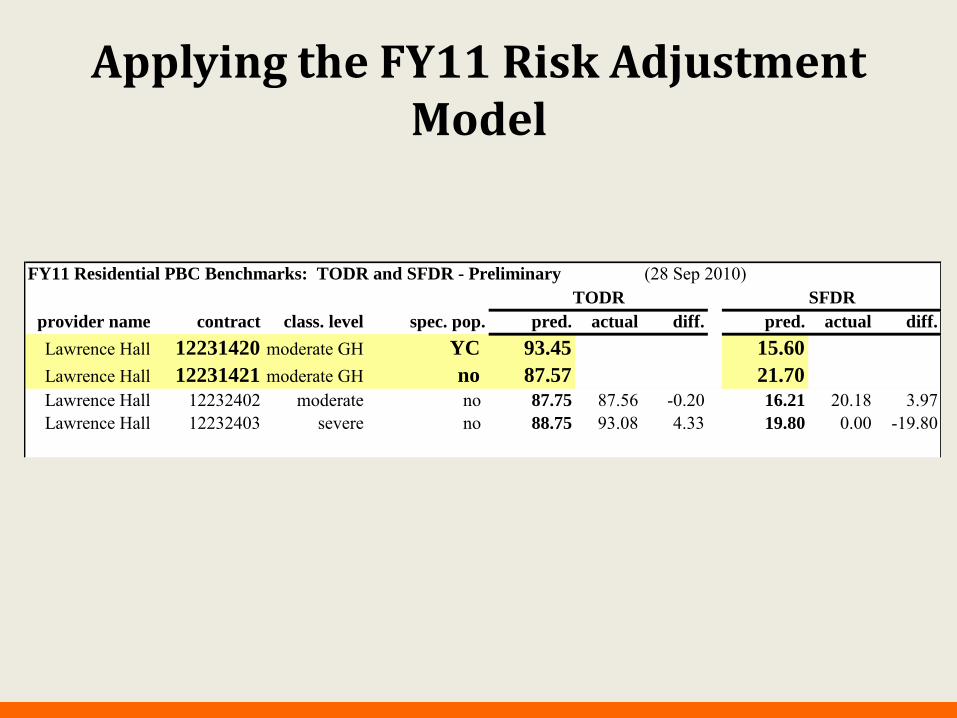
Applying the FY11 Risk Adjustment Model
FY11 Residential PBC Benchmarks: TODR and SFDR - Preliminary (28 Sep 2010)TODR SFDR
provider name contract class. level spec. pop. pred. actual diff. pred. actual diff.
Lawrence Hall 12231420 moderate GH YC 93.45 15.60
Lawrence Hall 12231421 moderate GH no 87.57 21.70
Lawrence Hall 12232402 moderate no 87.75 87.56 -0.20 16.21 20.18 3.97Lawrence Hall 12232403 severe no 88.75 93.08 4.33 19.80 0.00 -19.80
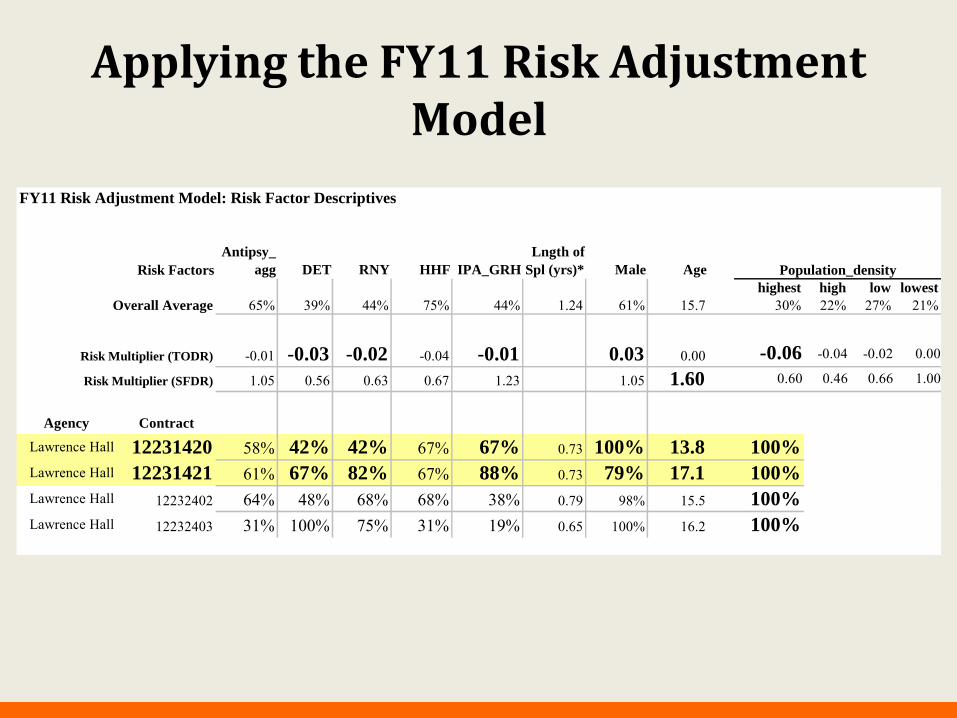
Applying the FY11 Risk Adjustment Model
FY11 Risk Adjustment Model: Risk Factor Descriptives
Antipsy_
agg
Lngth of
Spl (yrs)*Risk Factors DET RNY HHF IPA_GRH Male Age
Overall Average 65% 39% 44% 75% 44% 1.24 61% 15.7
Risk Multiplier (TODR) -0.01 -0.03 -0.02 -0.04 -0.01 0.03 0.00
Risk Multiplier (SFDR) 1.05 0.56 0.63 0.67 1.23 1.05 1.60
Population_density
highest
30%high
22%low
27%lowest
21%
-0.06 -0.04 -0.02 0.00
0.60 0.46 0.66 1.00
Agency Contract
Lawrence Hall 12231420 58% 42% 42% 67% 67% 0.73 100% 13.8 100%
Lawrence Hall 12231421 61% 67% 82% 67% 88% 0.73 79% 17.1 100%
Lawrence Hall 12232402 64% 48% 68% 68% 38% 0.79 98% 15.5 100%
Lawrence Hall 12232403 31% 100% 75% 31% 19% 0.65 100% 16.2 100%
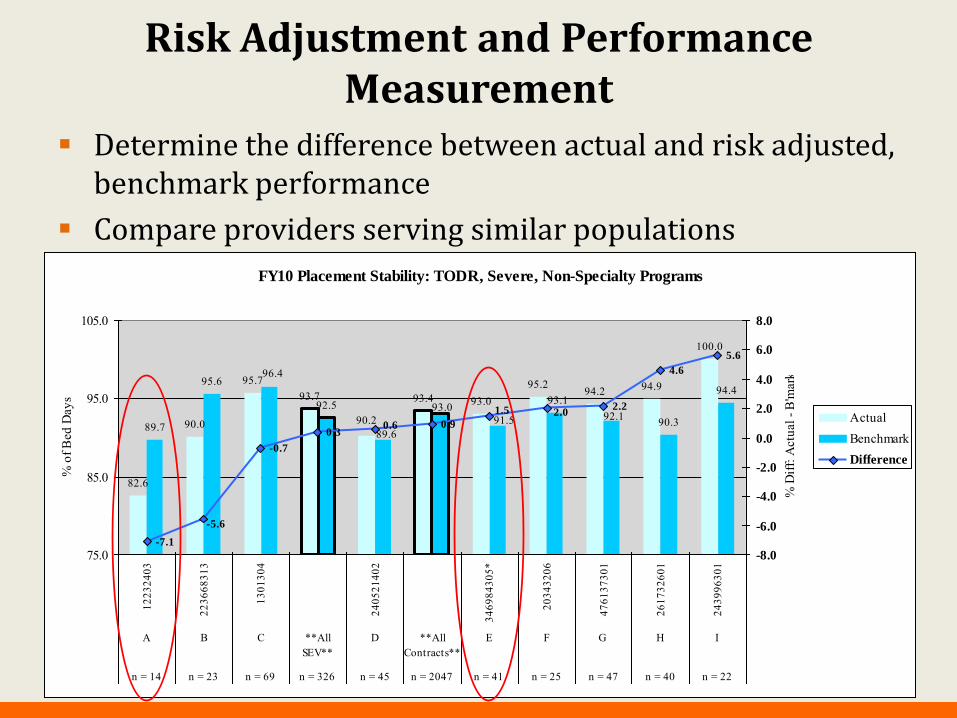
Risk Adjustment and Performance Measurement
Determine the difference between actual and risk adjusted, benchmark performance
Compare providers serving similar populations
FY10 Placement Stability: TODR, Severe, Non-Specialty Programs
82.6
90.0
95.793.7 93.4 93.0
95.2 94.2 94.9
100.0
89.7
95.6
92.590.3
94.4
90.2
96.4
92.191.593.0
89.6
93.1
-7.1
-0.7
0.30.9
2.2
4.6
5.6
2.0
0.6
1.5
-5.6
75.0
85.0
95.0
105.0
1223
2403
2236
6831
3
1301
304
2405
2140
2
3469
8430
5*
2034
3206
4761
3730
1
2617
3260
1
2439
9630
1
A B C **AllSEV**
D **AllContracts**
E F G H I
n = 14 n = 23 n = 69 n = 326 n = 45 n = 2047 n = 41 n = 25 n = 47 n = 40 n = 22
% o
f Bed
Day
s
8.0
6.0
4.0
2.0
0.0
-2.0
-4.0
-6.0
-8.0
% D
iff: A
ctua
l - B
'mar
k
ActualBenchmarkDifference

Risk Adjustment and Performance Measurement
FY10 Placement Stability: % Absence Days by Type, Severe, Non-Specialty Programs
8.2 2.6 4.6 3.7 2.6 4.40.00.9
5.2 4.7
9.4
0.0
1.21.8 0.11.9
1.3
0.1
0.9
0.0
1.1
12.2
0.0
0.2 0.30.4
0.3
0.3
0.6
0.8
1.8
1.0
4.3
0.0
2.0
4.0
6.0
8.0
10.0
12.0
14.0
16.0
18.0
20.0
12232403 223668313 1301304 240521402 346984305* 20343206 476137301 261732601 243996301
A B C **All SEV** D **AllContracts**
E F G H I
n = 14 n = 23 n = 69 n = 326 n = 45 n = 2047 n = 41 n = 25 n = 47 n = 40 n = 22
% o
f Bed
Day
s
DETRNYHHF
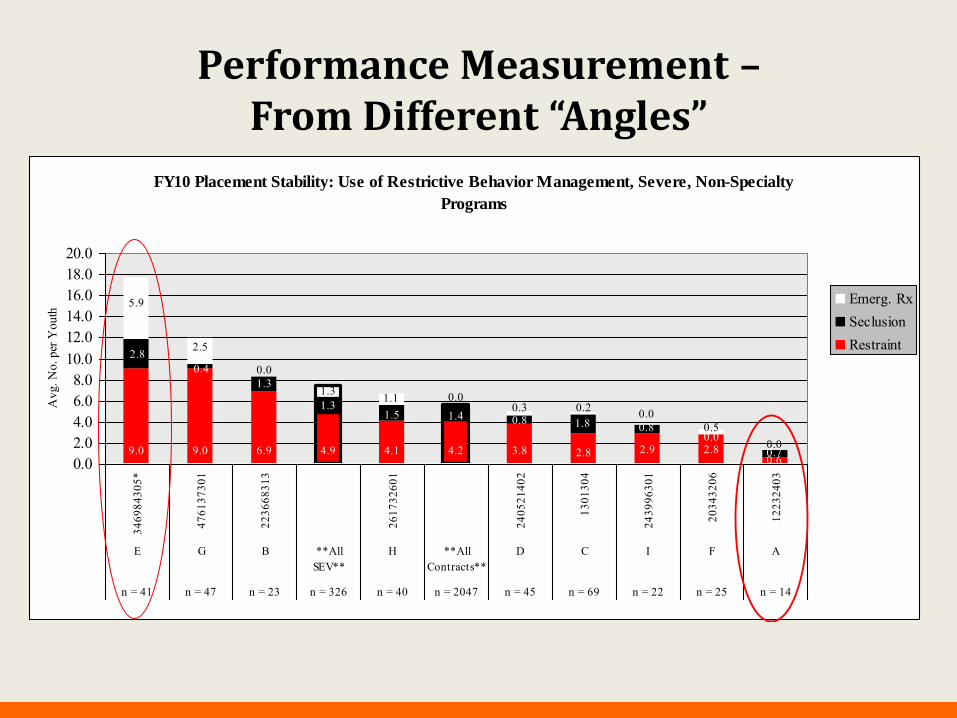
Performance Measurement – From Different “Angles”
FY10 Placement Stability: Use of Restrictive Behavior Management, Severe, Non-Specialty
Programs
9.0 9.0 6.9 4.9 4.1 3.84.2 2.82.92.8 0.60.7
0.8
1.3
0.01.80.8
1.3
2.80.4
1.41.5
0.00.5
0.00.20.3
5.9
0.01.1
2.5
0.0
1.3
0.02.04.06.08.0
10.012.014.016.018.020.0
3469
8430
5*
4761
3730
1
2236
6831
3
2617
3260
1
2405
2140
2
1301
304
2439
9630
1
2034
3206
1223
2403
E G B **AllSEV**
H **AllContracts**
D C I F A
n = 41 n = 47 n = 23 n = 326 n = 40 n = 2047 n = 45 n = 69 n = 22 n = 25 n = 14
Avg
. No.
per
You
th
Emerg. RxSeclusionRestraint

So, what happened?
Did overall system performance improve?
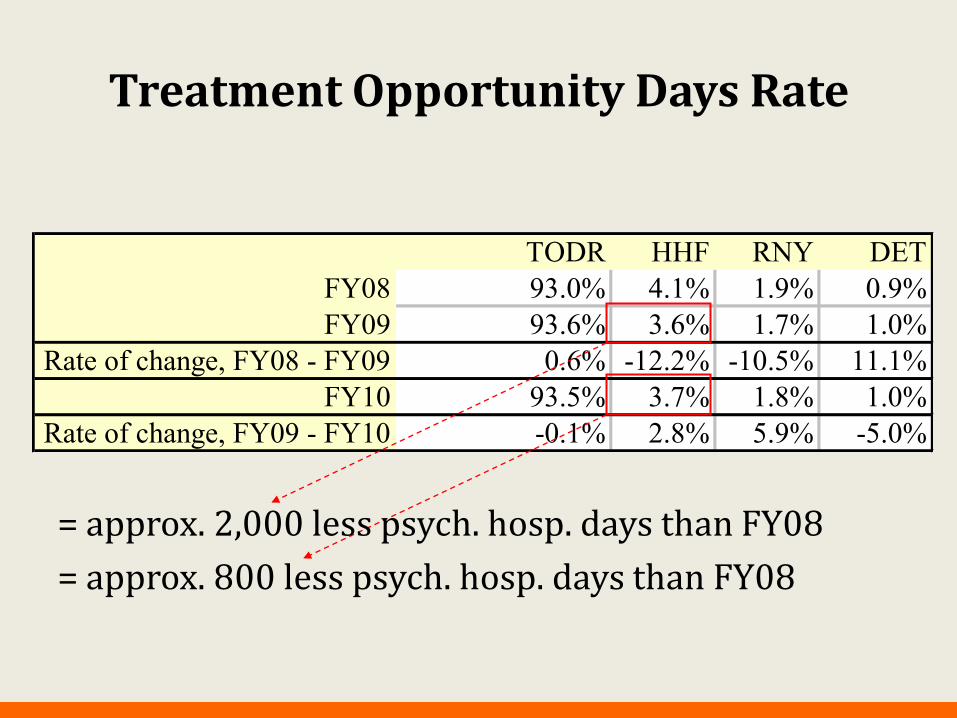
Treatment Opportunity Days Rate
=
=
TODR HHF RNY DETFY08 93.0% 4.1% 1.9% 0.9%FY09 93.6% 3.6% 1.7% 1.0%
Rate of change, FY08 - FY09 0.6% -12.2% -10.5% 11.1%FY10 93.5% 3.7% 1.8% 1.0%
Rate of change, FY09 - FY10 -0.1% 2.8% 5.9% -5.0%
approx. 2,000 less psych. hosp. days than FY08
approx. 800 less psych. hosp. days than FY08
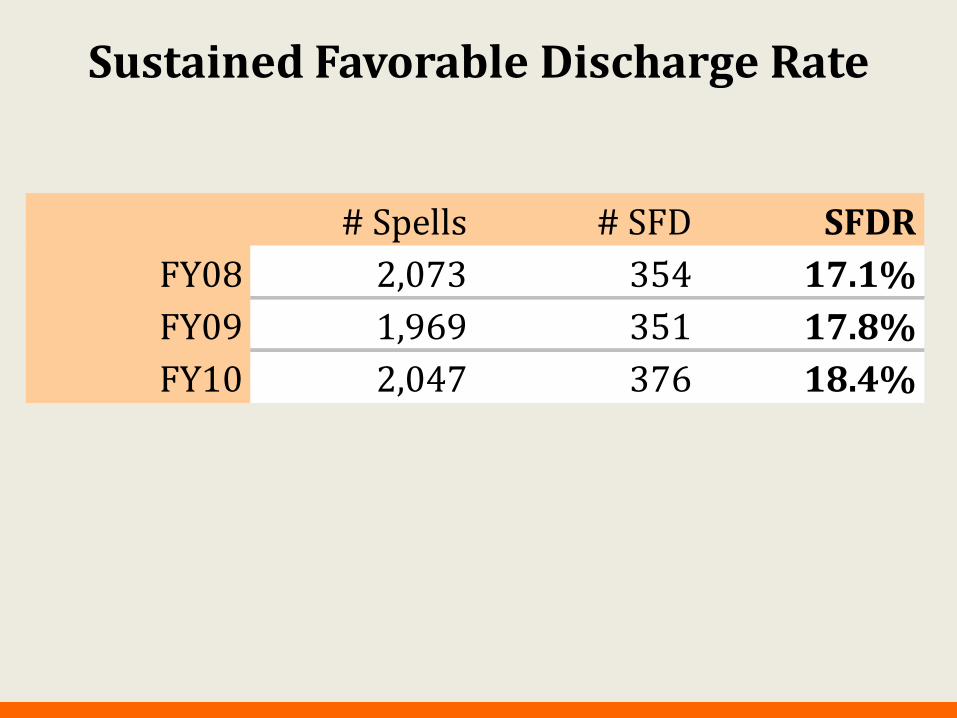
Sustained Favorable Discharge Rate
# Spells # SFD SFDR
FY08 2,073 354 17.1%
FY09 1,969 351 17.8%
FY10 2,047 376 18.4%
Once implemented initially, did the outcome measures and
program features evolve over time to ensure
continued success?

Residential Performance Fiscal Penalties and Incentives
Agencies that fell below their FY09 Treatment Opportunity Days benchmark were penalized 24 of 41 agencies penalized for a total of $712,033
The median penalty was $23,915.
Agencies that exceeded their FY09 Sustained Favorable Discharge Rate benchmark received incentive payments 21 of 41 agencies received payments for a total of $3,155,904
The median incentive payment was $115,254.
During FY11 the State of Illinois fiscal crisis required the Dept. to suspend fiscal penalties and incentives beginning with FY10 performance results
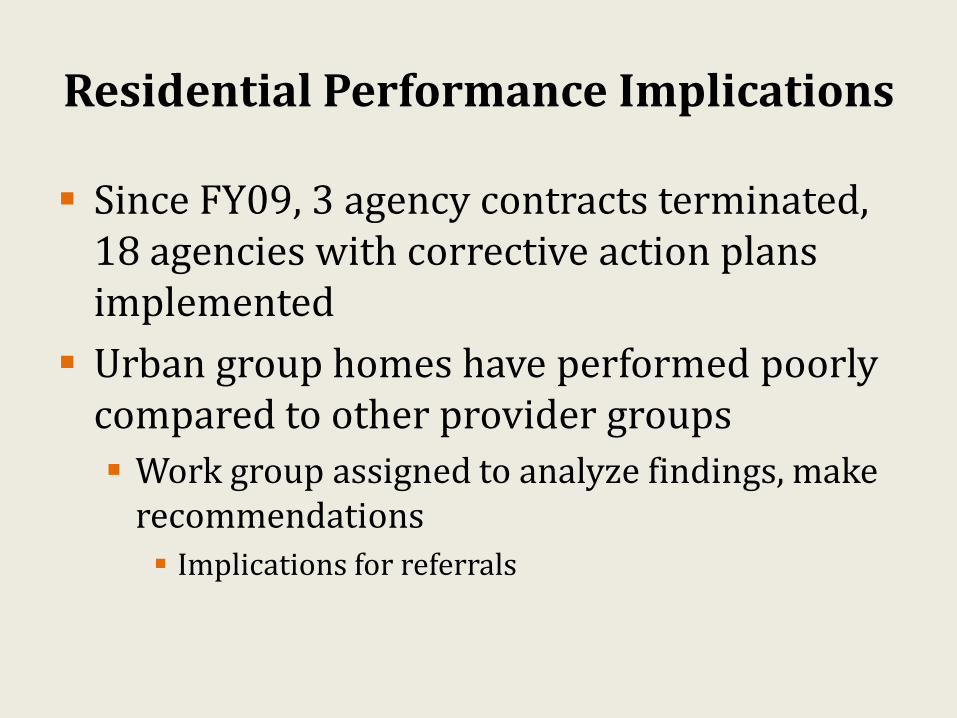
Residential Performance Implications
Since FY09, 3 agency contracts terminated, 18 agencies with corrective action plans implemented
Urban group homes have performed poorly compared to other provider groups
Work group assigned to analyze findings, make recommendations
Implications for referrals
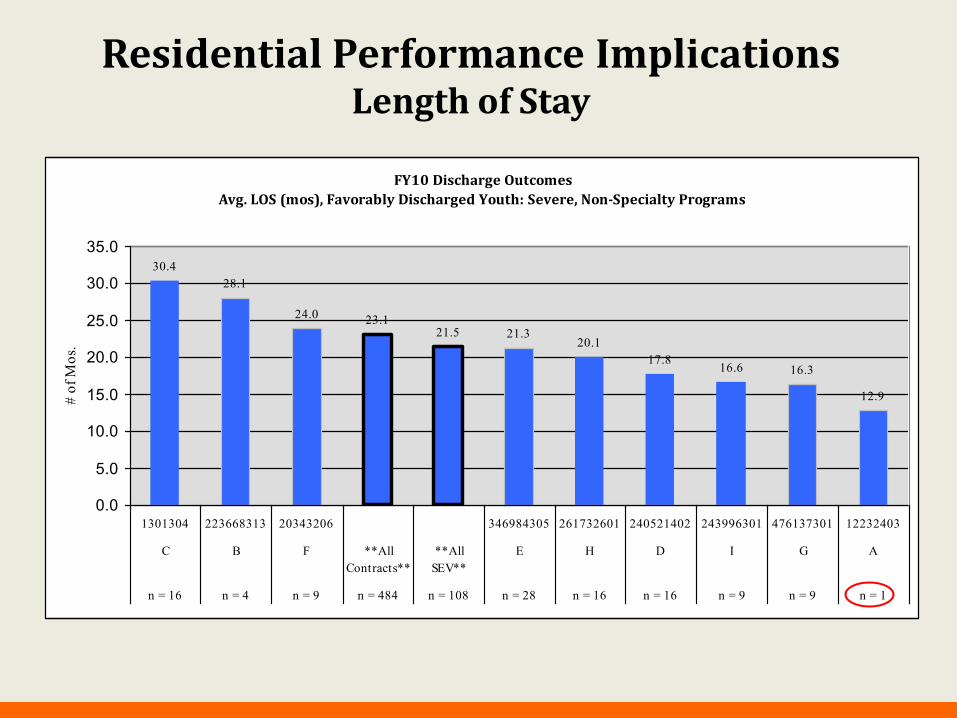
Residential Performance Implications Length of Stay
FY10 Discharge Outcomes
Avg. LOS (mos), Favorably Discharged Youth: Severe, Non-Specialty Programs
30.428.1
24.0 23.121.5 21.3
20.117.8 16.6 16.3
12.9
0.0
5.0
10.0
15.0
20.0
25.0
30.0
35.0
1301304 223668313 20343206 346984305 261732601 240521402 243996301 476137301 12232403
C B F **AllContracts**
**AllSEV**
E H D I G A
n = 16 n = 4 n = 9 n = 484 n = 108 n = 28 n = 16 n = 16 n = 9 n = 9 n = 1
# of
Mos
.

FY11 PBC Changes
Use risk adjustment to raise expectations for reduced length of stay
– Change length of spell risk factor
• More accurately reflect probability of sustained favorable discharge
– Apply multiplier to length of spell risk factor
• Increase expectations across all providers
Improve accuracy of performance evaluation
– Issue preliminary, final benchmarks
• Based on population in residence at beginning and end of FY

Residential Performance Implications Placement with Family / Achieving Permanency
FY10 Favorable Discharge Rates by Discharge Destination
Severe, Non-Specialty Programs
7.1 4.3 6.4 7.2 9.0 9.22.2
20.0 17.5 13.6 9.80.0
0.06.4
11.6 9.1 8.3
2.2
8.05.0
0.0
26.8
0.013.0
6.44.3 5.6
15.631.1
8.0 17.527.3
31.7
0.0
10.0
20.0
30.0
40.0
50.0
60.0
70.0
80.0
12232403 223668313 476137301 1301304 240521402 20343206 261732601 243996301 346984305
A B G C **AllContracts**
**AllSEV**
D F H I E
n = 14 n = 23 n = 47 n = 69 n = 2047 n = 326 n = 45 n = 25 n = 40 n = 22 n = 41
% o
f S
pell
s
FDR_I/GH
FDR_Other
FDR_Family
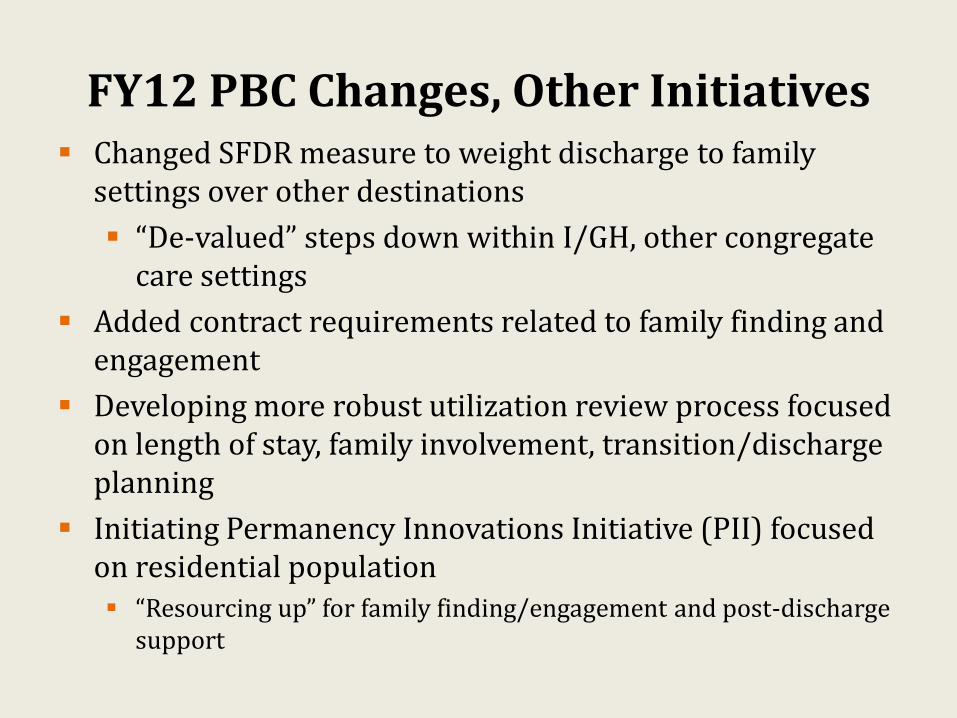
FY12 PBC Changes, Other Initiatives Changed SFDR measure to weight discharge to family
settings over other destinations
“De-valued” steps down within I/GH, other congregate care settings
Added contract requirements related to family finding and engagement
Developing more robust utilization review process focused on length of stay, family involvement, transition/discharge planning
Initiating Permanency Innovations Initiative (PII) focused on residential population “Resourcing up” for family finding/engagement and post-discharge
support
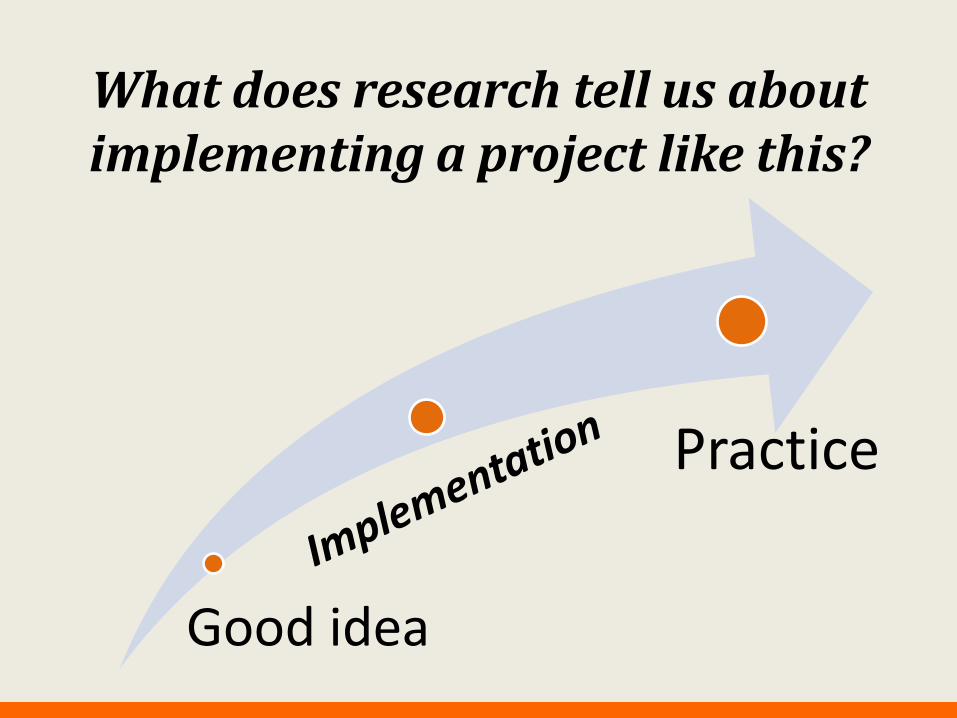
What does research tell us about implementing a project like this?
Good idea
Practice

Stages of Implementation
Exploration
Installation
Initial Implementation
Full Implementation
Innovation
Sustainability
2 – 4 Years
Fixsen, Naoom, Blase, Friedman, & Wallace, 2005

Implementation Drivers Recruitment and Selection of Staff
Training
Supervision and Coaching
Staff Performance Evaluation
Program Evaluation and
Fidelity
Administrative & Data Supports
External Systems Interventions

Key Elements Supporting Organizational Change
Commitment of leadership to the implementation process
Involvement of stakeholders in planning and selection of programs to implement
Creation of an implementation task force made up of consumers and stakeholders
Suggestions for “unfreezing” current organizational practices
Resources for extra costs, effort, equipment, manuals, materials, recruiting, access to expertise, re-training for new organizational roles
Alignment of organizational structures to integrate staff selection, training, performance evaluation
Alignment of organizational structures to achieve horizontal and vertical integration
Commitment of on-going resources and support

Implementation Case Studies Mixed methods including:
Performance on PBC outcome measures
On site facility visit
Implementation survey of frontline, supervisory, clinical and administrative staff on implementation drivers (78 items)
Separate implementation focus groups of frontline, supervisory/clinical, administrative staff (15 questions) on implementation drivers, practice changes, strategies to achieve benchmarks
Document review
QIC PCW frontline staff and QA surveys if completed by the agency
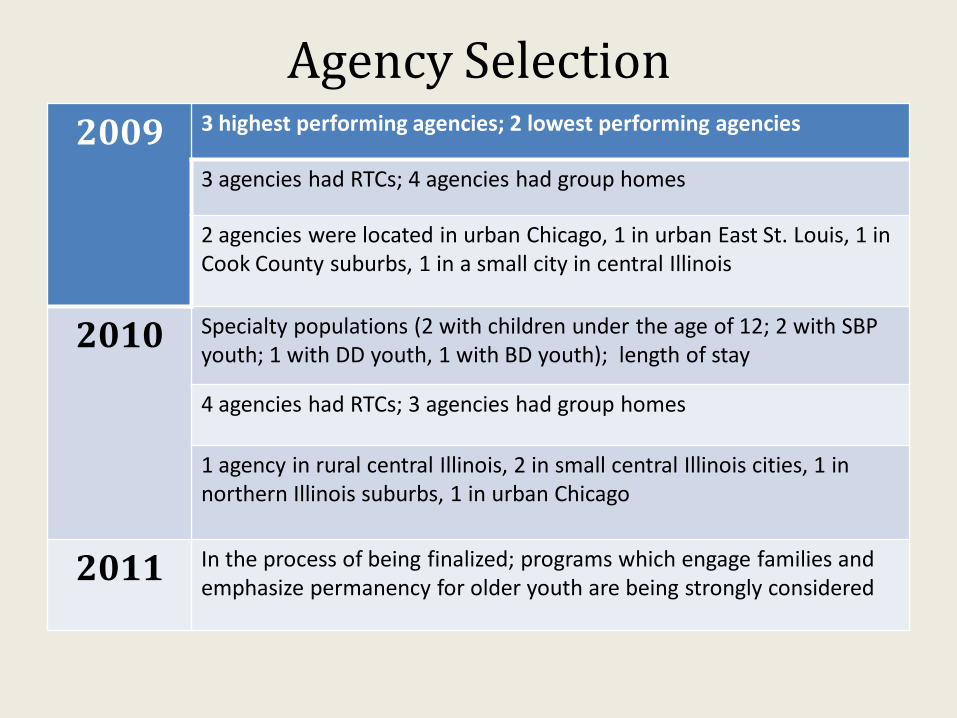
Agency Selection 2009 3 highest performing agencies; 2 lowest performing agencies
3 agencies had RTCs; 4 agencies had group homes
2 agencies were located in urban Chicago, 1 in urban East St. Louis, 1 in Cook County suburbs, 1 in a small city in central Illinois
2010 Specialty populations (2 with children under the age of 12; 2 with SBP youth; 1 with DD youth, 1 with BD youth); length of stay
4 agencies had RTCs; 3 agencies had group homes
1 agency in rural central Illinois, 2 in small central Illinois cities, 1 in northern Illinois suburbs, 1 in urban Chicago
2011 In the process of being finalized; programs which engage families and emphasize permanency for older youth are being strongly considered
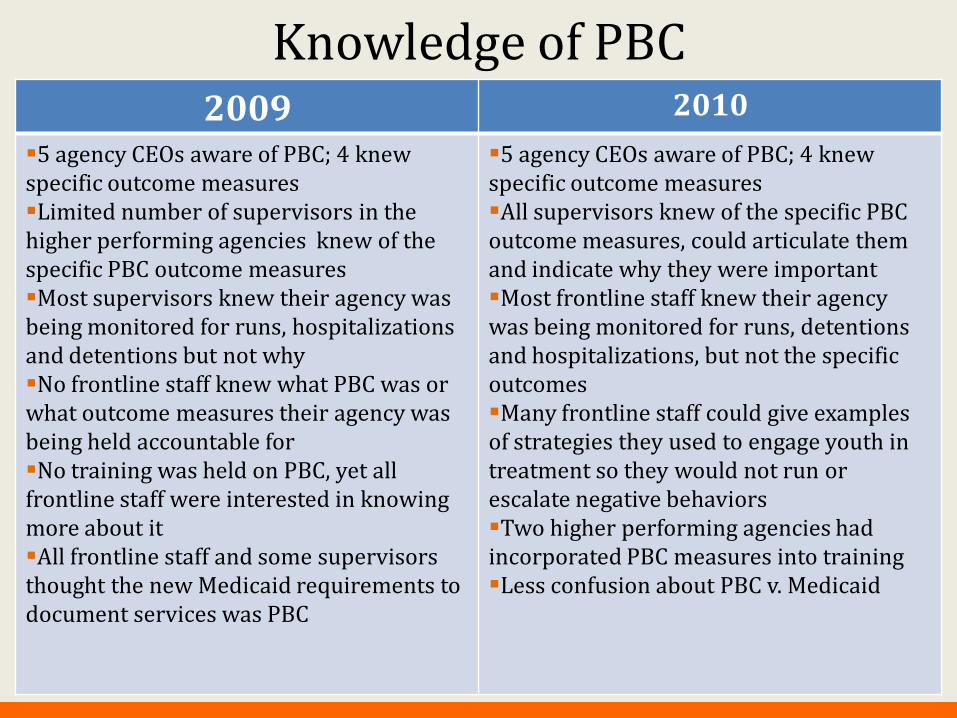
Knowledge of PBC 2009
5 agency CEOs aware of PBC; 4 knew specific outcome measuresLimited number of supervisors in the higher performing agencies knew of the specific PBC outcome measuresMost supervisors knew their agency was being monitored for runs, hospitalizations and detentions but not whyNo frontline staff knew what PBC was or what outcome measures their agency was being held accountable forNo training was held on PBC, yet all frontline staff were interested in knowing more about itAll frontline staff and some supervisors thought the new Medicaid requirements to document services was PBC
5 agency CEOs aware of PBC; 4 knew specific outcome measures
2010
All supervisors knew of the specific PBC outcome measures, could articulate them and indicate why they were importantMost frontline staff knew their agency was being monitored for runs, detentions and hospitalizations, but not the specific outcomesMany frontline staff could give examples of strategies they used to engage youth in treatment so they would not run or escalate negative behaviorsTwo higher performing agencies had incorporated PBC measures into trainingLess confusion about PBC v. Medicaid

Staffing & Supervision
2009 None of the 5 agencies changed staff hiring qualifications or performance expectations as a result of PBC None of the 5 agencies changed supervisory protocols; 1 agency changed its supervision model to one of group supervision which helped with unexpectedly with TODR None of the 5 agencies utilized coaching to help frontline staff engage youth 1 of the 5 agencies created new recreational therapist positions to engage youth to in treatment
None of the 5 agencies changed staff hiring qualifications for PBC 1 agency changed performance expectations to include active engagement of youth in treatment
2010
1 agency changed supervisory protocol to include heightened scrutiny on the ability of staff to engage youth None of the 5 agencies utilized coaching 1 agency created new post discharge coordinator positions to enhance stability of youth after step-down

Decision Support Systems
2009
Only 1 of the 5 agencies had included the PBC measures into their QA monitoring protocols Only 1 of the 5 agencies had developed a system to track fiscal implications None of the 5 agencies had infused PBC related QA activities at the frontline level In 1 agency the frontline staff themselves started to track youth’s escalating behaviors as a means to prevent runs QA staff in all of the agencies were hampered by Medicaid changes which required their full time attention
4 of the 5 agencies had included the PBC measures into their QA monitoring protocols
2010
3 of the 5 agencies had developed systems to track fiscal implications 2 of the 5 agencies had infused QA activities at the frontline level 1 agency had well written QA protocols and tracking mechanisms on paper, but no frontline staff or supervisor was aware of them Medicaid changes were still involving a substantial portion of QA staff time and effort
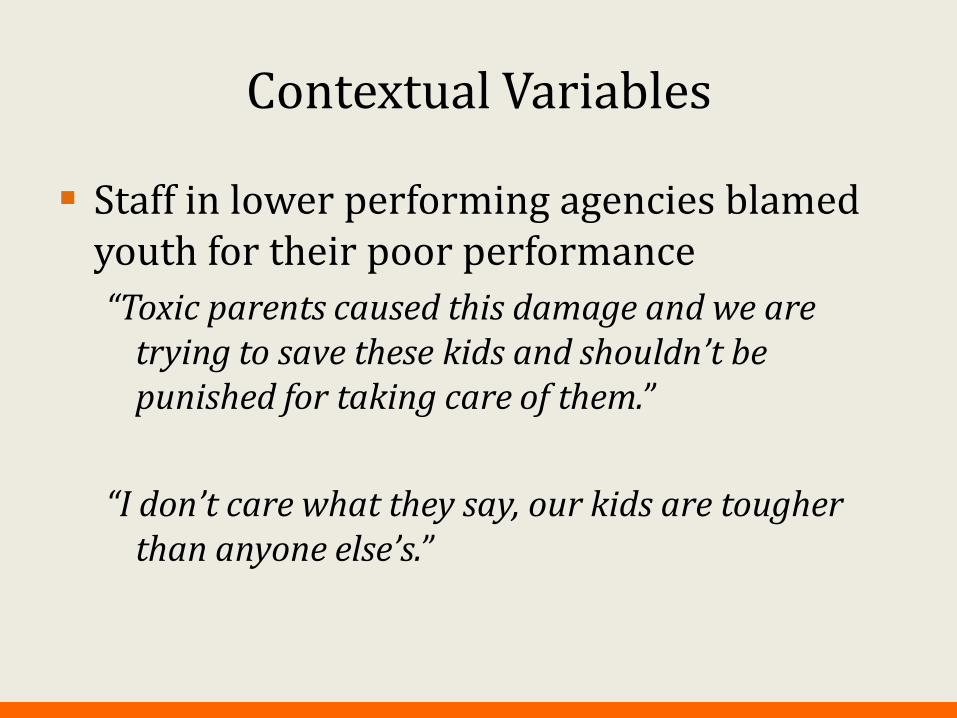
Contextual Variables
Staff in lower performing agencies blamed youth for their poor performance
“Toxic parents caused this damage and we are trying to save these kids and shouldn’t be punished for taking care of them.”
“I don’t care what they say, our kids are tougher than anyone else’s.”

Contextual Variables
Lower performing agencies did not have a well defined treatment model; staff could not articulate the treatment model
All 10 agencies reported that their populations included a significant number of youth who came from disrupted adoptions or kinship placements
All 10 agencies reported increases in the number of youth with conduct disorders

ANY QUESTIONS?

Contact Information
Erwin McEwen, Director
Director Erwin [email protected]
Brice [email protected]
Mary Hollie, CEO
Judge Kathleen A. Kearney