using data to drive institutional transformation to
TRANSCRIPT
Using Data to Drive Institutional Transformation to Improve Retention and Graduation for Underrepresented Students
October 30, 2019
Missouri Equity Summit

Co-Chair, St. Louis Graduates
Vice Provost of Enrollment Management, University of Missouri – St. Louis
Alan Byrd, Jr.
2

• Collaborative network of K-12 and higher education, youth-serving non-profits, business and philanthropy
• Committed to eliminating equity gaps in degree completion for low-income students and students of color
• What we do:
About St. Louis Graduates
3
Research Postsecondary Access
Professional Development
Institute
Postsecondary Success
Student Success Learning Institute
Advocacy

4
Why Degrees Matter
5
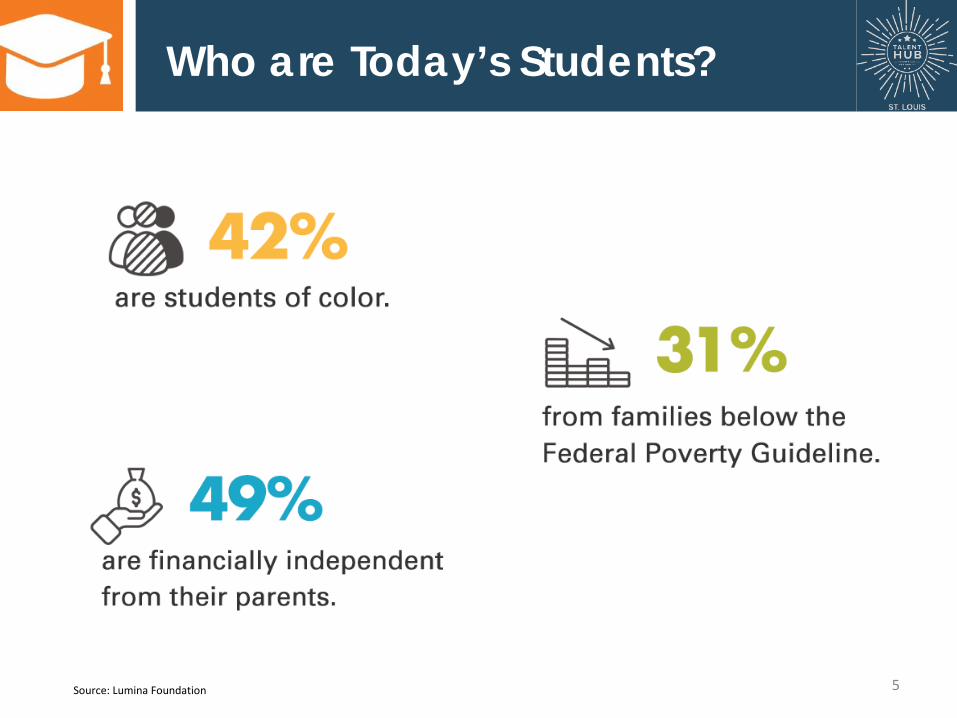
Who are Today’s Students?
Source: Lumina Foundation

Degree Attainment Gap by Race
45.8%42.5% 42.3%
29.3%25.8% 26.7%
0%
10%
20%
30%
40%
50%
60%
National Average Missouri St. Louis region
Adults overall African Americans
Goal: 60% by 2025
14% gap 16%
gap
Opportunity for greatest impact: low-income students, first-generation students and students of color 6

Source: The Pell Institute, http://pellinstitute.org/indicators/reports_2017_data.shtml
Degree Attainment Gap by Income
6%First (Lowest) Quartile, 12%
11%
Second Quartile, 20%15%
Third Quartile, 35%40%
Fourth (Highest) Quartile, 58%
0%
10%
20%
30%
40%
50%
60%
70%
1960 1970 1980 1990 2000 2010 2020
First (Lowest) Quartile Second Quartile Third Quartile Fourth (Highest) Quartile
7
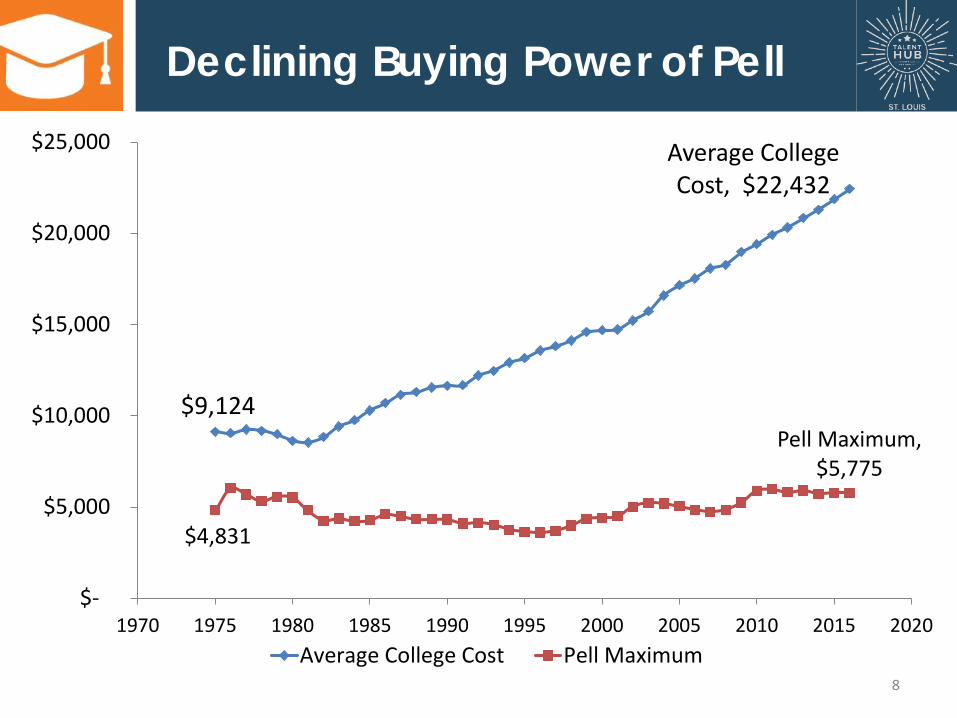
Declining Buying Power of Pell
$9,124
Average College Cost, $22,432
$4,831
Pell Maximum, $5,775
$-
$5,000
$10,000
$15,000
$20,000
$25,000
1970 1975 1980 1985 1990 1995 2000 2005 2010 2015 2020Average College Cost Pell Maximum
8

Net Price by Family Income for MO Publics
Family Income Ranges
Net Price % of Family Income Needed to Pay Net Price
$0-29,999 $9,737 57%$30,000-47,999 $10,518 27%$48,000-74,999 $13,098 22%$75,000-109,999 $14,882 19%$110,000 and above $15,607 9%
Institute for Research on Higher Education
Net Price by Family Income at MO 4-yr Public Institutions

Student debt now totals
$1.5 TRILLION
10

Co-Chair, St. Louis Graduates
Senior Vice President – ProgramsWyman
Allison Williams
11

Published in 2017
DEGREES WITH LESS DEBT Effective Higher Education Strategies for Underrepresented Student Populations
12
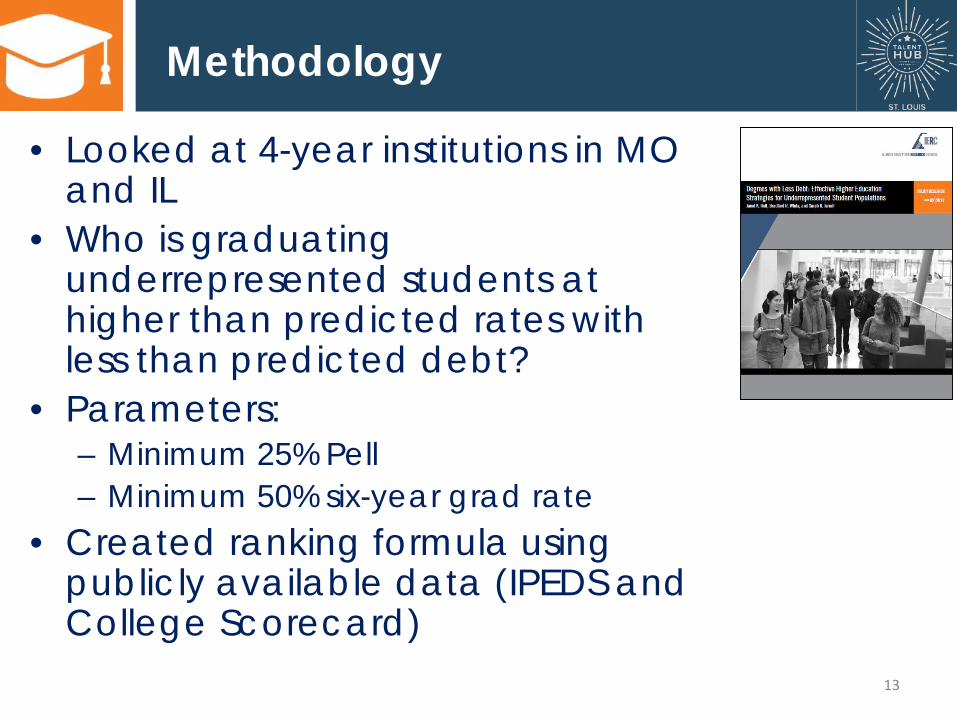
• Looked at 4-year institutions in MO and IL
• Who is graduating underrepresented students at higher than predicted rates with less than predicted debt?
• Parameters:– Minimum 25% Pell– Minimum 50% six-year grad rate
• Created ranking formula using publicly available data (IPEDS and College Scorecard)
13
Methodology

14
5 Institutions Effectively Graduating Underrepresented Students with Less Debt
15
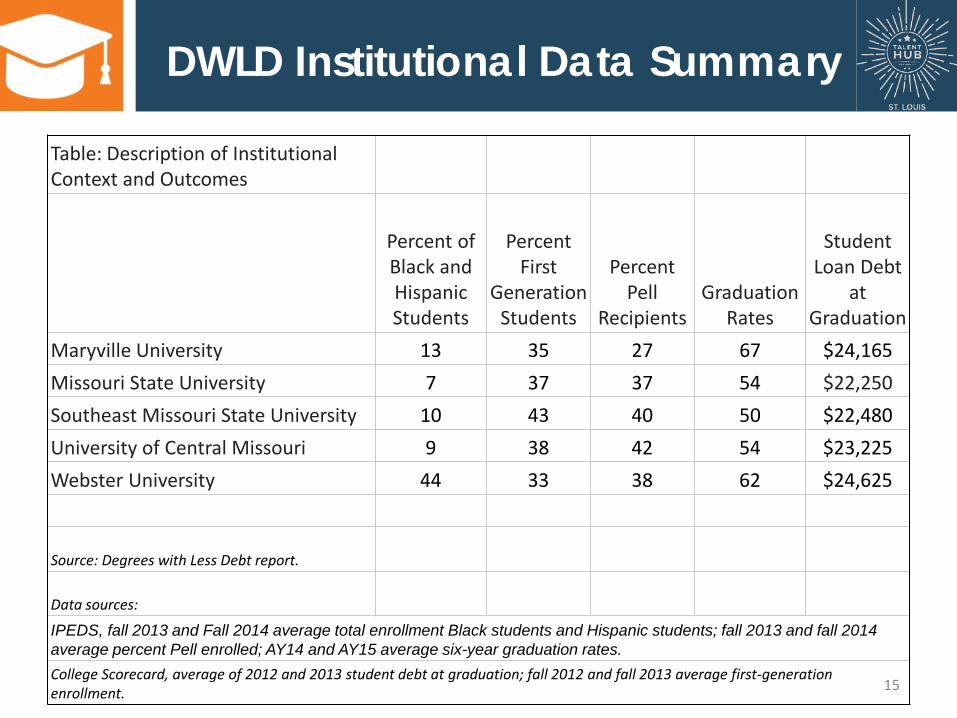
DWLD Institutional Data Summary
Table: Description of Institutional Context and Outcomes
Percent of Black and Hispanic Students
Percent First
Generation Students
Percent Pell
RecipientsGraduation
Rates
Student Loan Debt
at Graduation
Maryville University 13 35 27 67 $24,165Missouri State University 7 37 37 54 $22,250Southeast Missouri State University 10 43 40 50 $22,480University of Central Missouri 9 38 42 54 $23,225Webster University 44 33 38 62 $24,625
Source: Degrees with Less Debt report.
Data sources:
IPEDS, fall 2013 and Fall 2014 average total enrollment Black students and Hispanic students; fall 2013 and fall 2014 average percent Pell enrolled; AY14 and AY15 average six-year graduation rates.College Scorecard, average of 2012 and 2013 student debt at graduation; fall 2012 and fall 2013 average first-generation enrollment.

Steering Committee member, St. Louis Graduates
Assistant Vice President for Academic Diversity and Outreach, Southeast Missouri State University
Trent Ball
16

5 CROSS-CUTTING THEMES
17

• 1 of 24 Talent Hubs in US designated by Lumina and Kresge
• Partnership of five 4-year institutions and St. Louis Graduates, STL Regional Chamber, STL Community Foundation
• Emphasis on accelerating degree completion for traditional-age low-income and African American students
18
St. Louis Talent Hub
18

19
A Coalition of the WillingTeam of colleagues from enrollment management, student support services, TRiO, academic support
Talent Hub team meets quarterly• Elevating and celebrating what is working• Problem solving where needed• Identifying opportunities to share learning
Strategies:• Just-in-time academic supports• Flexible financial aid• Summer transition programs• Creating a supportive learning community

• Southeast Missouri State University is expanding its Academic Mentoring Program and hired a GA to ensure TRiO students on track to graduation Retention increased almost 15% over 4 years Six-year graduation rate of 97%
20
Talent Hub Impact
0
10
20
30
40
50
60
70
80
90
100
Southeast Missouri State UniversityFall to Fall Retention Rate Among African American
students
2015 2016 2017 2018
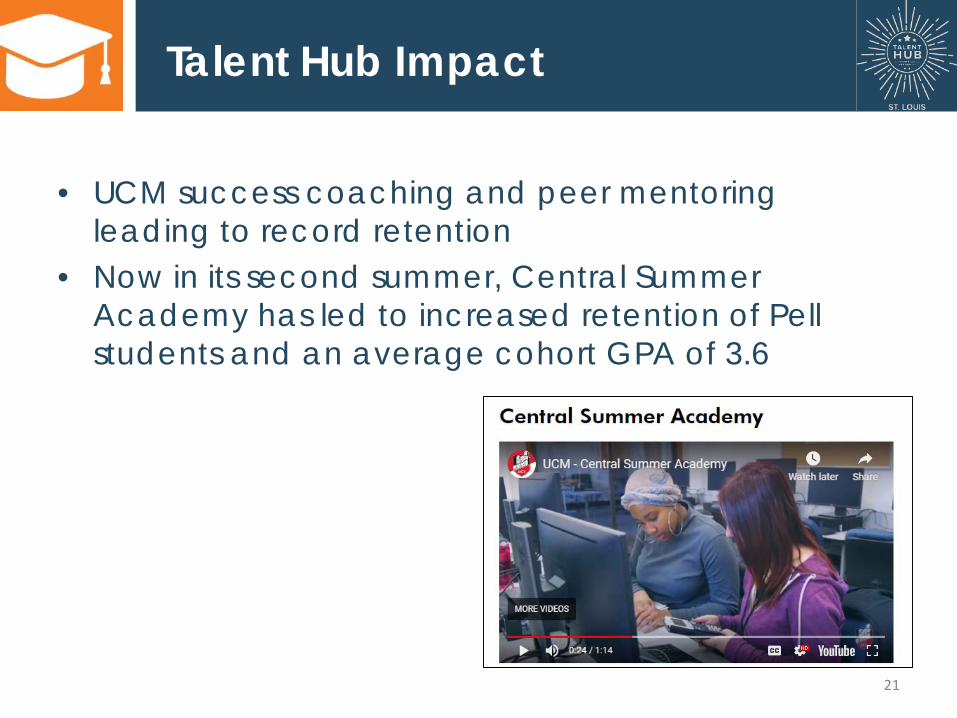
• UCM success coaching and peer mentoring leading to record retention
• Now in its second summer, Central Summer Academy has led to increased retention of Pell students and an average cohort GPA of 3.6
21
Talent Hub Impact

• Webster University is leveraging its campuses worldwide to increase graduation rates for students of color through study-abroad.– Build on research showing that FTFT students who study
abroad are 26% more likely to graduate in six years.– First cohort in Ghana this month.
• Webster’s TAP (Transitions Academic Prep) summer program has targeted first-generation and low-income students– On track to six-year graduation rate of 79%
22
Talent Hub Impact

• Maryville University strengthened its 24/7 life coaching program through a nationally accredited equity certification for all of its life coaches.
• Early identification of African American students with potential financial holds and pro-active outreach to connect them to the stay-in-school grant.
23
Talent Hub Impact

24
Talent Hub Impact• Created new flexible financial
aid programs focused on degree completion
– Graduated 248 seniors who received grant releasing financial hold since 2012
– Graduated 424 seniors via degree completion grant for those who have exhausted Pell since 2013
46%4…
41%
53% 56%
44%42% 36%
49%54%
32%
24% 26%
36%
46%
0%
10%
20%
30%
40%
50%
60%
2013 2014 2015 2016 2017
All Students Pell Recipients African American Students
UMSL 6-year Graduation Rates 2013-2017
• Expanded academic assistance and pro-actively reached out to African American students enrolled in its high D/F/W courses. Highest GPA ever for first-year students For the first time the average GPA for
African American students is over 2.5

Student Success Learning Institute Data dashboards – UCM – Feb 2018 Advising, coaching & mentoring – Missouri State – Sept
2018 Debt-forgiveness and flexible financial aid – MU – Aug
2019 – Launch of Finish Line Debt Forgiveness Scholarship by Missouri Scholarship & Loan Foundation
Expanded “Talent Hub” in 2020
25
Building a Learning Community
• What are some of the challenges to embedding equity more deeply in your work? How have you overcome them?
• What role do faculty play or what role could they play?
• How can community partners support degree completion strategies?
26
Discussion

Contact Us
27
Trent BallAssistant Vice President for Academic Diversity and Outreach, Southeast Missouri State [email protected]
Alan Byrd, Jr.Vice Provost of Enrollment Strategies, University of Missouri-St. [email protected]
Allison WilliamsSenior Vice President, Programs, [email protected]
Laura WinterProject Director, St. Louis [email protected]