using electronic healthcare records for drug safety signal...
TRANSCRIPT
1
Using electronic healthcare records for drug safety signal detection: a comparative evaluation of statistical methods Online appendix
Contents Appendix A. Overview of the drug approval process in Europe and the US ................................................ 2
References ................................................................................................................................................ 2
Appendix B. Statistical methods ................................................................................................................... 4
Spontaneous Reporting System methods ................................................................................................. 5
Cohort methods ........................................................................................................................................ 6
Case based methods ................................................................................................................................. 6
Other methods .......................................................................................................................................... 7
References ................................................................................................................................................ 8
Appendix C. Source data ............................................................................................................................... 9
References .............................................................................................................................................. 10
Appendix D. Reference set construction .................................................................................................... 11
Power calculations .................................................................................................................................. 11
Retrieving information from published literature .................................................................................. 11
Filtering possible known associations ..................................................................................................... 11
Grading the evidence from literature ..................................................................................................... 13
Appendix E. Receiver Operator Characteristics curves ............................................................................... 15
2
Appendix A. Overview of the drug approval process in Europe and the
US Through the centralized procedure coordinated by the European Medicines Agency (EMA), companies can apply for a single marketing authorisation for medicines that is valid in all European Union (EU) Member States as well as in Iceland, Liechtenstein, and Norway. The centralized procedure is compulsory for human medicines intended for the treatment of cancer and certain other conditions, including rare diseases. Article 8 of Directive 2001/83/EC as amended by Directive 2004/27/EC1 requires that the marketing authorization shall be accompanied by a detailed description of the pharmacovigilance and, where appropriate, of the risk-management system, which the applicant will introduce. In the EU, such descriptions are provided in the form of an EU–Risk Management Plan (EU-RMP), as detailed in Volume 9A,2 which needs updating throughout the life cycle of the medicinal product. 1 The European Medicines Agency (via the Committee for Medicinal Products for Human Use, CHMP) assesses applications for marketing authorization based on purely scientific criteria and determine whether the medicines concerned meet the necessary quality, safety, and efficacy requirements, and whether the benefit/risk balance is positive (in accordance with EU legislation, particularly directive 2001/83/EC). Once granted, a marketing authorization can be suspended or revoked in the case of lack of efficacy or when the benefit/risk balance is no longer considered to be positive. 2 The International Conference on Harmonisation (ICH) E2E guideline3 details a structure for planning pharmacovigilance activities, and in the EU, this is applied for the post-maketing period of a new drug and for established products in significant new indications. Such activities include routine pharmacovigilance methods and additional pharmacovigilance measures, where required, to address concerns that are important identified risks, important potential risks or important missing information. The additional measures may include active surveillance, for example, drug event monitoring or registries, comparative observational studies, targeted clinical investigations (e.g. pharmacodynamic and PK studies to determine if a particular dosing instruction can put patients at an increased risk of adverse events (AEs)) and/or descriptive studies such as drug utilisation studies. Such post-authorisation studies may be requested by the CHMP as a commitment and detailed in a letter of undertaking (LoU) of the company, at the time of initial authorisation or in the postauthorisation phase. 1 In the US, the Center for Drug Evaluation and Research(CDER) of the Food and DrugAdministration (FDA) regulates new drugs. The US FDA and the EMA have comparable systems for new drug approval and the approval processes in the two regions are not very different. 3, 4
References
1. Blake KV, Prilla S, Accadebled S, et al. European Medicines Agency review of post-authorisation studies with implications for the European Network of Centres for Pharmacoepidemiology and Pharmacovigilance. Pharmacoepidemiol Drug Saf 2011;20:1021-1029 2. Pignatti F, Gravanis I, Herold R, et al. The European Medicines Agency: an overview of its mission, responsibilities, and recent initiatives in cancer drug regulation. Clin Cancer Res 2011;17:5220-5225 3. Tsuji K, Tsutani K. Approval of new drugs 1999-2007: comparison of the US, the EU and Japan situations. J Clin Pharm Ther 2010;35:289-301
3
4. Trotta F, Leufkens HG, Schellens JH, et al. Evaluation of oncology drugs at the European Medicines Agency and US Food and Drug Administration: when differences have an impact on clinical practice. J Clin Oncol 2011;29:2266-2272
4
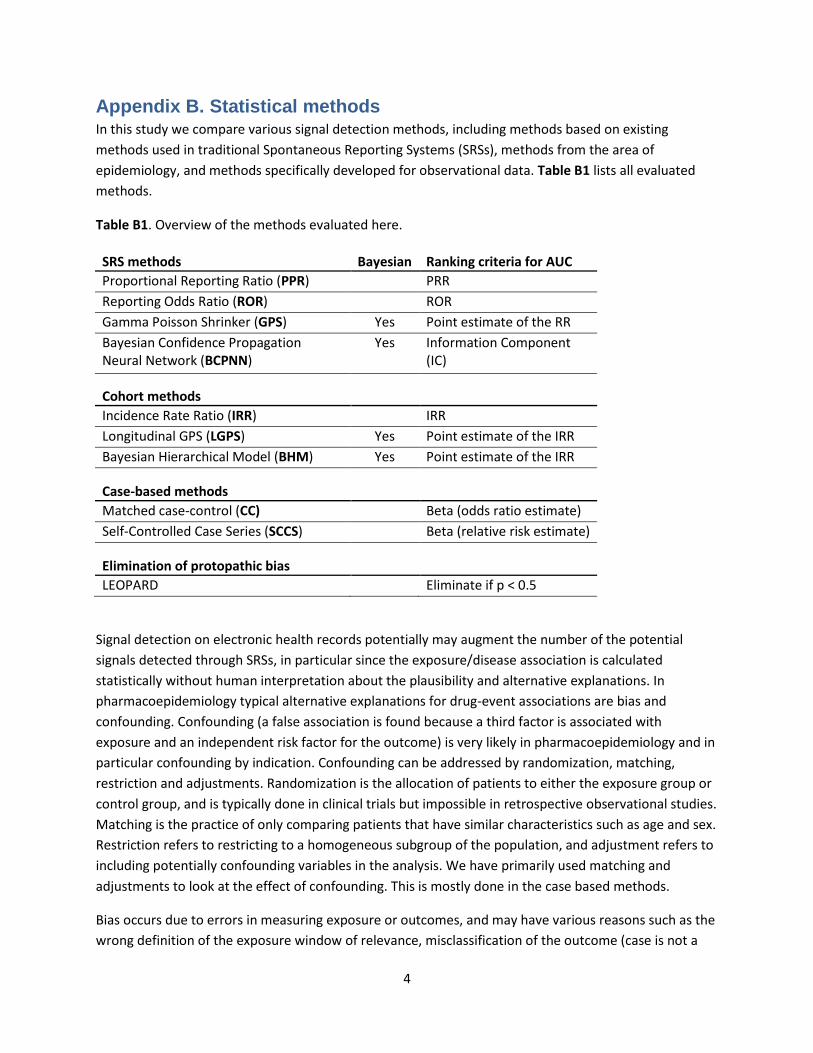
Appendix B. Statistical methods In this study we compare various signal detection methods, including methods based on existing
methods used in traditional Spontaneous Reporting Systems (SRSs), methods from the area of
epidemiology, and methods specifically developed for observational data. Table B1 lists all evaluated
methods.
Table B1. Overview of the methods evaluated here.
SRS methods Bayesian Ranking criteria for AUC
Proportional Reporting Ratio (PPR) PRR
Reporting Odds Ratio (ROR) ROR
Gamma Poisson Shrinker (GPS) Yes Point estimate of the RR
Bayesian Confidence Propagation Neural Network (BCPNN)
Yes Information Component (IC)
Cohort methods Incidence Rate Ratio (IRR) IRR
Longitudinal GPS (LGPS) Yes Point estimate of the IRR
Bayesian Hierarchical Model (BHM) Yes Point estimate of the IRR
Case-based methods
Matched case-control (CC) Beta (odds ratio estimate)
Self-Controlled Case Series (SCCS) Beta (relative risk estimate)
Elimination of protopathic bias
LEOPARD Eliminate if p < 0.5
Signal detection on electronic health records potentially may augment the number of the potential
signals detected through SRSs, in particular since the exposure/disease association is calculated
statistically without human interpretation about the plausibility and alternative explanations. In
pharmacoepidemiology typical alternative explanations for drug-event associations are bias and
confounding. Confounding (a false association is found because a third factor is associated with
exposure and an independent risk factor for the outcome) is very likely in pharmacoepidemiology and in
particular confounding by indication. Confounding can be addressed by randomization, matching,
restriction and adjustments. Randomization is the allocation of patients to either the exposure group or
control group, and is typically done in clinical trials but impossible in retrospective observational studies.
Matching is the practice of only comparing patients that have similar characteristics such as age and sex.
Restriction refers to restricting to a homogeneous subgroup of the population, and adjustment refers to
including potentially confounding variables in the analysis. We have primarily used matching and
adjustments to look at the effect of confounding. This is mostly done in the case based methods.
Bias occurs due to errors in measuring exposure or outcomes, and may have various reasons such as the
wrong definition of the exposure window of relevance, misclassification of the outcome (case is not a
5
true case), wrong assessment of the timing of disease onset which may lead to protopathic bias.
Protopathic bias occurs when a drug is prescribed for an early manifestation of a disease that has not
yet been diagnostically detected.
Spontaneous Reporting System methods
Signal detection methods originally developed for SRSs
can also be used on EHR data by transforming the data to
a format suitable for these methods. For this
transformation we assume that whenever one of the
events of interests occurs during a period associated with
the exposure to a drug, that this will lead to a ‘report’
describing a potential ADR involving the drug and event.
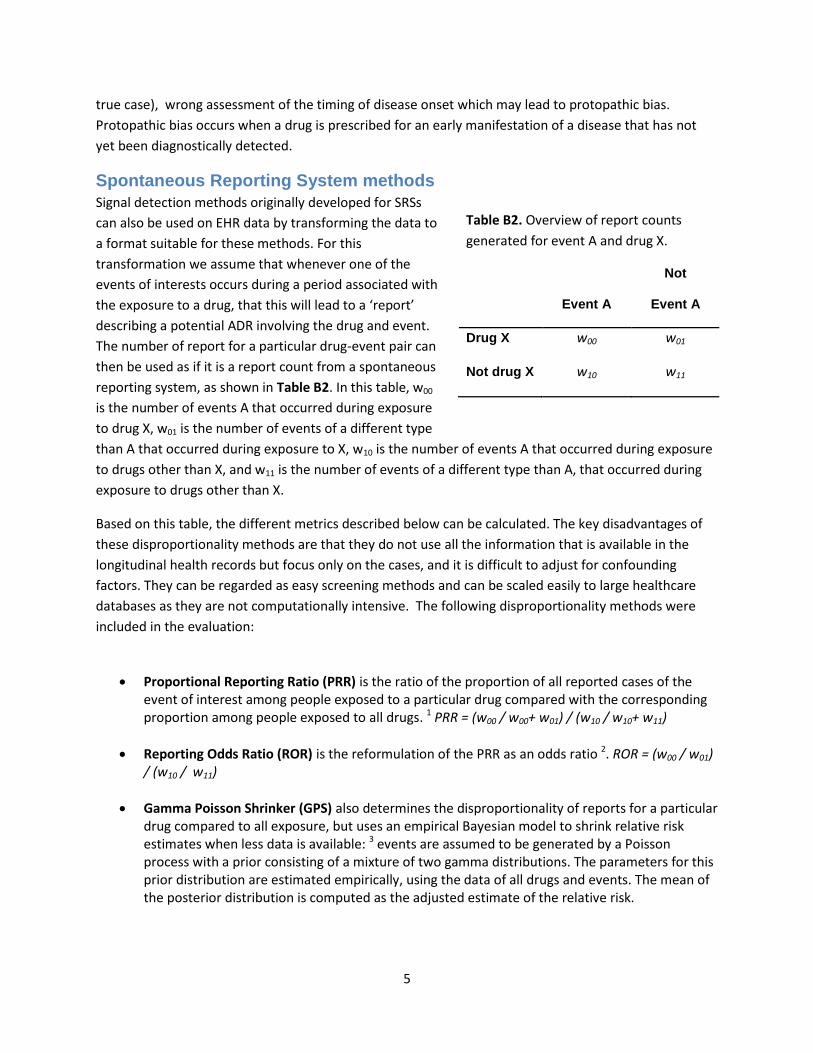
The number of report for a particular drug-event pair can
then be used as if it is a report count from a spontaneous
reporting system, as shown in Table B2. In this table, w00
is the number of events A that occurred during exposure
to drug X, w01 is the number of events of a different type
than A that occurred during exposure to X, w10 is the number of events A that occurred during exposure
to drugs other than X, and w11 is the number of events of a different type than A, that occurred during
exposure to drugs other than X.
Based on this table, the different metrics described below can be calculated. The key disadvantages of
these disproportionality methods are that they do not use all the information that is available in the
longitudinal health records but focus only on the cases, and it is difficult to adjust for confounding
factors. They can be regarded as easy screening methods and can be scaled easily to large healthcare
databases as they are not computationally intensive. The following disproportionality methods were
included in the evaluation:
Proportional Reporting Ratio (PRR) is the ratio of the proportion of all reported cases of the event of interest among people exposed to a particular drug compared with the corresponding proportion among people exposed to all drugs. 1 PRR = (w00 / w00+ w01) / (w10 / w10+ w11)
Reporting Odds Ratio (ROR) is the reformulation of the PRR as an odds ratio 2. ROR = (w00 / w01) / (w10 / w11)
Gamma Poisson Shrinker (GPS) also determines the disproportionality of reports for a particular drug compared to all exposure, but uses an empirical Bayesian model to shrink relative risk estimates when less data is available: 3 events are assumed to be generated by a Poisson process with a prior consisting of a mixture of two gamma distributions. The parameters for this prior distribution are estimated empirically, using the data of all drugs and events. The mean of the posterior distribution is computed as the adjusted estimate of the relative risk.
Table B2. Overview of report counts
generated for event A and drug X.
Event A
Not
Event A
Drug X w00 w01
Not drug X w10 w11
6
Bayesian Confidence Propagation Neural Network (BCPNN) works similarly to GPS, in that it also uses a Bayesian model to shrink estimates of risk. Typically, the output of a BCPNN is expressed as the Information Component (IC); the logarithm of the ratio between observed and expected number of reports for a particular drug-event pair. 4
Cohort methods
One of the limitations of the SRSs and their methods is that only numerator data is available: the
number of people on drugs that have events. What is missing is the denominator data: the number of
people that are exposed to the drugs. In longitudinal databases this information is readily available, as
well as the length of exposure, and this information is used in the cohort methods
Incidence Rate Ratio (IRR) is calculated as the ratio between the incidence rate during exposure to the drug compared to a background incidence rate. To correct for age and sex, the IRR is computed within each age-sex strata, and the overall IRR is computed as the weighted average of the strata. A Mantel-Haenszel test is used to test the effect across strata.
Longitudinal GPS (LGPS) is an adaptation of the GPS to longitudinal data. Whereas the original GPS used reports on other drugs and other events to compute the expected count, the LGPS uses all non-exposed patient time to determine the expected count. It thus computes the IRR, corrected for age and sex, and subsequently applies the GPS shrinkage. 5
Bayesian Hierarchical Model (BHM) uses a full Bayesian approach to perform shrinkage, but instead of using a single prior distribution for all drugs, priors are also created for classes and super classes of drugs. The BHM combines statistical models for the observations given the parameters (likelihood) and the parameters themselves (priors). In the application reported here, the incidence rate is modeled using a Poisson process, and the priors as a hierarchy (using guidance from Gelman). 6 The groupings forming the hierarchy are decided a priori based on criteria of similarity between drugs; in this case we have used ATC coding levels based on organ/systems and therapeutic or chemical characteristics. Berry and Berry 7 used a similar hierarchical approach, with a hierarchy based on related outcomes rather than drugs. The BHM shrinks the original ‘frequentist’ estimates to give an updated posterior distribution of each individual drug to the group mean and reduces its variance. This is because the posterior considers both the data provided by the drug and by the other drugs in the same group. Shrinkage is stronger for drugs with an initial large variance (less information) and larger effects. These novel methods can offer key advantages by reducing the likelihood of false positive or false negative results obtained from the data. The approach offers further opportunities beyond the application reported here. More specific comparisons are possible, for example between related drugs from the same group or perhaps higher level groups, and potential extensions include using regression methods to adjust for co-prescriptions of drugs. 8, 9 Although the BHM is grouped here with the cohort methods, it can also be applied to other types of relative risk estimates.
Case based methods
Several analytical epidemiological methods start with the diseased persons (cases) and compare these
with a sample of the population that gives rise to the cases (i.e. the controls) to evaluate differences in
exposure status. Since the case based methods are more efficient in terms of data needs (exposure
7
assessed only at one point in time), they allow for easier adjustments for confounding factors either
through matching or statistical adjustments.
Case Control (CC) starts with all cases (i.e. subjects who had a particular event of interest), and finds for every case a predefined number of controls (in our experiments two controls per case), where controls should have the same characteristics as the cases, such as age and sex. For both cases and controls, the exposure to drugs is determined at the time of event (also known as the index date). A conditional logistic regression is used to determine the effect size of exposure to a drug. In our experiments, one covariate was used: the drug count, which is the number of different drugs the subject was exposed to in one year prior to the event date, until one month prior to the event date. The drug count is assumed to be an indication of overall patient health, and was included in the logistic regression. Please note that this also could lead to conditioning on some intermediates. The logistic regression was conditioned on the case set.
Self-Controlled Case Series (SCCS) investigates the association between acute outcomes and transient exposures, whereby cases are used as their own controls. In essence, the SCCS is a Poisson regression conditioned on the patient, comparing the rate of events during exposure to the rate of events when not exposed. 10 Because of the conditioning on the patient, only within-subject confounding should remain. Only information of cases is used in this analysis, all other persons are ignored.
Other methods
One other method not categorized elsewhere remains:
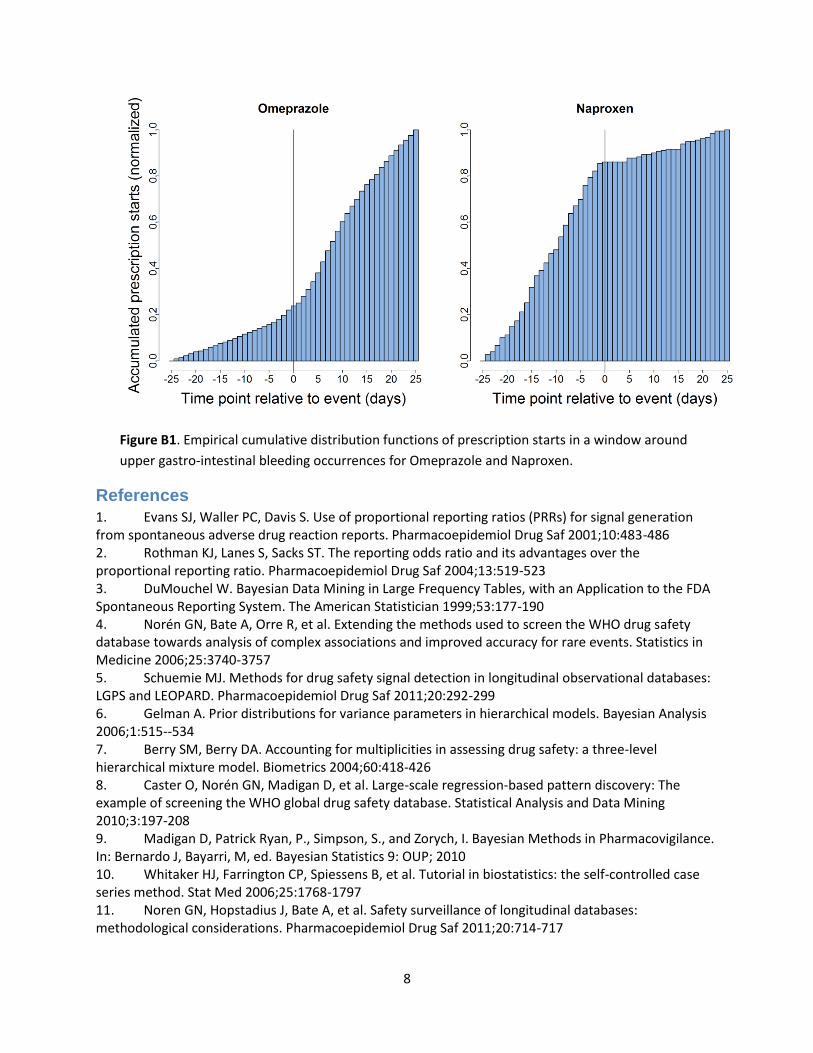
Longitudinal Evaluation of Observational Profiles of Adverse events Related to Drugs (LEOPARD) 5 attempts to detect protopathic bias. For every suspect drug-event combination, the number of prescription starting in a 51 day window around the event date are counted, as shown in Figure B1 for the drugs Pantoprazole and Naproxen around the event ‘upper gastro-intestinal bleeding’ (data from the IPCI database). The number of prescriptions in the 25 days prior to the event is compared to the number or prescriptions starting in the 25 days after the event. If the number of prescriptions increases after the event date, this is an indication that the drug is used to treat the event or a precursor of the event, rather than cause it. This is tested using a binomial test. In the examples of figure 1, Pantoprazole has p < 0.001, indicating the signal is probably caused by protopathic bias, whilst Naproxen has p = 1.00, indicating that the signal is probably not caused by protopathic bias. A signal is considered to be caused by protopathic bias if the p-value is below 0.5.
One of the potential shortcomings of LEOPARD is that it does not take time-trends in drug
prescribing into account 11, although it’s not clear how strong this effect will be within the 51 day
window. Additionally, for events that are often fatal the prescription rate after events will be
underestimated.
8
Figure B1. Empirical cumulative distribution functions of prescription starts in a window around
upper gastro-intestinal bleeding occurrences for Omeprazole and Naproxen.
References
1. Evans SJ, Waller PC, Davis S. Use of proportional reporting ratios (PRRs) for signal generation from spontaneous adverse drug reaction reports. Pharmacoepidemiol Drug Saf 2001;10:483-486 2. Rothman KJ, Lanes S, Sacks ST. The reporting odds ratio and its advantages over the proportional reporting ratio. Pharmacoepidemiol Drug Saf 2004;13:519-523 3. DuMouchel W. Bayesian Data Mining in Large Frequency Tables, with an Application to the FDA Spontaneous Reporting System. The American Statistician 1999;53:177-190 4. Norén GN, Bate A, Orre R, et al. Extending the methods used to screen the WHO drug safety database towards analysis of complex associations and improved accuracy for rare events. Statistics in Medicine 2006;25:3740-3757 5. Schuemie MJ. Methods for drug safety signal detection in longitudinal observational databases: LGPS and LEOPARD. Pharmacoepidemiol Drug Saf 2011;20:292-299 6. Gelman A. Prior distributions for variance parameters in hierarchical models. Bayesian Analysis 2006;1:515--534 7. Berry SM, Berry DA. Accounting for multiplicities in assessing drug safety: a three-level hierarchical mixture model. Biometrics 2004;60:418-426 8. Caster O, Norén GN, Madigan D, et al. Large-scale regression-based pattern discovery: The example of screening the WHO global drug safety database. Statistical Analysis and Data Mining 2010;3:197-208 9. Madigan D, Patrick Ryan, P., Simpson, S., and Zorych, I. Bayesian Methods in Pharmacovigilance. In: Bernardo J, Bayarri, M, ed. Bayesian Statistics 9: OUP; 2010 10. Whitaker HJ, Farrington CP, Spiessens B, et al. Tutorial in biostatistics: the self-controlled case series method. Stat Med 2006;25:1768-1797 11. Noren GN, Hopstadius J, Bate A, et al. Safety surveillance of longitudinal databases: methodological considerations. Pharmacoepidemiol Drug Saf 2011;20:714-717
9
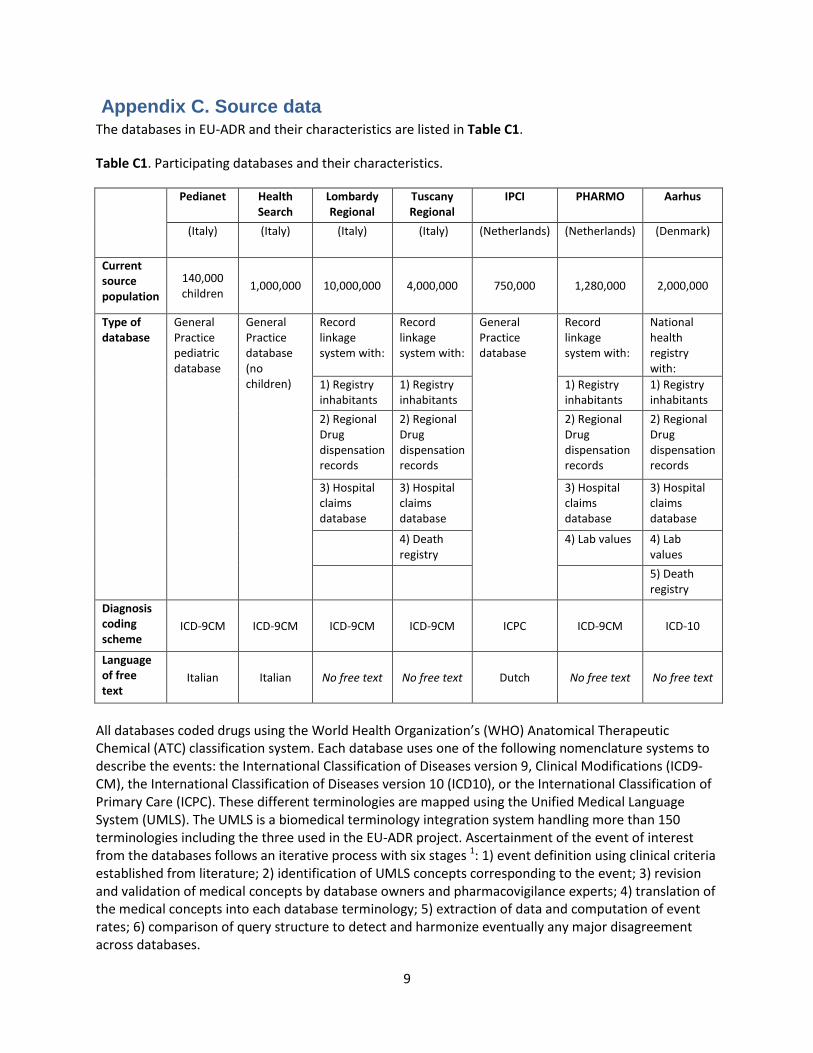
Appendix C. Source data The databases in EU-ADR and their characteristics are listed in Table C1.
Table C1. Participating databases and their characteristics.
Pedianet Health Search
Lombardy Regional
Tuscany Regional
IPCI PHARMO Aarhus
(Italy) (Italy) (Italy) (Italy) (Netherlands) (Netherlands) (Denmark)
Current source population
140,000 children
1,000,000 10,000,000 4,000,000 750,000 1,280,000 2,000,000
Type of database
General Practice pediatric database
General Practice database (no children)
Record linkage system with:
Record linkage system with:
General Practice database
Record linkage system with:
National health registry with:
1) Registry inhabitants
1) Registry inhabitants
1) Registry inhabitants
1) Registry inhabitants
2) Regional Drug dispensation records
2) Regional Drug dispensation records
2) Regional Drug dispensation records
2) Regional Drug dispensation records
3) Hospital claims database
3) Hospital claims database
3) Hospital claims database
3) Hospital claims database
4) Death registry
4) Lab values 4) Lab values
5) Death registry
Diagnosis coding scheme
ICD-9CM ICD-9CM ICD-9CM ICD-9CM ICPC ICD-9CM ICD-10
Language of free text
Italian Italian No free text No free text Dutch No free text No free text
All databases coded drugs using the World Health Organization’s (WHO) Anatomical Therapeutic Chemical (ATC) classification system. Each database uses one of the following nomenclature systems to describe the events: the International Classification of Diseases version 9, Clinical Modifications (ICD9-CM), the International Classification of Diseases version 10 (ICD10), or the International Classification of Primary Care (ICPC). These different terminologies are mapped using the Unified Medical Language System (UMLS). The UMLS is a biomedical terminology integration system handling more than 150 terminologies including the three used in the EU-ADR project. Ascertainment of the event of interest from the databases follows an iterative process with six stages 1: 1) event definition using clinical criteria established from literature; 2) identification of UMLS concepts corresponding to the event; 3) revision and validation of medical concepts by database owners and pharmacovigilance experts; 4) translation of the medical concepts into each database terminology; 5) extraction of data and computation of event rates; 6) comparison of query structure to detect and harmonize eventually any major disagreement across databases.
10
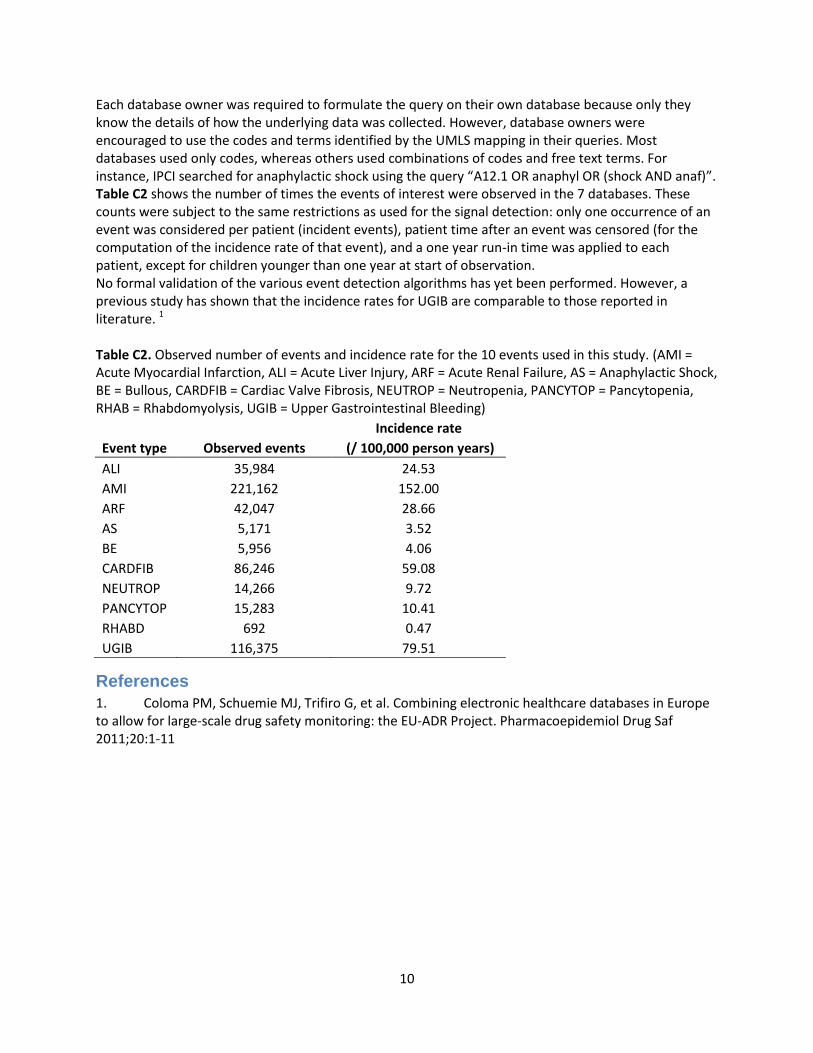
Each database owner was required to formulate the query on their own database because only they know the details of how the underlying data was collected. However, database owners were encouraged to use the codes and terms identified by the UMLS mapping in their queries. Most databases used only codes, whereas others used combinations of codes and free text terms. For instance, IPCI searched for anaphylactic shock using the query “A12.1 OR anaphyl OR (shock AND anaf)”. Table C2 shows the number of times the events of interest were observed in the 7 databases. These counts were subject to the same restrictions as used for the signal detection: only one occurrence of an event was considered per patient (incident events), patient time after an event was censored (for the computation of the incidence rate of that event), and a one year run-in time was applied to each patient, except for children younger than one year at start of observation. No formal validation of the various event detection algorithms has yet been performed. However, a previous study has shown that the incidence rates for UGIB are comparable to those reported in literature. 1 Table C2. Observed number of events and incidence rate for the 10 events used in this study. (AMI = Acute Myocardial Infarction, ALI = Acute Liver Injury, ARF = Acute Renal Failure, AS = Anaphylactic Shock, BE = Bullous, CARDFIB = Cardiac Valve Fibrosis, NEUTROP = Neutropenia, PANCYTOP = Pancytopenia, RHAB = Rhabdomyolysis, UGIB = Upper Gastrointestinal Bleeding)
Incidence rate
Event type Observed events (/ 100,000 person years)
ALI 35,984 24.53
AMI 221,162 152.00
ARF 42,047 28.66
AS 5,171 3.52
BE 5,956 4.06
CARDFIB 86,246 59.08
NEUTROP 14,266 9.72
PANCYTOP 15,283 10.41
RHABD 692 0.47
UGIB 116,375 79.51
References
1. Coloma PM, Schuemie MJ, Trifiro G, et al. Combining electronic healthcare databases in Europe to allow for large-scale drug safety monitoring: the EU-ADR Project. Pharmacoepidemiol Drug Saf 2011;20:1-11
11
Appendix D. Reference set construction The performance of the signal detection methods was evaluated by comparing how well the methods
could distinguish between known ADRs, and drug-event pairs where the drug is probably not causing the
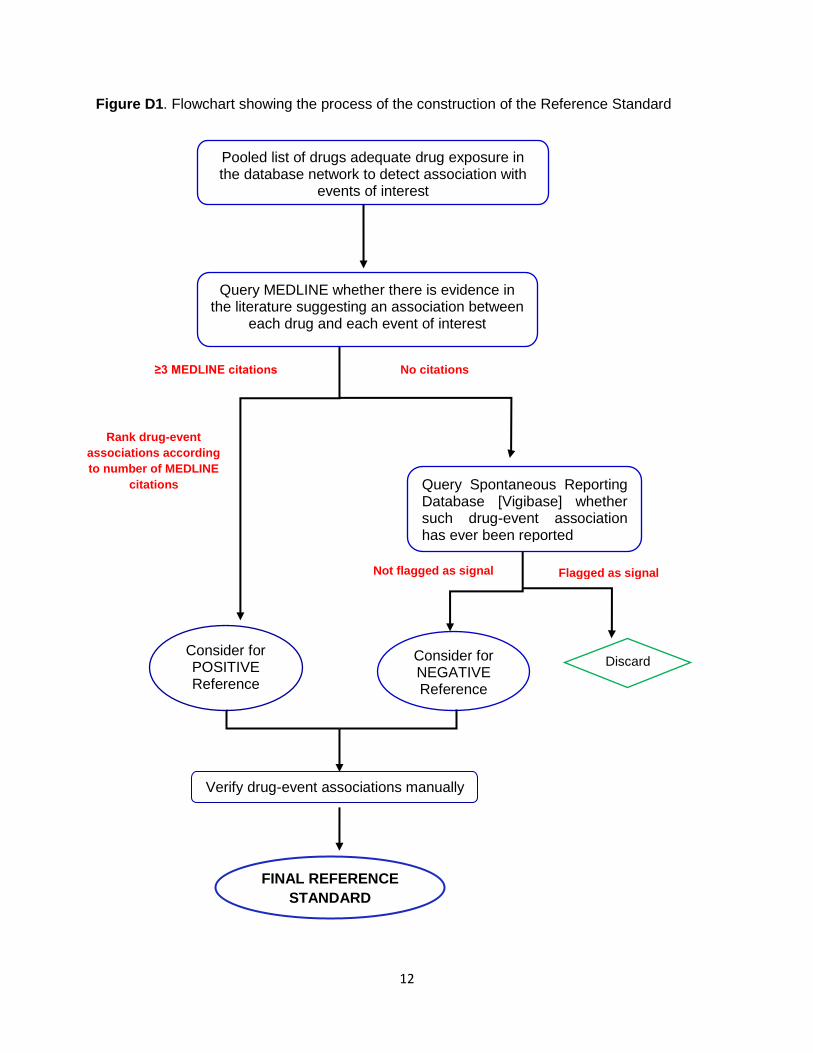
event. The procedure employed in the construction of the reference set is outlined in Figure D1.
Power calculations
It was first necessary to ensure that the drug-event pairs to be included in the reference set could be
found in the EU-ADR database network. For this purpose, power calculations were performed using a
one-sided significance level of 0.5, and power of 80%. Drug-event combinations were excluded when
there was insufficient power to detect a relative risk greater than four.
Retrieving information from published literature
A subset of MEDLINE was downloaded (via PubMed) and imported in a database including all the
citations with the “adverse effects” MeSH subheading. For each citation the PubMed identification
(PMID), MeSH descriptors, subheadings, substances, and date of creation of the citation were obtained.
Co-occurrences of four elements in a citation were noted: (1) the drug (from “substances” OR “MeSH
heading” fields); (2) adverse effect and the two subheadings, ‘adverse effect’ and ‘contraindications’.
Drugs from the “substances” field were taken into account only if their pharmacological action was
qualified by the subheading “adverse effects.” Hence, in this case, the pharmacological action was an
additional element that had to be taken into account. This latter requirement was an attempt to ensure
that there would be a link between an adverse event and a drug in the context of drug safety and not
just a co-occurrence in a MEDLINE citation30.
Filtering possible known associations
The drug-event pairs were ranked according to the number of PubMed citations with co-occurrence of
the drug and the adverse event of interest. For the pool of true positive associations, we considered the
drug-event pairs with the highest number of citations. This meant that more investigations were
performed – and published - on these drug-adverse event pairs. A drug-event pair was considered for
the pool of true negative associations if there were no PubMed citations with co-occurrence of the drug
and the adverse event of interest. The pool of true negative drug-event pairs was further verified using
the World Health Organization’s spontaneous ADR reporting database VigiBase to determine whether
any of these associations have previously been flagged as a potential signal31. Supplementary
information for both positive and negative associations was also obtained from the Summary of Product
Characteristics (SPCs) or product labels.
12
Figure D1. Flowchart showing the process of the construction of the Reference Standard
Pooled list of drugs adequate drug exposure in the database network to detect association with
events of interest
≥3 MEDLINE citations No citations
Consider for POSITIVE Reference
Query Spontaneous Reporting Database [Vigibase] whether such drug-event association has ever been reported
Not flagged as signal Flagged as signal
Consider for NEGATIVE Reference
Discard
Rank drug-event
associations according
to number of MEDLINE
citations
Verify drug-event associations manually
FINAL REFERENCE
STANDARD
Query MEDLINE whether there is evidence in the literature suggesting an association between
each drug and each event of interest
13
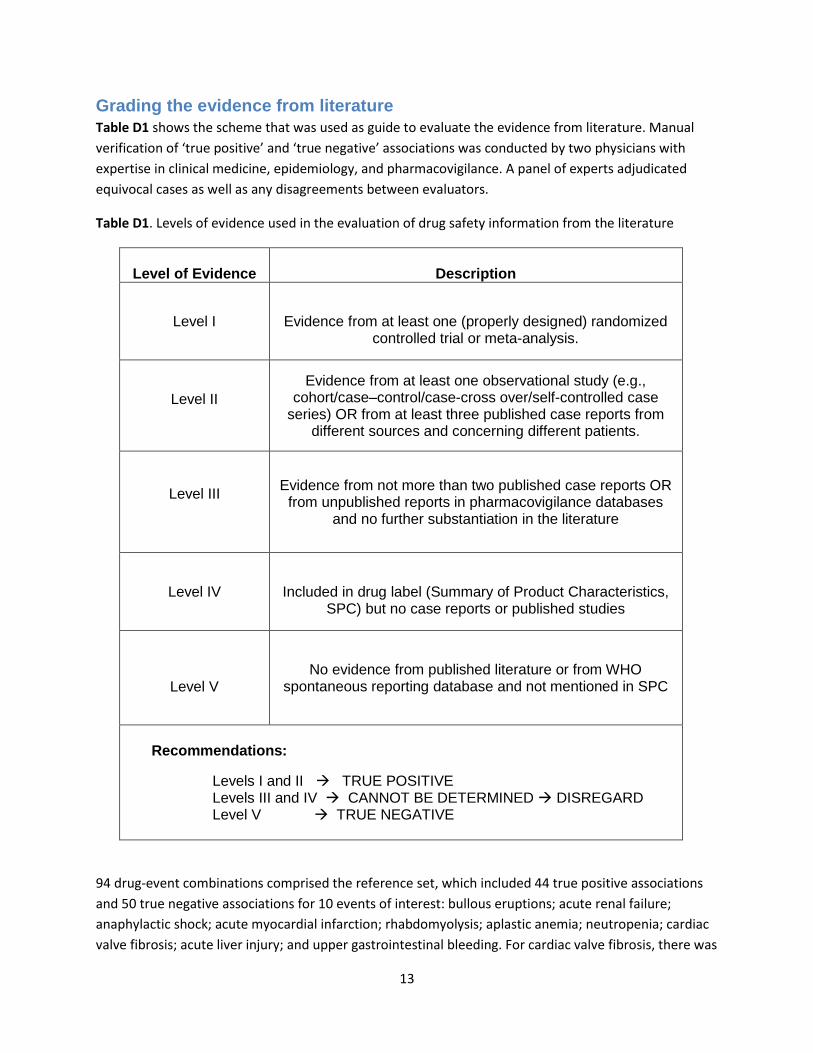
Grading the evidence from literature
Table D1 shows the scheme that was used as guide to evaluate the evidence from literature. Manual
verification of ‘true positive’ and ‘true negative’ associations was conducted by two physicians with
expertise in clinical medicine, epidemiology, and pharmacovigilance. A panel of experts adjudicated
equivocal cases as well as any disagreements between evaluators.
Table D1. Levels of evidence used in the evaluation of drug safety information from the literature
Level of Evidence
Description
Level I
Evidence from at least one (properly designed) randomized controlled trial or meta-analysis.
Level II
Evidence from at least one observational study (e.g., cohort/case–control/case-cross over/self-controlled case
series) OR from at least three published case reports from different sources and concerning different patients.
Level III
Evidence from not more than two published case reports OR from unpublished reports in pharmacovigilance databases
and no further substantiation in the literature
Level IV
Included in drug label (Summary of Product Characteristics, SPC) but no case reports or published studies
Level V No evidence from published literature or from WHO
spontaneous reporting database and not mentioned in SPC
Recommendations:
Levels I and II TRUE POSITIVE Levels III and IV CANNOT BE DETERMINED DISREGARD Level V TRUE NEGATIVE
94 drug-event combinations comprised the reference set, which included 44 true positive associations
and 50 true negative associations for 10 events of interest: bullous eruptions; acute renal failure;
anaphylactic shock; acute myocardial infarction; rhabdomyolysis; aplastic anemia; neutropenia; cardiac
valve fibrosis; acute liver injury; and upper gastrointestinal bleeding. For cardiac valve fibrosis, there was
14
no drug with adequate exposure in the database network to permit detection of a true positive
association.
The proportion of overall agreement (the proportion of cases for which both evaluators agreed across
all evaluation categories) was 0.93 (95% confidence interval (CI) 0.89 to 0.97). The proportions of
specific agreement were as follows: (1) ‘positive’ agreement 0.96 (95% CI 0.93 to 0.98); (2) ‘negative’
agreement 0.90 (95% CI 0.89 to 0.90). The chance-corrected agreement kappa coefficient, κ, was 0.83
(unweighted, 95% CI 0.74 to 0.92).
15
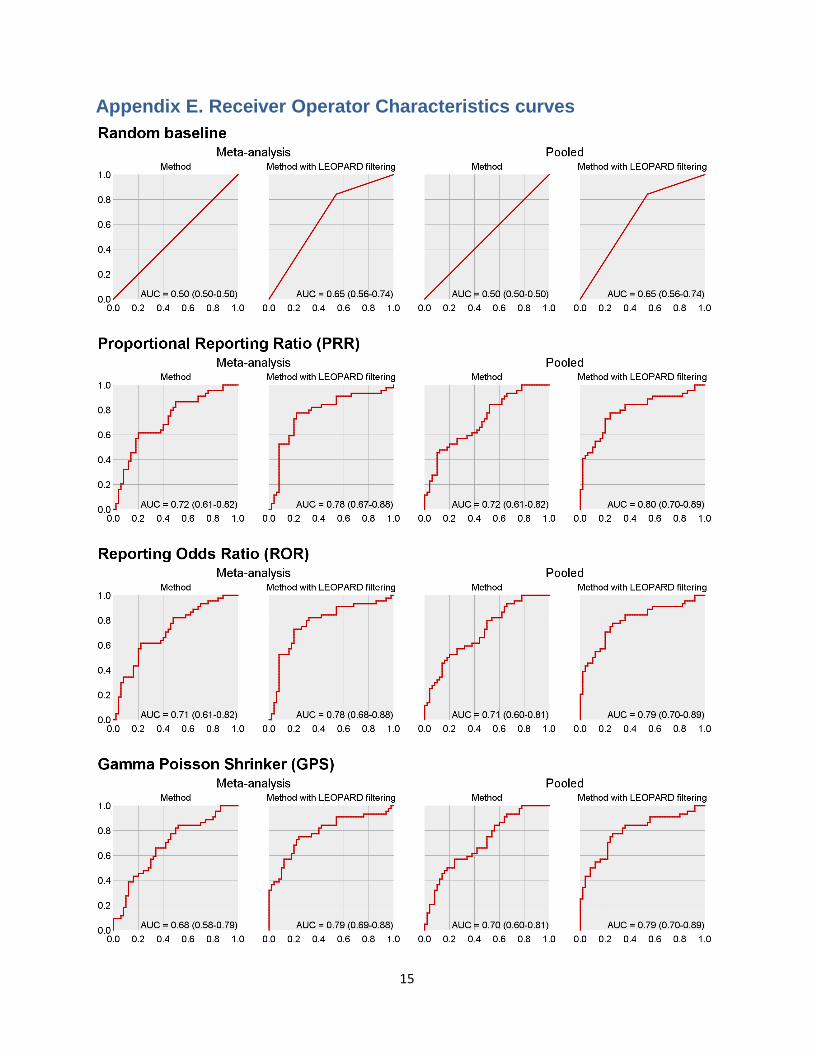
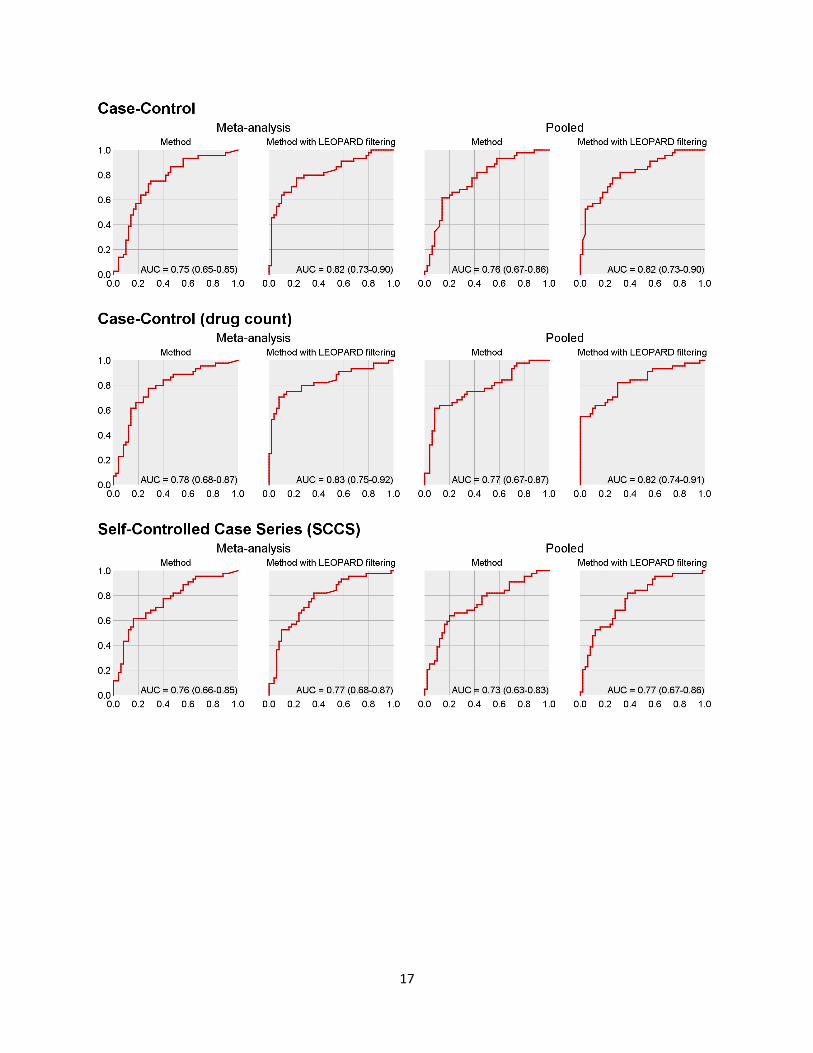
Appendix E. Receiver Operator Characteristics curves

16
17