using etfs for income 6-12 - morningstar,...
TRANSCRIPT

<#>
© 2011 Morningstar, Inc. All rights reserved.
Using ETFs for Income
Web Seminar
Scott Burns
Director of ETF, Closed-End Funds, and Alternatives
Morningstar
Disclosure: Morningstar, Inc., receives fees for licensing its indexes to ETF/ETN providers. These fees are mainly based on fund assets under management. BlackRock Asset Management; First Asset; First Trust; Invesco; Merrill Lynch; Northern Trust; Scottrade; and Van Eck currently license Morningstar Indexes. These ETFs and ETNs are not sponsored, issued, marketed, or sold by Morningstar. Morningstar does not make any representation regarding the advisability of investing in ETFs or ETNs that are based on the Morningstar Indexes.

ETF Research Process
• Investment Thesis
• Suitability and Risks
• Evaluate Your ETF Options
• Understand the Fundamentals
• Portfolio Impact
• Nuts and BoltsThe process should be iterative: “Wash, Rinse, Repeat”
Needs Graphic here

Applying the Process: The Case for Large-Cap Dividend Stocks
× Investment Thesis: Given lower interest rates, lower economic growth, and greater economic uncertainty, high-quality large caps that pay a dividend are attractive relative to bonds and relative to lower-quality small caps.
× Suitability: Core or Satellite? Large-cap U.S. stocks are typically the largest part of an investor’s equity allocation. Because small caps outperform over the long term, strategic portfolios can be overweight. We would recommend reducing that overweight.
× Risk: If we enter a recession, bonds will outperform stocks. If economic growth accelerates, small-cap stocks may continue to outperform, as they have over the last 10 years.
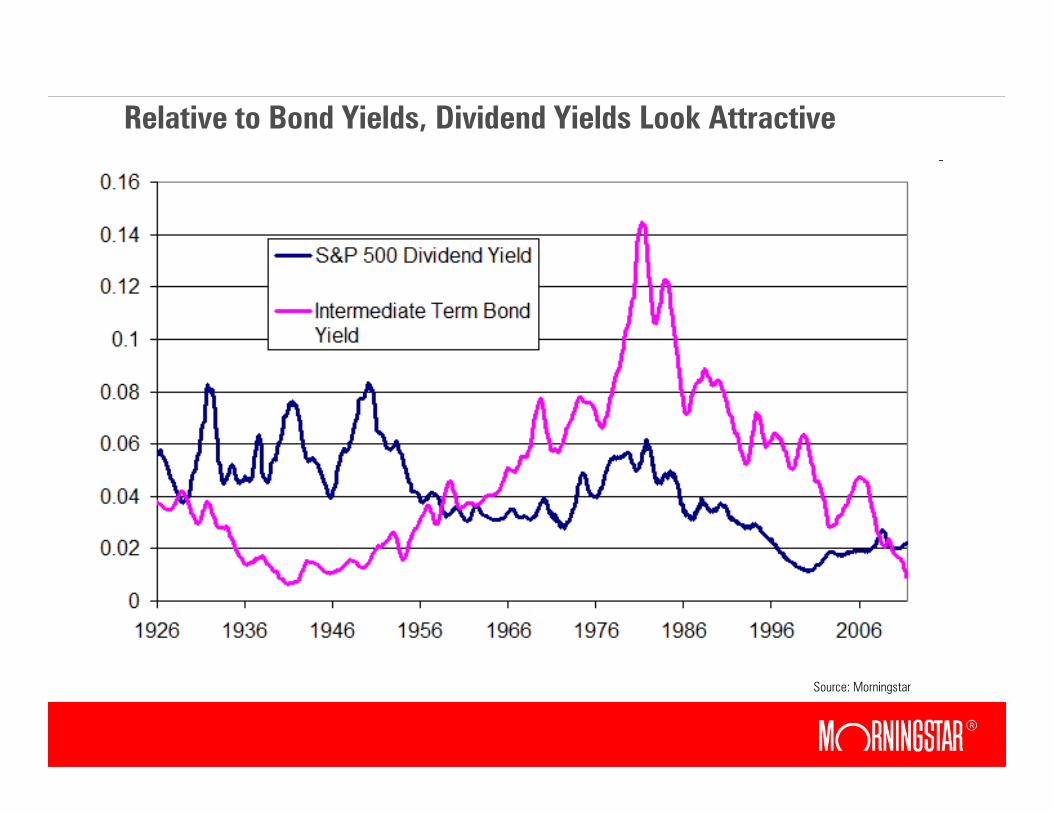
Relative to Bond Yields, Dividend Yields Look Attractive
Source: Morningstar

Stocks Look Attractively Priced
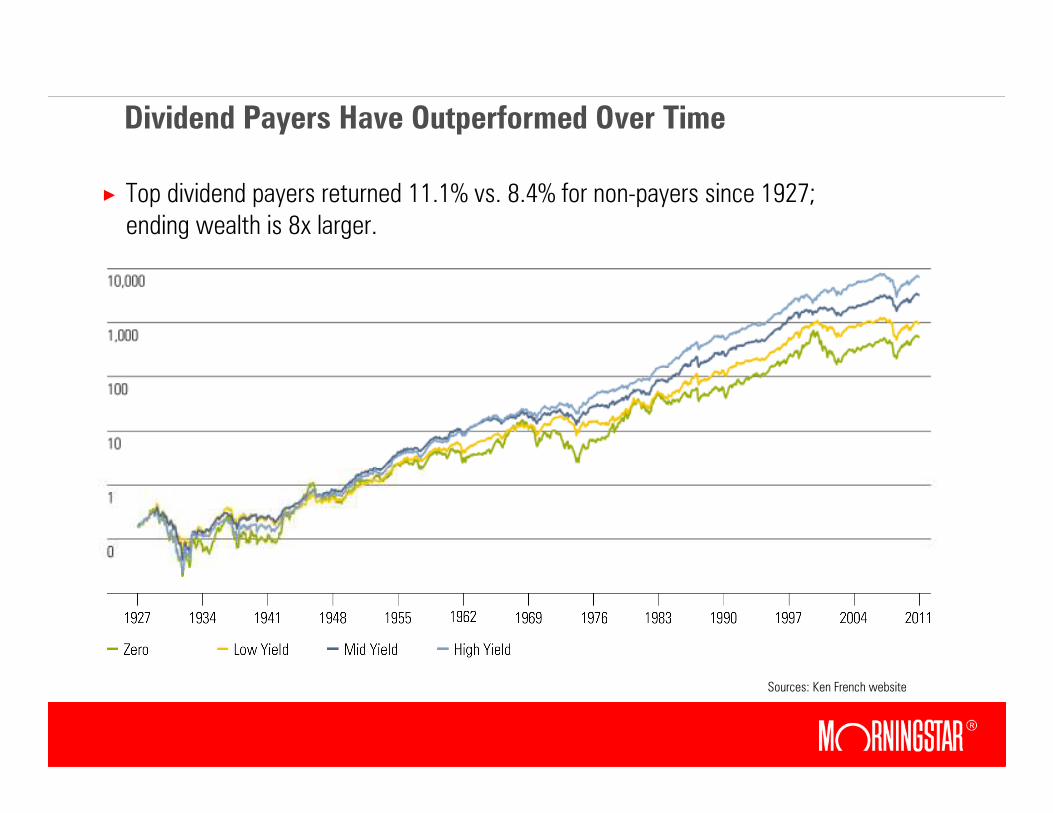
Dividend Payers Have Outperformed Over Time
Sources: Ken French website
× Top dividend payers returned 11.1% vs. 8.4% for non-payers since 1927; ending wealth is 8x larger.
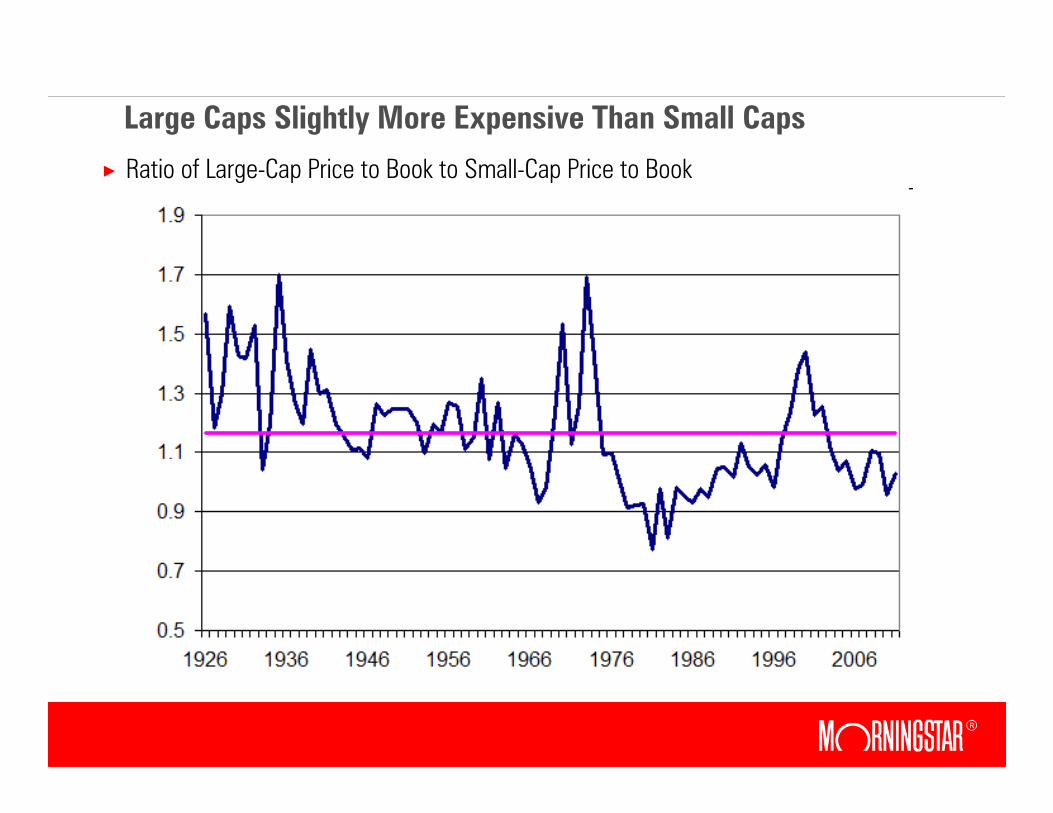
Large Caps Slightly More Expensive Than Small Caps
× Ratio of Large-Cap Price to Book to Small-Cap Price to Book

Large Caps Trade at a Lower Price to Earnings Ratio
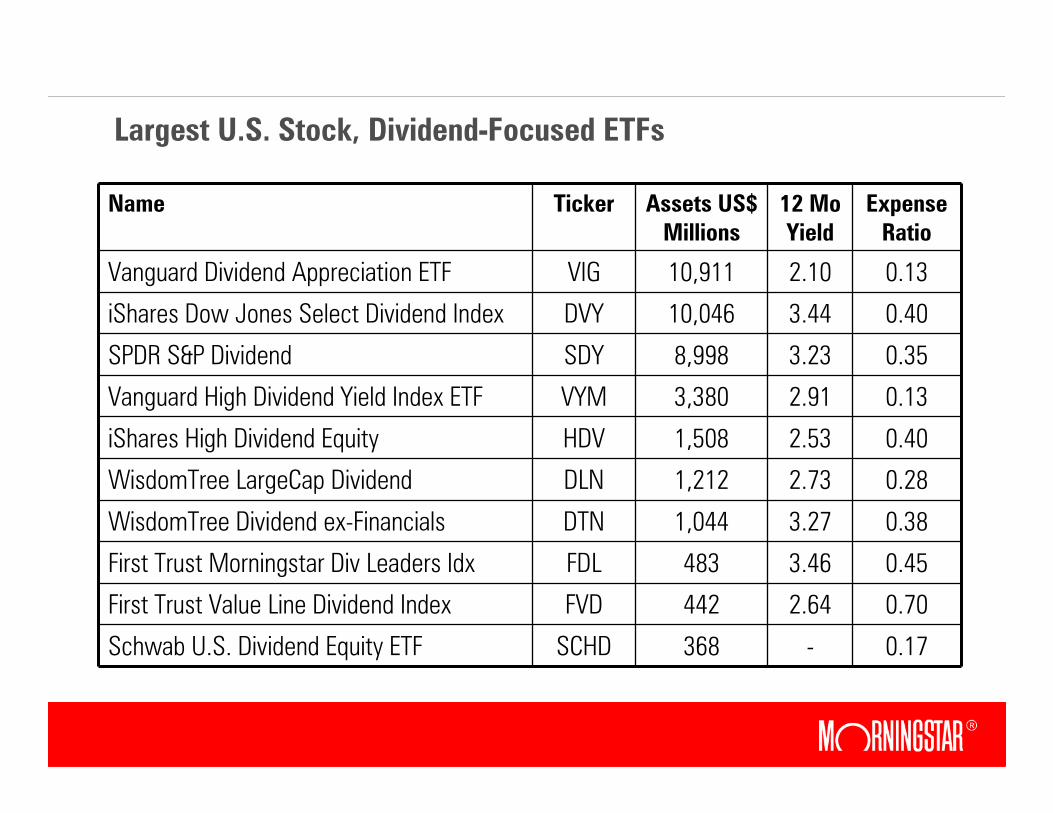
Largest U.S. Stock, Dividend-Focused ETFs
Name Ticker Assets US$ Millions
12 Mo Yield
Expense Ratio
Vanguard Dividend Appreciation ETF VIG 10,911 2.10 0.13
iShares Dow Jones Select Dividend Index DVY 10,046 3.44 0.40
SPDR S&P Dividend SDY 8,998 3.23 0.35
Vanguard High Dividend Yield Index ETF VYM 3,380 2.91 0.13
iShares High Dividend Equity HDV 1,508 2.53 0.40
WisdomTree LargeCap Dividend DLN 1,212 2.73 0.28
WisdomTree Dividend ex-Financials DTN 1,044 3.27 0.38
First Trust Morningstar Div Leaders Idx FDL 483 3.46 0.45
First Trust Value Line Dividend Index FVD 442 2.64 0.70
Schwab U.S. Dividend Equity ETF SCHD 368 - 0.17
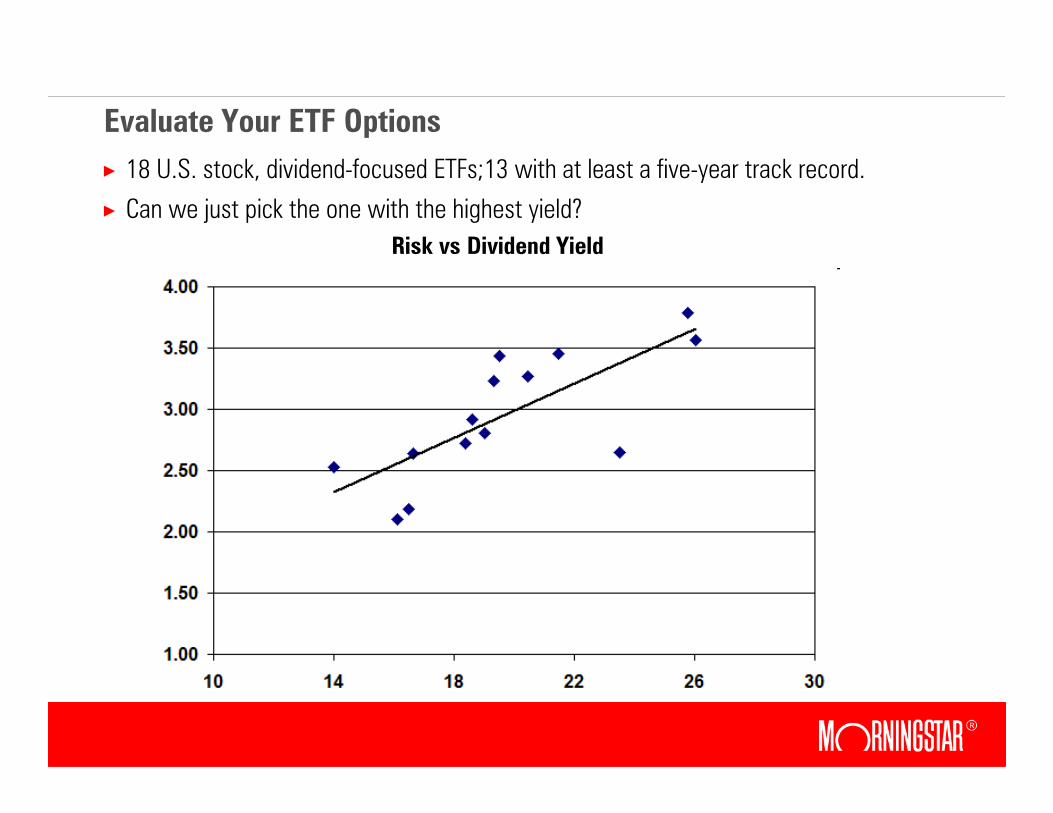
Evaluate Your ETF Options
× 18 U.S. stock, dividend-focused ETFs;13 with at least a five-year track record.
× Can we just pick the one with the highest yield?
Risk vs Dividend Yield
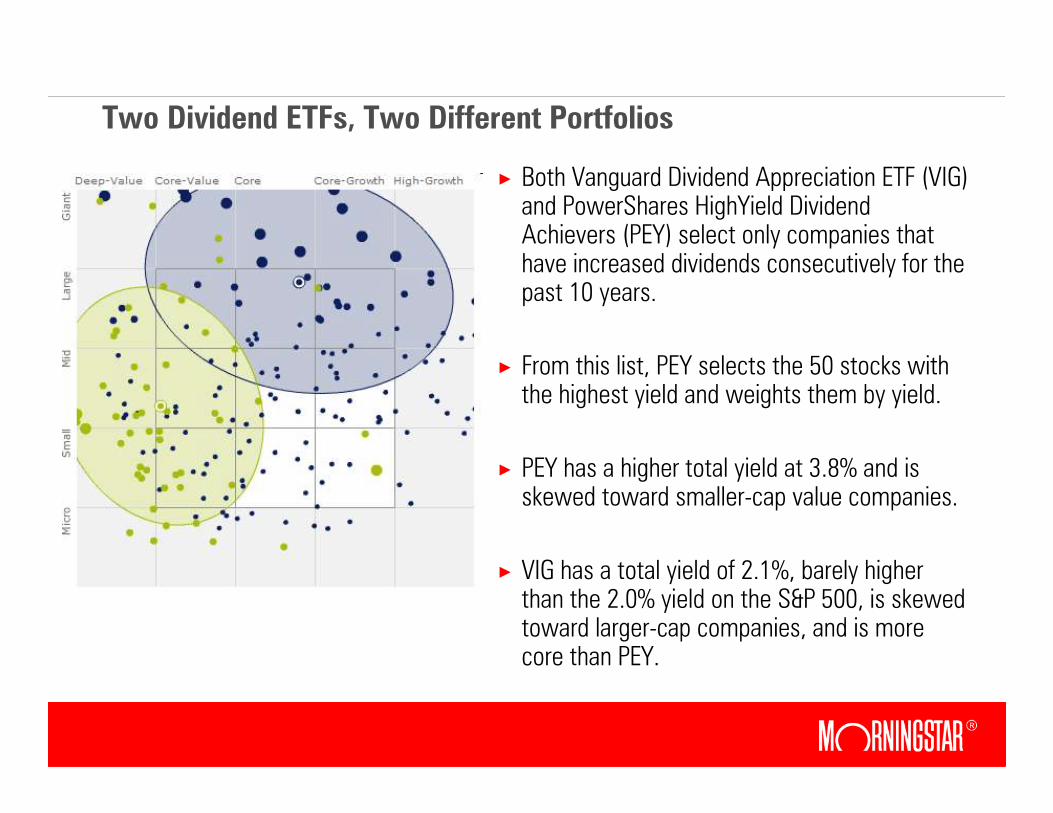
Two Dividend ETFs, Two Different Portfolios
× Both Vanguard Dividend Appreciation ETF (VIG) and PowerShares HighYield Dividend Achievers (PEY) select only companies that have increased dividends consecutively for the past 10 years.
× From this list, PEY selects the 50 stocks with the highest yield and weights them by yield.
× PEY has a higher total yield at 3.8% and is skewed toward smaller-cap value companies.
× VIG has a total yield of 2.1%, barely higher than the 2.0% yield on the S&P 500, is skewed toward larger-cap companies, and is more core than PEY.

Matching Our Thesis
Inclusion criteria Increased dividends for 10 50 highest-yielding stocks that
consecutive years increased dividends for 10
consecutive years
Weighting Scheme Market-cap Yield
Dividend Yield 2.1% 3.8%
% Wide Moat 58% 8%
5 year Std Dev 16% 26%
5 Year Return 1.6% -6.4%
Avg. Mkt Cap ($Bil) $41 Billion $4 Billion
PowerShares HighYield Dividend Achievers (PEY)
Vanguard Dividend Appreciation ETF (VIG)
Source: Morningstar Direct

Evaluating the ETF Options: Sector Exposure
× Firms that are able to generate stable, repeat business are often able to consistently raise dividends. McDonald’s, Pepsi, and Coca-Cola are top 10 holdings of VIG.
× PEY has a skew toward more value-orientated sectors such as Financial Services and Utilities, sectors that typically have large dividend payouts.
× PEY had 61% of assets in Financials in 2007, right before the crash, compared with 19% for VIG.
VIG PEY
Energy 11 2
Consumer Cyclical 13 4
Consumer Defensive 26 16
Basic Materials 7 5
Financial Services 6 24
Utilities 1 34

Nuts and Bolts: Index Construction
× SDY 60 stocks from the S&P 1500, weighted by yield, that have increased dividends consecutively for 25 years.
× DVY 100 companies from the Dow Jones U.S. Index weighted by dividend per share (not total dividends, as in some WisdomTree funds) that have passed some quality screens. The odd weighting scheme results in a mid-cap tilt and large percent ownership stakes of a handful of companies (the fund owns 12% of the outstanding shares of tobacco company Universal UVV).
× VYM Market-cap weights the highest-yielding stocks that have paid a dividend in the past year, resulting in a diversified list of 439 stocks.
× HDV Sorts eligible companies by yield, and the 75 highest yielding are weighted by contribution to total dividends paid. Eligibility is based on a qualitative (moat rating) and a quantitative (distance to default) screen.

International Equity Dividend ETFs: Also Tilt Toward Value
U.S. Dividend ETFs Style Map International Dividend ETFs Style Map
× Dividend-yield weighted (iShares DJ Select Div, SPDR S&P Div, PowerShares Div Achievers) has more mid- and small-cap exposure; dividend-weighted (WisdomTree) has more large-cap exposure.
× International dividend ETFs are very overweight telecoms and utilities.
Source: Morningstar Direct
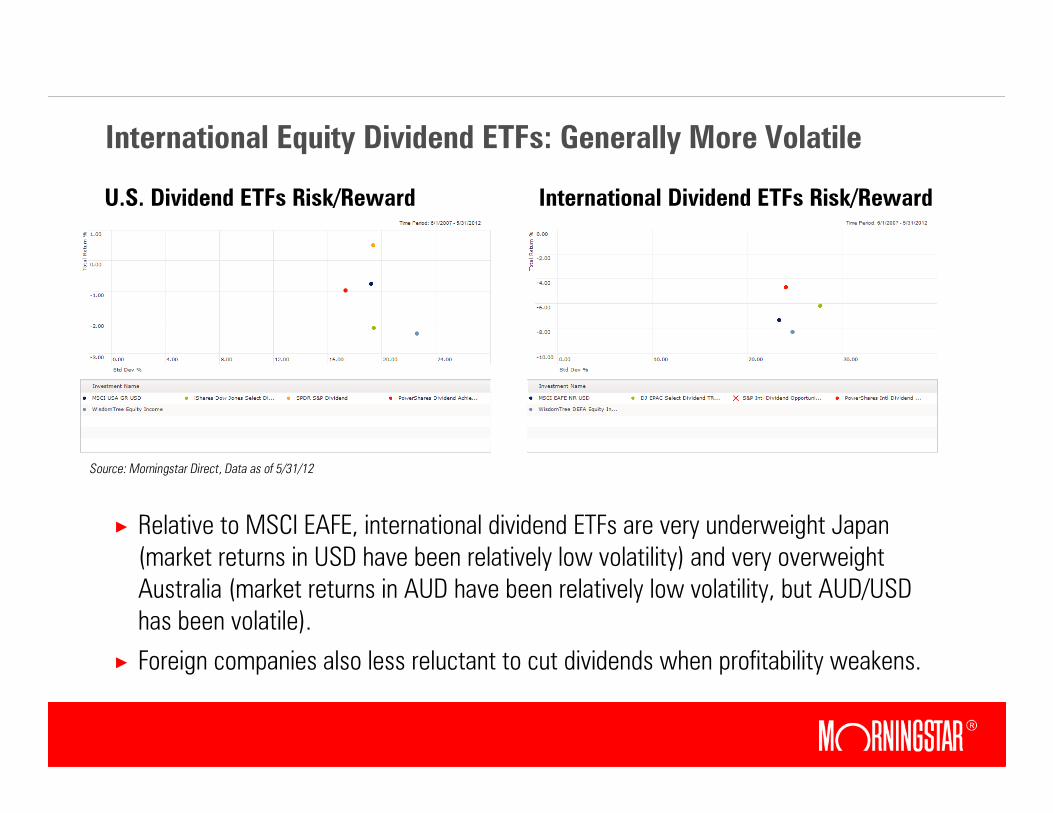
International Equity Dividend ETFs: Generally More Volatile
U.S. Dividend ETFs Risk/Reward International Dividend ETFs Risk/Reward
× Relative to MSCI EAFE, international dividend ETFs are very underweight Japan (market returns in USD have been relatively low volatility) and very overweight Australia (market returns in AUD have been relatively low volatility, but AUD/USD has been volatile).
× Foreign companies also less reluctant to cut dividends when profitability weakens.
Source: Morningstar Direct, Data as of 5/31/12
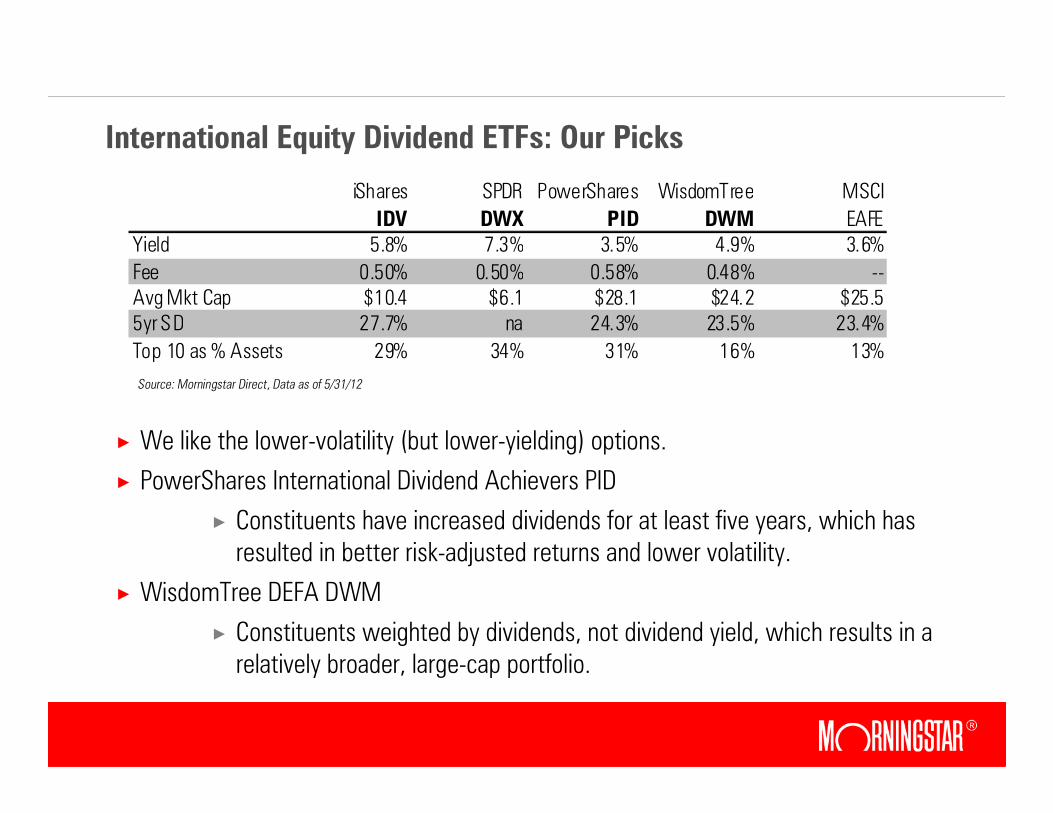
International Equity Dividend ETFs: Our Picks
× We like the lower-volatility (but lower-yielding) options.
× PowerShares International Dividend Achievers PID
× Constituents have increased dividends for at least five years, which has resulted in better risk-adjusted returns and lower volatility.
× WisdomTree DEFA DWM
× Constituents weighted by dividends, not dividend yield, which results in a relatively broader, large-cap portfolio.
iShares SPDR PowerShares WisdomTree MSCI
IDV DWX PID DWM EAFEYield 5.8% 7.3% 3.5% 4.9% 3.6%
Fee 0.50% 0.50% 0.58% 0.48% --Avg Mkt Cap $10.4 $6.1 $28.1 $24.2 $25.55yr SD 27.7% na 24.3% 23.5% 23.4%
Top 10 as % Assets 29% 34% 31% 16% 13%
Source: Morningstar Direct, Data as of 5/31/12
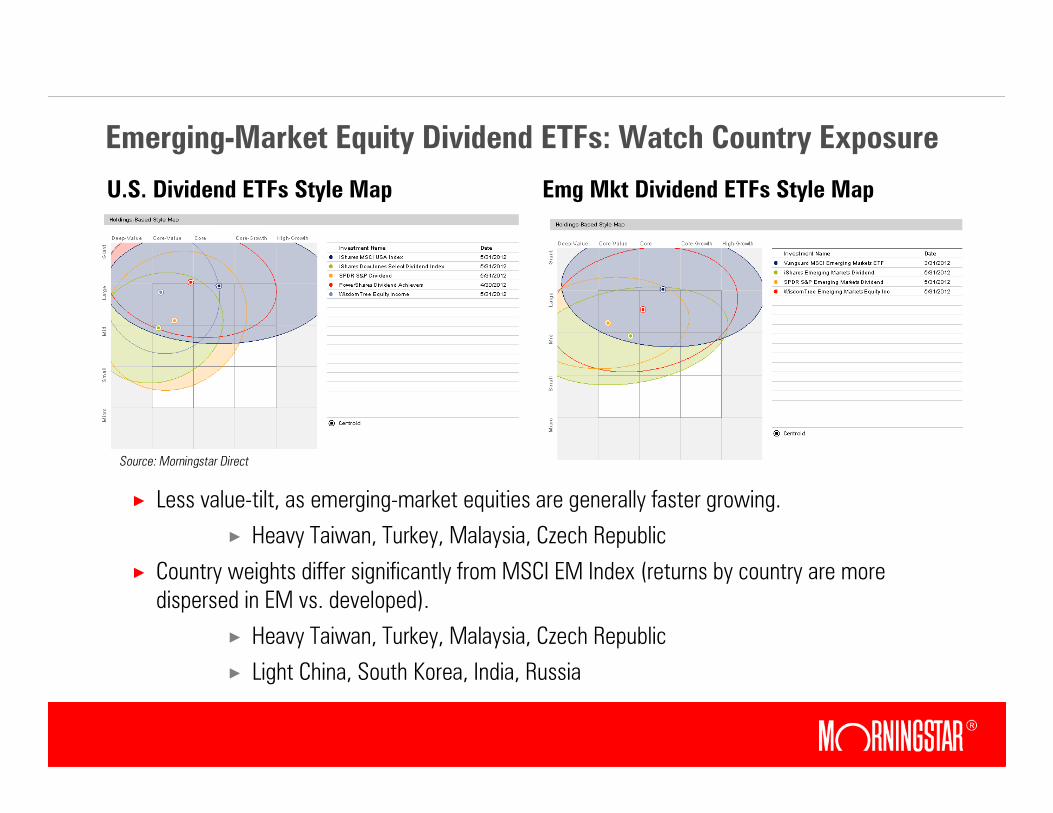
Emerging-Market Equity Dividend ETFs: Watch Country Exposure
U.S. Dividend ETFs Style Map Emg Mkt Dividend ETFs Style Map
× Less value-tilt, as emerging-market equities are generally faster growing.
× Heavy Taiwan, Turkey, Malaysia, Czech Republic
× Country weights differ significantly from MSCI EM Index (returns by country are more dispersed in EM vs. developed).
× Heavy Taiwan, Turkey, Malaysia, Czech Republic
× Light China, South Korea, India, Russia
Source: Morningstar Direct

EM Equity Dividend ETFs: Better Risk-Adjusted Returns
U.S. Dividend ETFs Risk/Reward EM Dividend ETFs Risk/Reward
× Significantly better risk-adjusted returns over the last five years suggests that dividends may be a good screen for corporate governance and quality in EM.
× Relative to cap-weighted, dividend ETFs have greater exposure to entrepreneurialcompanies leveraged to domestic growth trends.
× Cap-weighted funds tend to be overweight government-owned entities, which at times may put political goals ahead of shareholders.
Source: Morningstar Direct, Data as of 5/31/12
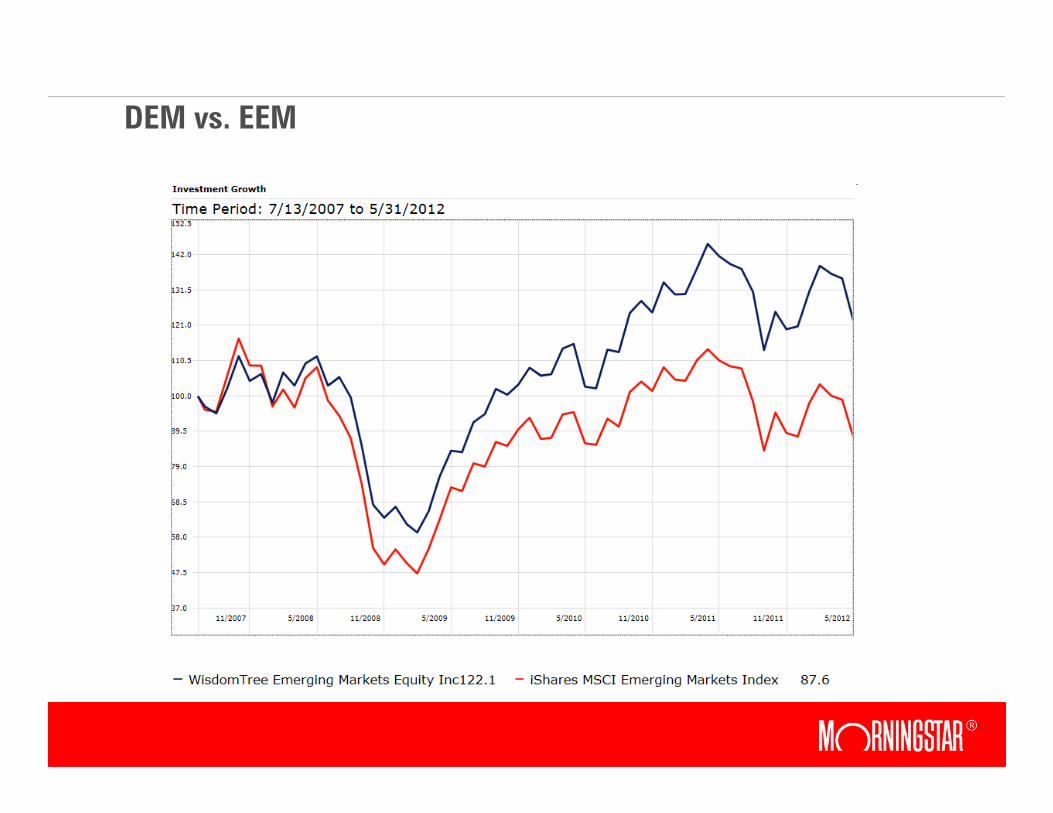
DEM vs. EEM

EM Equity Dividend ETFs: Our Picks
× WisdomTree Emerging Markets Equity Income DEM
× Suitable as a core holding and our pick over an MSCI EM Index tracker.
× WisdomTree Emerging Markets Small Cap Dividend DGS
× Although this is a small-cap fund, it is slightly less volatile than the MSCI EM Index.
× Many holdings are well-known major players in their respective countries.
WisdomTree WisdomTree SPDR iShares MSCI
DEM DGS EDIV DVYE Emg Mkts
Yield 4.5% 3.8% 5.0% na 2.3%
Fee 0.63% 0.63% 0.59% 0.49% --
Avg Mkt Cap $9.0 $1.1 $5.3 $3.4 $16.55yr SD 24.7% 28.3% 28.4% na 30.0%
Top 10 as % Assets 25% 9% 33% 21% 16%Source: Morningstar Direct, Data as of 5/31/12

Low Volatility ETFs
ETF Ticker Estimated Yield Expense Ratio
PowerShares S&P 500 Low Volatility SPLV 3.12% 0.25%
iShares MSCI USA Min Volatility USMV 2.93% 0.15%
Russell 1000 Low Volatility ETF LVOL 2.56% 0.20%

Low Volatility ETFs

Current Interest Rates Can Go Lower
× U.S. yields are at historical lows.
× The Japanese experience is an example of how low rates can go.
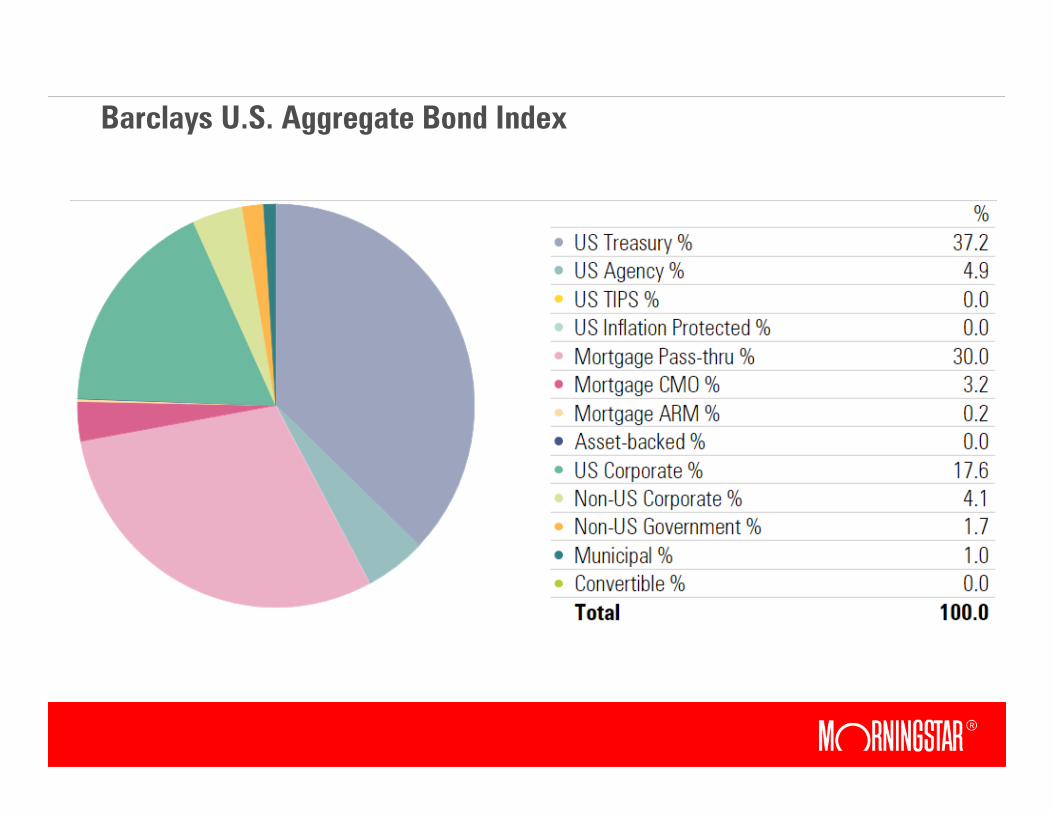
Barclays U.S. Aggregate Bond Index

Alternate Bond Portfolio: Break Up the Agg Bond
Name TickerExpense
RatioYield to Maturity Duration
Portfolio Allocation
iShares Barclays 3-7 Year Treasury Bond IEI 0.15% 0.7% 4.5 15%
iShares Barclays TIPS Bond TIP 0.20% 1.3% 8.0 15%
iShares Barclays MBS Bond MBB 0.31% 1.4% 1.8 25%
iShares iBoxx $ Invest Grade Corporate Bond LQD 0.15% 3.6% 7.6 25%
WisdomTree Emerging Markets Local Debt ELD 0.55% 5.2% 4.4 10%
PowerShares Fundamental High Yield Corp Bd PHB 0.50% 6.0% 4.0 10%
Alternate Portfolio 0.27% 2.7% 5.1
iShares Barclays US Aggregate Bond AGG 0.22% 1.6% 4.5

Bond Sector ComparisonBarclays US Aggregate Bond
Alternate Bond Portfolio
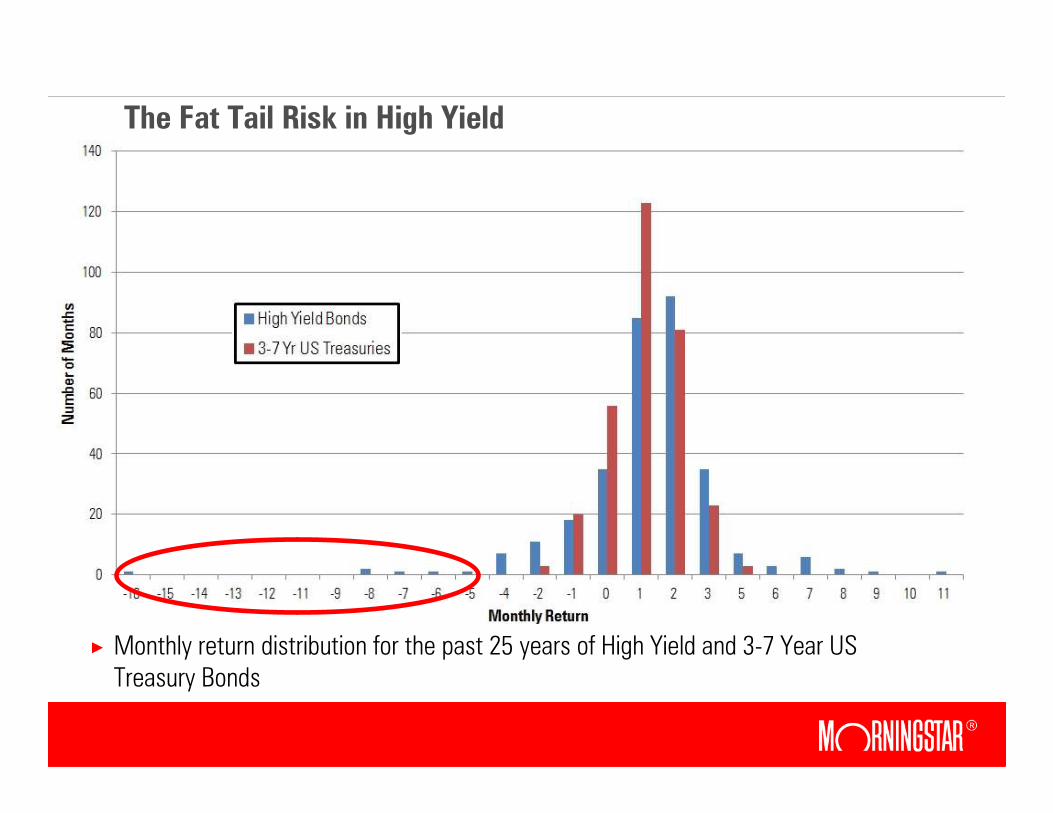
The Fat Tail Risk in High Yield
× Monthly return distribution for the past 25 years of High Yield and 3-7 Year US Treasury Bonds
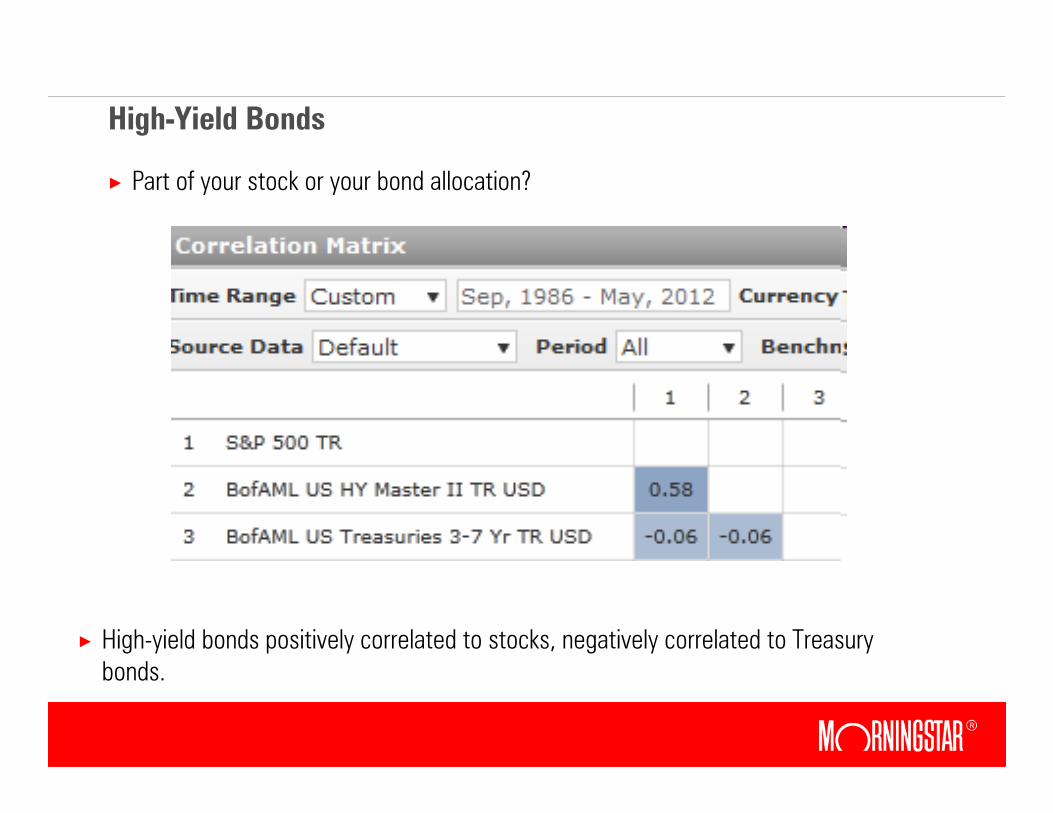
High-Yield Bonds
× Part of your stock or your bond allocation?
× High-yield bonds positively correlated to stocks, negatively correlated to Treasury bonds.

High-Yield Bonds… Risk-Adjusted Returns Not That Appealing
High-Yield Bonds 3-7 Yr US Treasuries
Annual Returns 8.84% 6.87%
Standard Deviation 8.57% 4.16%
Sharpe Ratio 0.58 0.72
× Sharpe ratio for high-yield bonds not as appealing as Treasuries.
× Simply put, high-yield bonds are more tactical than strategic.

Floating Rate Bank Loans
× PowerShares Senior Loan Portfolio (BKLN) is the only ETF in the bank-loan category.
× Bank loans are below investment grade debt where the interest rate resets on a regular basis.
× Investors are attracted to bank-loan products when they feel that interest rates will rise in the near future.
Monthly Net Fund Flow
Local Currency Emerging-Market Bonds
× Attractive opportunity to diversify your fixed-income currency exposure.
× As a claim on the tax revenues of entire countries, this provides one of the few pure investments in emerging-market GDP growth regardless of what firms win in the end.
× With a diversified basket of bonds in countries with strong growth and current account surpluses, currency effects should provide a tailwind.
× Even countries that nationalized companies from under foreign minority investors have been loath to default on sovereign bonds thus far.

Lower Debt and Higher Growth in Emerging-Market Countries
0%
20%
40%
60%
80%
100%
0.0% 2.0% 4.0% 6.0% 8.0% 10.0%
Expected Real GDP Growth (2009-2015)
Gov
ernm
ent
Gro
ss D
ebt
/ G
DP (20
10)
Advanced Emerging
Source: IMF World Economic Outlook, Oct. 2010

ETF Picks in Emerging-Market Bonds
× PowerShares Emerging Markets Sovereign Debt PCY
× Owns a diversified basket of U.S. dollar-denominated sovereign debt. PCY is ideal for investors who are bullish on the dollar or are looking for lower volatility exposure.
× Portfolio is equal-weighted by country.
× WisdomTree Emerging Markets Local Debt ELD
× Owns a diversified basket of local currency sovereign debt.
× As an active strategy, the portfolio is tilted toward countries pursuing monetary and fiscal discipline and reduces allocations to those “living beyond their means.”

Multiasset ETFs: A Diversified Approach to Income
× Goals of multiasset income funds:
× High income—currently around 5%.
× Long-term capital appreciation.
× Preservation of principal through diversification and lower volatility.
× Can invest in:
× U.S. and foreign dividend-paying equities, REITs, MLPs, high-yield bonds, and emerging-market debt.
× There are currently five ETF options:
× These funds can be very different depending on their fixed-income exposure; can be classified as an allocation fund or an equity fund.
× While a multiasset approach can provide diversification benefits, investors should note that REITs, MLPs, high-yield debt, as well as U.S. equities all declined more than 30% in 2008.
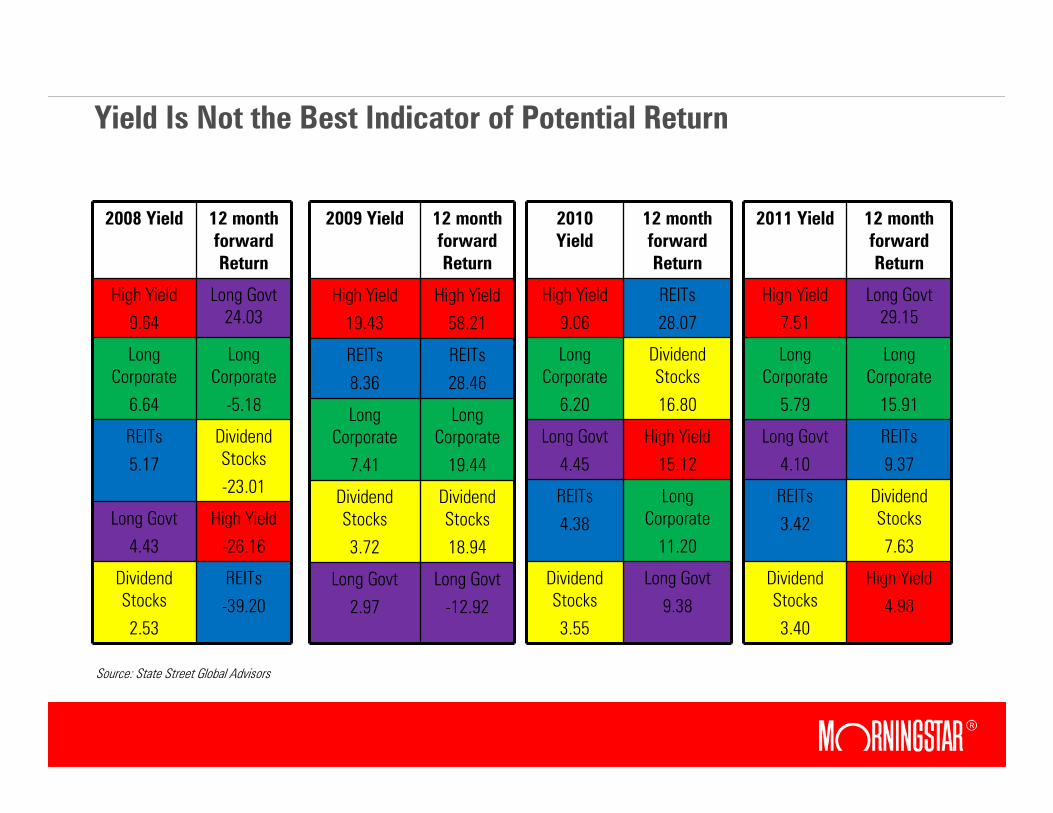
Yield Is Not the Best Indicator of Potential Return
2008 Yield 12 month forward Return
High Yield
9.64
Long Govt 24.03
Long Corporate
6.64
Long Corporate
-5.18
REITs
5.17
Dividend Stocks
-23.01
Long Govt
4.43
High Yield
-26.16
Dividend Stocks
2.53
REITs
-39.20
2011 Yield 12 month forward Return
High Yield
7.51
Long Govt 29.15
Long Corporate
5.79
Long Corporate
15.91
Long Govt
4.10
REITs
9.37
REITs
3.42
Dividend Stocks
7.63
Dividend Stocks
3.40
High Yield
4.98
2009 Yield 12 month forward Return
High Yield
19.43
High Yield
58.21
REITs
8.36
REITs
28.46
Long Corporate
7.41
Long Corporate
19.44
Dividend Stocks
3.72
Dividend Stocks
18.94
Long Govt
2.97
Long Govt
-12.92
2010 Yield
12 month forward Return
High Yield
9.06
REITs
28.07
Long Corporate
6.20
Dividend Stocks
16.80
Long Govt
4.45
High Yield
15.12
REITs
4.38
Long Corporate
11.20
Dividend Stocks
3.55
Long Govt
9.38
Source: State Street Global Advisors

Multiasset ETFs: Different Structures
× Some are ETFs of ETFs
× iShares Morningstar Multi-Asset Income (IYLD)
• A conservative allocation fund that tracks an optimized index.
× SPDR SSgA Income Allocation (INKM)
• Actively managed by SSgA’s Investment Solutions Group.
× Some hold a portfolio of securities
× Guggenheim Multi-Asset Income (CVY)
× Guggenheim International Multi-Asset Income (HGI)
× Arrow Dow Jones Global Yield (GYLD)
• Dividends paid by these ETFs maintain their tax treatment, so distributions
from REITs and MLPs can be classified as return of capital.
• MLP holdings will also not generate K-1 statements to ETF shareholders.
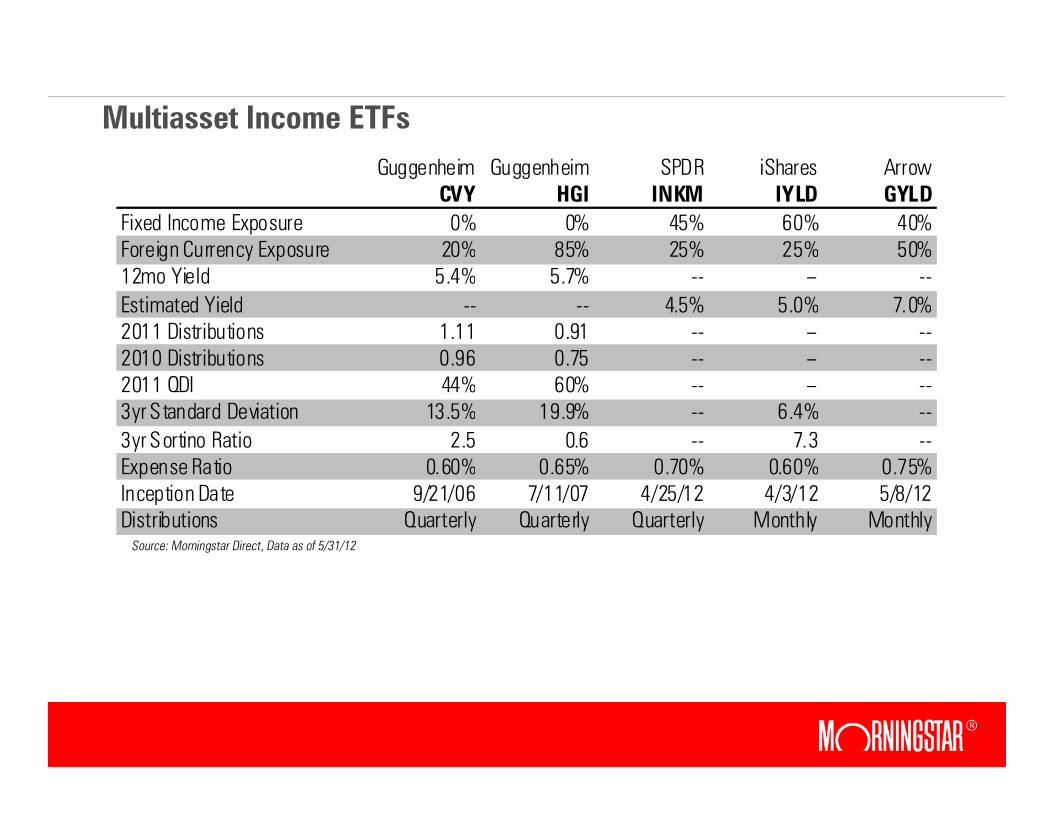
Multiasset Income ETFs
Source: Morningstar Direct, Data as of 5/31/12
Guggenheim Guggenheim SPDR iShares Arrow
CVY HGI INKM IYLD GYLD
Fixed Income Exposure 0% 0% 45% 60% 40%
Foreign Currency Exposure 20% 85% 25% 25% 50%
12mo Yield 5.4% 5.7% -- -- --
Estimated Yield -- -- 4.5% 5.0% 7.0%2011 Distributions 1.11 0.91 -- -- --
2010 Distributions 0.96 0.75 -- -- --
2011 QDI 44% 60% -- -- --
3yr Standard Deviation 13.5% 19.9% -- 6.4% --
3yr Sortino Ratio 2.5 0.6 -- 7.3 --
Expense Ratio 0.60% 0.65% 0.70% 0.60% 0.75%
Inception Date 9/21/06 7/11/07 4/25/12 4/3/12 5/8/12Distributions Quarterly Quarterly Quarterly Monthly Monthly

Using ETFs for Income
Scott Burns
Director of ETF, Closed-End Funds, and Alternatives
Morningstar
Questions?