using excel to build understanding in a pathways course
TRANSCRIPT

Using Excel to Build Understanding in a Pathways Course
Kathleen Almy & Heather Foes
Rock Valley CollegeRockford, Illinois

Keurig vs. Starbucks
Suppose you buy a venti latte every day at Starbucks. Is it worth it to buy a Keurig and make your own coffee at home?
Estimate how many days you would need to make your own coffee at home to recover the cost of the Keurig, assuming you use one K-cup per day. How much will you spend on coffee for that number of days?

Keurig vs. Starbucks: Algebraic approach
Assumptions:
Each latte is $3.57 plus 8% sales tax.
The Keurig you are interested in costs $99 and the coffee K-cups are about $16.49 for a 24-pack.
Cost at Starbucks = 3.57(1.08)n n = number of days
Cost with Keurig = 99 + (16.49/24)n
3.57(1.08)n = 99 + 0.69n
n ≈ 32 days

Keurig vs. Starbucks: Numeric Approach
Suppose you buy a venti latte every day at Starbucks for $3.57 plus 8% sales tax. Is it worth it to buy a Keurig and make your own coffee at home? Suppose the Keurig you are interested in costs $99 and the coffee K-cups are about $16.49 for a 24-pack.
Cost at Starbucks: 3.57(1.08)= $3.86/day
Cost with Keurig: Start at $99 and add $0.69/day
Compare costs with graphs and tables in Excel.

Keurig vs. Starbucks
$-
$20.00
$40.00
$60.00
$80.00
$100.00
$120.00
$140.00
0 2 4 6 8 10 12 14 16 18 20 22 24 26 28 30 32 34 36
Co
st
Days
Keurig vs. Starbucks
Keurig
Starbucks
Keurig vs. Starbucks
Takeaways:
Students can approach, and solve, this problem without algebra.
Students can be led from the numeric solution to an algebraic approach.
Using Excel shows the full story, not just the break-even point.

Why use a spreadsheet?
• Numeric approaches take advantage of how students naturally solve problems.
• Using algebra requires a level of generalization and abstraction many students are still developing at this level.
• Numeric and graphic approaches can be more accessible and illuminating. They are not necessarily simpler or inferior.
• Using a spreadsheet minimizes the number crunching and allows students to focus on making sense of the numbers.

Is a Hybrid Car Worth It?
You’re considering buying a 2015 Toyota Prius which starts around $25,000 and gets 50 mpg. A similarly equipped Honda Accord will run closer to $22,000 but will get 31 mpg. Can the Prius make up the price difference with its lower fuel costs? How long would it take?
$𝑠𝑎𝑣𝑒 = $𝑔𝑎𝑠 ∙ 𝐷𝑖𝑠𝑡𝑎𝑛𝑐𝑒 ∙1
𝐺𝑀𝑛𝑜𝑤−
1
𝐺𝑀𝑖𝑚𝑝𝑟𝑜𝑣𝑒𝑑

Hybrid Car: Algebraic Approach
Assumptions: Current gas price is $2.25/gallon
$𝑠𝑎𝑣𝑒 = $𝑔𝑎𝑠 ∙ 𝐷𝑖𝑠𝑡𝑎𝑛𝑐𝑒 ∙1
𝐺𝑀𝑛𝑜𝑤−
1
𝐺𝑀𝑖𝑚𝑝𝑟𝑜𝑣𝑒𝑑
$3,000 = $2.25 ∙ 𝐷𝑖𝑠𝑡𝑎𝑛𝑐𝑒 ∙1
31−
1
50
3,000 = 0.02758 ∙ 𝐷𝑖𝑠𝑡𝑎𝑛𝑐𝑒
𝐷𝑖𝑠𝑡𝑎𝑛𝑐𝑒 ≈108,772 miles
If you drive 1,500 miles per month, this would take over 6 years.

Hybrid Car: Numeric Approach
You’re considering buying a 2015 Toyota Prius which starts around $25,000 and gets 50 mpg. A similarly equipped Honda Accord will run closer to $22,000 but will get 31 mpg. Can the Prius make up the price difference with its lower fuel costs? How long would it take?
Assumptions: Current gas price is $2.25/gallon
Prius: Start at $25,000 and add cost of gas times number of miles
divided by mileage→ $25,000 + $2.25 ∗𝑚𝑖𝑙𝑒𝑠
50 𝑚𝑝𝑔
Accord: Start at $22,000 and add cost of gas times number of miles
divided by mileage → $22,000 + $2.25 ∗𝑚𝑖𝑙𝑒𝑠
31 𝑚𝑝𝑔

Hybrid Car

Hybrid Car
Takeaways:
Students have some real-world experience and intuition they can bring to this problem if you let them.
You can bridge from the numeric approach to the algebraic approach.
The numeric approach can be used to generate the formula and discuss the factored form as well.

Hybrid Car: A related problem
You are considering buying a new hybrid vehicle but are concerned that the benefits might not outweigh the cost. How efficient would the hybrid need to be in order to make up a $5,000 price difference if the standard vehicle gets 25 mpg? Assume gas costs $2.25/gallon.
$5,000 = $2.25 ∙ 𝐷𝑖𝑠𝑡𝑎𝑛𝑐𝑒 ∙1
25−
1
𝐺𝑀𝑖𝑚𝑝𝑟𝑜𝑣𝑒𝑑
Can beginning algebra students solve this algebraically?
Can beginning algebra students solve this numerically with a spreadsheet?

Hybrid Car $5,000 = $2.25 ∙ 𝐷𝑖𝑠𝑡𝑎𝑛𝑐𝑒 ∙1
25−
1
𝐺𝑀𝑖𝑚𝑝𝑟𝑜𝑣𝑒𝑑
0.0
50.0
100.0
150.0
200.0
250.0
300.0
350.0
20 40 60 80Y
ears
New MPG
Years needed to reach $5000
5,000 miles/year
7,500 miles/year
10,000 miles/year

Sierpinski Triangles
Assume the first triangle has an area of 1 square unit.
What happens to the area of the green portion as the number of green triangles increase?

Sierpinski Triangles: Algebraic approach
Find the area of the first four triangles. Generalize the area of the nth triangle.
In general:
9 square units
16
3 square units
4
27 square units
641 square unit
13
square units4
n

Sierpinski Triangles: Numeric approach
Find the area of the first four triangles. Use Excel to compute successive areas. Observe the pattern as more green triangles are created.
9 square units
16
3 square units
4
27 square units
641 square unit

Sierpinski Triangles

Sierpinski Triangles
Assume the first triangle has a perimeter of 3 units.
What happens to the total perimeters of the green portions as the number of green triangles increases?

Sierpinski Triangles: Algebraic approach
Find the perimeters of the green portions of the first four triangles. Generalize the perimeter of the green portion of the nth triangle.
In general:
27 units
4
9 units
2
81 units
83 units
1
3units
2
n
n

Sierpinski Triangles: Numeric approach
Find the perimeters of the green portions of the first four triangles. Use Excel to compute successive perimeters. Observe the pattern as more green triangles are created.
27 units
4
9 units
2
81 units
83 units

Sierpinski Triangles

Sierpinski Triangles
Takeaways: The problem of analyzing the patterns of the areas and perimeters is more accessible with a spreadsheet than with algebra.Students can gain insight into geometric sequences with the numeric approach. This knowledge helps later with exponential functions.

Projecting Ebola in September 2014
From the NPR article: A Frightening Curve: How Fast Is The Ebola Outbreak Growing?
"It's spreading and growing exponentially," President Obama said Tuesday.
Right now we've had more than 5,000 cases of Ebola, and at least 2,600 people have died.
Five thousand cases of Ebola is bad; 10,000 to 25,000 is unbelievable.
And with this outbreak, cases are doubling every three to four weeks.
So if help doesn't arrive in time — and the growth rate stays the same — then 15,000 Ebola cases in mid-October could turn into 30,000 cases by mid-November, and 60,000 cases by mid-December.

Projecting Ebola
Projecting Ebola: Algebraic approach
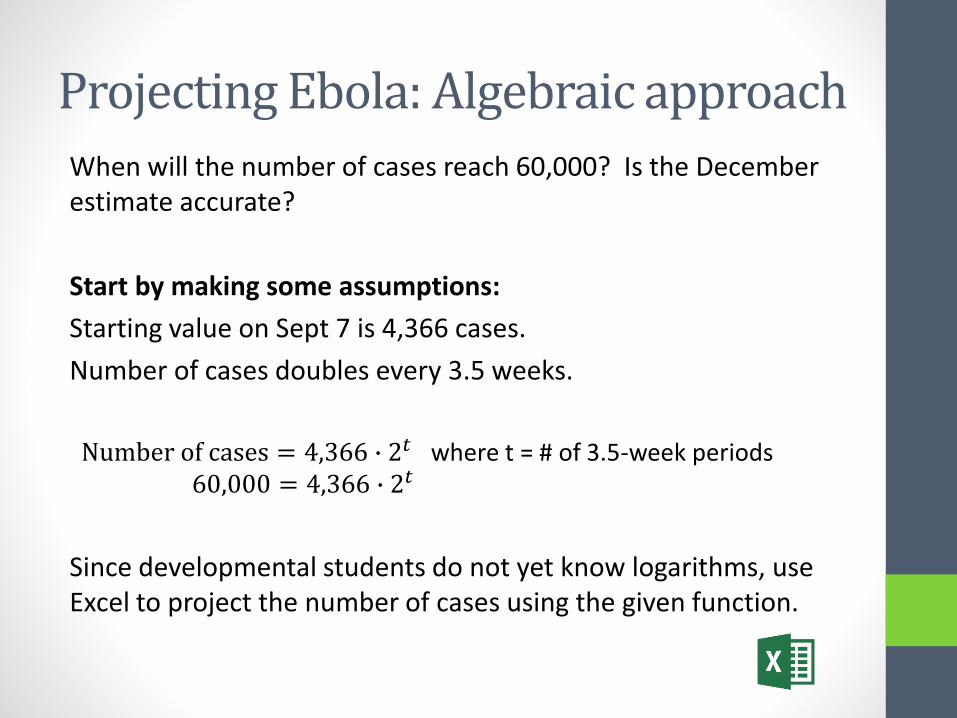
When will the number of cases reach 60,000? Is the December estimate accurate?
Start by making some assumptions:
Starting value on Sept 7 is 4,366 cases.
Number of cases doubles every 3.5 weeks.
Number of cases = 4,366 ∙ 2𝑡 where t = # of 3.5-week periods60,000 = 4,366 ∙ 2𝑡
Since developmental students do not yet know logarithms, use Excel to project the number of cases using the given function.

Projecting Ebola:Numeric Approach
t = 3.78 time periods of 3.5 weeks each or approximately 13 weeks
The December estimate is accurate.
Projecting Ebola
Takeaway: Using Excel gives developmental students a way to solve the problem and improve their understanding of exponential modeling.

Projecting EbolaNOTES:The CDC predicted 1.4 million cases by January 20, 2015. According to the World Health Organization, the number of cases in January was actually 21,000.The CDC used very intricate models incorporating many variables. They projected the worst-case scenario, which increased awareness and resources.
From The Economist: “For a start, the models relied on old and partial figures. These were plugged into equations whose key variable was the rate at which each case gave rise to others. But this “reproduction number” changed as outside help arrived and those at risk went out less, avoided physical contact and took precautions around the sick and dead. So difficult are such factors to predict that epidemiologists modelling a disease often assume that they do not change.
By presenting such grim projections, the experts arguably made it less likely that they would come to pass. One of their purposes, says Neil Ferguson, a member of the WHO’s Ebola response team, was “to wake up the world and say that this could be really bad if we don’t do anything”. They succeeded, and resources poured in. ”http://www.economist.com/news/international/21642242-why-projections-ebola-west-africa-turned-out-wrong-predictions-purpose at all.

Using Excel in traditional algebra exercises
Excel can illuminate the solution to a linear equation.
Solve the equation 2x – 8 = 5x – 17.

Using Excel in traditional algebra exercises
Excel can help students understand identities.
Solve the equation 2x – 8 = 2(x – 4).

Using Excel in traditional algebra exercises
Excel can help students use the slope to find more points on a line, including the y-intercept.
Problem: Find the equation of line passing through the points (3, 6) and (8, 31).
Find the slope and use it to fill up and down.
𝑚 =25
5=
5
1Identify the y-intercept. Write the equation: y = 5x – 9.
x y
3 6
8 31
-5
-4
-3
-2
-1
0
1
2
4
5
6
7
9
10
11
12
13
14
15
-1
+1
-34
-29
-24
-19
-14
-9
-4
1
-5
+5
11
16
21
26
36
41
46
51
56
61
66

Using Excel in traditional algebra exercises
Takeaway: Using Excel can help students develop a deeper understanding of algebraic exercises. It encourages students to move beyond mindless manipulations and instead make sense of the concepts involved.

Questions
