using excel to update demand forecasts in dynamix ax 2012 walkthrough
TRANSCRIPT
© 2013 Murray Fife. All rights reserved.
Using Excel
To Update
Demand Forecasts
Dynamics AX has an add-on for Microsoft Excel that allows you to retrieve data from Dynamics AX, and
also publish changes back to the database in a controlled way. You can use this to give users a simpler
way to manipulate the information in the database. As an example, you can use this to create a better
way to update demand forecasts, since the default maintenance forms within Dynamics AX.
In this walkthrough we will show how you can:
Build your initial forecast model
Link to your forecast within Excel
Create total matrix fields
Create period total matrix fields
Create summary forecast dashboards in PowerView
Building Your Initial Forecast Models
Before we start linking our forecasts to Excel, we need a base set of data to update, so we will start the
process by adding in some demand forecasts into Dynamics AX. After you have set these up, you
shouldn’t have to use the maintenance forms any more.
In this example we will show how to create some base demand forecast data.
HOW TO DO IT...
To build your initial forecast models, follow these steps:
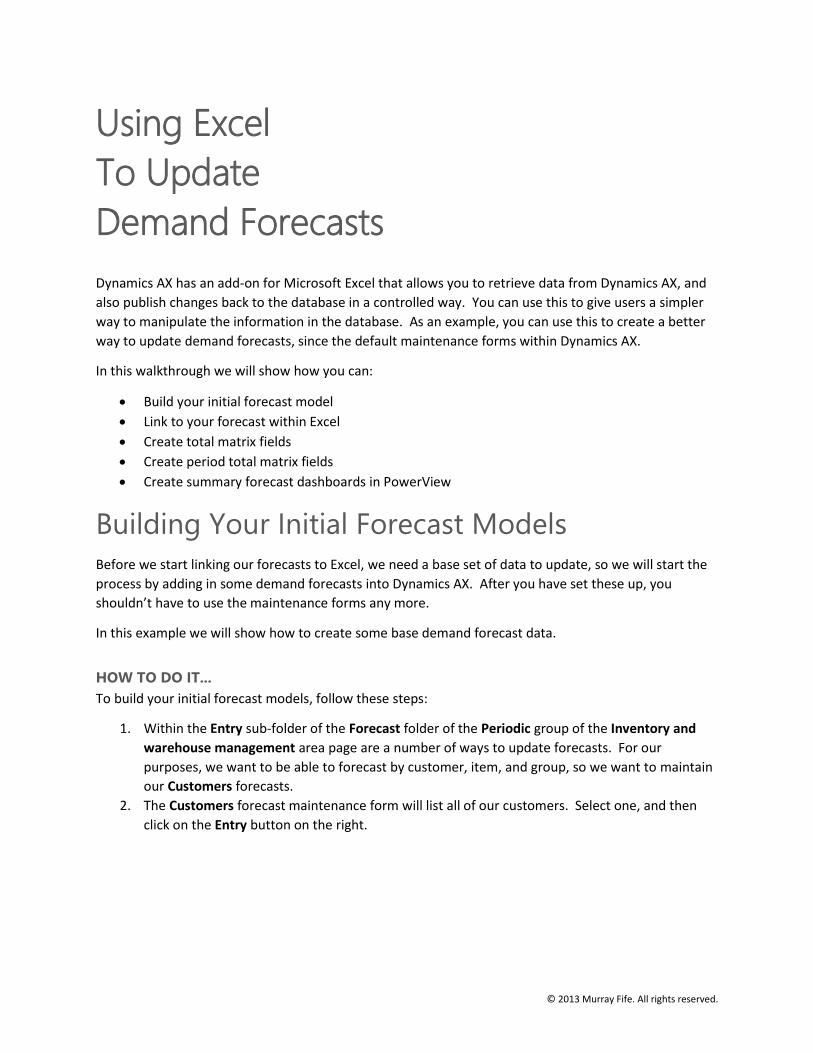
1. Within the Entry sub-folder of the Forecast folder of the Periodic group of the Inventory and
warehouse management area page are a number of ways to update forecasts. For our
purposes, we want to be able to forecast by customer, item, and group, so we want to maintain
our Customers forecasts.
2. The Customers forecast maintenance form will list all of our customers. Select one, and then
click on the Entry button on the right.
Configuring Costing & Cost Sheets
© 2013 Murray Fife. All rights reserved.
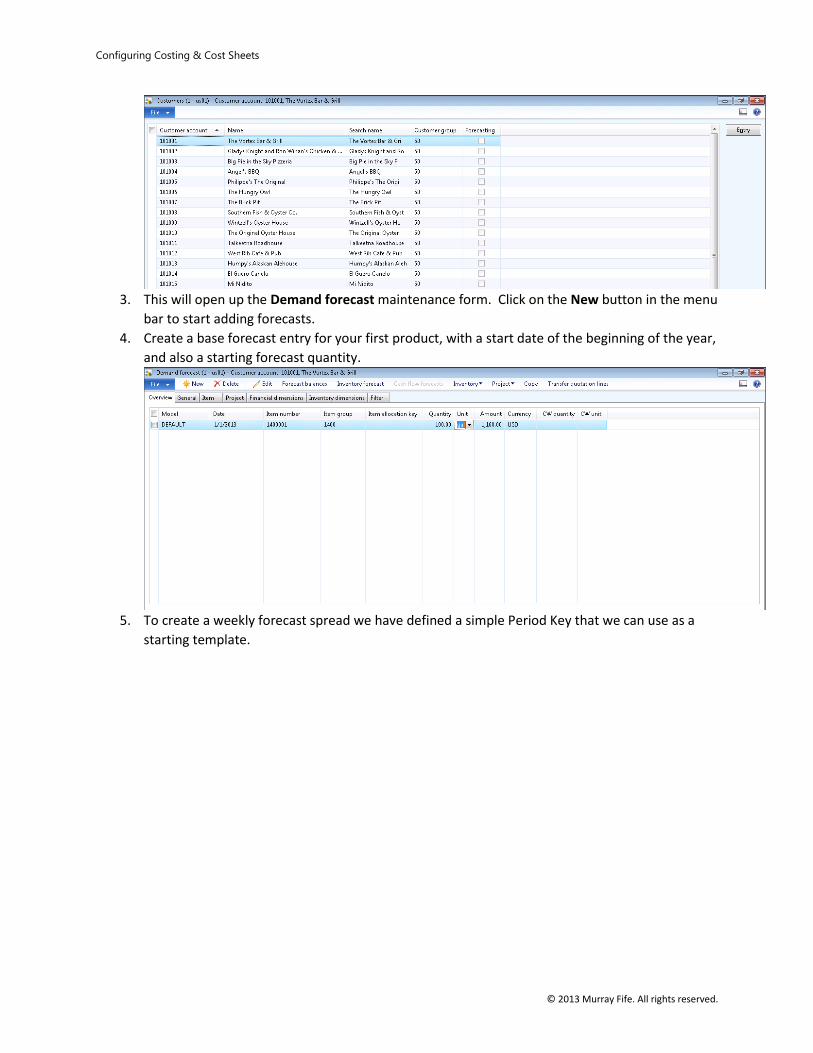
3. This will open up the Demand forecast maintenance form. Click on the New button in the menu
bar to start adding forecasts.
4. Create a base forecast entry for your first product, with a start date of the beginning of the year,
and also a starting forecast quantity.
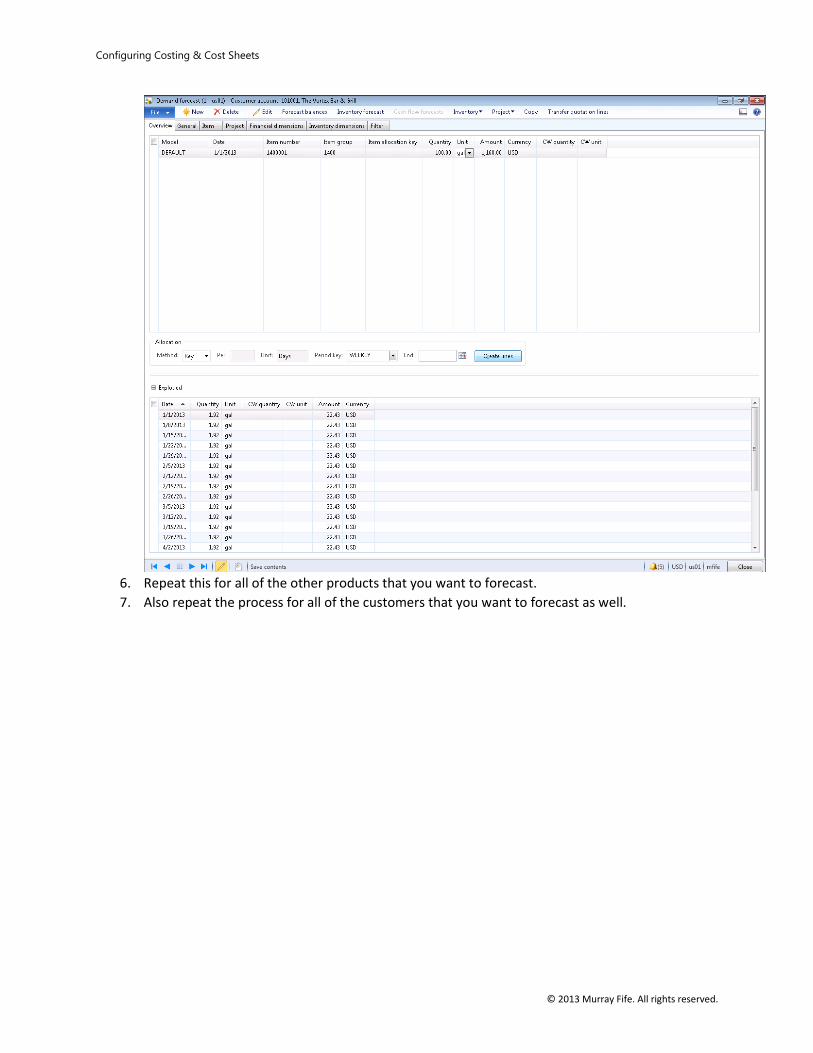
5. To create a weekly forecast spread we have defined a simple Period Key that we can use as a
starting template.
Configuring Costing & Cost Sheets
© 2013 Murray Fife. All rights reserved.
6. Repeat this for all of the other products that you want to forecast.
7. Also repeat the process for all of the customers that you want to forecast as well.
Configuring Costing & Cost Sheets
© 2013 Murray Fife. All rights reserved.
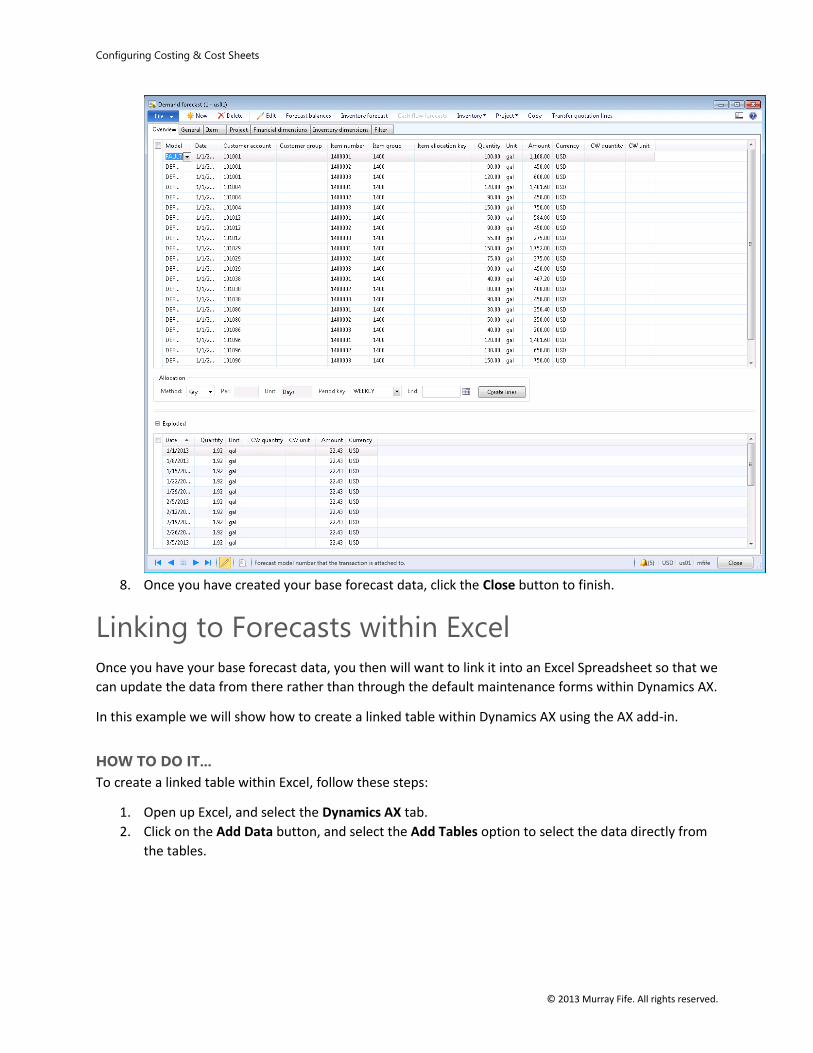
8. Once you have created your base forecast data, click the Close button to finish.
Linking to Forecasts within Excel
Once you have your base forecast data, you then will want to link it into an Excel Spreadsheet so that we
can update the data from there rather than through the default maintenance forms within Dynamics AX.
In this example we will show how to create a linked table within Dynamics AX using the AX add-in.
HOW TO DO IT...
To create a linked table within Excel, follow these steps:
1. Open up Excel, and select the Dynamics AX tab.
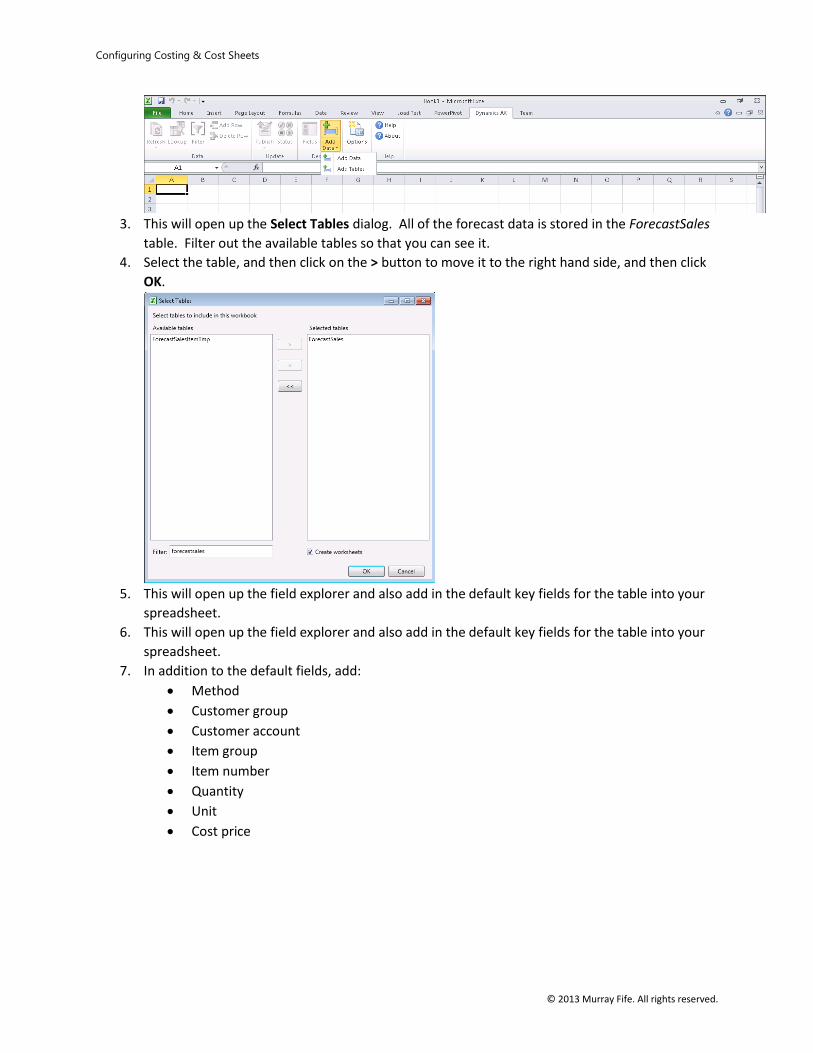
2. Click on the Add Data button, and select the Add Tables option to select the data directly from
the tables.
Configuring Costing & Cost Sheets
© 2013 Murray Fife. All rights reserved.
3. This will open up the Select Tables dialog. All of the forecast data is stored in the ForecastSales
table. Filter out the available tables so that you can see it.
4. Select the table, and then click on the > button to move it to the right hand side, and then click
OK.
5. This will open up the field explorer and also add in the default key fields for the table into your
spreadsheet.
6. This will open up the field explorer and also add in the default key fields for the table into your
spreadsheet.
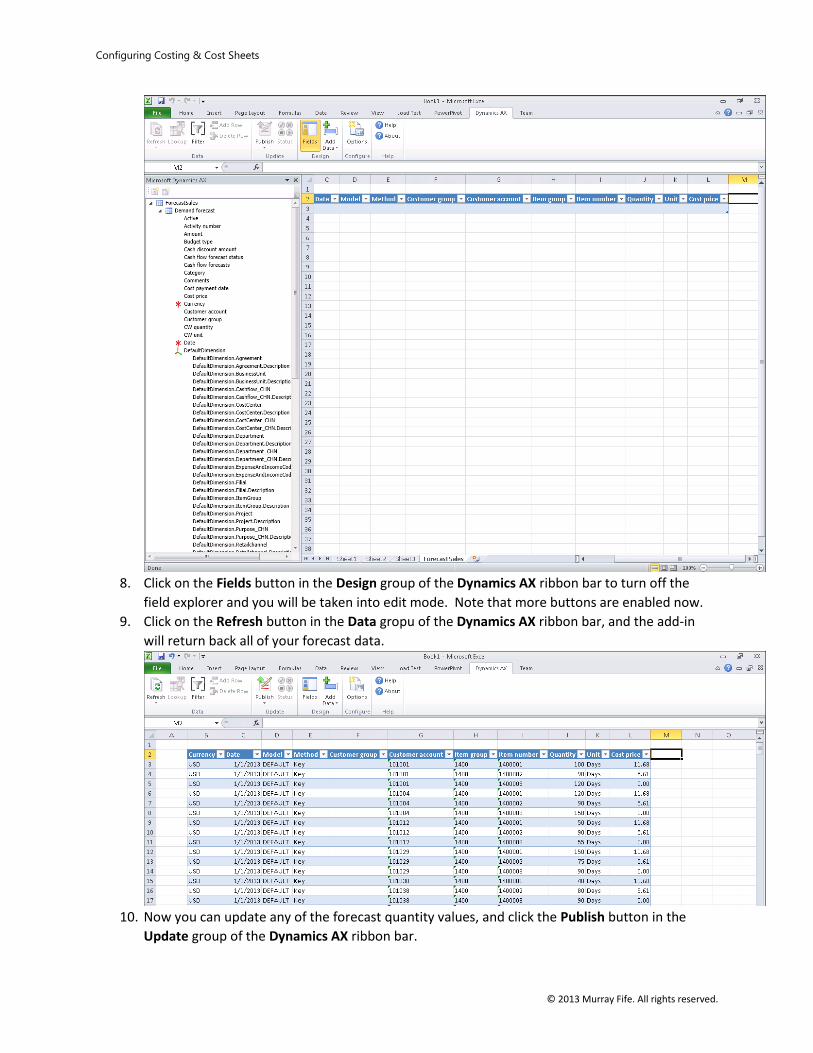
7. In addition to the default fields, add:
Method
Customer group
Customer account
Item group
Item number
Quantity
Unit
Cost price
Configuring Costing & Cost Sheets
© 2013 Murray Fife. All rights reserved.
8. Click on the Fields button in the Design group of the Dynamics AX ribbon bar to turn off the
field explorer and you will be taken into edit mode. Note that more buttons are enabled now.
9. Click on the Refresh button in the Data gropu of the Dynamics AX ribbon bar, and the add-in
will return back all of your forecast data.
10. Now you can update any of the forecast quantity values, and click the Publish button in the
Update group of the Dynamics AX ribbon bar.
Configuring Costing & Cost Sheets
© 2013 Murray Fife. All rights reserved.
HOW IT WORKS...
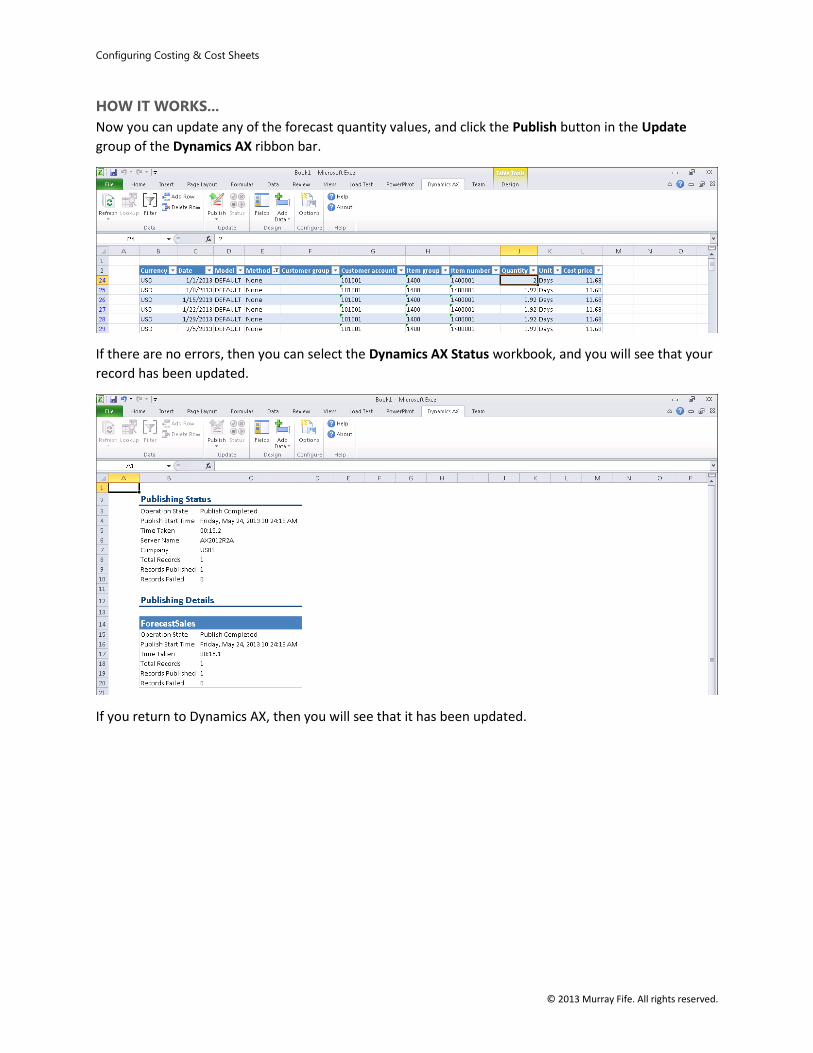
Now you can update any of the forecast quantity values, and click the Publish button in the Update
group of the Dynamics AX ribbon bar.
If there are no errors, then you can select the Dynamics AX Status workbook, and you will see that your
record has been updated.
If you return to Dynamics AX, then you will see that it has been updated.
Configuring Costing & Cost Sheets
© 2013 Murray Fife. All rights reserved.
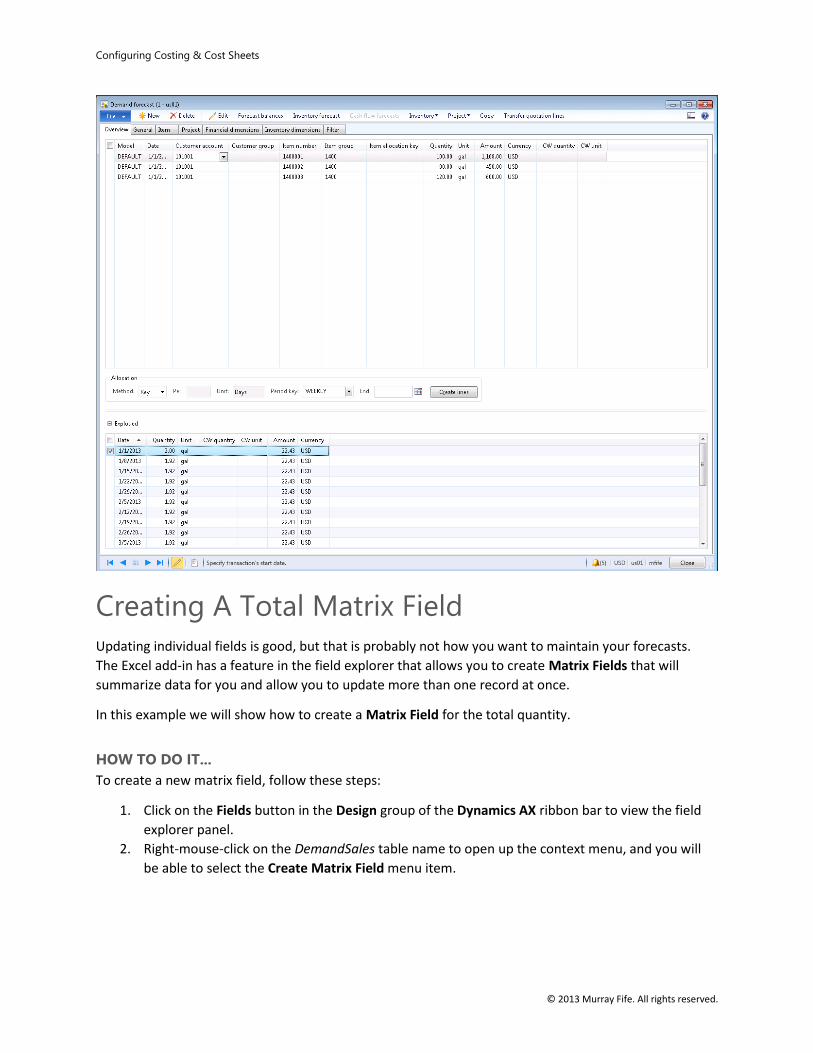
Creating A Total Matrix Field
Updating individual fields is good, but that is probably not how you want to maintain your forecasts.
The Excel add-in has a feature in the field explorer that allows you to create Matrix Fields that will
summarize data for you and allow you to update more than one record at once.
In this example we will show how to create a Matrix Field for the total quantity.
HOW TO DO IT...
To create a new matrix field, follow these steps:
1. Click on the Fields button in the Design group of the Dynamics AX ribbon bar to view the field
explorer panel.
2. Right-mouse-click on the DemandSales table name to open up the context menu, and you will
be able to select the Create Matrix Field menu item.
Configuring Costing & Cost Sheets
© 2013 Murray Fife. All rights reserved.
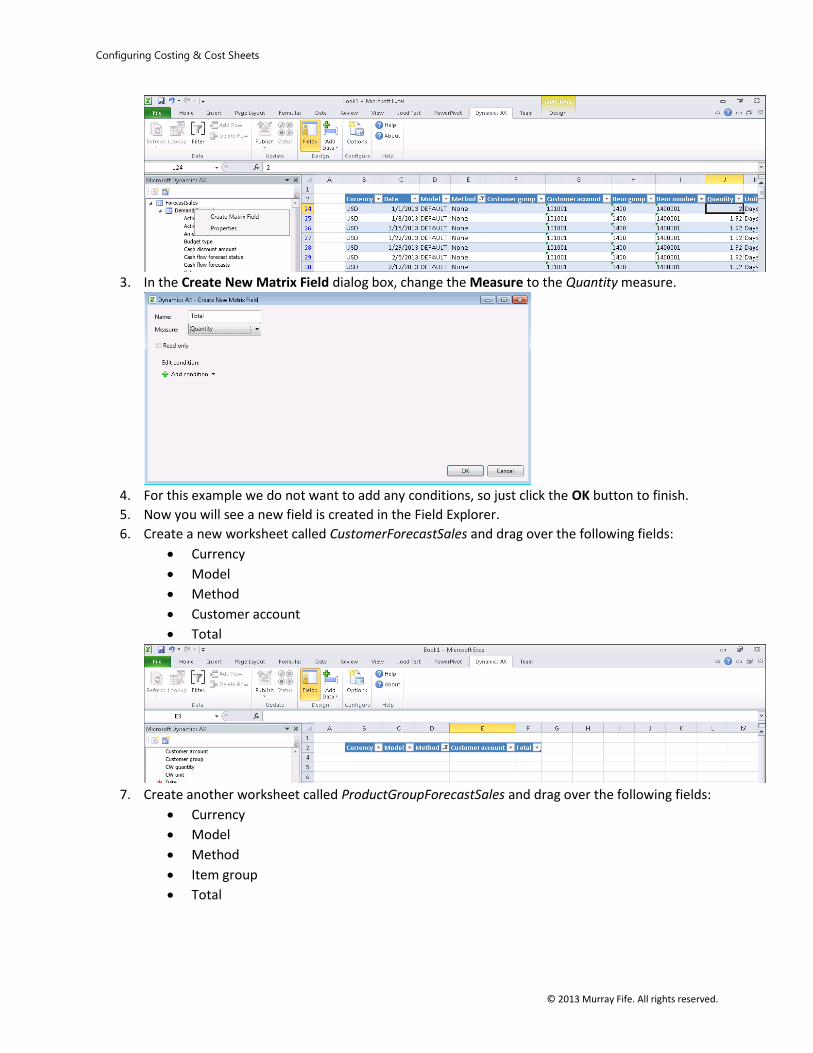
3. In the Create New Matrix Field dialog box, change the Measure to the Quantity measure.
4. For this example we do not want to add any conditions, so just click the OK button to finish.
5. Now you will see a new field is created in the Field Explorer.
6. Create a new worksheet called CustomerForecastSales and drag over the following fields:
Currency
Model
Method
Customer account
Total
7. Create another worksheet called ProductGroupForecastSales and drag over the following fields:
Currency
Model
Method
Item group
Total
Configuring Costing & Cost Sheets
© 2013 Murray Fife. All rights reserved.
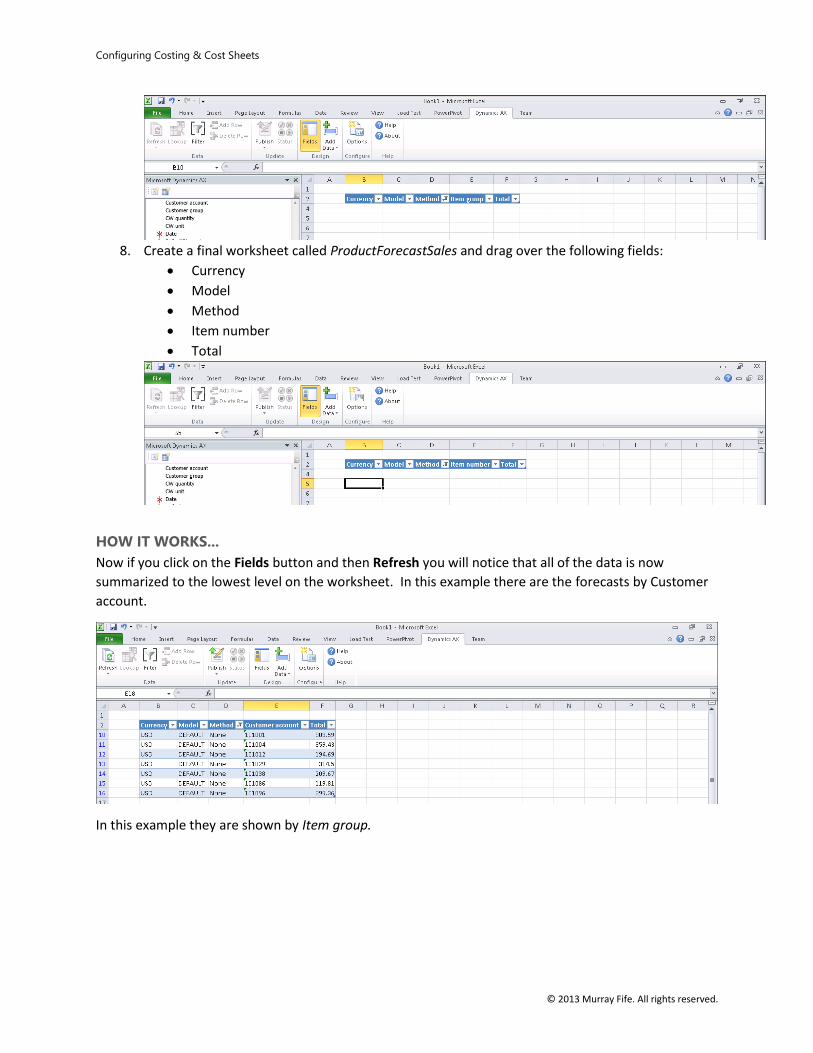
8. Create a final worksheet called ProductForecastSales and drag over the following fields:
Currency
Model
Method
Item number
Total
HOW IT WORKS...
Now if you click on the Fields button and then Refresh you will notice that all of the data is now
summarized to the lowest level on the worksheet. In this example there are the forecasts by Customer
account.
In this example they are shown by Item group.
Configuring Costing & Cost Sheets
© 2013 Murray Fife. All rights reserved.
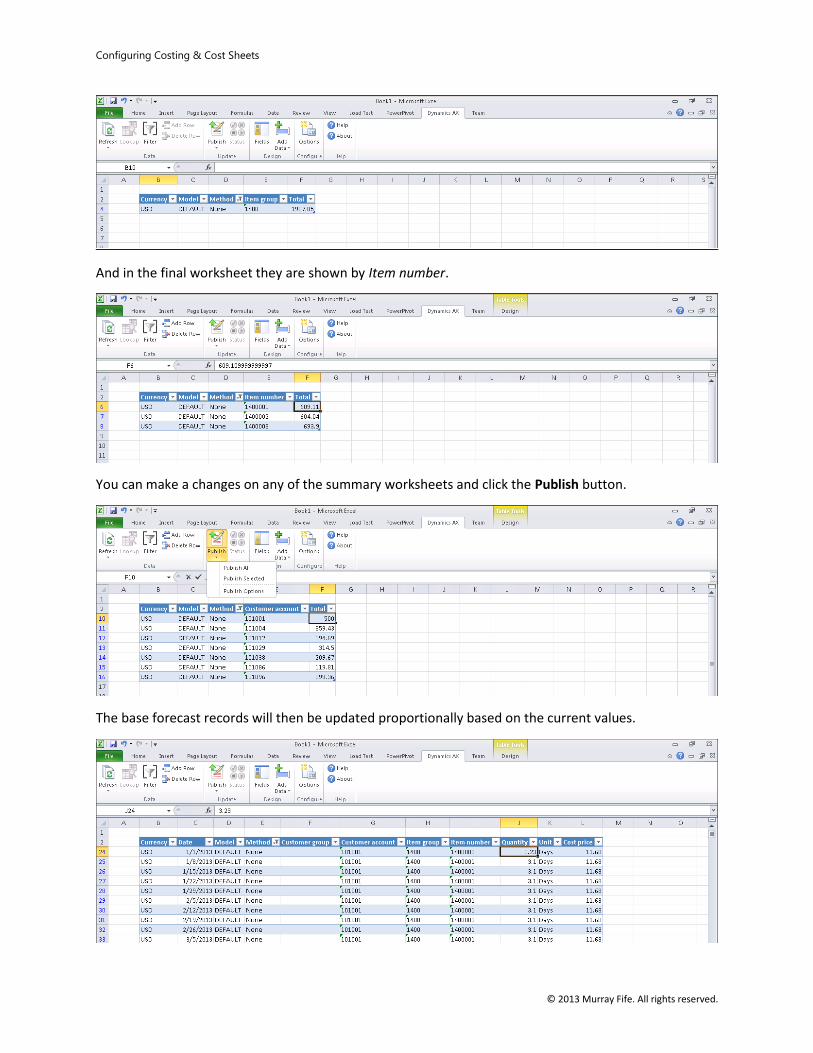
And in the final worksheet they are shown by Item number.
You can make a changes on any of the summary worksheets and click the Publish button.
The base forecast records will then be updated proportionally based on the current values.
Configuring Costing & Cost Sheets
© 2013 Murray Fife. All rights reserved.
Creating Period Total Matrix Fields
You probably want to update your forecasts based on some type of period rather than by total. You can
do that easily by creating a Matrix Field that only applies to a certain filter condition.
In this example we will show how you can create Matrix Fields that allow you to update the data by
period.
HOW TO DO IT...
To create a period total matrix fields, follow these steps:
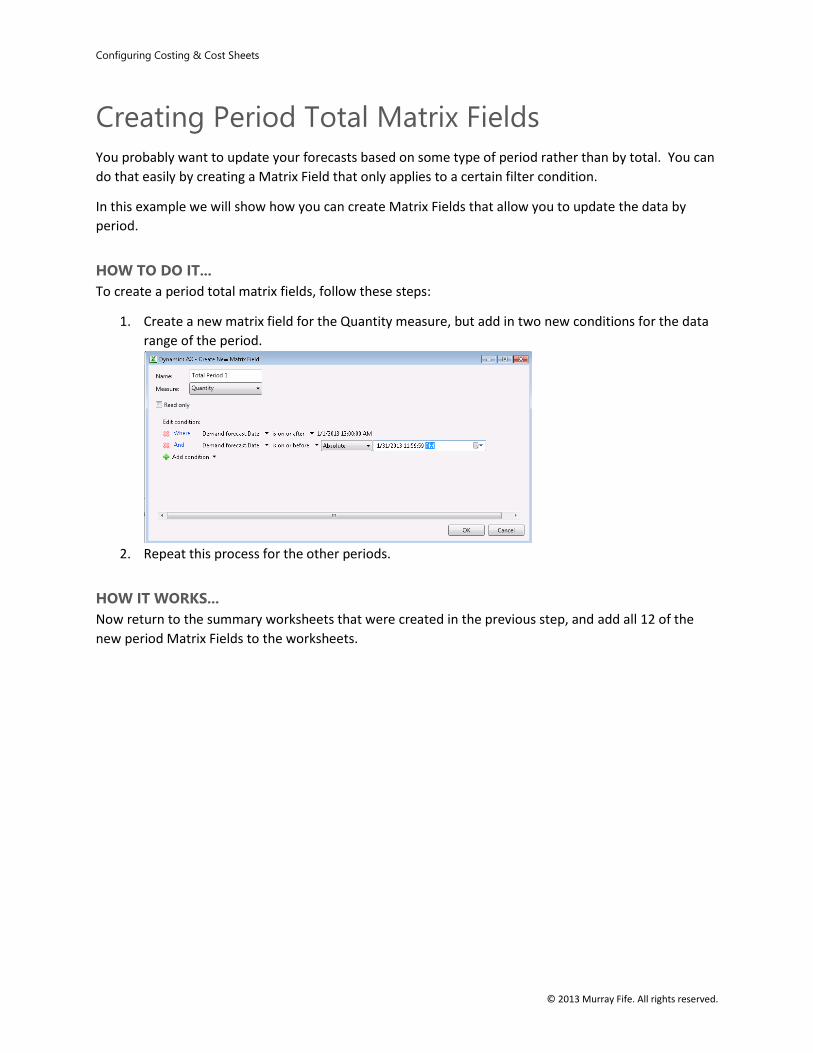
1. Create a new matrix field for the Quantity measure, but add in two new conditions for the data
range of the period.
2. Repeat this process for the other periods.
HOW IT WORKS...
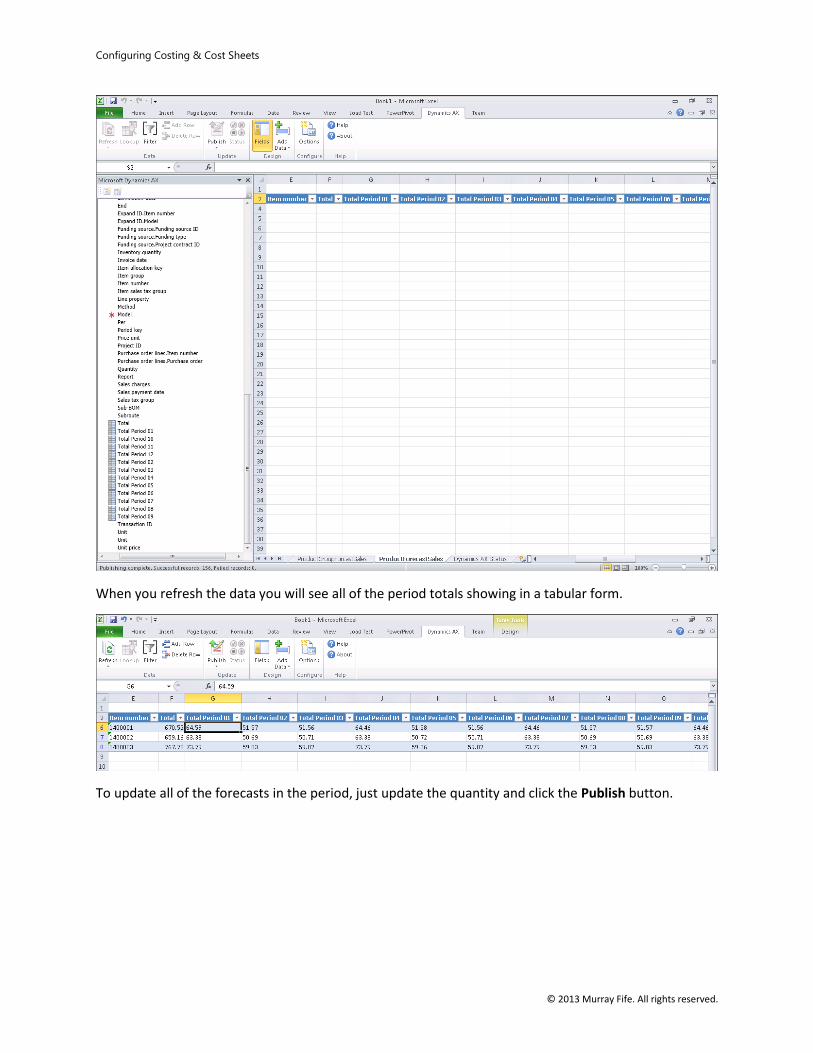
Now return to the summary worksheets that were created in the previous step, and add all 12 of the
new period Matrix Fields to the worksheets.
Configuring Costing & Cost Sheets
© 2013 Murray Fife. All rights reserved.
When you refresh the data you will see all of the period totals showing in a tabular form.
To update all of the forecasts in the period, just update the quantity and click the Publish button.
Configuring Costing & Cost Sheets
© 2013 Murray Fife. All rights reserved.
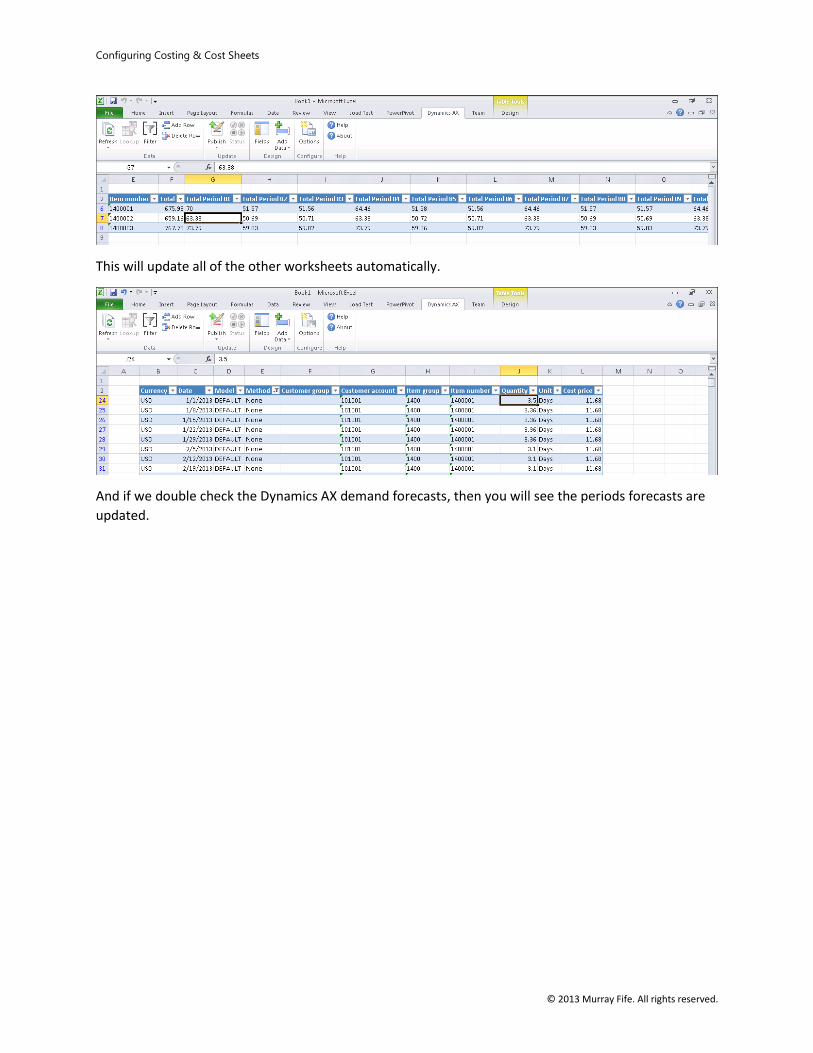
This will update all of the other worksheets automatically.
And if we double check the Dynamics AX demand forecasts, then you will see the periods forecasts are
updated.
Configuring Costing & Cost Sheets
© 2013 Murray Fife. All rights reserved.
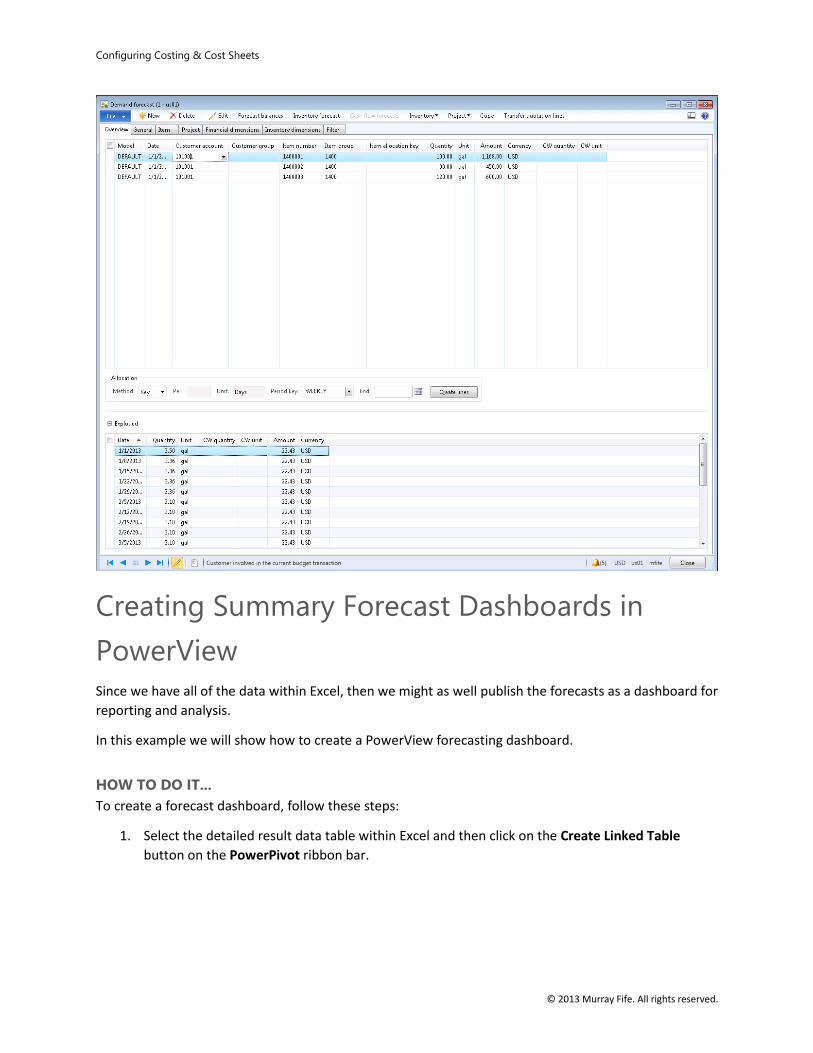
Creating Summary Forecast Dashboards in
PowerView
Since we have all of the data within Excel, then we might as well publish the forecasts as a dashboard for
reporting and analysis.
In this example we will show how to create a PowerView forecasting dashboard.
HOW TO DO IT...
To create a forecast dashboard, follow these steps:
1. Select the detailed result data table within Excel and then click on the Create Linked Table
button on the PowerPivot ribbon bar.
Configuring Costing & Cost Sheets
© 2013 Murray Fife. All rights reserved.
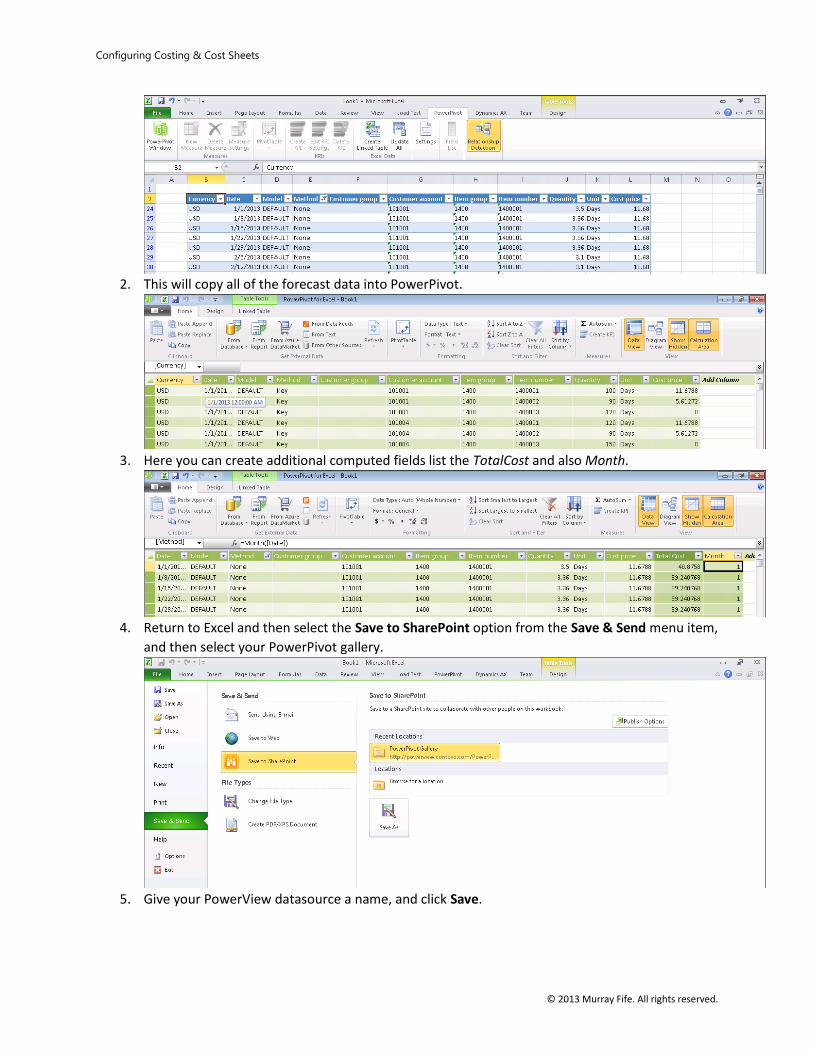
2. This will copy all of the forecast data into PowerPivot.
3. Here you can create additional computed fields list the TotalCost and also Month.
4. Return to Excel and then select the Save to SharePoint option from the Save & Send menu item,
and then select your PowerPivot gallery.
5. Give your PowerView datasource a name, and click Save.
Configuring Costing & Cost Sheets
© 2013 Murray Fife. All rights reserved.
HOW IT WORKS...
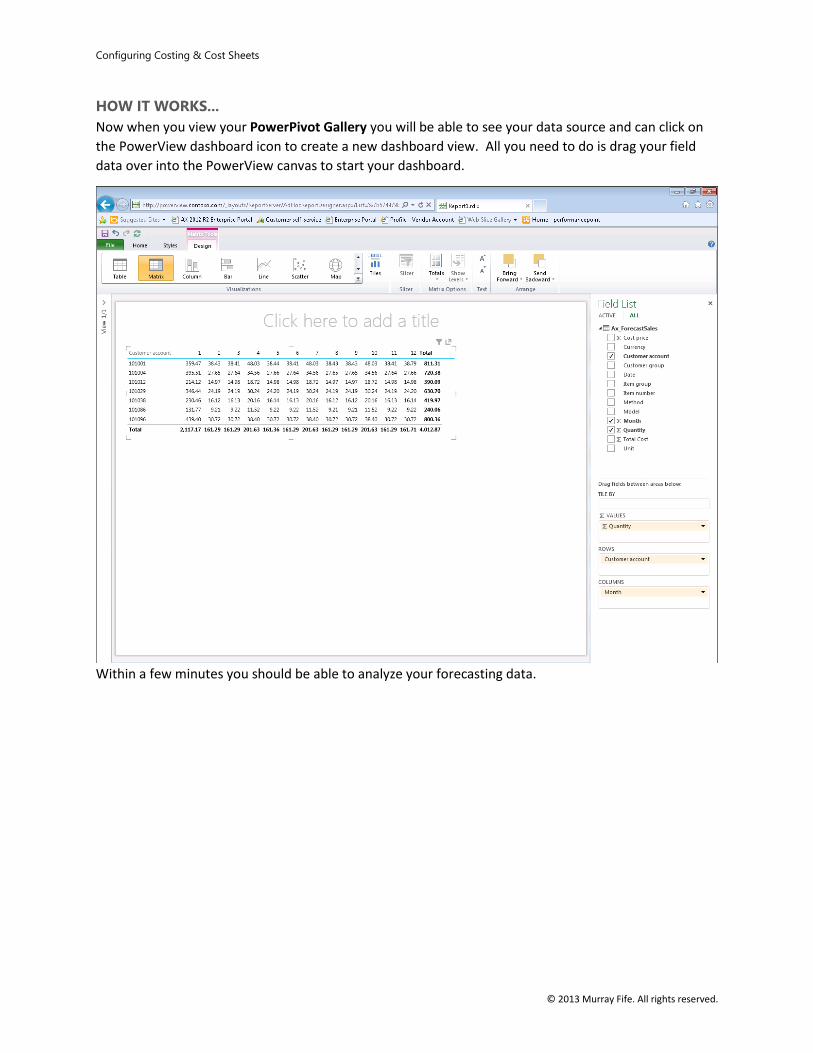
Now when you view your PowerPivot Gallery you will be able to see your data source and can click on
the PowerView dashboard icon to create a new dashboard view. All you need to do is drag your field
data over into the PowerView canvas to start your dashboard.
Within a few minutes you should be able to analyze your forecasting data.
Configuring Costing & Cost Sheets
© 2013 Murray Fife. All rights reserved.
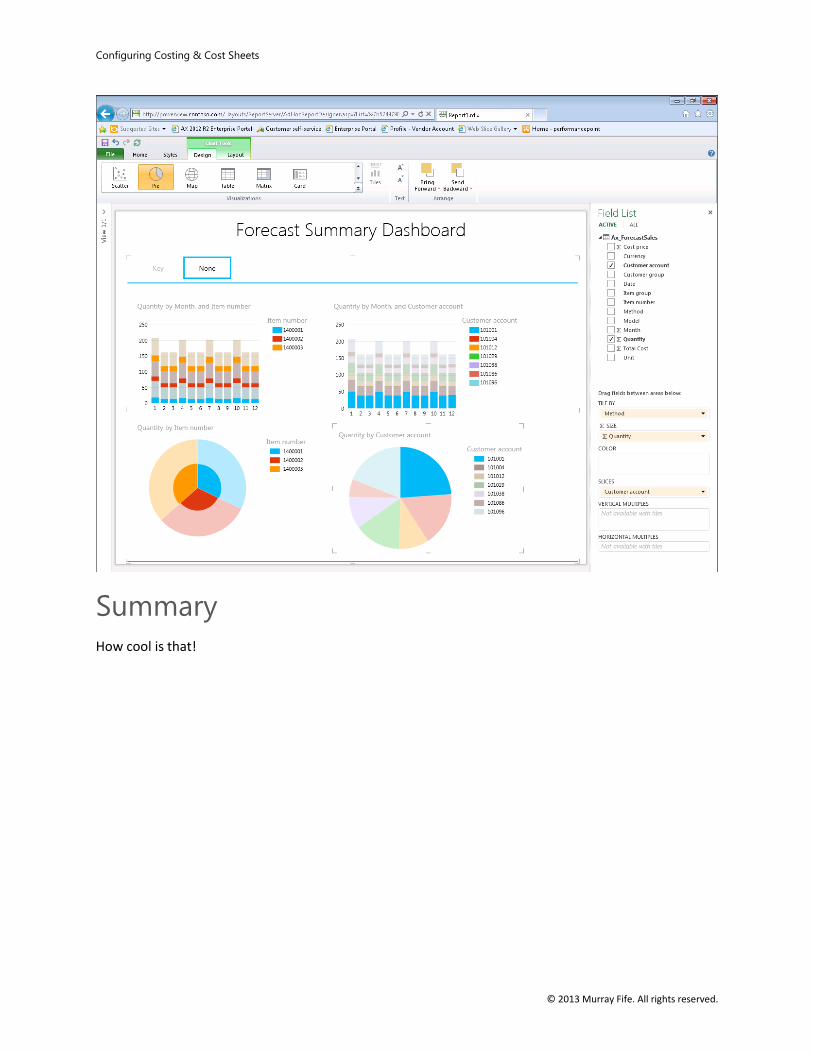
Summary
How cool is that!
About
Murray Fife
With over 18 years of ERP (Enterprise Resource Planning) Business
Software experience, initially as a developer, then as an
implementation consultant, and now as a technology consultant
specializing in Microsoft Dynamics® AX solutions.
For the past 15 years Murray has been educating, training,
presenting and demonstrating to C-Level executives on topics
ranging from ERP software selection to business intelligence
strategies.
EMAIL: [email protected]
PHONE: +1 (404) 425-9616
TWITTER: @murrayfife
BLOG: http://atinkerersnotebook.com/
SLIDESHARE: http://slideshare.net/murrayfife/presentations
LINKEDIN: http://www.linkedin.com/in/murrayfife
ORIGINAL:
© 2013 Murray Fife. All rights reserved.
The information herein is for informational purposes only and
represents the current view of Murray Fife as of the date of this
presentation. Because Murray Fife must respond to changing
market conditions, it should not be interpreted to be a
commitment on the part of Junction Solutions, and Murray Fife
cannot guarantee the accuracy of any information provided after
the date of this presentation.
MURRAY FIFE MAKES NO WARRANTIES, EXPRESS, IMPLIED OR
STATUTORY, AS TO THE INFORMATION IN THIS PRESENTATION.