using flowfff and hpsec to determine trace metal–colloid associations in wetland runoff
TRANSCRIPT

ww.sciencedirect.com
wat e r r e s e a r c h 4 7 ( 2 0 1 3 ) 2 7 5 7e2 7 6 9
Available online at w
journal homepage: www.elsevier .com/locate/watres
Using FLOWFFF and HPSEC to determine trace metalecolloidassociations in wetland runoff
Elisabeth Neubauer, Frank v.d. Kammer*, Thilo Hofmann*
Department of Environmental Geosciences, University of Vienna, Althanstrasse 14, 1090 Vienna, Austria
a r t i c l e i n f o
Article history:
Received 20 April 2012
Received in revised form
11 February 2013
Accepted 12 February 2013
Available online 26 February 2013
Keywords:
Natural nanoparticles
Arsenic speciation
Peat bog
Flow Field-Flow Fractionation
Size exclusion chromatography
Ultrafiltration
* Corresponding authors. Tel.: þ43 1 4277 533E-mail addresses: frank.kammer@univie.
0043-1354/$ e see front matter ª 2013 Publihttp://dx.doi.org/10.1016/j.watres.2013.02.030
a b s t r a c t
Natural organic matter (NOM) and iron colloids can coexist in surface water. These colloids
might exhibit different affinities to metals and metalloids. Previously it has been shown,
that organic and inorganic colloids in the low nanometer range can be fractionated using
Flow Field-Flow Fractionation analyzes (FlowFFF), but it is not yet understood how the
presence of inorganic colloids influences results obtained by High Performance Size
Exclusion Chromatography (HPSEC). Studies that compare the use of these size-separation
techniques for the analyzes of organic and inorganic colloids and associated elements
are needed in order to interpret results obtained by either of these methods. Therefore,
associations between colloids from a small stream draining a wetland area and a selected
range of elements (Fe, Al, Ti, Pb, Cu, Ni, As, U, and Rare Earth Elements (REE)) have been
investigated. FlowFFF analyzes and HPSEC analyzes were combined with ultrafiltration,
functional group titration and arsenic speciation analysis.
NOM and, in a sample with a pH > 5.2, slightly larger iron organo-mineral colloids, were
present in the <0.2 mm fraction in the surface water. Both exhibited notably different
affinities for trace elements. Cu, Ni, Al, and the REE all showed similar modes (i.e. peak
maxima) and size distributions to the NOM, while Pb and As showed a preferential
association with iron organo-mineral colloids. It was not possible to differentiate between
NOM and iron-organo mineral colloids with HPSEC. The differences in the results regarding
the apparent molecular mass distributions obtained by FlowFFF and HPSEC are discussed.
ª 2013 Published by Elsevier Ltd.
1. Introduction Kammer, 2008; Neubauer et al., 2011) and surface water
In surface water the association of metals andmetalloids with
colloids has classically been studied using filtration and ul-
trafiltration (Hofmann et al., 2003a,b; Pokrovsky et al., 2005;
Vasyukova et al., 2010). However, these techniques are not
capable of distinguishing between different types of colloids
with sizes in the nanometer range, e.g., “soft” organic colloids
like natural organic matter (NOM) and “solid” inorganic col-
loids. In previous studies, it has been shown that NOM and
iron colloids can coexist in soil extracts (Hassellov and v.d.
01; fax: þ43 1 4277 9533ac.at (F. v.d. Kammer), thshed by Elsevier Ltd.
(Benedetti et al., 2003; Dahlqvist et al., 2007; Krachler et al.,
2010; Lyven et al., 2003). These colloids might exhibit
different affinities tometals andmetalloids. High Performance
Size Exclusion Chromatography (HPSEC) and Flow Field-Flow
Fractionation (FlowFFF) are analytical techniques that can be
used to separate dissolved metals and stable metaleligand
complexes fromcolloids on the basis of size ormolecularmass
differences (Hassellov et.al., 2007; Jackson et al., 2005).
When combined with appropriate detection systems, such
as UVeVis spectroscopy (UVeVis), fluorescence spectroscopy
[email protected] (T. Hofmann).

wat e r r e s e a r c h 4 7 ( 2 0 1 3 ) 2 7 5 7e2 7 6 92758
(Fl), and inductively-coupled plasma mass spectrometry (ICP-
MS), detailed information on the association of metals and
metalloids with organic and inorganic colloids can be ob-
tained. UVeVis spectroscopy is used for the quantification of
light-absorbing organic substances. Especially in fractionated
samples, errors may occur if the specific absorbance of the
NOM varies with molecular mass, and non-chromophoric
NOM will not be detected. Fluorescence is used for the char-
acterization of fluorescing NOM, which is often attributed to
the smaller, more fulvic-like NOM fraction (Neubauer et al.,
2011) but can originate from various, also non-humic frac-
tions of NOM [Leenheer and Croue (2003)]. ICP-MS is capable of
detecting metals and metalloids at high sensitivity.
HPSEC is traditionally used for the separation of NOM
(Hongve et al., 1996; Pelekani et al., 1999; Zhou et al., 2000) and,
when coupled to UVeVis detection and ICP-MS, it can be used
to explore metal/metalloid-NOM complexation (Bolea et al.,
2006; Jackson et al., 2005; Kaschl et al., 2002; Laborda et al.,
2009; Pelekani et al., 1999). In HPSEC, samples are eluted
over a column containing a porous gel material. Low molec-
ular mass NOM can access more of the internal pore volume
than high molecular mass NOM, which is excluded from such
pores. High molecular mass NOM therefore elutes first, fol-
lowed by the smaller components. HPSEC is applicable to the
separation of NOM with molecular masses ranging from
approximately 200 to 1,000,000 g mol�1 (Jackson et al., 2005),
but the whole range is not accessible with one column. HPSEC
analyzes suffer from artifacts such as intermolecular in-
teractions of the analyte components with the packing ma-
terial of the HPSEC column. This can be related to repulsive
forces, which cause molecules to elute at an apparent mo-
lecular mass higher than the actual molecular mass, or to
charge attraction, which can cause sorption to the column
packing material (Chin and Gschwend, 1991; Jackson et al.,
2005; Pelekani et al., 1999).
FlowFFF is used for the fractionation of organic and inor-
ganic colloids in the low nanometer size range (Hassellov
et al., 2007; Hassellov and v.d. Kammer, 2008), and for the
characterization of metal/metalloidecolloid associations
(Dahlqvist et al., 2004; Dubascoux et al., 2010; Lyven et al., 2003;
Neubauer et al., 2011). It is a separation technique that pro-
vides a continuous separation of colloids without the disad-
vantage of a stationary phase, like the column packing
material. The separation takes place in a thin (0.1e0.75 mm
height) channel under the effect of a flow-generated field
applied perpendicular to the main parabolic flow of a mobile
phase. The field created by this secondary flow drives the
sample components to the accumulation wall, which in
FlowFFF is covered by an ultrafiltration membrane. This
membrane retains those sample molecules and particles that
are larger than the effective pore size of themembrane within
the channel, which then can be separated. The applied sec-
ondary flow is countered by the diffusion of the particles and
molecules back into the channel. Smaller particles have higher
diffusion rates than larger particles and build up diffusional
clouds which extend higher into the channel than those of the
larger particles (Hassellov et al., 2007). The smaller particles
experience on average a higher longitudinal flow rate of the
mobile phase and therefore elute before the larger ones. Using
FlowFFF theory or calibration with suitable standards allows
the conversion of the retention volumes to diffusion co-
efficients, hydrodynamic diameters or molecular masses
(Dubascoux et al., 2010). The final outcome of a FlowFFF sep-
aration is governed by a multitude of factors, such as the ionic
strength and the pH of the mobile phase, particleemembrane
interactions, sample dilution, washing of sample components
and overloading. These parameters need to be well controlled,
taken into account, or acknowledged when interpreting data
(Baalousha et al., 2011; Neubauer et al., 2011).
Ultrafiltration, HPSEC and FlowFFF each have their own
particular analytical merits, such as the superior resolution
within the molecular mass range of NOM in HPSEC analyzes,
the absence of a stationary phase in FlowFFF analyzes, and the
absence of a mobile phase and associated change in the
hydrochemical environment and dilution in ultrafiltration.
Organic and inorganic colloids in the low nanometer size
range can be fractionated using FlowFFF analyzes (Hassellov
and v. d. Kammer, 2008), but it is not yet understood how
the presence of inorganic colloids influences results obtained
by HPSEC analyzes. This potentially results in misinterpreta-
tion of HPSEC data on trace elementecolloid associations.
Studies that compare the use of these size-separation
techniques for the analyzes of organic and inorganic colloids
and associated elements in surfaceewater samples are
needed in order to interpret results obtained by either of these
methods.
In this study we have investigated the association of col-
loids with a selected range of elements (Fe, Al, Ti, Pb, Cu, Ni,
As, U, REE) in a small stream draining an unpolluted wetland
(Tanner Moor) in Upper Austria. This wetland was chosen as a
model system because NOM and iron organo-mineral colloids
have been observed before at different sampling dates (Jirsa
et al., in press).
The metals and metalloids (Fe, Al, Ti, Pb, Cu, Ni, As, U, REE)
were chosen because of their different affinities for NOM and
iron oxides, and due to their use as geochemical tracers. Iron
can be bound to NOM but can also be present as iron mineral.
Copper and nickel have high affinities toward NOM, arsenic
has a high affinity for sorption onto iron minerals, and lead
sorbs and co-precipitates with iron and manganese oxides.
Titanium is most resistant to weathering; aluminum is an
indicator for the presence, but also dissolution of clay min-
erals. Rare earth elements are used as geochemical tracers in
catchment studies for the source identification of water when
normalized to standard materials. Iron, manganese, arsenic
and uranium can be used as redox indicators. In addition,
information on size-dependent association of those elements
with colloids is scarce in literature.
Results from ultrafiltration and functional group titration
were compared with the concentration patterns for the ele-
ments, as resolved from their particle sizes. These patterns
were recorded using two different high-resolution size-sepa-
ration techniques (HPSEC and FlowFFF) and supplemented
with an arsenic speciation analysis. Our objectives were to
elucidate whether it is possible to differentiate between NOM
and iron organo-mineral colloids from surface waters by
means of HPSEC, like it has been shown for FlowFFF, and to
investigate the competition for trace metal binding of NOM
and iron organo-mineral colloids. In addition, the difference
in the results obtained by FlowFFF and HPSEC are discussed.

wat e r r e s e a r c h 4 7 ( 2 0 1 3 ) 2 7 5 7e2 7 6 9 2759
2. Experimental procedures
2.1. Sampling site and sample collection
Tanner Moor (48�3003100N, 14�5104900 E) is an unpolluted peat
bog in the Muehlviertel, which is in the north-eastern part of
Upper Austria (Krachler et al., 2005). It is one of the largest
highmoors in Austria, covering a total area of 1.2 km2, and is
now a protected conservation area in the Natura 2000 network
of the European Union. The area is mainly forested with
mountain pine (Pinus mugo), common spruce (Picea abies),
silver birch (Betula pendula) and downy birch (Betula pubes-
cens) (Jirsa et al., in press). Two samples were collected in
consecutive years from a small stream draining the peat bog,
under similar meteorological and hydrological conditions in
the late winter, with snow cover still in place (TM1 in January
2009 and TM2 in January 2010). While the TM1 sample was
collected at the beginning of snowmelt, conditions were still
frosty when TM2 was collected. The pH was measured in situ.
Five liters of water were sampled, filled in PE bottles and
transported in cooling boxes to the laboratory. The samples
were vacuum filtered through 0.2 mm cellulose filters (What-
man, Maidstone, UK). The samples were stored dark and cool
(4 �C) until analysis.
2.2. Bulk analysis
The samples were split for digestion, ultrafiltration, fulvic and
humic acid separation, and functional group titration.
An aliquot of the 0.2 mm filtered samples was digested in a
microwave (Microwave 3000, Anton Paar, Graz, Austria) using
4% H2O2 (Merck Suprapur grade) and 20% HNO3 (Merck
Suprapur grade) at 175 �C for 25 min. The digested samples
were diluted with ultrapure water to 100 mL, and stored in
100 mL PE bottles until analysis.
The proportions of cations and organic carbon present in
the operationally defined colloid fraction (>1000 g mol�1 and
<0.2 mm) and in the dissolved fraction (<1000 g mol�1) were
then determined on the basis of ultrafiltration results.
Approximately 38 mL of the 0.2 mm filtered samples were
ultrafiltered using a Millipore Stirred Ultrafiltration Cell
equipped with regenerated cellulose filters (1000 g mol�1
nominal molecular weight cut-off (NMWCO, determined by
the manufacturer, Merck Millipore, Billercia, US) under argon
pressure. The first 2 mL were discarded. 15 mL of the filtrate
were acidified with 0.6 mL 5N HNO3 (Merck Suprapur grade)
and were used for determination of main and trace cations.
Another 15 mL were used for organic carbon measurements.
Blanks using ultrapure water instead of sample were pre-
pared to evaluate leaching of organic carbon, metals and
metalloids from the ultrafiltration membrane. At the end of
the experiment, and before discarding the filter, the integrity
of the membrane was tested with dextrane blue solution
(molecular mass 2,000,000 g mol�1). We used 1000 g mol�1
NMWCO membranes for ultrafiltration to allow for compari-
son with older studies which used the same membrane type
and NMWCO and because “truly dissolved” species are ex-
pected to pass through them, while such that are associated
with larger NOM fractions (Piccolo, 2001), or iron-dominated
colloids are retained (Pokrovsky et al., 2005). We are, how-
ever, aware, that part of the NOM may have masses as low as
several hundred g mol�1 and will therefore pass through the
membrane (Pokrovsky et al., 2005). In addition, manufac-
turers calibrate their membranes usually with proteins.
Direct comparison to the NOM is difficult, not only because
the shape and charge density of the NOM molecules is
different to the calibration molecules, but NOM molecules
strongly change their shape and charge density according to
surrounding conditions like ionic strength and pH (Piccolo,
2001).
Main and trace cations of the ultrafiltered and the digested
samples were determined by ICP-OES (Optima 5300 DL, Perkin
Elmer, Waltham, USA) and ICP-MS (Agilent Technologies
7700�, Waldbronn, Germany, see Table 1). The ion lens set-
tings of the ICP-MS were adjusted before measurement to
maximum signal intensity for elements contained in a tuning
solution purchased from Agilent Technologies Manufacturing
GmbH (Waldbronn, Germany). For all ICP-MS measurements
a collision cell with He as cell gas (4 mL min�1) was used.
The following isotopes were monitored: 28Si, 56Fe, 55Mn, 27Al,59Co, 47Ti, 60Ni, 63Cu, 65Cu, 208Pb, 75As, 89Y, 139La, 140Ce, 232Th
and 238U.
Anions and dissolved organic carbon (DOC)weremeasured
using an ion chromatograph (ICS-1000, Dionex, Vienna,
Austria) and a total organic carbon analyzer (TOC-VCPH, Shi-
madzu, Duisburg, Germany).
In order to separate fulvic and humic acids, the pH of
the samples was adjusted to pH < 1 and the humic acid
precipitates were removed by filtration (0.2 mm). The concen-
trations of fulvic acids and small organic molecules such as
sugars were measured using the TOC-VCPH total organic car-
bon analyzer.
Functional group titration was performed on the 0.2 mm
filtered samples for the determination of available binding
sites following the method described in detail in Hru�ska
et al. (2001). Briefly, water samples (approx. 25 mL) were
passed at constant flow through a proton saturated Dowex-
50 cation exchanger column. During the passage metals
that are not bound to NOM will exchange for protons
and remain in the column while metals bound strongly to
NOM will pass the column in the eluate. Measured DOC
concentration and inorganic anions were then used to
calculate the amount of readily reactive carboxylic groups
per mg carbon for each sample [meq mg�1]. The concentra-
tions of organic acids (RCOO�) and charge densities
were calculated from site densities, DOC and pH using a tri-
protic organic acid model described in detail in Hru�ska et al.
(2001).
2.3. HPSEC-UVeVis-fluorescence-ICP-MS
A liquid chromatography system (Agilent Technologies
1100 Series, Tokyo, Japan) equipped with a micro-vacuum
degasser was used with a 200 � 8 mm Toyopearl HW 55S
size-exclusion column and a 20 � 8 mm pre-column
(Grace Davison Discovery Sciences, Alltech Grom GmbH,
Rottenburg-Hailfingen, Germany). The mobile phase con-
sisted of a 25 mM solution of ammonium carbonate contain-
ing ammonium carbamate (CH6N2O2$CH5NO3, 1:1, analytical

Table 1 e Summary of DOC, fulvic acid concentration (DOC FA), pH, elemental composition of the samples (<0.2 mm and <1000 g molL1), calculated percentage ofassociationwith colloids (%colloid, based on the calculated difference between themeasured concentration<0.2 mmand the concentration<1000 gmolL1), and recoveryas measured by HPSEC and FlowFFF (in %).
Unit TM1 TM2
<0.2 mm <1000 g mol�1 % Colloid FlowFFF R% HPSEC R% <0.2 mm <1000 g mol�1 % Colloid FlowFFF R% HPSEC R%
DOC mmol L�1 2282 1058 54 74d 70d 3086 1022 67 79d 100d
DOC (FA) mmol L�1 1941 2509
pH 5.3 4.8
Site density meq mg�1 4.3 13.4
Charge density meq mg�1 2.72 7.51
Nab mmol L�1 197 176 11 82 73 11
Kb mmol L�1 <26 <26 <26 <26
Cab mmol L�1 147 95 35 81 37.15 54
Mgb mmol L�1 61.3 43.5 29 <41 <41
Sia mmol L�1 304 296 2 145 168 0
Fea mmol L�1 43.8 0.5 99 61 86 67.7 2.76 96 74 47
Mna nmol L�1 24.4 16.8 31 2780 657 76
Ala nmol L�1 2557 343 87 65 6151 884 86 37
Coa nmol L�1 12.5 3.0 76 44 66 25.5 4.96 81 67 83
Tia nmol L�1 59.4 3.9 93 71 93.1 5.31 94 47
Nia nmol L�1 29.6 8.2 72 82 129 23.6 <8.5 81 163
Cua nmol L�1 322 19 94 64 110 315 7.41 98 65 128
Pba nmol L�1 8.93 0.94 89 116 15 16.90 0.66 96 70 76
Asa nmol L�1 27.4 10.5 62 47 84 29.3 6.52 78 43 83
Ya nmol L�1 3.27 0.38 88 102 90 2.96 0.42 86 102 69
Laa nmol L�1 0.42 0.04 91 137 302 0.53 0.04 93 114 205
Cea nmol L�1 0.65 0.07 89 138 327 1.49 0.11 93 112 226
Tha nmol L�1 0.79 0.02 97 67 80 0.53 0.03 94 74 104
Ua nmol L�1 1.03 0.18 83 59 77 0.89 0.17 81 47 60
HCO3� mmol L�1 n.d. 216
Cl�c mmol L�1 109 137
NO32�c mmol L�1 99.2 25.2
PO43�c mmol L�1 e 1.58
SO42�c mmol L�1 7.60 6.56
F�c mmol L�1 7.37 3.68
a ICP-MS.
b ICP-OES.
c IC.
d Recovery from UVeVis signal of the analyte in the separation system, relative to the same sample injected directly into the detector.
water
research
47
(2013)2757e2769
2760

wat e r r e s e a r c h 4 7 ( 2 0 1 3 ) 2 7 5 7e2 7 6 9 2761
grade), adjusted to pH 7 with 5 N HNO3 (Merck Suprapur
grade). A flow rate of 0.3 mL min�1 was used. The SEC column
was followed by a variable wavelength ultraviolet/visible
spectrophotometer (Agilent 1100 VWD, UVeVis) tuned to
l ¼ 250 nm, and a fluorescence detector (Agilent 1100 FLD,
excitation l ¼ 250 nm, emission l ¼ 410 nm), for the charac-
terization of NOM. The true UVeVis absorption of organic
substances inmixed samples outweighs the turbidity signal of
particles, and therefore no interference of the UVeVis signal
by particles in the sample was expected (v.d. Kammer et al.,
2005). We are, however, aware that the UVeVis signal may
be biased due to the distribution of chromophores in the NOM
molecules across the molecular mass distribution of the
sample (Her et al., 2002). However, Hassellov et al. (1999) and
Stolpe et al. (2005) showed that the UVeVis signal and the
carbon signal (measured by ICP-MS) show good agreement for
NOM colloids. The UVeVis signal was converted to DOC con-
centrations. The conversion is based on the assumption that
chromophores are distributed evenly over the whole molec-
ular mass range of NOM. The total injected mass of DOC was
first corrected with the recovery of the UVeVis signal. A
response factor was then fitted until the integrated concen-
tration signal (i.e. the mass under the UVeVis peak) yielded
the recovered mass. Finally, the concentration was converted
from mg L�1 to mmol L�1.
An ICP-MS (Agilent Technologies 7700�) was coupled to the
outlet of the fluorescence detector. This set-up allows the
elemental composition to be determined as a function
of colloid size. Before entering the ICP-MS, the effluent passed
through an interface in which rhodium (10 mg L�1) was mixed
in as internal standard. A multi-point calibration was per-
formed prior to sample analysis. Standards were made up
with MilliQ water and acidified with 10% (v/v) 5 N HNO3
(Suprapur). The concentration ranges of the standards were
adjusted to match the concentration of the sample. One
measurement per sample of the mobile phase used in the
HPSEC analysis was used as a “zero concentration” standard
in the calibration. The calibration was carried out via an
autosampler. For the calibration, the same instrument set-
tings were used as for the measurement of the samples. The
intensity signal of the samples (counts per second) was then
recalculated to concentration. Information on limit of detec-
tion and limit of quantification for the ICP-MS coupling is
given in the Supplementary Material.
All sample injections were performedwith an autosampler
(Agilent Technologies 1100 Series), using a 100 mL aliquot.
Recovery runs were conducted by replacing the column and
the precolumn with a poly(methyl methacrylate) tube. As in
the sample runs, the eluent was directed through the UVeVis
and fluorescence detectors, and then to the ICP-MS. The in-
jection volume for the recovery runs was 20 mL. The standard
deviation for duplicate measurements is <5% for the UVeVis
and the fluorescence signal, and <10% for the elements
measured by ICP-MS.
The columnwas calibratedwithmolecularmass standards
of 1100; 3610; 6780; 10,600; 16,800; 32,800; 48,600; and
145,000 g mol�1. The standards were prepared from poly-
styrene sulfonate sodium salt (PSS, Polymer Standards Service
GmbH, Mainz, Germany) at 0.1 g L�1 concentration in the
mobile phase. The injection volumewas 5 mL. The column void
volume was determined using 149,000 g mol�1PSS. The total
permeation volume was determined using acetone.
2.4. FlowFFF-UVeVis-fluorescence-ICP-MS
The FlowFFF used was the Eclipse 3þ Asymmetric-Flow Field-
Flow Fractionation System (Wyatt Technology, Dernbach,
Germany). The samples were analyzed using the setup
described in detail in Neubauer et al. (2011). A 0.75 mm spacer
was used in the channel (tip to tip length 19.5 cm) to keep
required cross-flow rates low and prevent excessive pressure
build-up in the channel as a result of using a membrane with
very low cut-off size. The channel flow rate was 1 mL min�1,
and the cross-flow rate and the focus flow-rate were
1.5 mL min�1 (2 min focus time). In order to improve the re-
covery of very small NOM molecules and become comparable
with the HPSEC method with regard to the smallest deter-
minable molecule sizes, a 300 g mol�1 nominal cut-off poly-
ether sulfone membrane (Postnova Analytics, Landsberg,
Germany) was used as the accumulation wall. Flows were
controlled using an Agilent Technologies 1200 Series quater-
nary pump equipped with a micro-vacuum degasser. The
detection chain consisted of a diode-array ultraviolet/visible
detector (UV-DAD, Agilent Technologies 1200 Series, primary
detection wavelength l ¼ 254 nm), a fluorescence detector
(Agilent Technologies 1200 Series FLD) with an excitation
wavelength of 250 nm and an emission wavelength set to
410 nm, and an ICP-MS (Agilent Technologies 7700�). The
recalculation of the UVeVis signal to concentrations was
performed in the same manner as for the HPSEC analysis. All
injections were performed using an autosampler (Agilent
Technologies 1200 Series, large volume kit); injection volumes
were 500 mL. The recovery runs were conducted by injecting
100 mL of the samples without applying of any cross-flow (in-
jection with elution). We used 15 mM ammonium carbonate
(adjusted to pH 7 with HNO3) as mobile phase. Calibration
with PSSmolecularmass standardswas performed at a higher
ionic strength, as has been described in detail elsewhere
(Neubauer et al., 2011).
The FlowFFF e ICP-MS coupling used the same standardi-
zation procedure as for coupling to the HPSEC system. The
only modification was that the flow was split after the switch
valve, before entering the ICP-MS, reducing the flow rate from
1mLmin�1 to 0.5 mL min�1. Information on limit of detection
and limit of quantification for the ICP-MS coupling is given in
the Supplementary Material. The standard deviation for
duplicate measurements is <2% for the UVeVis and the
fluorescence signal, and <10% for the elements measured by
ICP-MS.
2.5. Determination of arsenic species by IC-ICP-MS
The IC system used consisted of the same components as
used in the HPSEC e UVeVis - fluorescence e ICP-MS anal-
ysis. Separations were performed on a PRP-X100 anion-ex-
change column (250 � 4.1 mm, 10 mm) from Hamilton (Reno,
USA) with a gradient method, using 12.5 mM and 30 mM
ammonium carbonate as the mobile phase following the
procedure described by Leist (2011). The flow rate was
1.2 mL min�1, and the flow was split before entering the ICP-

wat e r r e s e a r c h 4 7 ( 2 0 1 3 ) 2 7 5 7e2 7 6 92762
MS, reducing the flow rate to 0.3 mL min�1. The arsenic
compounds used for identification of arsenic species in IC e
ICP-MS in this study included sodium hydrogen arsenate
heptahydrate (98%, Alfa Aesar, Karlsruhe, Germany), sodium-
arsenite (0.05 M, Titripur, Merck), dimethyl arsenic acid tri-
hydrate (for synthesis, Merck), methylarsonic acid mono-
sodium salt (Dr. Ehrensdorfer GmbH, Augsburg, Germany)
and arsenobetaine (purum p.a., �95%; Fluka, St. Louis, US).
These standard compounds were diluted in MilliQ water to a
concentration of approximately 1 mM arsenic. Injection vol-
umes were 10 mL for the arsenic standard compounds, 100 mL
for the samples, and 10 mL for the sample recovery tests. In
this study, we used arsenic speciation as a complementary
analytical technique to cross-check the concentrations of
“dissolved “arsenic that we obtained from ultrafiltration
(passage through a 1000 g mol�1 NMWCO membrane) and
FlowFFF (passage through a 300 g mol�1 NMWCO membrane),
rather than with the purpose of determining the in situ
speciation of the dissolved arsenic components. No efforts
were made to investigate the influence of sample storage on
arsenic speciation.
2.6. Elemental quantification and recoveries
The signal versus retention volume curves, referred to as
fractograms (FlowFFF) and chromatograms (HPSEC), were in-
tegrated using OriginPro 7.5 software (OriginLab Corporation,
Northampton, USA) to determine the peak area. The recovery
percentages (R%) for UVeVis and fluorescence signal (HPSEC
and FlowFFF analysis), and arsenic in the speciation analysis
(IC e ICP-MS), were calculated as follows:
R% ¼ ðA=ðA0$xÞÞ$100%
where A is the peak area of the fractogram or chromatogram
of a sample, A0 is the corresponding area from the recovery
run with no cross-flow or by-pass, and x is the factor for
normalizing the injection volume of the recovery run.
The recoveries for all elements in the FlowFFF
and HPSEC analyzes were calculated by comparing the
recovered mass concentration from the sample runs to the
mass concentration measured in bulk analysis after sample
digestion.
2.7. Calculation of plate number and plate height
Plate number (Na, Nb) and plate height (Ha, Hb, in mm) [Mori
and Barth (1999), Sant and Gale (2006)] were calculated for a
molecular mass standard (10,600 g mol�1) for the FlowFFF
analysis and the HPSEC analysis as follows:
Na ¼ 16
�vR
bB
�2
; Nb ¼ 5:55� vR
FWHM
�2
; Hi ¼ LNi
; i ¼ a;b
Na and Nb are two types of plate numbers which are
commonly used to describe peak broadening (Mori, 1989), with
the difference that the baseline width (bB, mL) is used for the
calculation of Na, while Nb uses the full width at half
maximum (FWHM,mL). vR is the retention volume (mL), and L
(mm) is the length of the HPSEC column or the length of the
channel from focusing point to outlet (FlowFFF).
3. Results and discussion
3.1. General properties of the samples
DOC, pH, and elemental sample composition is summarized
in Table 1. The TM1 and TM2 samples both show elevatedDOC
concentrations (2280 and 3090 mmol L�1, respectively)
compared to average river water concentrations, as would be
expected for a peat bog drainage, and are low in major cations
and anions (see Table 1). The pH was measured as 5.3 and 4.8,
respectively. The dominant cations are sodium, calcium, and
iron with concentrations >40 mmol L�1. Silicon was
>140 mmol L�1. The ultrafiltration results indicate that 46% of
the organic carbon in TM1 and 37% in TM2 had a molecular
mass <1000 g mol�1. Large quantities of organic carbon
passing through the ultrafiltration membrane may be
explained by the high fulvic acid content (>80% of the DOC,
Table 1). Organic carbon and iron have by far the highest
concentrations in the operationally defined colloidal size
fraction between 1000 g mol�1 and 0.2 mm and (Table 1). High
proportions (>89%) of sodium and silicon, pass through the
1000 g mol�1 NMWCO membrane, indicating that they are
present as dissolved species, such as silicic acid. The presence
of silicate minerals can be excluded. Between 35 and 54% of
the calcium in the two samples is present as species larger
than 1000 g mol�1, as is 29% of the magnesium in TM1. Mag-
nesium and calcium are more likely to be associated with a
different colloidal phase, rather than being present as colloids
of magnesium and calcium carbonates, since equilibrium
calculations for TM2 using Visual Minteq showed that calcite
is undersaturated.
3.2. Apparent molecular mass distributions for NOM,obtained by two different methods
The apparent molecular mass distributions for TM1 and TM2
differ considerably depending on the sample itself, and on the
techniques used for their determination (Fig. 1). The differ-
ences between the two techniques are discussed below, fol-
lowed by a detailed discussion of the differences between the
samples.
The apparent molecular masses of NOM obtained by
FlowFFF clearly cover a similar range for both samples ranging
from a few 100 g mol�1 up to approximately 30,000 g mol�1
(Fig. 1, left). Sample TM1, however, exhibits a narrow main
peak at a lowmolecular mass (1800 g mol�1) and a shoulder at
18,000 g mol�1. This shoulder occurs at a similar apparent
molecular mass to the slope down from the peak in TM2. The
apparent molecular mass distribution for TM2 is perfectly
unimodal, with the mode being at 2700 g mol�1. From the
FlowFFF fractograms we can conclude that TM1 has a gener-
ally similar distribution of apparentmolecularmasses of NOM
like TM2, but shows a distinct fall in NOM concentration in the
intermediate molecular weight-region which is accompanied
by a slight increase in the low molecular mass region. The
fluorescence signals are almost identical in both the FlowFFF
and HPSEC analyzes (marked with Fl in Fig. 2 a and b).
The apparentmolecular masses obtained by HPSEC exhibit
a wider range, ranging from 500 g mol�1 to >145,000 g mol�1,

Fig. 1 e FlowFFF fractogram (left) and HPSEC chromatogram (right) for samples TM1 and TM2. Reported signals are NOM
(expressed as DOC concentration in mmol LL1, measured as UVeVis signal at 254 and 250 nm).
wat e r r e s e a r c h 4 7 ( 2 0 1 3 ) 2 7 5 7e2 7 6 9 2763
with a maximum peak for TM2 at 4600 g mol�1 and for TM1 at
2900 g mol�1 (Fig. 1, right).
It should be noted that in both techniques singlemolecules
and assemblies and aggregates of single molecules cannot be
distinguished. With regard to the measured apparent molec-
ular masses, the two techniques investigated yield substan-
tially different values. These techniques use fundamentally
different mechanisms for separating colloids. There are
several possible explanations for the discrepancies between
the apparent molecular mass distributions determined by
HPSEC and those determined by FlowFFF: (i) dependence of
retention time on sample load and mobile phase ionic
strength, (ii) charge exclusion between NOM and the packing
material in the HPSEC analysis, (iii) influence of the rod-like
structure of PSS, and (iv) the choice of standards used.
As shown previously by Neubauer et al. (2011), the reten-
tion times for both PSS and NOM are subject to marked vari-
ations, depending on the ionic strength and sample load. For
all conditions tested, the most reliable molecular mass cali-
brations were obtained at elevated ionic strengths in the
carrier solution and low injected PSS mass.
The same effects with regards to sample load and ionic
strength have also been previously observed for HPSEC:
retention volumes increase with increasing volume/mass of
sample injection and with increasing ionic strength. For PSS,
the dependence on concentration is considered to be due to
the decrease in hydrodynamic volume of the polymer mole-
cule in solution (Mori and Barth, 1999). The effect of ionic
strength on the retention volume for PSS has been ascribed to
a combination of ion exclusion, hydrophobic interaction, and
size exclusion (Mori, 1989). To avoid the ionic strength effect
and the bias created by injecting a too high sample load, we
used even lower injected masses for PSS than suggested in
previous studies (Pelekani et al., 1999) and a lower ionic
strength than recommended in optimization studies (Hongve
et al., 1996). Charge exclusion effects between NOM and the
packing material also need to be taken into account, and may
differ between standard and samplemolecules, as in FlowFFF.
The stationary phase of the HPSEC column is composed of
modified silica and possesses residual negatively charged
sites at mobile phase pH values above the surface pHpzc
between 2 and 4 (Chin and Gschwend, 1991). As a result, large
polyelectrolytes such as humic substances may be prevented
by electrostatic repulsion from diffusing into the pores of the
stationary phase (Chin and Gschwend, 1991), leading to
decreased retention volumes. Furthermore, in HPSEC the
fractal dimensions of an analyte have a greater impact on its
passage through the porous packing material than in FlowFFF
analysis. The rod-like structure of PSSmay, therefore, result in
elution volumes that are smaller than expected. Thismight, at
least to some extent, explain the higher apparent molecular
masses obtained by HPSEC.
The determination of apparent molecular mass distribu-
tions on the basis of calibrations using molecular mass stan-
dards that are not completely identical with the sample
molecules always carries a risk of systematic errors. If two
methods that both depend on different physical and chemical
properties of standards and the sample are then compared,
then deviations in the results obtained are likely to be com-
mon. Since the character of the sample NOM does not allow
direct determination of its molecular mass after separation
using, e.g., static light scattering photometers, it is likely that
the effectsmentioned abovemay bias our apparent molecular
mass determinations by FlowFFF andHPSEC. Bolea et al. (2006)
and Jackson et al. (2005) explained deviations in the apparent
molecular mass distributions of NOM that was measured by
FlowFFF analyzes and HPSEC analyzes, by interaction with
equipment surfaces, charge repulsion and changes of colloid
conformation upon dilution in the respective mobile phase
solution.
Comparisons of chromatographic characteristics such as
plate number and plate height (Mori and Barth, 1999; Sant and
Gale, 2006) for a molecular mass standard (10.6 kgmol�1) have
shown that the peak broadening is much less pronounced
with HPSEC which yielded more than three times larger plate
numbers (Na 75, Nb 146) than achieved by FlowFFF (Na 26, Nb
45). The plate height for the 10.6 kg mol�1 standard was lower
for HPSEC analysis (Ha 2.7 mm, Hb 1.4 mm) than for FlowFFF
analysis (Ha 7 mm, Hb 4 mm). The plate height derived from
the FlowFFF analysis is consistent with plate heights reported
by Giddings et al. (1984), when extrapolating their data to our
run conditions (approximately 0.3 cm s�1 flow velocity).
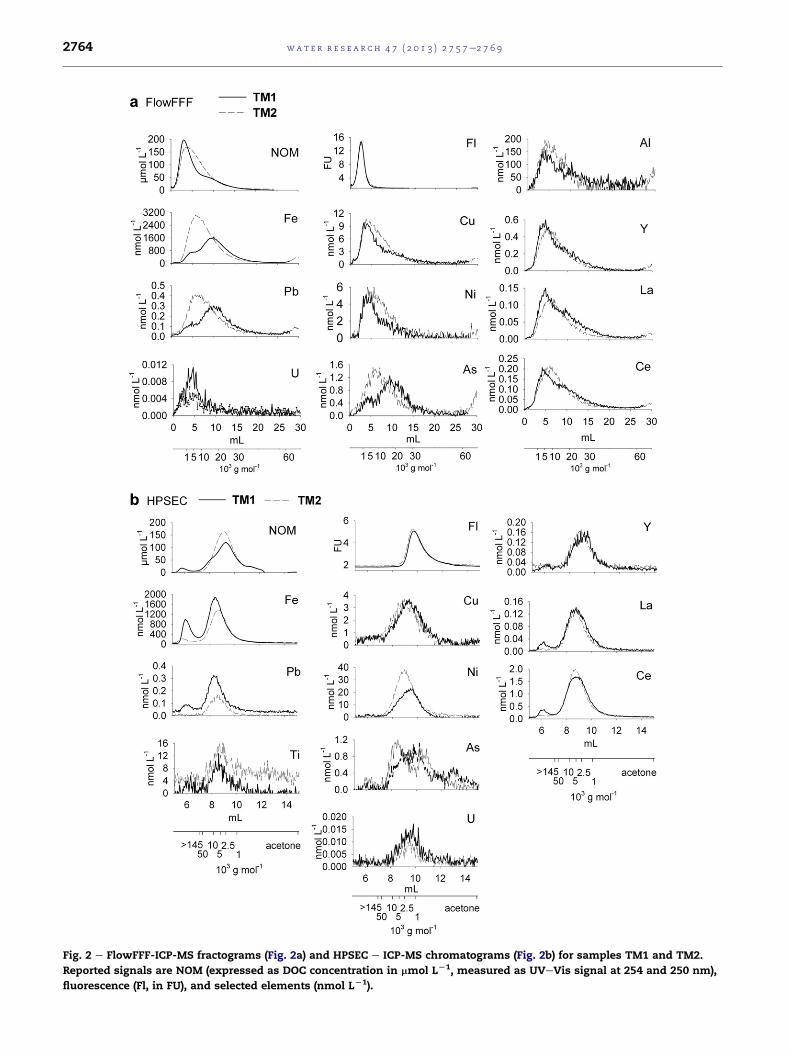
Fig. 2 e FlowFFF-ICP-MS fractograms (Fig. 2a) and HPSEC e ICP-MS chromatograms (Fig. 2b) for samples TM1 and TM2.
Reported signals are NOM (expressed as DOC concentration in mmol LL1, measured as UVeVis signal at 254 and 250 nm),
fluorescence (Fl, in FU), and selected elements (nmol LL1).
wat e r r e s e a r c h 4 7 ( 2 0 1 3 ) 2 7 5 7e2 7 6 92764

wat e r r e s e a r c h 4 7 ( 2 0 1 3 ) 2 7 5 7e2 7 6 9 2765
3.3. The apparent molecular mass distributions of ironwhich is bound to NOM and present as iron organo-mineralcolloids
FlowFFF analysis shows that NOM is the only identifiable
colloid type in TM2 (Fig. 2a). The apparent molecular mass
distribution for NOM extends from a few hundred g mol�1 up
to approximately 30,000 gmol�1 in FlowFFF analysis, and from
a few hundred g mol�1 to >145,000 g mol�1 in HPSEC analysis
(Fig. 2a and b). The iron signal derived from FlowFFF analysis
and HPSEC analysis is parallel to the UVeVis signal. This is
indicative of iron which is associated with NOM. The iron
occupation of binding sites of the DOC was calculated by
comparing the peak area of the iron signal (60 meqmL�1) to the
peak area of the functional group distribution (104 meq mL�1)
from the FlowFFF analysis. This indicates that iron occupies
up to 60% of the binding sites of the NOM (HPSEC and FlowFFF
data for TM2 in Supplementary Material, Figure S1).
Sample TM1 has a more complex NOM and iron distribu-
tion than TM2. As mentioned above, in the FlowFFF fracto-
gram, NOM shows a single peak at 1800 gmol�1 and a shoulder
at a molecular mass of 18,000 g mol�1 (Fig. 2a), while iron has
two distinct peaks. Part of the ironco-elutes with the NOM,
consistent with iron complexation. Iron accounts only for
approximately 30% of the total complexation capacity of the
NOM in this domain. The amount of iron present in the peak at
the higher apparent molecular mass (18,000 g mol�1), howev-
er, exceeds the available binding sites in the NOM at this peak
(Supplementary Material, Figure S1). Since probe-sonication
(0.75 kJ) of TM1 did not significantly change the iron and the
UVeVis patterns, the higher molecular mass iron organo-
mineral colloids are considered to be rigid, rather than
occurring as loose aggregates of iron containing NOM colloids.
We explain this pattern as being due to NOM partly com-
plexing iron, and the higher molecular mass iron organo-
mineral colloids that consist of NOM and mainly iron min-
erals, possibly iron oxides.
The data shows that different colloid types can be exported
from the wetland over time. There are several factors that
might influence colloid composition. On the one hand, during
changing hydrodynamic conditions, e.g., variation of
groundwater levels, NOM and elements could be mobilized
from different soil/peat layers. Freezing and thawing possibly
affects the quantity and quality of the mobilized NOM. The
complexation capacity of NOM is important for the speciation
of iron.NOM forms stable complexes with iron, and the
complexation by NOM may hinder the hydrolysis of iron and
the precipitation of iron hydroxides (Vilge-Ritter et al., 1999).
Additionally, pH is 0.5 units higher in sample TM1 (TM1:
pH 5.3, TM2: pH 4.8) and iron oxides are less soluble at higher
pH. We cannot answer yet which of these parameters is
the driving factor for the differences in colloidal composition.
More detailed studies with time series of samples and
the use of techniques suitable for iron speciation such as X-
ray absorption spectroscopy are required for a mechanistic
understanding.
Despite the fact that HPSEC results show less peak-
broadening than those from FlowFFF, these two colloid types
cannot be clearly separated (Fig. 2b). Approximately 30% of the
iron elutes in the column void volume (>145,000 gmol�1). This
is most likely because the iron organo-mineral colloids are too
large to enter the pores of the column, or due to charge
repulsion effects.
The rest of the iron is associated with the NOM at high
apparent molecular mass (>10,000 g mol�1). The mode of the
NOM is at 2900 g mol�1. The greater shear forces in HPSEC
possibly disrupt the iron organo-mineral colloids. Some of the
larger particles may also be lost in the column (the recovery
for iron in the HPSEC analysis was 86%).
Iron colloids have previously been observed with FlowFFF
in the Kalix River (Dahlqvist et al., 2007) and in theDjelso creek
(Lyven et al., 2003), both of which are in Sweden. Iron colloids
were found in the Kalix River during baseflow conditions
before the spring flood [Dahlqvist et al. (2007)], but were not
present during or after the spring flood. In contrast to our
results, no iron was associated with the NOM in the Kalix
River, when iron colloids were present. In the Djelso creek,
some of the iron was associated with the NOM.
3.4. Binding of elements in the presence of NOM-dominated phases (TM2)
In the FlowFFF analysis of sample TM2 (Fig. 2a) the NOM, as
represented by the UVeVis absorption signal, covers a wider
range of apparent molecular masses, while only the low mo-
lecularmass NOMexhibits fluorescence. This observation is in
accordance with previous studies (Dahlqvist et al., 2004;
Hassellov, 2005; Stolpe and Hassellov, 2007), who found that
the fluorescence signal is limited to the low molecular mass
NOM, while UVeVis absorption covered a broader apparent
molecular mass distribution in NOM. It has been argued that
the low molecular mass and the fluorescent properties are
typical of fulvic compounds (Stolpe and Hassellov, 2007 and
references therein). TheNOMin thehigher apparentmolecular
mass regions could behumic substances (Stolpe andHassellov,
2007). The associationwith iron could quench the fluorescence
signal of the NOM (Seitz, 1981). Element concentrations show
patterns that are essentially parallel the UVeVis absorption
signal. It is noticeable, however, that the modes of iron, lead,
arsenic, yttrium and the REEs are shifted toward higher
retention volumes in the highermolecularmass fraction of the
NOM, indicating an increased abundance of these elements
within this fraction. This observation from FlowFFF analysis
wasconfirmedbyHPSECanalysis (Fig. 2b): thepeakmaxima for
iron, lead, yttrium, REEs, and some of the titanium are shifted
toward higher apparent molecular masses, compared to the
NOM (UVeVis) peak. Nickel and copper have the same peak
pattern as the NOM, indicating an even distribution over all
molecularmass fractions (Fig. 2b). Kaschl et al. (2002) andBolea
et al. (2006) also showed a preferred association of iron with
highmolecularmassNOM, in contrast to divalent cations such
as copper, zinc, nickel and manganese. It has been shown
(Geckeis and Rabung, 2008) that the higher charge of trivalent
cations induces a stronger NOM agglomeration by linking
together several organic molecules. We have not, however,
been able to distinguish iron-induced aggregation of smaller
molecules to largermolecularmass clusters from iron-binding
to single molecules of larger apparent molecular mass.
Our results indicate that 67% of the NOM (measured as
organic carbon) in TM2 is retained by the ultrafiltration
wat e r r e s e a r c h 4 7 ( 2 0 1 3 ) 2 7 5 7e2 7 6 92766
membrane (1000 g mol�1 NMWCO, Table 1). The recovery of
the UVeVis signal in the FlowFFF analysis is higher (79%),
which can be explained by the lower mass weight cut-off
(300 g mol�1) in this analysis (Table 1). Some lack of corre-
spondence could also be attributable to the using UVeVis as a
proxy for DOC concentration in FlowFFF analyzes. However,
the recovery of many metals and metalloids (e.g., iron,
aluminum, cobalt, copper, lead, arsenic, thorium, uranium) in
the FlowFFF analysis is generally lower than the colloid-
associated concentrations calculated from ultrafiltration
data. Recovery losses of elements can occur in FlowFFF anal-
ysis when the metal and metalloid species are smaller than
the NMWCO of themembrane, e.g., if they are present as ionic
species or bound to very small organic molecules. Although
metal/metalloidehumate complexes are more stable at the
pH of the mobile phase in the FlowFFF measurements (pH 7)
than at the pH of the surface-water samples (Tipping, 2002),
metals and metalloids can still desorb from the NOM. This
may be due to re-equilibration with the mobile carrier phase
during the analysis, where new sorption equilibriummight be
established between the NOM and the metals and metalloids.
Desorption of metals and metalloids from NOM in the metal-
free mobile carrier phase might also explain the relatively
poor recovery of metals compared to colloid-associated con-
centrations determined by ultrafiltration. In order to get a
rough estimation on the error introduced by the addition of
NH4þ to the sample, chemical equilibrium modeling with Vi-
sual Minteq was performed. The parameters which were used
in the chemical equilibrium model are described in the
Supplementary Material. The addition of 15 mM NH4þ to the
sample results in changes <10% with respect to the distribu-
tion of elements between the “truly dissolved”, the “NOM
bound” and the “iron hydroxide-bound” fraction. This is
within the standard deviation of duplicate measurements
(10%). Variations in the range of 15% are indicated for the REEs.
Specifically, about 15% more yttrium, lanthanum and cerium
should be “dissolved” (or forming complexes with inorganic
ligands) with the addition of NH4þ.The higher pH of the mobile
phase (pH 7 versus pH around 5 in the samples) could also
cause adsorption of REEs on iron hydroxides. However, these
are estimations from equilibrium modeling, and the kinetics
of these reactions is not known.
The recoveries of lanthanum and cerium were >200% in
HPSEC analysis. The REE concentrations of the samples were
low, and therefore only qualitative and no quantitative in-
formation be derived from this data.
In HPSEC analysis part of the arsenic elutes together with
the low molecular mass NOM (Fig. 2b, fluorescence signal).
Arsenic speciation analysis results from IC e ICP-MS show
that these fractions are not bound colloids; instead, 42% of the
total arsenic in TM2 is present as dissolved arsenic species (as
compared to 22% of the arsenic passed through the
1000 g mol�1 NMWCO ultrafiltration membranes). The rela-
tively high amount of NOM-bound arsenic (>40%) is in
contrast to results from Bolea et al. (2006), who found that
more than 90% of the arsenic was present as dissolved species
or bound tomaterial<1000 gmol�1 in the humic substances of
a compost leachate. They also found no trace of arsenic in
their FlowFFF and HPSEC analyzes and therefore assumed
that arsenic was mainly present as ionic oxyanions.
According to the speciation analysis of the dissolved
arsenic species, As(V) is predominant (90%) while minor
quantities (10%) are present as arsenobetaine (Supplementary
Material, Figures S2 and S3). The elution times for dimethyl
arsenic and As(V) were tested using HPSEC and found to
match the arsenic peaks at low apparent molecular masses.
Methylated arsenic species such as monomethyl arsenic and
dimethyl arsenic have previously been reported in soils
(Pongratz, 1998), but there are only a few reports of arsen-
obetaine being present in terrestrial environments (Geiszinger
et al., 2002; Huang and Matzner, 2006).
The comparison of arsenic data from ultrafiltration, HPSEC
analysis and FlowFFF analysis allows the following conclu-
sions: In HPSEC analysis, dissolved arsenic species co-eluted
with NOM. This prevents the distinction between colloid-
associated and dissolved trace elements. The fraction of
arsenic passing an ultrafilter (1000 g mol�1) was lower (22%)
than the dissolved arsenic fraction determined by IC-ICP-MS
(42%). This indicates that dissolved arsenic species might be
retained by the ultrafiltration membrane. According to IC-ICP-
MS analysis 60% of the arsenic was associated with colloids.
The colloid-associated arsenic fraction determined by FlowFFF
was underestimated (43%). This is related to sorption of colloids
and associated elements to themembrane, and desorption and
permeation of dissolved arsenic through the membrane.
We want to stress that arsenic speciation was used here as
a complementary analytical technique to cross-check the
concentrations of “dissolved “arsenic that we obtained from
ultrafiltration (passage through a 1000 g mol�1 NMWCO
membrane) and FlowFFF (passage through a 300 g mol�1
NMWCO membrane), rather than with the purpose of deter-
mining the in situ speciation of the dissolved arsenic compo-
nents. Sample storage might have changed the in situ
speciation of arsenic.
Uranium interacts strongly with the NOM, and ultrafiltra-
tion shows that approximately 80% of the uranium in sample
TM2 is associated with the NOM.
3.5. Binding of elements in the presence of NOM and ironorgano-mineral colloids (TM1)
The sample TM1 exhibits a distinctively different distribution
pattern for iron and some of the trace elements from sample
TM2. Fig. 3 shows schematic FlowFFF fractograms for samples
TM2 and TM1, illustrating the different distributions for both
of these samples. The NOM, iron and copper have parallel
elution patterns in sample TM2, whereas in TM1 iron is partly
(approximately 30%) associated with the NOM, but the ma-
jority elutes at higher retention volumes (Fig. 3). Copper elutes
together with the NOM in sample TM1, indicating that the
NOM and the iron organo-mineral colloids in TM1 have
significantly different affinities for trace elements.
Most of the arsenic is associated with the iron organo-
mineral colloids (Fig. 2a and b). However, approximately 20%
of the arsenic co-elutes with the NOM despite the strong
tendency for arsenic to bind to iron minerals (Sharma et al.,
2010). A possible interaction mode is the binding of arsenic
to NOM via an iron bridging ternary complex (Mikutta and
Kretzschmar, 2011; Ritter et al., 2006).The IC - ICP-MS anal-
ysis revealed that 32% of the arsenic is present as dissolved

Fig. 3 e Schematic FlowFFF e ICP-MS fractograms for samples TM2 and TM1, showing NOM, iron and copper.
wat e r r e s e a r c h 4 7 ( 2 0 1 3 ) 2 7 5 7e2 7 6 9 2767
arsenic species, with As(V) and As(III) predominating while
minor quantities are present as arsenobetaine and dimethyl
arsenic (Supplementary Material, Figure S2).
The interaction of inorganic arsenic with NOM and iron-
minerals has already been intensively investigated (e.g., Liu
and Cai, 2010; Liu et al., 2011; Redman et al., 2002), but sorp-
tion and partitioning of methylated and non-methylated
organic arsenic species onto NOM and iron minerals is as
yet only poorly understood.
From FlowFFF analysis it can be seen that some of the lead
(approximately 30%) is associated with NOM, and approxi-
mately70% isassociatedwith the ironorgano-mineral colloids.
Copper, Nickel, aluminum, yttrium, lanthanum and
cerium have a similar mode and size distribution to the NOM,
with a main peak at a low apparent molecular mass
(1800 g mol�1) and a shoulder at a higher apparent molecular
mass (18,000 g mol�1, Fig. 2a). In contrast to our results, it has
been shown that the light REEs, to which lanthanum and
cerium belong, associate more with iron colloids than with
NOM (Andersson et al., 2006). The higher affinity of lead for the
iron organo-mineral colloids, compared to that of copper,
aluminum, and rare earth elements, is in agreement with the
results of previous FlowFFF studies (Lyven et al., 2003).
The FlowFFF and HPSEC analyzes show that uranium is
only associated with the NOM and that, as with sample TM2,
approximately 80% of the uranium is retained by the
1000 g mol�1 NMWCO membrane in ultrafiltration. Almost all
of the iron is associated with colloids (Table 1).
As in sample TM2, the percentages of metals in TM1 that
are associated with colloids were underestimated by FlowFFF
analysis compared to ultrafiltration, except for the REEs,
which had recoveries >100%. The quantification of the REEs
was, however, hindered by their low concentrations
(<2 nmol L�1). The quantitative association of metals and
metalloids with NOM and iron organo-mineral colloids cannot
be deduced by FlowFFF analysis alone, but requires additional
measurements such as those obtained by ultrafiltration.
4. Environmental implications
The results demonstrate that NOM and very small
sized iron organo-mineral colloids can be exported from
wetlands. The different nature of the colloids being exported
at different situations cannot be distinguished with filtration
or ultrafiltration. Analysis with FlowFFF e UVeVis e fluores-
cence e ICP-MS provides both information on the apparent
molecular mass of these colloid types as well as information
of the association of metals and metalloids. NOM and iron
organo-mineral colloids showed different affinities for trace
elements. Copper, nickel, aluminum, yttrium, lanthanum,
cerium and uranium are associated with the NOM. Lead and
arsenic exhibited a higher affinity for the iron organo-mineral
colloids.
The inconsistencies observed for the fractionation of NOM
and iron by the various techniques points to the limitations of
invasive size fractionation techniques. With HPSEC e UVeVis
e fluorescencee ICP-MS it was not possible to resolve the iron
organo-mineral colloids, in contrast to FlowFFF analysis. The
resolution with respect to peak broadening was better in
HPSEC compared to FlowFFF analysis. However, HPSEC e
UVeVis e fluorescence e ICP-MS is applicable, with some
limitations, for the analysis of NOM and associated trace ele-
ments. The quantification of colloid-associated arsenic is
however impeded by the co-elution of dissolved arsenic spe-
cies with NOM.
Ultrafiltration and arsenic speciation analysis are useful
for the determination of dissolved metals and metalloids.
During the analysis with FlowFFF and HPSEC there is the
possibility that metals and metalloids desorb from the NOM
when re-equilibrating with the mobile phase and establish-
ment of a new sorption equilibrium may occur. We conclude
that the combination of FlowFFF analysis with ultrafiltration
and element-specific speciation techniques such as IC-ICP-MS
is advantageous for 1) the detection of NOM and iron organo-
mineral colloids and 2) the quantification of dissolved and
colloid-associated trace elements.
NOM and the iron organo-mineral colloids are expected to
exhibit different geochemical behavior when subjected to
changing hydrochemical environments, i.e. varying ionic
strength, pH, and redox conditions. These conditionsmight be
found at the transition from, e.g., a fluvial system to an estu-
arine system, and finally to a marine system, and are likely to
impact on trace metal transport. NOM is thought to be more
mobile in aquatic systems than iron organo mineral colloids
that are subject to aggregation and sedimentation (Stolpe and
Hassellov, 2007). This could result in the selective removal of
adsorbed/complexed metals and metalloids from the water
column. Iron organo-mineral colloids can easily be overlooked
if high-resolution size-separation techniques such as FlowFFF

wat e r r e s e a r c h 4 7 ( 2 0 1 3 ) 2 7 5 7e2 7 6 92768
coupled to ICP-MS are not available. Mineralogical identifica-
tion of the iron organo-mineral colloids and determination of
the associated metal speciation, availability and dynamics,
however, remains still a challenge for the future.
Acknowledgment
The authors thank Dr. Stephan Kohler who performed the
functional group titration at the Department of Aquatic Sci-
ences and Assessment (Swedish University of Agriculture
Sciences, Uppsala, Sweden) and Wolfgang Obermaier for the
assistance with ICP-OES and ICP-MS measurements.
Appendix A. Supplementary data
Supplementary data related to this article can be found at
http://dx.doi.org/10.1016/j.watres.2013.02.030.
r e f e r e n c e s
Andersson, K., Dahlqvist, R., Turner, D., Stolpe, B., Larsson, T.,Ingri, J., Andersson, P., 2006. Colloidal rare earth elements in aboreal river: changing sources and distributions during thespring flood. Geochimica et Cosmochimica Acta 70 (13),3261e3274.
Baalousha, M., Stolpe, B., Lead, J.R., 2011. Flow field-flowfractionation for the analysis and characterization of naturalcolloids and manufactured nanoparticles in environmentalsystems: a critical review. Journal of Chromatography A 1218(27), 4078e4103.
Benedetti, M.F., Ranville, J.F., Allard, T., Bednar, A.J., Menguy, N.,2003. The iron status in colloidal matter from the Rio Negro,Brasil. Colloids and Surfaces A: Physicochemical andEngineering Aspects 217 (1e3), 1e9.
Bolea, E., Gorriz, M.P., Bouby, M., Laborda, F., Castillo, J.R.,Geckeis, H., 2006. Multielement characterization ofmetal-humic substances complexation by size exclusionchromatography, asymmetrical flow field-flow fractionation,ultrafiltration and inductively coupled plasma-massspectrometry detection: a comparative approach. Journal ofChromatography A 1129 (2), 236e246.
Chin,Y.-P., Gschwend, P.M., 1991.Theabundance,distribution, andconfigurationofporewaterorganic colloids in recent sediments.Geochimica et Cosmochimica Acta 55 (5), 1309e1317.
Dahlqvist, R., Benedetti, M.F., Andersson, K., Turner, D.,Larsson, T., Stolpe, B., Ingri, J., 2004. Association of calciumwith colloidal particles and speciation of calcium in the Kalixand Amazon rivers. Geochimica et Cosmochimica Acta 68 (20),4059e4075.
Dahlqvist, R., Andersson, K., Ingri, J., Larsson, T., Stolpe, B.,Turner, D., 2007. Temporal variations of colloidal carrierphases and associated trace elements in a boreal river.Geochimica et Cosmochimica Acta 71 (22), 5339e5354.
Dubascoux, S., Le Hecho, I., Hassellov, M., v.d. Kammer, F.,Gautier, M.P., Lespes, G., 2010. Field-flow fractionation andinductively coupled plasma mass spectrometer coupling:history, development and applications. Journal of AnalyticalAtomic Spectrometry 25 (5), 613e623.
Geckeis, H., Rabung, T., 2008. Actinide geochemistry: from themolecular level to the real system. Journal of ContaminantHydrology 102 (3e4), 187e195.
Geiszinger, A., Goessler, W., Kosmus, W., 2002. Organoarseniccompounds in plants and soil on top of an ore vein. AppliedOrganometallic Chemistry 16 (5), 245e249.
Giddings, J.C., Schure, M.R., Myers, M.N., Velez, G.R., 1984. Endeffects in Field-Flow Fractionation channels: theory andmeans for reducing incremental zone broadening. AnalyticalChemistry 56 (12), 2099e2104.
Hassellov, M., Lyven, B., Haraldsson, C., Sirinawin, W., 1999.Determination of continuous size and trace elementdistribution of colloidal material in natural water by on-linecoupling of flow field-flow fractionation with ICPMS.Analytical Chemistry 71, 3497e3502.
Hassellov, M., 2005. Relative molar mass distributions ofchromophoric colloidal organic matter in coastal seawaterdeterminedbyFlowField-FlowFractionationwithUVabsorbanceand fluorescence detection. Marine Chemistry 94, 111e123.
Hassellov, M., v.d. Kammer, F., Beckett, R., 2007. Characterisationof aquatic colloids and macromolecules by field-flowfractionation. In: Wilkinson, K.J., Lead, J.R. (Eds.),Environmental Colloids and Particles: Behaviour, Separation,and Characterisation. John Wiley & Sons Ltd, Chichester.
Hassellov, M., v.d. Kammer, F., 2008. Iron oxides as geochemicalnanovectors for metal transport in soileriver systems.Elements 4, 401e406.
Her, N., Amy, G., Foss, D., Cho, J., Yoon, Y., Kosenka, P., 2002.Optimization of method for detecting and characterizing NOMby HPLC-size exclusion chromatography with UV and on-lineDOC detection. Environmental Science and Technology 36,1069e1076.
Hofmann, T., Baumann, T., Bundschuh, T., v.d. Kammer, F.v.d.,Leis, A., Schmitt, D., Schafer, T., Thieme, J., Totsche, K.U.,Zanker, H., 2003a. Aquatic colloids: Definition and relevance e
a review. Aquatische Kolloide I: Eine Ubersichsarbeit zurDefinition, zu Systemen und zur Relevanz 8 (4), 203e213.
Hofmann, T., Baumann, T., Bundschuh, T., v.d. Kammer, F.v.d.,Leis, A., Schmitt, D., Schafer, T., Thieme, J., Totsche, K.U.,Zanker, H., 2003b. Aquatic colloids: sampling andcharacterization e a review. Aquatische Kolloide II: EineUbersichtsarbeit zur Probennahme, Probenaufbereitung undCharakterisierung 8 (4), 213e223.
Hongve, D., Baann, J., Becher, G., Lømo, S., 1996. Characterizationof humic substances by means of high-performance sizeexclusion chromatography. Environment International 22 (5),489e494.
Hru�ska, J., Laudon, H., Johnson, C.E., Kohler, S., Bishop, K., 2001.Acid/base character of organic acids in a boreal stream duringsnowmelt. Water Resources Research 37 (4), 1043e1056.
Huang, J.H., Matzner, E., 2006. Dynamics of organic and inorganicarsenic in the solution phase of an acidic fen in Germany.Geochimica et Cosmochimica Acta 70 (8), 2023e2033.
Jackson, B.P., Ranville, J.F., Bertsch, P.M., Sowder, A.G., 2005.Characterization of colloidal and humic-bound Ni and U in the“dissolved” fraction of contaminated sediment extracts.Environmental Science and Technology 39 (8), 2478e2485.
Jirsa, F., Neubauer, E., Kittinger, R., Hofmann, T., Krachler, R., v.d.Kammer, F. and Keppler, B.K. Natural organic matter and ironexport from the Tanner Moor, Austria Limnologica, in press,http://dx.doi.org/10.1016/j.limno.2012.09.006.
Kaschl, A., Romheld, V., Chen, Y., 2002. Trace metal distributionin soluble organic matter from municipal solid waste compostdetermined by size-exclusion chromatography.Environmental Toxicology and Chemistry 21 (9), 1775e1782.
Krachler, R., Jirsa, F., Ayromlou, S., 2005. Factors influencing thedissolved iron input by river water to the open ocean.Biogeosciences 2 (4), 311e315.
Krachler, R., Krachler, R.F., v.d. Kammer, F., Suphandag, A.,Jirsa, F., Ayromlou, S., Hofmann, T., Keppler, B.K., 2010.Relevance of peat-draining rivers for the riverine input of

wat e r r e s e a r c h 4 7 ( 2 0 1 3 ) 2 7 5 7e2 7 6 9 2769
dissolved iron into the ocean. Science of the TotalEnvironment 408 (11), 2402e2408.
Laborda, F., Ruiz-Beguerıa, S., Bolea, E., Castillo, J.R., 2009.Functional speciation of metal-dissolved organic mattercomplexes by size exclusion chromatography coupled toinductively coupled plasma mass spectrometry anddeconvolution analysis. Spectrochimica Acta e Part B AtomicSpectroscopy 64 (5), 392e398.
Leenheer, J.A., Croue, J.P., 2003. Characterizing aquatic dissolvedorganic matter. Environmental Science & Technology 37,18Ae26A.
Leist, M., 2011. Speciation of Arsenic By LC-ICP-MS. AgilentTechnologies.
Liu, G., Cai, Y., 2010. Complexation of arsenite with dissolvedorganic matter: conditional distribution coefficients andapparent stability constants. Chemosphere 81 (7), 890e896.
Liu, G., Fernandez, A., Cai, Y., 2011. Complexation of arsenite withhumic acid in the presence of ferric iron. EnvironmentalScience and Technology 45 (8), 3210e3216.
Lyven, B., Hassellov, M., Turner, D.R., Haraldsson, C.,Andersson, K., 2003. Competition between iron- and carbon-based colloidal carriers for trace metals in a freshwaterassessed using flow field-flow fractionation coupled to ICPMS.Geochimica et Cosmochimica Acta 67 (20), 3791e3802.
Mikutta, C., Kretzschmar, R., 2011. Spectroscopic evidence forternary complex formation between arsenate and ferric ironcomplexes of humic substances. Environmental Science andTechnology 45 (22), 9550e9557.
Mori, S., 1989. Secondary effects in aqueous size exclusionchromatography of sodium poly(styrene sulfonate)compounds. Analytical Chemistry 61 (6), 530e534.
Mori, S., Barth, H.G., 1999. Size Exclusion Chromatography.Springer, Berlin Heidelberg.
Neubauer, E., v.d. Kammer, F., Hofmann, T., 2011. Influence ofcarrier solution ionic strength and injected sample load onretention and recovery of natural nanoparticles using FlowField-Flow Fractionation. Journal of Chromatography A 1218(38), 6763e6773.
Pelekani, C., Newcombe, G., Snoeyink, V.L., Hepplewhite, C.,Assemi, S., Beckett, R., 1999. Characterization of naturalorganic matter using high performance size exclusionchromatography. Environmental Science and Technology 33(16), 2807e2813.
Piccolo, A., 2001. The supramolecular structure of humicsubstances. Soil Sciences 166, 810e832.
Pokrovsky, O.S., Dupre, B., Schott, J., 2005. Fe-Al-organic colloidscontrol of trace elements in peat soil solutions: results ofultrafiltration and dialysis. Aquatic Geochemistry 11 (3),241e278.
Pongratz, R., 1998. Arsenic speciation in environmental samplesof contaminated soil. Science of the Total Environment 224(1e3), 133e141.
Redman, A.D., Macalady, D.L., Ahmann, D., 2002. Naturalorganic matter affects Arsenic speciation and sorption ontohematite. Environmental Science and Technology 36 (13),2889e2896.
Ritter, K., Aiken, G.R., Ranville, J.F., Bauer, M., Macalady, D.L.,2006. Evidence for the aquatic binding of arsenate by naturalorganic matter�suspended Fe(III). Environmental Science andTechnology 40 (17), 5380e5387.
Sant, H.J., Gale, B.K., 2006. Geometric scaling effects oninstrumental plate height in field flow fractionation. Journal ofChromatography A 1104 (1e2), 282e290.
Seitz, W.R., 1981. Fluorescence methods for studying speciationof pollutants in water: fluorescence quenching yieldsinformation on the binding of metal ions to humicsubstances. Fluorescence polarization may be used to studythe conformation of humics and the binding of organicpollutants to them. TrAC Trends in Analytical Chemistry 1,79e83.
Sharma, P., Ofner, J., Kappler, A., 2010. Formation of binary andternary colloids and dissolved complexes of organic matter, Feand As. Environmental Science and Technology 44 (12),4479e4485.
Stolpe, B., Hassellov, M., Andersson, K., Turner, D.R., 2005. Highresolution ICPMS as an on-line detector for flow field-flowfractionation; multi-element determination of colloidal sizedistributions in a natural water sample. Analytica ChimicaActa 535, 109e121.
Stolpe, B., Hassellov, M., 2007. Changes in size distribution offresh water nanoscale colloidal matter and associatedelements on mixing with seawater. Geochimica etCosmochimica Acta 71, 3292e3301.
Tipping, E., 2002. Cation Binding by Humic Substances.Cambridge University Press, Camebridge.
v.d. Kammer, F., Baborowski, M., Friese, K., 2005. Application of ahigh-performance liquid chromatography fluorescencedetector as a nephelometric turbidity detector following Field-Flow Fractionation to analyse size distributions ofenvironmental colloids. Journal of Chromatography A 1100 (1),81e89.
Vasyukova, E.V., Pokrovsky, O.S., Viers, J., Oliva, P., Dupre, B.,Martin, F., Candaudap, F., 2010. Trace elements in organic-and iron-rich surficial fluids of the boreal zone: assessingcolloidal forms via dialysis and ultrafiltration. Geochimica etCosmochimica Acta 74 (2), 449e468.
Vilge-Ritter, A., Rose, J., Masion, A., Bottero, J.Y., Laine, J.M.,1999. Chemistry and structure of aggregates formed with Fe-salts and natural organic matter. Colloids and Surfaces A:Physicochemical and Engineering Aspects 147, 297e308.
Zhou, Q., Cabaniss, S.E., Maurice, P.A., 2000. Considerations in theuse of high-pressure size exclusion chromatography (HPSEC)for determining molecular weights of aquatic humicsubstances. Water Research 34 (14), 3505e3514.