using fringe projection phase-shifting to correct contact ... · pdf fileθy =...
TRANSCRIPT

© Copyright Biolin Scientific 2014
Using Fringe Projection Phase-Shifting to Correct Contact Angles for Roughness
Effects
June 15-16th , 2016
Greg Wills
Biolin Scientific
Content
• Introduction to Contact Angle and Roughness Theory
• Fringe Projection Phase-Shifting
• Experimental
• Results‒ Validation Sample‒ Optics‒ Tiles‒ Wood Plastic Composite‒ Titanium Screws
• Conclusion
2

• Defined by intermolecular interactions between three phases; solid, liquid and vapor/gas
• Young Equation (1805) on ideal substrates:
Contact AngleA measure of wettability
LV
SLSV
γ
γγcosθY
ӨY = Young contact angle
γSV = solid-vapor interfacial tension
γSL = solid-liquid interfacial tension
γLV = liquid-vapor interfacial
tension
T. Young, In: Miscellaneous Works, Vol I, G. Peacock and J. Murray (Ed.), London, UK, 1855.
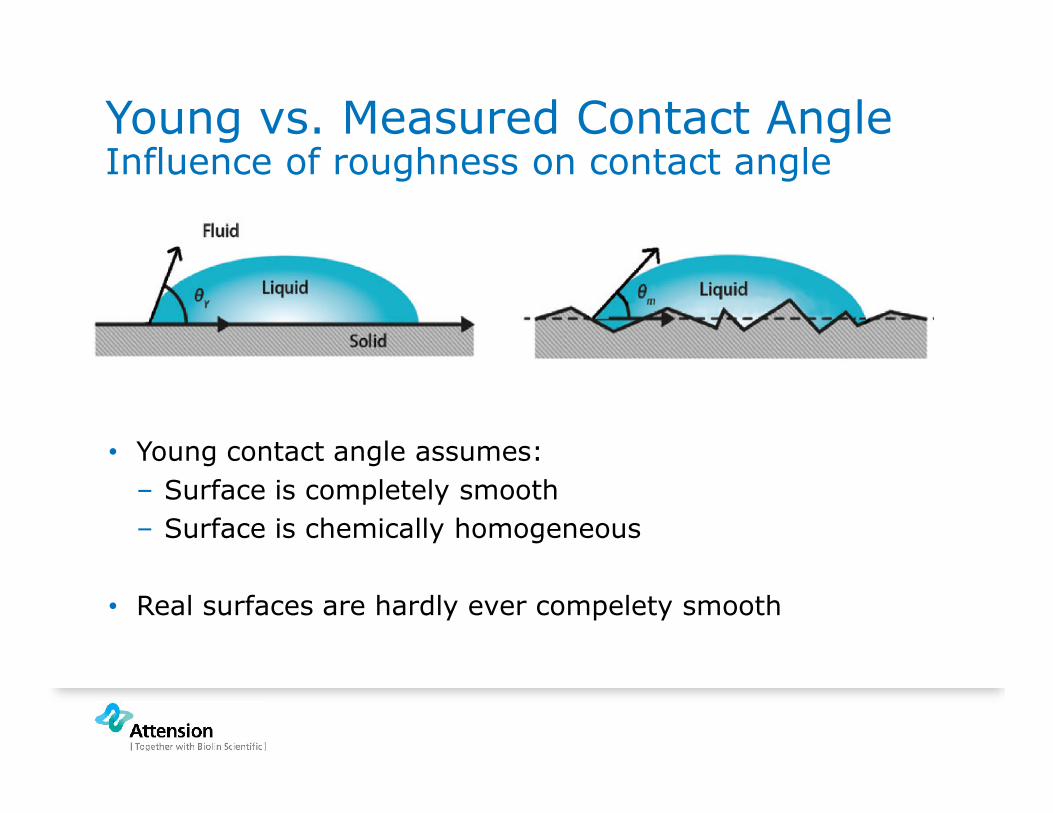
• Young contact angle assumes:
‒ Surface is completely smooth
‒ Surface is chemically homogeneous
• Real surfaces are hardly ever compelety smooth
Young vs. Measured Contact Angle Influence of roughness on contact angle

How Roughness Affects Contact Angles?
Wenzel, R.N. Industrial and engineering chemistry 1936, 28 : 8, 988-994.
• Correction for surface roughness was extablished already in 1936 by Wenzel
cosθm= r cosθY
• Wenzel equation states that surface roughness enhances existing wetting behaviour
• θ < 90⁰ roughness lower the CA
• θ > 90⁰ roughness increase the CA
θm = roughness dependent (measured) contact angle θY = Young’s contact angle corresponding to an ideal surface

How to Correct for Roughness?
• 3D surface roughness parameter, Sdr, is needed for the Wenzel equation
r = 1 for smooth surface and >1 for rough surfaces
• Wenzel correction is valid when
Drop dimensions (1 mm) are larger than roughness
by two (10 µm) to three (1 µm) orders of magnitude
Liquid wets the surface grooves
r = 1+(Sdr/ 100)
Sdr = ratio between interfacial and projected area
cosθm= r cosθY
Marmur, A. Soft Matter 2006, 2, 12-17.

Industrial R&D and QC• Many surface modification and coating
technologies influence both surface chemistry and roughness.
Possibility to separate the impacts of surface chemistry and roughness of various coating formulation, surface modifications and QC problems.
Academic• Roughness correction enables defining the
fundamental surface free energy values for rough surfaces
Why Measure Both Roughness and Contact Angle?
Surface free energy on rough surfaces
Development and quality control of coatings and surface modification technologies
8
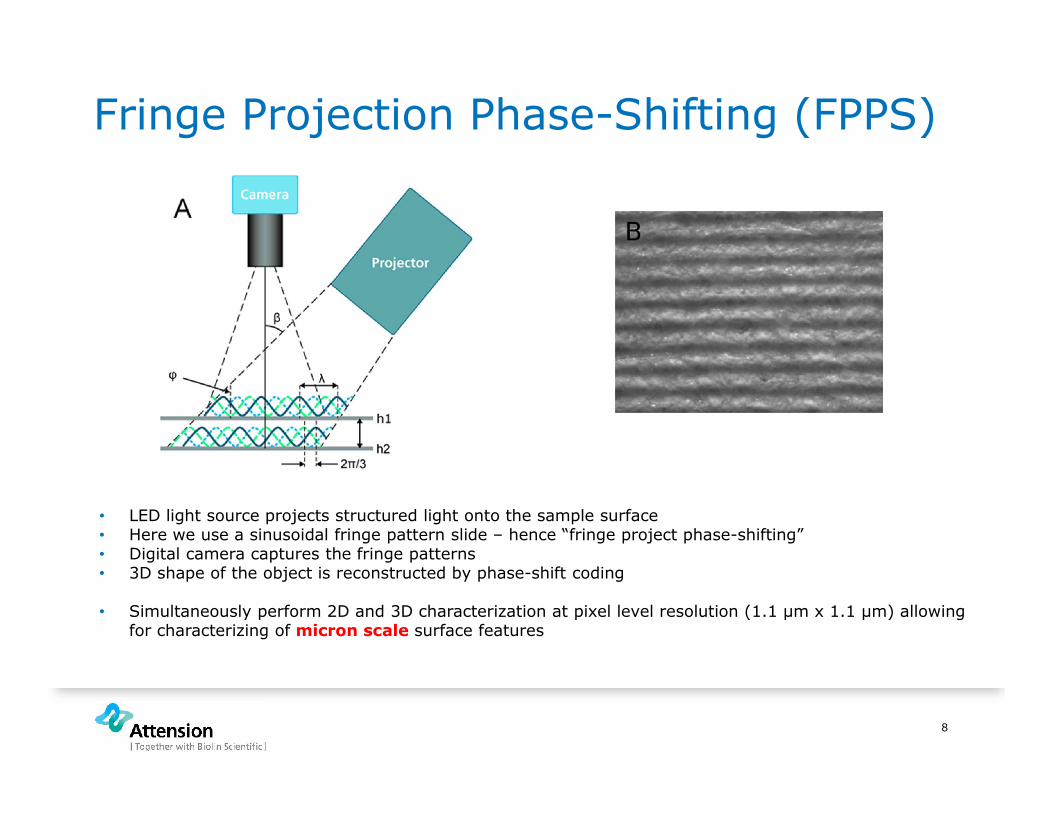
Fringe Projection Phase-Shifting (FPPS)
• LED light source projects structured light onto the sample surface• Here we use a sinusoidal fringe pattern slide – hence “fringe project phase-shifting”• Digital camera captures the fringe patterns • 3D shape of the object is reconstructed by phase-shift coding
• Simultaneously perform 2D and 3D characterization at pixel level resolution (1.1 μm x 1.1 μm) allowing for characterizing of micron scale surface features

9
FPPS Continued
(x, y) = the coordinate in the slide frame planea = background intensityb = amplitude modulationp = sinusoidal grating wavelengthφ0 = the additional phase shift caused by the surface heightδn = the phase shift from the slide movement.
• The phase shift indicates the horizontal coordinate, i.e. the height difference in every pixel providing the sample topography.
• The sinusoidal fringes can be expressed by
• the spatial phase shift can be expressed by
• Example of 3 Phase shifts
S. Zhang and P. Huang, “High-resolution, Real-time 3D Shape Acquisition”, Computer Vision and Pattern Recognition Workshop, 2004.

10
Roughness Parameters
ISO standard ISO25178: Geometrical product specifications (GPS)—Surface texture: Areal Part 2: Terms, definitions and surface texture parameters

11
Experimental Details
• Optimize back lighting• Calibrate camera• Calibrate XYZ sample stage position• Calibrate height of 3D topography module• Measure topography of 1.4 mm x 1.1 mm area• Measure sessile drop Contact Angles of ~3 uL drops
WPC 3
Optics A 1
Tile, Gloss
Penny

12
Topography Validation Sample
• Structured pattern of lines 200 mm wide with 200 mm trenches 30 mm deep
• The images were each 1.4 mm long by 1.1 mm wide
• Images B) and C) both have height scales from +30 mm (red) to -30 mm (blue).
• optical image • 2D image • 3D image

13
Representative Sample ImagesCeramic Tile with Gloss Finish
• Tile was ~ 4 inches square
• The images show a topographic map of the surface with the peaks being white or red and the valleys being black or blue.
• B, C, D images were each 1.4 mm long by 1.1 mm wide
• Images C) and D) both have height scales from +30 mm (red) to -30 mm (blue).
• Photograph of Tile • 3D Image• optical Image • 2D Image
Sample CA, o
CA (corrected), o
CA - CAc, o
Sdr, %
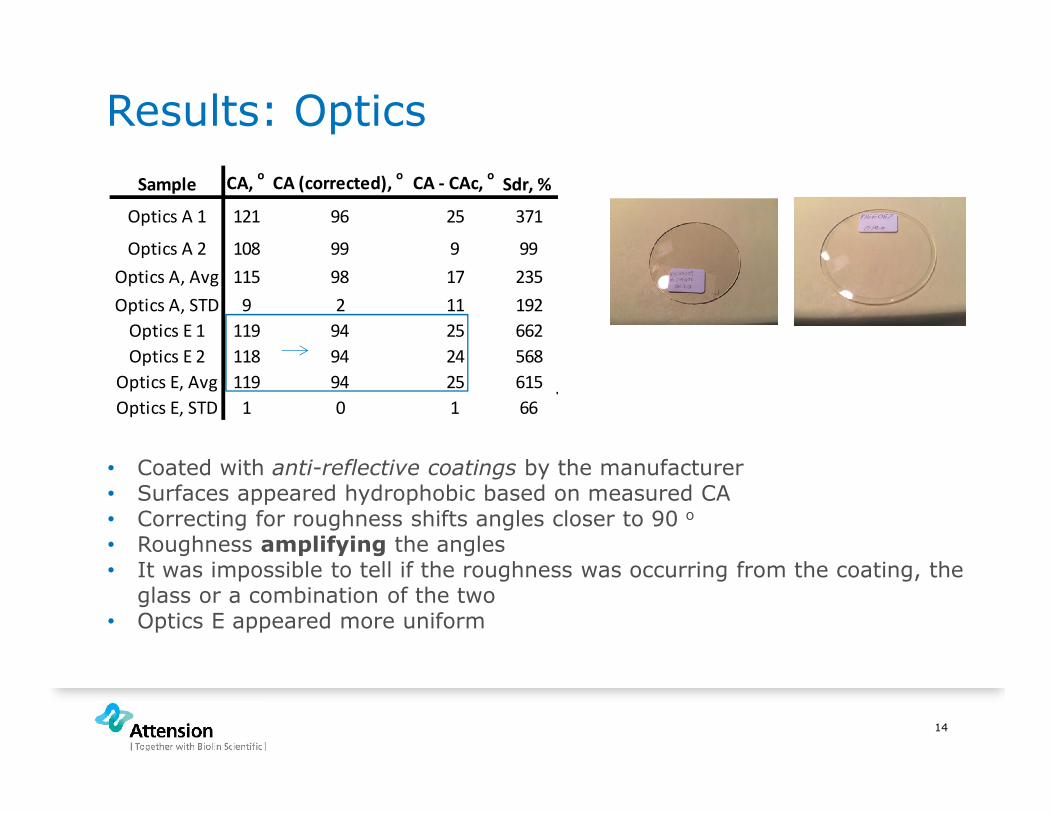
Optics A 1 121 96 25 371
Optics A 2 108 99 9 99
Optics A, Avg 115 98 17 235
Optics A, STD 9 2 11 192
Optics E 1 119 94 25 662
Optics E 2 118 94 24 568
Optics E, Avg 119 94 25 615
Optics E, STD 1 0 1 66
14
Results: Optics
• Coated with anti-reflective coatings by the manufacturer• Surfaces appeared hydrophobic based on measured CA• Correcting for roughness shifts angles closer to 90 o
• Roughness amplifying the angles• It was impossible to tell if the roughness was occurring from the coating, the
glass or a combination of the two• Optics E appeared more uniform
15
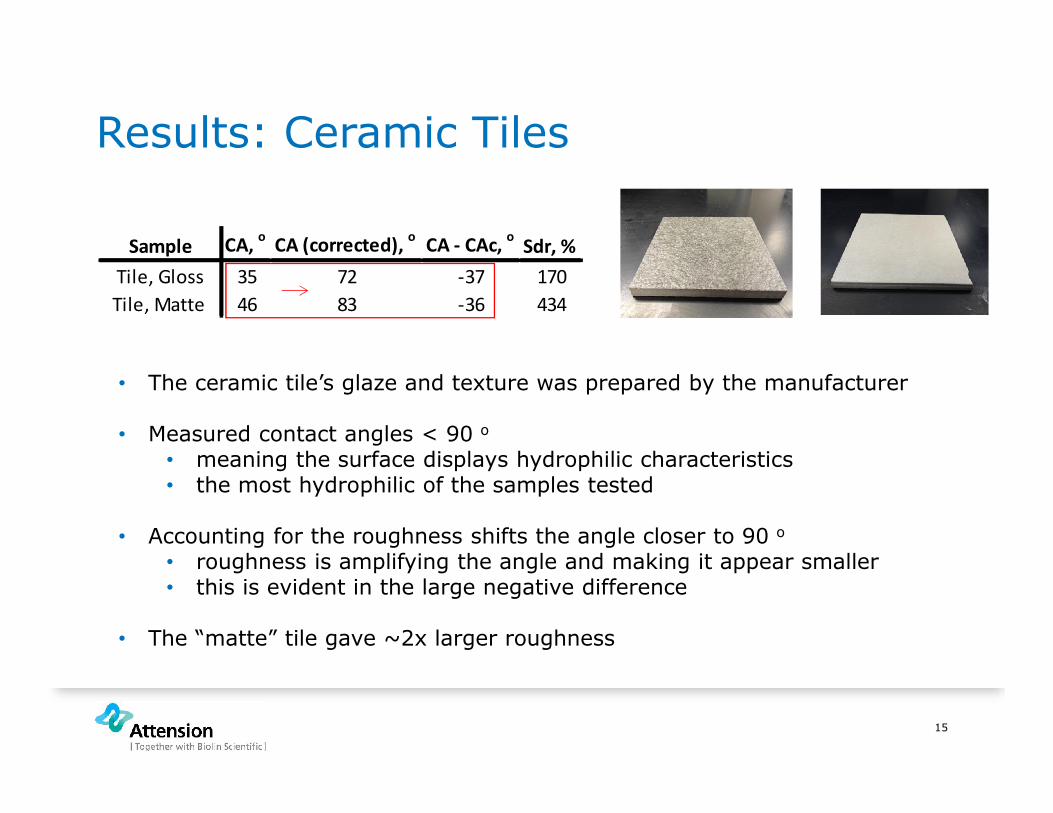
Results: Ceramic Tiles
Sample CA, o
CA (corrected), o
CA - CAc, o
Sdr, %
Tile, Gloss 35 72 -37 170
Tile, Matte 46 83 -36 434
• The ceramic tile’s glaze and texture was prepared by the manufacturer
• Measured contact angles < 90 o
• meaning the surface displays hydrophilic characteristics • the most hydrophilic of the samples tested
• Accounting for the roughness shifts the angle closer to 90 o
• roughness is amplifying the angle and making it appear smaller• this is evident in the large negative difference
• The “matte” tile gave ~2x larger roughness
16
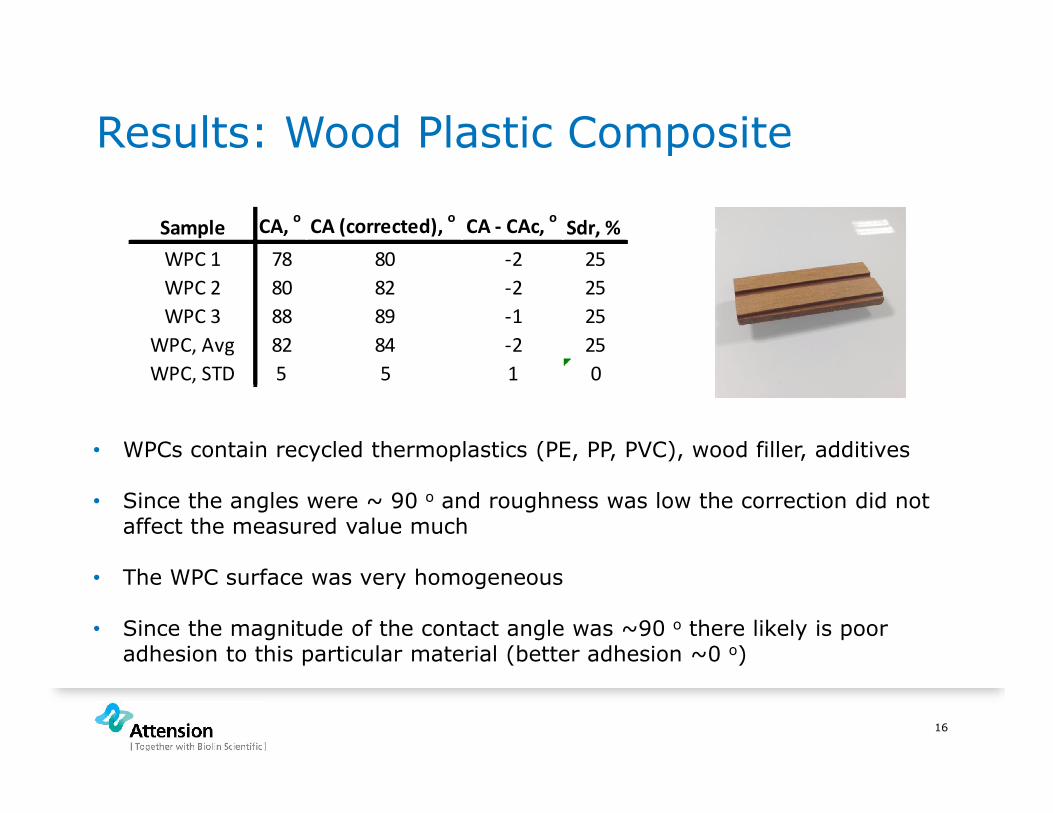
Results: Wood Plastic Composite
Sample CA, o
CA (corrected), o
CA - CAc, o
Sdr, %
WPC 1 78 80 -2 25
WPC 2 80 82 -2 25
WPC 3 88 89 -1 25
WPC, Avg 82 84 -2 25
WPC, STD 5 5 1 0
• WPCs contain recycled thermoplastics (PE, PP, PVC), wood filler, additives
• Since the angles were ~ 90 o and roughness was low the correction did not affect the measured value much
• The WPC surface was very homogeneous
• Since the magnitude of the contact angle was ~90 o there likely is poor adhesion to this particular material (better adhesion ~0 o)

17
Results: Titanium Screws
Sample CA, o
CA (corrected), o
CA - CAc, o
Sdr, %
Ti 1 96 95 1 22
Ti 2 107 102 5 41
Ti 3 103 98 5 65
Ti 4 110 101 9 78
• Titanium screws were prepared by the manufacturer
• The samples increased in roughness
• The contact angles do not follow the same trend
• Separating the chemical influence on the wettability from the roughness gives scientists more control over design variables

18
Conclusion
• We developed and applied the FPPS method to measure roughness and contact angles on the same spot on the sample• This allows correcting the CA for the underlying roughness
• Accounting for roughness on hydrophobic surfaces lowered the CAc
• Accounting for roughness on hydrophilic surfaces raised the CAc
• When the measured CA was close to 90 o and the sample had small roughness the correction did not change the angle much
• This method gives the researcher more flexibility to separate out the effect of roughness from surface chemistry

19
Acknowledgements
• Maiju Pöysti • John Caruso • Greg Wills • Susanna Laurén