using genetic algorithms to explore pattern …forrest/publications/immune-92.pdfusing genetic...
TRANSCRIPT

Using Genetic Algorithms to Explore Pattern
Recognition in the Immune System
DRAFT
July 28, 1993
COMMENTS WELCOME
Stephanie Forrest
Dept. of Computer Science
University of New Mexico
Albuquerque, NM 87131
(505) 277-7104
Brenda Javornik
Dept. of Computer Science
University of New Mexico
Albuquerque, NM 87131
Robert E. Smith
Dept. of Engineering Mechanics
University of Alabama
Tuscaloosa, AL 35487
Alan S. Perelson
Theoretical Division
Los Alamos National Laboratory
Los Alamos, NM 87545
Abstract
This paper describes an immune system model based on binary strings. The purpose of the
model is to study the pattern recognition processes and learning that take place at both the
individual and species levels in the immune system. The genetic algorithm (GA) is a central
component of the model. The paper reports simulation experiments on two pattern recognition
problems that are relevant to natural immune systems. Finally, it reviews the relation between
the model and explicit fitness sharing techniques for genetic algorithms, showing that the
immune system model implements a form of implicit fitness sharing.
Keywords: Genetic algorithms, immune system, pattern recognition, fitness sharing.
1

1 Introduction
Our immune system protects us from an extraordinarily large variety of bacteria, viruses, and other
pathogenic organisms. It also constantly surveys the body for the presence of abnormal cells, such
as tumor cells and virally infected cells, and destroys such cells when they are found. To perform
these tasks the immune system must be capable of distinguishing self cells and molecules, which
it should not destroy, from foreign cells and molecules (antigens), which it should destroy. The
enormity of this task has not been fully quantified, but Inman (Inman, 1978) has calculated that
the immune system appears to be able to recognize at least 1016 foreign molecules. In practical
terms, essentially any foreign molecule presented to the immune system, even those created in the
laboratory and thus never having appeared before in all of evolutionary time, are recognized as
being foreign. The human genome contains about 105 genes. Using the rule that one gene equals
one protein, one can estimate that a human contains about 105 self-proteins that the immune system
needs to distinguish from the 1016 or so possible foreign antigens. This is called the self-nonself
discrimination problem.
From an information-processing perspective, recognizing an almost limitless number of foreign
cells and molecules, i.e. antigens, and distinguishing these from self molecules are formidable
tasks. The immune system’s pattern-recognition abilities are even more impressive when one
considers that the system is distributed throughout our bodies—there is no central “immune organ”
that controls which antibodies are produced or when. Thus, the individual cells and molecules
(lymphocytes, antibodies, etc.) that comprise the immune system encode and operate the control
mechanism in parallel.
The enormous diversity of the molecules employed by the immune system is the key to its
pattern recognition capabilities. The underlying principle is called clonal selection (Burnet, 1959).
Clonal selection is related to Darwin’s theory of natural selection but applied to the cell populations
within the immune system. Recognition in the immune system is performed by B lymphocytes
and T lymphocytes. Each lymphocyte expresses receptor molecules of one particular shape on
its surface. An elaborate genetic mechanism involving the combinatorial association of a number
2

of gene segments underlies the construction of these receptors, so that an animal has the genetic
capability of expressing over 1010 different receptors on B cells (Berek & Milstein, 1988) and
over 1016 different receptors on T cells (Davis & Bjorkman, 1988). In mice and humans, it is
thought that the resident population of lymphocytes expresses a repertoire of about 107 different
receptors at any time. When a foreign molecule or cell is encountered there is a high probability
that it will bind to the receptors on some lymphocytes. This event, coupled with others, can lead
to the lymphocyte becoming activated, upon which it proliferates, growing into a clone of cells,
and responds to the antigen by secreting antibody if it is a B cell or by secreting a variety of other
factors if it is a T cell. The antibody that a B cell secretes is a soluble form of its cell surface
receptor and thus has a shape that has been selected for its ability to bind the antigen. The analogy
with natural selection is that the fittest clones are the ones that recognize the antigen; these survive
and grow, whereas clones that do not recognize the antigen die and are replaced by others. The
system is also adaptive in that clones that grow also turn on a mutation mechanism that generates
at very high frequencies point mutations in the genes that code specifically for the antibody. This
mechanism (called somatic mutation), coupled with selection for improved antigen binding, results
in cells that have very high affinity matches with the antigen.
For clonal selection to work efficiently the receptors on lymphocytes need to be diverse enough
to recognize essentially any antigen. Immunologists call a repertoire complete if there exists at
least one receptor that can recognize any antigen. Using a probablistic model Perelson and Oster
(Perelson & Oster, 1979) define precise conditions for repertoire completeness and show that if
the 107 receptors in the repertoire are made at random then one would expect the repertoire to
be complete. However, receptors are not made entirely randomly. By clonal selection, cells that
recognize antigens grow, whereas cells that do not recognize antigen die. Thus, biases develop
in the repertoire that express learning about the antigenic environment. To summarize, immune
systems need to be diverse, and they need to express biases in the repertoire to represent the
antigenic world. When biases develop during the lifetime of a particular individual, immunologists
call it learning. If particular biases are maintained for long periods this is called memory.
While clonal selection operates within individuals, the more traditional type of evolution
3

operates on the genes that determine the specificity of antibodies and T cell receptors. These genes
are called variable-, or V-, region genes. The hypothesis is that over evolutionary time scales these
genes evolved biases towards recognizing common pathogens. There is some reason to believe
that such biases exist. For example, B cells generally require help from T cells in order to become
activated to divide and to secrete antibody. However, certain antigens, such as the polysaccharides
found in the cell walls of bacteria, are treated differently and stimulate B cells in the absence of T
cell help. It appears that the immune system has learned that bacteria need to be recognized in a
special way. Assuming that this type of learning takes place through natural selection, the genetic
algorithm (Holland, 1975; Goldberg, 1989) provides a natural model for studying evolution of
antibody and T cell receptor V region genes.
We have developed a model directed at understanding the pattern recognition processes and
learning that takes place at both the individual and species levels in the immune system. The
model is based on a universe in which both antigens and antibodies (more precisely, receptors on B
cells and T cells) are represented by binary strings. The model uses genetic algorithms (GAs), an
idealized computational model of Darwinian evolution based on the principles of genetic variation
and natural selection (Holland, 1975; Goldberg, 1989). The GA without crossover is a reasonable
model of clonal selection, while the GA with crossover models genetic evolution.
In this paper we formulate abstract versions of pattern recognition problems that the immune
system appears capable of solving. We then solve these problems using the GA. Our overall goal
for this research is twofold: to understand the real immune system from an information-processing
perspective, and to use ideas generated from studying the immune system to construct new and
powerful parallel algorithms. As one example of the latter, we previously showed how insights
from the immune system can be exploited to develop a new implicit fitness-sharing algorithm for
maintaining diversity in GA search procedures (Smith et al., in press). In (Smith et al., in press),
we analyzed the algorithm mathematically and compared it with explicit fitness sharing. This
paper describes the model of the immune system which led to developing the algorithm and reports
simulation experiments which confirm the mathematical analysis.
To do this, we define a simplified, abstract universe based on bit strings. The bit string universe
4

can be specialized to model more closely clonal selection or evolution of V regions. In this paper,
however, we study the computational properties of the basic model; we expect the general properties
of this model to hold for more specialized, biologically faithful models. Using the bit string model,
we have explored how the GA can maintain the degree of diversity required in immune systems
and how generalization in the context of a pattern recognition problem can evolve under a GA.
In order to use the GA to evolve a set of bitstrings that have the property of repertoire com-
pleteness, we need to understand how the GA solves a coverage type of problem. That is, the GA
must discover a set of pattern-matching antibodies that match a set of antigen patterns, and in so
doing it must maintain diversity in its population. GAs are typically used to evolve a population
in which each member specifies one candidate solution and individual solutions compete with one
another. The majority of GA analysis has focused on these optimization applications. From a
pattern-recognition perspective, our formulation of the antigen recognition problem can be viewed
as a string-matching problem in which the task is to discover sets of common substrings that col-
lectively cover the population of antigen strings (i.e., for each antigen, there is one antibody string
that matches some substring contained within the antigen). The learning task is thus to evolve a
set of antibodies that meets the coverage requirement.
In (Smith et al., in press) we pointed out the need for generalization in populations of coadapted
individuals (e.g., for set cover problems, recognition problems, and almost any learning classifier
system (Holland et al., 1986)), and we discussed why generalization is not always required for
GA applications. The generalization issue arises when there are not enough individuals in the
population to assign one individual (or subpopulation) to each task, niche, or fitness peak. In the
immune system this means that the system does not have the capacity to produce one antibody that
is an exact match for each presented antigen (in the clonal selection problem), or to store a program
to make one specialized antibody for each possible antigen (in the genetic evolution problem). A
reasonable response (which is used by the immune system) to this resource constraint is to evolve
individuals that can cover more than one antigen by becoming “generalists.” In the binary immune
system, generalization means detecting common schemas that are shared among many antigens.
The paper examines both the problem of finding common schemas and the problem of coverage.
5

In the next section we describe the binary immune system and how it is combined with the
GA. In Sections 3 and 4, we present two immune system pattern recognition problems and show
how the GA can be used to solve these problems. Finally, we summarize the analysis described in
(Smith et al., in press) which shows the relation between our algorithm and earlier fitness sharing
algorithms developed for GAs.
2 Binary Immune System Model
Our immune system model is based on a universe first introduced by Farmer et al. (Farmer
et al., 1986) in which both antigens and antibodies are represented by binary strings. This is
a simplification from the real biology in which genes are specified by a four-letter nucleic acid
alphabet and recognition between antibodies and antigens is based on their three-dimensional
shapes and physical properties. However, this abstract universe is rich enough to allow us to
formulate difficult pattern recognition problems. Our experiments and calculations have been
based on strings of length 64. As there are 264, or 1019, possible 64-bit strings, the search space
that we must deal with is very large.
The model presented here makes the important simplification that a bit string represents both
the genes that code for an antibody and the phenotypic expression of the molecule. For example,
mutation operates on the bit string and causes antibodies to mutate. In another model we explicitly
consider V-region genes (Hightower et al., 1993) , the construction of antibody molecules by joining
a set of small gene segments, and recombination of genes between individuals in a population.
Here, antibodies are created directly rather than by genetic operations on a set of gene segments.
Although this is an approximation, it is a reasonable one. For example, in natural immune systems,
the diversity of gene segments is large, and when segments are joined together, extra DNA can be
added randomly or deleted at the joints. Further, one of the gene segments, called D for diversity,
can be placed in the molecule in one or multiple copies seemingly at random. Thus, the immune
system has in place a number of mechanisms that attempt to randomize the antibodies that are
made from V-region genes. Here we bypass this genetics, making antibodies directly by generating
6

Antibody: 11001001000100100001001010101010Antigen: 01111100111001011110110101110100
Complement: 10110101111101111111111111011110
Length of contiguous substrings: 1, 2, 1, 5, 13, 4
Figure 1: Scoring complementary matches between antigens and antibodies. A family of matching
functions�
can be defined over the lengths of contiguous substrings ( ��� ).random strings using a pseudo-random number generator. Because we are interested in the pattern
recognition properties of the immune system, our model includes only recognition of the idealized
antigens by antibodies and does not consider how the immune system neutralizes an antigen once
it is recognized.
A receptor, or “antibody,” is said to match an antigen if their bit strings are complementary.
Since each antibody must match against several different antigens simultaneously, we do not
require perfect bit-wise matching. The degree of match is quantified by a matching function�
: �������� ��������������������� � . Figure 1 illustrates the matching procedure. There are many
possible match rules that are plausible physiologically (Perelson,1989). For example,�
can simply
count the number of complementary bits or�
can identify contiguous regions of complementary
bitwise matches within the string. Stadnyk (Stadnyk, 1987) introduced a function�
that computes
the lengths � � of the complementary regions, and combines them such that long regions are rewarded
more than short ones. Using this basic idea, many different specific functions can be defined that
are linear or nonlinear in ��� . We have studied several different match functions, including simple
linear, exponential, and threshold functions (Forrest & Perelson, 1991). Here we shall use the
simplest of these functions:
�0 � �
� ���! �
0 simply counts the total number of bits that differ between antigen and antibody.
Using the bit string representation for antibodies, we construct random populations of antigens
and antibodies. Antibodies are matched against antigens, scored according to the fitness function�
0, and evolved using a conventional GA. Figure 2 illustrates the basic immune model.
7

Antigens
1001100001110001110100100010001001010101010100111101010101000111000011110001000101110001000100011100001010100110
...
0111110011100101
Antibodies
101000111000011111001001000100100000110100011000
...
1100110010010100" " #
$$$$$$$$$ %M0(0111110011100101,1100100100010010)=1 & 2 & 1 & 5 & 3
Antibodies
010111010001101111110010010010011001010101000110
...
1100110010010100
'GA
Figure 2: A schematic illustration of the binary immune model. Antigens and antibodies are
matched pairwise; the match function�
0 is used to compute the fitness of each antibody, and the
antibody population is evolved under the GA based on match scores.
With this simple model, we can study how the immune system learns which antibodies are
useful. Over evolutionary time scales the information is encoded in genes, and over somatic time
scales, the information is encoded in the lymphocyte repertoire. In both cases, we desire coverage
of the space of foreign material; that is, we desire that each foreign string is matched by at least
one antibody. Depending on the match rule, this can be a trivial problem. For example, suppose
that we define a successful match as one in which the antibody is complementary to the antigen on
the first bit; then we would only need two antibodies to cover every possible antigen (1 (�(�( and
0 (�(�( ), where ( means don’t care. Under this scheme, however, the antibodies would also match
all self molecules. Thus, it would be better to require that each foreign antigen be recognized by
at least one antibody, and that no self molecule be recognized. Percus et al. (Percus et al., 1993)
explicitly consider this problem. Here we approximate the requirement of not matching self by
using a matching function that assigns higher fitness when a greater number of matches occurs, the
idea being that if a small number of matches were sufficient to generate high fitness, then one would
expect many matches to self molecules as well as foreign molecules. However, as the criterion for
matching becomes more specific one can avoid matching self while at the same time still matching
8

foreign molecules (Percus et al., 1993).
>From the basic immune system model described above, many variations can be created by
changing details such as the types of antigens to be recognized and the method by which antibodies
are chosen to be matched against antigens. We have experimented with several variants in order to
solve the two pattern recognition problems described in the following two sections.
3 Finding Common Schemas
The immune system needs to detect bacteria and other pathogens. Bacteria are inherently different
from human cells. For example, many bacteria have cell walls made from polymers that do not
occur in humans. Thus, one might expect the immune system to recognize bacteria partially on
the basis of the existence of these unusual molecules. With this as motivation, we study the GA’s
ability to detect common patterns (schemas) in the antigen population without at the same time
requiring the model to differentiate between multiple incompatible antigen types. That is, all of
the antigens in the population will be of the same type for any one experiment. The idea is that
common schemas represent generic properties of the antigen population such as those described
above for bacteria.
As a simple example, consider the antigen population constructed from the following schemas:
50% 11 � � 11 (�() � � *(�(50% (�() � � *(�( 11 � � 11
where ( means don’t care. We refer to these as half-length schemas. In this example, 50% of the
antigens have the first half of their bits all set to 1 and the remaining bits set randomly, while the
other 50% will have the first half of their bits set randomly and the second half all set to 1, as shown
in the following example population:
1111111100101010
1111111110100100
9

1001010111111111
0011001011111111
To evolve an antibody population that solves this problem, we use the algorithm described
below to compute antibody fitnesses.
The antigen population is set as described above. The fitness is calculated for each antibody +by the following procedure:
1. Choose a sample of , antigens randomly from the fixed set of antigens (with replacement).
Note that the total antigen population from which this sample is chosen remains fixed
throughout a run of the GA.
2. For each antigen - in the sample, compute the match score�
0 . -�/0+21 .3. The fitness of antibody + is the average match score computed over the sample of , antigens.
Although the number of antigens chosen for each match ( , ) can be any number less than the size
of the population, we have experimented primarily with values of 30 (not reported) and 5. Figure
3 illustrates the algorithm for , � 3.
In principle, the GA should be able to solve this problem by evolving a population of antibodies
that is all 0’s (000 � � 000). However, from the GA’s point of view the fitness function is quite noisy
(the same antibody may receive a different fitness at different times because of sampling variance).
We are interested in knowing how much effect the noise of the ( bits (filled in randomly) has on
the GA being able to determine the optimal string.
The difficulty of the problem can be increased by further subdividing the antigen population.
For example,
25% 11 (�(�(�(�(�(25% (�( 11 (�(�(�(25% (�(�(�( 11 (�(25% (�(�(�(�(�( 11.
10

Antigens
1111111101110001111111110010001011111111010100111111111101000111000011111111111101110001111111111100001011111111
...
0111110011111111
'
Antibodies
101000111000011111001001000100100000110100011000
...
1100110010010100
33333 4
55555 677777 8
�0 . 1111111101110001 / 1100100100010010 19&�0 . 1111111101010011 / 1100100100010010 19&�0 . 0000111111111111 / 1100100100010010 1 � 8 & 6 & 10
Figure 3: A schematic illustration of schema detection problem for a random sample of , � 3
antigens. The matches for antibody 2 are shown, which when averaged yield a fitness (average
complementary match score) of 8.
We refer to these as quarter-length schemas. Under this second scenario with quarter-length
schemas the average fitness of the optimal individual (still 000 � : 000) is lower than in the half-
length schema case. This is because on each antigen match there are fewer defined bits that an
optimum antibody can match perfectly. The optimum fitness in the two cases can be calculated as
follows: with half-length schemas the optimal antibody matches half the bits with probability one
and the remaining bits with probability 1/2 (assuming these bits are chosen at random). Thus its
expected fitness or number of bits matched is ((1/2)(1) + (1/2)(1/2))64 = 48. For quarter-length
schemas the maximal fitness is ((1/4)(1) +(3/4)(1/2))64 = 40. In general, for a bit string of length;
with schemas of length < , the generalist antibody will have fitness
= . <*> ; 1 . 1 1?& . 1 @ <; 1 . 1 > 2 1BA ; �; &C<
2 (1)
Note that just as in the biological system, solutions can be specialists that match a single antigen
extremely well or generalists that match most antigens to some degree but need not match any
extremely well. Here the antibody 000...000 is a generalist. Specialist antibodies would tend not
11

to do well in this problem because the antigen that a specialist antibody recognizes is unlikely to
be presented to that same antibody in subsequent generations (unless , is very high).
3.1 How well can the GA detect common schemas?
Using the Genesis public domain software package (Grefenstette, 1984), modified to accommodate
our fitness function (see Section 4), we studied how the GA solves the schema detection problem,
in which antigens contain predefined schemas. For these experiments we used a population of 200
antibodies, each antigen and antibody was 64 bits long, the sample size , was 5, the crossover
and mutation rates were 0.6 and 0.0005 respectively, as defined in Genesis. The antibodies were
chosen at random, so that on average they initially matched half of the antigen bits and had an
initial average fitness of 32.
Figure 4 shows that under the GA the average fitness of antibodies increases monotonically
with the number of generations and ultimately reaches an asymptote. Half-length, quarter-length,
and eighth-length schemas are presented in the graph. Note the various asymptotes are precisely at
the fitness value predicted by Equation (1), and that the asymptotes decrease as the defined schema
length decreases. Normalizing the fitness values by taking the ratio of the average fitness to the
maximum fitness allows us to plot the progress of the GA for the different length schemas on a
single plot. Figure 5 shows that the fitness converges to its maximum value faster for longer length
schemas. This is to be expected since there is less noise in such problems. Once the average fitness
becomes constant, the population of antibodies has converged (not shown).
This experiment shows that the GA can find common schemas even in the presence of con-
siderable noise. However as shown in Fig. 5, the problem takes longer to solve, i.e., becomes
progressively harder, as the ratio of defined to undefined schemas decreases. In immunological
terms, we see that one antibody, here all 0’s, can match many different antigens, as long as the
match need only be over a small portion (i.e. schema) of the antigen. As the noise increases, it
becomes progressively more difficult to find the common schemas. This suggests that there may
be a limit to how small a schema can be discovered, and hence, to how many distinct antigens a
single antibody can recognize.
12

Figure 4: Average antibody fitness measured against antigens containing half-length, quarter-
length, and eight-length schemas. Each plotted point is an average over ten runs.
Figure 5: Ratio of average antibody fitness to maximum attained fitness measured against half-
length, quarter-length, and eight-length antigen schemas. Each plotted point is an average over ten
runs.
13

4 Maintaining Diversity
In the second problem, we study antigen populations that cannot be matched by a single antibody
type. These experiments are interesting from an immunological perspective because they are a
simple example of the problem of maintaining a complete repertoire. For example (again, the
simplest possible case), suppose the the population of antigens is:
50% 000 � � 000
50% 111 � � 111.
In order for an antibody population to match these antigens, there would need to be some antibodies
that are all 1’s and others that are all 0’s. Thus, a solution to this problem would require the GA
to maintain two different solutions simultaneously. This problem is more difficult than the schema
detection problem in which there is one consistent solution. This is a simple example of a “multiple
peaks” problem because there are two inconsistent solutions and they are maximally different.
The reason multiple peaks problems are difficult for the GA is because of its strong convergence
tendencies. Typically, on multiple peak problems, genetic drift will lead the GA to (randomly)
converge on one of the peaks. However, for the immune problem, we require that the resulting
population of antibodies have representatives of both all ones and all zeros. Note that the role of
crossover in this problem is not obvious, since hybrids of good solutions will often be useless. This
property fits in well with immune system considerations because the somatic mutation procedure
does not use crossover.
With the set of antigens fixed, the antibodies are initialized either to be completely random
(to see if the GA can discover the correct antibodies) or initially given the answer by setting the
population to some ratio of 0000’s and 1111’s (to test if a solution is stable over time). By giving
the answer initially, maintenance of the answer can be tested.
To evolve a population of antibodies that maintains diversity under the GA we discovered that
we needed to use a fitness scoring scheme that is different from that used to solve the schema
detection problem. We considered the following properties of the immune system in developing
our fitness measure:
14

1. Antigens are typically encountered sequentially.
2. An immune system responds with only a subset of its lymphocytes—those that come in
contact with the antigen.
3. There is competition for antigen so that the cells which bind with the highest affinity grow
the fastest.
4. Antibodies are improved by point mutation in a process known as somatic mutation. (Property
(4) is mimicked by a GA that relies primarily on mutation rather than crossover.)
As it turns out, our fitness scheme is similar to the “best-match” strategy used in classifier systems:
1. An antigen is chosen at random.
2. A sample of the antibody population of size D is chosen randomly without replacement.
3. Each antibody in the sample is matched against the antigen.
4. The antibody in the sample with the highest match score has its match score added to its
fitness. The fitness of all other antibodies remains unchanged.
5. The process is repeated for many antigens (typically three times the number of antibodies).
This algorithm is illustrated in Figure 6.
Using the diversity algorithm we address the following questions concerning the GA’s perfor-
mance in this setting:
E Can the conventional GA maintain enough diversity in its population to recognize different
antigens? That is, can the conventional GA maintain subpopulations in different parts of the
space, or does it always converge on one peak? If it can maintain diverse subpopulations,
then
E How many different peaks can a given size population maintain (what is the carrying capac-
ity)?
15
Antigens
11111111111111110000000000000000
Antibodies
101000111000011111001001000100100000110100011000
...
1100110010010100
F F F F FHGI I I I IHJK K K K KHL
MMax(�
0 . 1010001110000111 / 0000000000000000 1�/�0 . 1100100100010010 / 0000000000000000 1�/�0 . 1100110010010100 / 0000000000000000 11
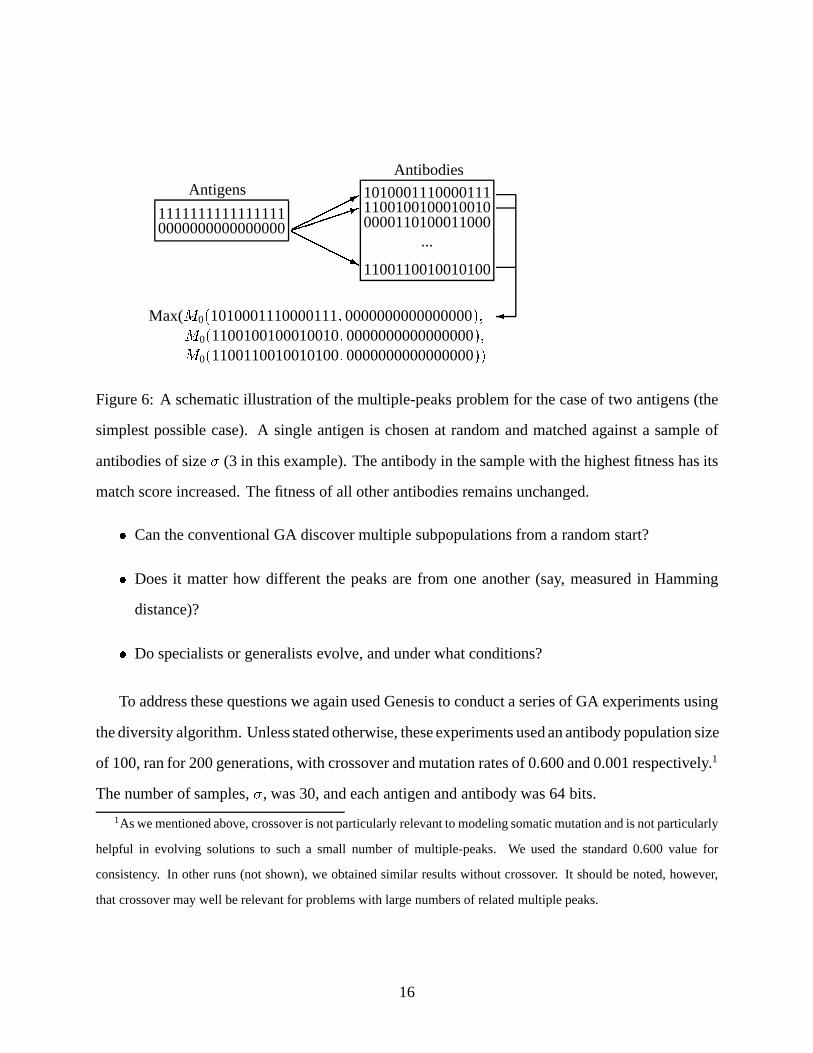
Figure 6: A schematic illustration of the multiple-peaks problem for the case of two antigens (the
simplest possible case). A single antigen is chosen at random and matched against a sample of
antibodies of size D (3 in this example). The antibody in the sample with the highest fitness has its
match score increased. The fitness of all other antibodies remains unchanged.
E Can the conventional GA discover multiple subpopulations from a random start?
E Does it matter how different the peaks are from one another (say, measured in Hamming
distance)?
E Do specialists or generalists evolve, and under what conditions?
To address these questions we again used Genesis to conduct a series of GA experiments using
the diversity algorithm. Unless stated otherwise, these experiments used an antibody population size
of 100, ran for 200 generations, with crossover and mutation rates of 0.600 and 0.001 respectively.1
The number of samples, D , was 30, and each antigen and antibody was 64 bits.
1As we mentioned above, crossover is not particularly relevant to modeling somatic mutation and is not particularly
helpful in evolving solutions to such a small number of multiple-peaks. We used the standard 0.600 value for
consistency. In other runs (not shown), we obtained similar results without crossover. It should be noted, however,
that crossover may well be relevant for problems with large numbers of related multiple peaks.
16

4.1 Can the GA maintain multiple subpopulations?
The simplest experiment uses two types of antigens: all 0’s and all 1’s. The two types of antigens
have equal probability of being chosen for a match with an antibody. The two types of 64-bit
antigens are:
50% 000 � � 000
50% 111 � � 111.
The matching function was�
0.
When the population of antibodies is initialized with examples of the correct answers, it
maintains the answer. In Figure 7 a we show an example in which the initial antibody population is
50% 000...000 and 50% 111...111. Due to crossover, some antibodies are lost from each peak, but
the initial 50-50 distribution of antibodies around the two peaks is maintained to 500 generations
(not shown). If the crossover rate is reduced, the number of hybrid antibodies is also reduced, and
a larger fraction of antibodies maintain the peaks (not shown).
When the initial population of antibodies is skewed from that of the antigens (e.g., for the
antigen population, there is a 50% probability of choosing 000 � � 000 and 50% probability of
choosing 111 � � 111, but there is a different initial ratio of the appropriate antibody types), the
antibody population adjusts itself to the appropriate percentage. Figure 7 b shows this phenomenon
for an initial antibody distribution of 99% 1’s and 1% 0’s. Within fewer than 10 generations the
antibody population adjusts back to a 50-50 distribution. This indicates that the model has a strong
tendency to self-regulate and should therefore be quite robust against various kinds of perturbations
(noise, sampling error, etc.).
4.2 Can the GA discover multiple peaks?
For this experiment we let the initial antibody population be random (instead of seeded with the
correct answer as in the previous experiment). When the initial population of antibodies is random,
samples of both 000 � � 000s and 111 � : 111s are discovered and maintained as shown in Figure
7 c.
17

Figure 7: Multiple Peaks Experiments: The y-axis shows the number of antibodies that are all 0’s
and all 1’s at each generation. Each plotted point is the average of thirty runs, and an antibody had
to have 100% (a and b) or 95% (c and d) of its bits correct to be scored as correct. (a) maintaining
two peaks with no initial bias of antibodies, (b) maintaining two peaks with an initial bias of
antibodies, (c) discovering two peaks with no initial bias of antibodies, (d) discovering three peaks
with no initial antibody bias. The legend labels the antigen that the antibodies recognize.
18

A population with three peaks is also discovered and maintained. However, the sample size D is
an important control parameter. For example, when the sample size is 5 rather than 30, the resulting
antibodies converged on one peak (not shown). Graphs of the number of antibodies representing
a peak as the population evolves are shown in Figure 7 d. Other experiments (not shown) suggest
that the number of peaks can be increased arbitrarily as long as the population is large enough.
(However, for each fixed population size there is a maximum “carrying capacity.”)
What happens when the peaks are not of equal size? Can peaks with different biases be
discovered and maintained with more antibodies representing higher biased peaks? Consider the
following antigen population:
50% 000 � � 000
30% 111 � � 111
20% 101 � � 010.
In this experiment, the three peaks were discovered and the number of representative antibodies
corresponds to the antigen bias (Figure 8). Thus, the antibody that matched antigen 000...000 was
the most prevalent.
How many antibody representatives must be in the population for an antigen to be identified?
That is, what is the carrying capacity of the population? The answer to this question is impor-
tant biologically because it defines the recognition capacity of an immune system containing N
antibodies.
Three antibody population sizes, 50, 100, and 200, were considered. The sample size D was
held constant at 15% of the antibody population size. The antigens were randomly generated, but
once generated, each was equally probable within a run. The average number of correct antibodies
at each peak is reported in Table 1. From the table, we see that one needs approximately 15
antibodies per antigen to maintain a peak. Further, 10-15% of the antibodies never attain a peak.
This last fact can be seen by multiplying the number of antibodies per peak by the number of peaks
and noticing that we do not get the total population size. This means that some antibodies are not
under any peak—probably as a consequence of cross-over.
How do these statistics compare with the real immune system? This question is somewhat
19

Antigen Population Size
Types 50 100 200
2 21.6 (3.2) 46.6 (2.6) 93.0 (4.6)
3 14.1 (7.2) 30.5 (2.3) 60.7 (5.3)
4 0.0 23.0 (0.9) 45.4 (4.6)
5 18.0 (0.6) 36.1 (3.3)
6 0.0 30.0 (3.0)
7 0.0 25.3 (3.3)
8 0.0 22.6 (0.4)
9 0.0 20.0 (0.4)
10 0.0 17.6 (0.7)
11 0.0 15.4 (0.7)
12 0.0 0.0
Table 1: Estimated Recognition Capacity. Entries in the table are the mean number of antibodies
matching one antigen (the standard deviation is given in parentheses) given the run is a success.
Fifty runs were averaged for each entry in the table. If a run did not have antibody representatives
for each antigen at generation 500, then the run was not considered a success and its statistics were
not counted in the table. An entry in the table is zero if all 50 runs were unsuccessful. An antibody
had to be 100% correct to be counted.
20

Figure 8: Discovering Variable Size Peaks with No Initial Antibody Bias. Thirty runs were
averaged and an antibody had to have 95% of its bits match an antigen to be scored as correct. The
legend labels the antigens that the three antibodies recognize.
difficult to answer. In a single animal, the presence of a single antibody, i.e. B cell clone, is all
that is required to recognize an antigen—a large number of clones that interconvert by mutation is
not required. However, the immune system appears to have evolved redundancy of recognition.
Clearly, if only one antibody were used to recognize each antigen, then minor changes in the antigen
or mutation of the antibody might allow allow the antigen to escape recognition. Thus, the immune
system seems to use many different antibodies that recognize the antigen in different ways. The
number of these antibodies is not known precisely and seems to vary from one antigen to the next.
Typically tens or hundreds of different antibodies are found that match an antigen with sufficient
strength to be important in an immune response. From the work of Perelson and Oster (Perelson
& Oster, 1979) one can estimate that if antibodies are made at random, then about 105 antibodies
would be required to cover the space of antigens. Since the immune system employs about 107
different antibodies, one would expect an average of 100 different antibodies to recognize each
antigen. Experiments with different antigens have shown responses that employ anywhere from
tens to thousands of different antibodies. Thus an average of a hundred seems reasonable. If this
21

correct, then our GA-based model might be said to be more efficient than the real immune system
since it only requires about 15 antibodies to recognize an antigen (as shown in Table 1). However,
this comparison is not quite fair since the immune system can recognize the antigen with fewer
antibodies but probably less reliably.
4.3 Does similarity among peaks matter?
In this set of experiments we ask how important is it for different peaks to be dissimilar in order for
the model to discriminate among them. Since the GA searches the space N 0 / 1 O�P , we are interested
in how Hamming distance between peaks affects performance. Using two peaks of equal size, the
Hamming distance between the two peaks is varied from the length of the string down to one. The
sample size D is 15. The initial antibody population is completely random so that the antibodies
have to discover the peaks. The antigens are chosen to be 50% of one type and 50% of a second
type. The two antigen types are a specified Hamming distance away from each other. Runs of
500 generations were performed at each Hamming distance so that once a peak was discovered it
also had to be maintained. The resulting number of correct antibodies at generation 500 versus
the Hamming distance is shown in Figure 9. For an antibody to be counted as correct, it had to
complement exactly the antigen present (have a 100% match). The results indicate that Hamming
distance does not affect the discovery or maintenance of peaks. This is surprising because it means
that the the GA can maintain distinct subpopulations that differ by as little as one bit. We expected
that as the Hamming distance between peaks was reduced the GA would tend to smear the peaks
together. As it turns out, this effect does occur but only for sufficiently small D (see Section 4.4).
To further explore the relationship between peak similarity and the GA’s ability to discriminate
different peaks, the following three peaks of equal size were used:
33% 00000 � � 00000
33% 11111 � � 11111
33% 0 � � 000111 � � 1.
The number of 0’s in the third peak was varied (for a string of length 64) from sixteen 0’s down
22

Figure 9: Distinguishing Two Antigens at Different Hamming Distances. Five runs, using an
antibody population size of 100 and a sample size D � 15, were performed at each Hamming
distance and the results averaged. An antibody had to have 100% of its bits match an antigen to be
counted correct.
to one 0, so that the third peak approached the second peak. Graphs of the resulting number of
antibodies that match the antigens versus time are shown in Figure 10. The results again indicate
that Hamming distance does not affect the ultimate discovery or maintenance of peaks. Note,
however, that the rate of discovery of peaks does depend on their relative distance. When peaks
two and three are close together they are discovered almost simultaneously.
4.4 Generalization
In this section, we study the effect of varying the sample size parameter D . We discover that the
size of D determines the amount of generalization in the antibody population.
The idea behind these experiments was to define three antigen peaks in such a way that a
generalist antibody could be evolved that would partially match each peak but not match any of
the peaks completely. As a simple example of this idea, consider the antigens 000, 011, and 110.
Note that the antibody 101 matches (in the complementary sense) each of these antigens on exactly
23

Figure 10: Distinction Among Three Antigens Based on Hamming Distance. The legend indicates
the antigen type, and each line on the plot shows the number of antibodies that match that antigen
type. Each antibody had to be 100% correct to be counted. Five runs were averaged for each plot.
two bits. Since in a real immune system there are many fewer antibodies than possible antigens,
the antibody population will recognize the most antigens if it can find common patterns among
antigens (that is, if it can generalize across the antigen population). These patterns are analogous
to the “schemas” described in the GA literature (Goldberg, 1989).
Experiments were conducted using the GA described for the multiple-peaks problem described
above. For these experiments we used a population of 100 antibodies (initialized randomly), ran
the GA for 500 generations, used crossover and mutation rates of 0.5 and 0.001, respectively, and
varied D between experiments. The antigen and antibody string lengths were extended to 66, so
that the antigen could be divided into three regions evenly. The number of iterations (step 5 in the
diversity algorithm) was equal to the number of antibodies, i.e. the population size. The antigen
population was as follows:
0 � : 00 : � 00 � � 00 � : 01 : � 11 � � 11 � : 11 : � 10 � � 0
24

The generalist antibody, if it evolved, would look as follows:
1 � : 10 : � 01 � � 1.
For each tested value of D , five runs were performed. For each run, analysis took place at
intervals of 20 generations until the population of antibodies either converged or 500 generations
was reached. A generation was analyzed by counting the number of strings that fit a particular
antibody pattern. A string was counted if 97% of the string matched that pattern. This means that
at most 2 bits could differ between the string and the pattern in order for the string to be counted
as a representative.
In a previous paper in which we analyzed the diversity algorithm theoretically (Smith et al., in
press), we made the following predictions for the three peaks case:
1. At sample size D = 2 (below the number of peaks), generalization will occur with negligible
representatives at other peaks.
2. At sample size D = 3, the generalist antibody and specific antibodies at the three peaks will
be maintained at steady state.
3. At sample size D = 10, a negligible number of generalists will occur, while equal proportions
of specific antibodies will be at the three peaks.
Plots of the resulting antibody populations for sample sizes 2, 6, 7, and 10 are shown in Figure
11. The results indicate that at D � 7 and above, the Item 3 condition holds. At D � 6 the Item
2 condition holds, and for D � 2 only the generalist is present. When the sample size is 3, the
only antibody found is the generalist 101 (not shown), and when the antibody population size was
increased from 100 to 1000 (in 20 different runs), only the generalist appeared (not shown). Since
the theoretical predictions assumed an infinite-sized population and did not account for crossover,
our experiments appear to confirm the theory.
25

Figure 11: Number of Specific and General Antibodies by Sample Size. Sample sizes are 2 (a)
, 6 (b), 7 (c), and 10 (d). In (a), the number of the three specialists is exactly equal, so the lines
are coincident on the graph. The legend indicates the antibody type plotted on the graphs. Each
plotted point is an average over 20 runs.
26

4.5 Summary
>From our study of the multiple-peaks problem we conclude that with the diversity algorithm
the GA can both discover and maintain multiple peaks. The antibody sample size is a relevant
parameter and the carrying capacity is approximately 15 antibodies to one antigen. Surprisingly,
similarity among peaks does not prevent antibody discrimination.
5 Analysis
While our immune system algorithm maintains diversity in GA problems, it is not the only
algorithm that does so. Fitness sharing, a technique that induces diversity in a population by
penalizing individuals for the presence of similar individuals in the population, has also been used
in GAs, and interestingly, has a theoretical basis that is related to our diversity algorithm. In (Smith
et al., in press) we explore this relationship and the theoretical basis of the diversity algorithm.
One important conclusion of (Smith et al., in press) is that D in the diversity algorithm plays a
role similar to that of D�Q in fitness sharing. However, there is an important distinction to be drawn
between fitness sharing and the implicit sharing in the immune system simulations. In fitness
sharing, DRQ is a strict cutoff based on �*�TS , which Deb (Deb, 1989) recommends setting based on
the volume of a hypersphere around a given peak. In the immune system algorithm, D dictates a
cutoff based on the proportion of the population within a hypersphere around a given antigen. As
the proportion of antibodies close to an antigen increases, the likelihood of more distant antibodies
winning the match competition decreases. Thus, effective antibodies block sharing by less effective
antibodies. The sample size D is a control on this effect. Under this scheme, the boundaries of
sharing are a function of the proportion of antibodies clustered around given antigens. These
emergent sharing boundaries explain much of the resilience shown by the GA in the immune
system experiments.
27

6 Conclusions
We have described an abstract universe based on binary strings in which certain aspects of the
immune system are modeled by interactions among the strings. Interactions among binary strings
are defined by a matching function which rewards more specific matches over less specific ones; this
constraint is related to the immune system’s ability to distinguish self from other, since recognition
of other must be fairly specific in order to avoid the trap of also recognizing self.
In this paper, we have emphasized the performance of the GA in our binary immune system
model, studying both the ability of the GA to detect common patterns (schemas) in a noisy
environment and its ability to maintain diversity within its population. Both of these capabilities
are important, since natural immune systems are able to recognize an enormous number of foreign
molecules with relatively few resources. In studying the schema diversity problem, we showed
that the GA could evolve an antibody type (represented as a population of identical antibodies)
that matched multiple antigens through the identification of a common schema. This problem is
analogous to the problem the immune system faces in identifying bacteria that, although different
in detail, may use a similar polysaccaride in the construction of their cell walls. By identifying
this polysaccaride, the immune system can learn to detect bacteria. The multiple-peaks problem
showed that by matching an antigen with multiple antibodies and then giving the fitness score to the
best matched antibody, a population can be evolved and maintained that contains representatives
of different antibodies. Thus, multiple peaks can be discovered and maintained in the population
with this matching and scoring scheme. Similarity among antigens does not prevent distinction
by antibodies. This algorithm for maintaining diversity in the GA is closely related to the bidding
mechanism commonly employed in learning classifier systems, and the success of our algorithm
demonstrates that a simple bidding mechanism alone is sufficient for a GA to discover and maintain
multiple subpopulations. Our experiments suggest that the GA needs about fifteen individuals per
peak to maintain these subpopulations. Finally, we have compared our algorithm with explicit
fitness sharing and shown that the sample size D in our model plays a role analogous to D Q in
explicit fitness sharing.
28

In future work, we hope to combine the solutions to the schema detection and multiple peaks
problems so that we can scale up our simulation to realistic ratios of antigens and antibodies. We
will need schema detection because when there are many more antigens than antibodies, we need
to detect common regions. Likewise, we will need diversity to maintain coverage (a complete
repertoire). We expect that the role of crossover will be important to accomplish this for realistic
ratios, so we also need to understand how it will work with our fitness measures.
The experiments reported here were conducted with a linear fitness function. A more realistic
measure would reward long contiguous matches more than multiple short matches (i.e., it should
be a nonlinear function of the ��� ). But, in other work we have noticed that results can be highly
sensitive to the particular nonlinear function selected. We hope to understand this better and
develop a more satisfactory fitness function that is both biologically realistic and robust.
7 Acknowledgements
We thank the Center for Nonlinear Studies, Los Alamos National Laboratory and the Santa Fe
Institute for support. Forrest acknowledges the support of the Association of Western Universities,
National Science Foundation (grant IRI-9157644), and Sandia University Research Program (grant
AE-1679). Perelson acknowledges the support of the National Institutes of Health (grant AI28433).
Lawrence Allen and David Mathews prepared the figures, ran some of the simulations, and made
numerous helpful comments on the manuscript.
References
Berek, C., & Milstein, C. (1988). The dynamics nature of the antibody repertoire. Immunol. Rev.,
105, 5–26.
Burnet, F. M. (1959). The clonal selection theory of immunity. Nashville, TN: Vanderbilt University
Press.
29

Davis, M. M., & Bjorkman, P. J. (1988). T-cell receptor antigen genes and t-cell recognition.
Nature, 334, 395–402.
Deb, K. (1989). Genetic algorithms in multimodal function optimization (TCGA Report No. 89002).
Tuscaloosa: The University of Alabama, The Clearinghouse for Genetic Algorithms.
Farmer, J. D., Packard, N. H., & Perelson, A. S. (1986). The immune system, adaptation, and
machine learning. Physica, 22D, 187–204.
Forrest, S., & Perelson, A. (1991). Genetic algorithms and the immune system. In H. Schwefel, &
R. Maenner (Eds.), Parallel Problem Solving from Nature, Berlin. Springer-Verlag (Lecture
Notes in Computer Science).
Goldberg, D. E. (1989). Genetic algorithms in search, optimization, and machine learning.
Reading, MA: Addison Wesley.
Grefenstette, J. J. (1984). Genesis: A system for using genetic search procedures. In Proceedings
of a Conference on Intelligent Systems and Machines, 161–5.
Hightower, R., Forrest, S., & Perelson, A. S. (1993). The evolution of secondary organization
in immune system gene libraries. In Proceedings of the Second European Conference on
Artificial Life.
Holland, J., Holyoak, K., Nisbett, R., & Thagard, P. (1986). Induction: Processes of inference,
learning, and discovery. MIT Press.
Holland, J. H. (1975). Adaptation in natural and artificial systems. Ann Arbor, MI: The University
of Michigan Press.
Inman, J. K. (1978). The antibody combining region: Speculations on the hypothesis of general
multispecificity. In G. I. Bell, A. S. Perelson, & J. G. H. Pimbley (Eds.), Theoretical
immunology (243–278). NY: Marcel Dekker.
30

Percus, J. K., Percus, O., & Perelson, A. S. (1993). Predicting the size of the antibody combining
region from consideration of efficient self/non-self discrimination. Proceedings of the
National Academy of Science, 90, 1691–1695.
Perelson, A. S. (1989). Immune network theory. Immunol. Rev., 110, 5–36.
Perelson, A. S., & Oster, G. F. (1979). Theoretical studies of clonal selection: Minimal antibody
repertoire size and reliability of self–nonself discrimination. Journal of Theoretical Biology,
81, 645–670.
Smith, R. E., Forrest, S., & Perelson, A. S. (in press). Searching for diverse, cooperative populations
with genetic algorithms. Evolutionary Computation.
Stadnyk, I. (1987). Schema recombination in pattern recognition problems. In Proc. 2nd Interna-
tional Conference on Genetic Algorithms and their Applications, Hillsdale, N.J. Lawrence
Erlbaum Assoc.
31