using geographical information system to model the...
TRANSCRIPT

TS03D - The Use of Geoinformation - 6313
Oloyede-Kosoko, and Ayoola Akinola Akingbogun
Geospatial Application in Public Health: Using Geographical Information Systems to model the spread of
Tuberculosis
FIG Working Week 2013
Environment for Sustainability
Abuja, Nigeria, 6 – 10 May 2013
1/16
Geospatial Information In Public Health: Using Geographical
Information System to Model the Spread of Tuberculosis
Sakiru Olawumi Oloyede-KOSOKO and Ayoola Akinola AKINGBOGUN,
Nigeria
Key words: Tuberculosis, Cluster and spatial
SUMMARY
Currently, Nigeria is ranked fourth among the countries of the world with the highest
burden of tuberculosis (TB) and new perspectives and ways of addressing TB treatment
and control are needed as the disease continues unabated.
New technology, such as geographical information systems, may be useful in this
process. This study therefore focused on identifying geographical areas where on-going
tuberculosis transmission is occurring by linking Geographic Information Systems
technology with tuberculosis diagnosis in communities in Ibadan, Nigeria. Retrospective
data of TB incidence between 2004 and 2007 from the Health centers in Ibadan were
cartographically mapped to show current trends in the spread of the disease and its
geographic dispersion among those infected using ArcGIS 10.1 software, Satscan and
Global Positioning System (GPS).
A total of 5579 cases were detected over the study period. The mean age for the entire
affected population was 27.76 ± 8.46 (SD); 5400 (78.87%) patients were Adults while
179 (21.13%) were youth. The ‘nearest neighbour distance analysis’ indicated a clustered
pattern of locations with Ibadan North West, South East, South West and North East
characterized by overcrowding and poor quality housing conditions having increased
likelihood of on-going transmission. This study therefore provides a preliminary synopsis
of the uses of the Geographical Information Systems in the control of TB in Nigeria.

TS03D - The Use of Geoinformation - 6313
Oloyede-Kosoko, and Ayoola Akinola Akingbogun
Geospatial Application in Public Health: Using Geographical Information Systems to model the spread of
Tuberculosis
FIG Working Week 2013
Environment for Sustainability
Abuja, Nigeria, 6 – 10 May 2013
2/16
Geospatial Information In Public Health: Using Geographical
Information System to Model the Spread of Tuberculosis
Sakiru Olawumi Oloyede-KOSOKO and Ayoola Akinola AKINGBOGUN,
Nigeria
1. INTRODUCTION
Infectious diseases remain a major cause of death worldwide and also represent an
incalculable source of human misery. More than 95% of these deaths occur in
developing world (Lolch, et. al., 2003). The three major infectious diseases are human
immunodeficiency virus/ acquired immunodeficiency syndrome (HIV/AIDS),
tuberculosis and malaria. Tuberculosis is the most frequent cause of death from a single
infectious disease in persons aged 15 – 49 years, causing a total of 2 – 3 million deaths
annually (Enarson and Chretien, 1999). Tuberculosis (TB) is humanities greatest killer
which is out of control in many parts of the world. The disease is preventable but it has
been grossly neglected and no country worldwide is immune to it (Shrestha, et. al.,
2005). It is still a major health concern worldwide and the disease spreads more easily in
overcrowded settings and in the conditions of malnutrition and poverty (Mycal, et. al.,
2005). New perspectives and ways of addressing TB treatment and control are needed
(Porter et al. 1999). These include different ways of implementing the World Health
Organization’s directly observed therapy short course (DOTS) strategy. The strategy
emphasizes the importance of the creation and maintenance of a standard, well-managed
health delivery structure through which to develop and maintain TB services. Putting this
package into action is proving to be slow and difficult (WHO 1998), and there is a need
to find ways of being flexible and creative in implementing the strategy. New technology,
such as geographical information systems (GIS), may be useful in this process.
Geographical positioning system (GPS) and GIS certainly provide opportunities to
identify problems produce hypotheses and further develop public health strategies for the
control of infectious diseases like tuberculosis. So far, GIS has been applied to several
communicable diseases, but there has been little work conducted on its uses in
tuberculosis control (Beyers, et. al. 1996) particularly in Nigeria. Modeling tuberculosis
(TB) transmission facilitates the understanding of spatial and temporal patterns of TB
infection in a population. New perspectives and ways of addressing TB treatment and
control are needed especially in Nigeria, given the increasing incidence of the infection
and the fact that the country is ranked fourth in the global burden of the disease.
Geographical Information System is a useful tool in disease control worldwide; hence the
need for its application in TB control in Nigeria.

TS03D - The Use of Geoinformation - 6313
Oloyede-Kosoko, and Ayoola Akinola Akingbogun
Geospatial Application in Public Health: Using Geographical Information Systems to model the spread of
Tuberculosis
FIG Working Week 2013
Environment for Sustainability
Abuja, Nigeria, 6 – 10 May 2013
3/16
Figure 1 Map showing the Location of the study area
1.1 Study Area
The study covers Ibadan metropolitan city, which is the largest indigenous city in Africa,
is the capital of Oyo state. It is made up of eleven local government areas five of which
are within the inner city- Ibadan North-West, Ibadan North-East, Ibadan South-East,
North Ibadan and Ibadan South-West. The remaining six encompassing local government
areas are Akinyele, Lagelu, Egbeda, Ona-Ara, Oluyole and Iddo local government areas.
Ibadan lies at latitude 7 ˚23' N and Longitude 3˚ 56'E. It is located at the transition zone
between the forest and grassland areas of the country. The population of central Ibadan
which is made of by the five Local Government Areas is 1,338,659 according to census
result of 2006 covering an area of 128 square kilometer.
2. MATERIALS AND METHOD
Retrospective data of TB incidence between 2004 and 2007 from Jericho Chest Clinic,
Ibadan were cartographically mapped to show current trends in the spread of the disease
and its geographic dispersion among those infected in Ibadan North-West, Ibadan North-
East, Ibadan South-East, Ibadan North and Ibadan South-West using ArcGIS 9.2 software
and global positioning system (GPS), The database included names, age, gender, and
addresses of the affected patients over the study period. Some data were eliminated either
because of vague descriptions of location or because they could not be confirmed. The
Latitude/Longitude coordinates of house and street data were determined by using the
GPS (Global Positioning System) and Social survey. The database was converted into
map layers within ArcGIS (Environmental Systems Research Institute, Redlands, CA,
USA). A basic boundary map served as the base map and other features were generated
from the satellite imagery.

TS03D - The Use of Geoinformation - 6313
Oloyede-Kosoko, and Ayoola Akinola Akingbogun
Geospatial Application in Public Health: Using Geographical Information Systems to model the spread of
Tuberculosis
FIG Working Week 2013
Environment for Sustainability
Abuja, Nigeria, 6 – 10 May 2013
4/16
Over the years, population and development of land in Ibadan have increased. As
surrounding urban centers grow, proliferation into neighboring communities has become
apparent and congested. New residents create need for the development of land for
housing, schools, parks, and place significant strains on existing land cover and available
natural resources. In order to monitor the spread in the city, a population percent change
analysis was performed to determine the extent of land cover change over time.(Figure 3)
A GIS analysis using a programme in ArcGIS 9.2 was performed to measure the distance
between infected location and nearby points on the map. The degree of clustering of TB
locations was assessed using the Average nearest neighbour distance method and yearly
pattern differences were investigated. As previously mentioned, to reduce the size of the
number of Tuberculosis Infection Locations analyzed. A subset of the study area was
chosen; the 500x500m quadrangle. This area was chosen because most of the
Tuberculosis Infection Locations for the study occurred in this area. The quadrangle was
divided into 780 quadrants of 500 by 500 meters. This size was chosen because it
encompassed a sufficient number of points for the analysis. Quadrants less than 500x500
meters combined too few points together in one quadrant, and a quadrant size of 1000 by
1000 meters, combined too many locations within one quadrant. All locations within this
quadrangle were included in the analyses. Average nearest neighbor distance analysis
was used to detect spatial point pattern.
Figure 2 Showing spatial relationships between infected and non-infected points, Ibadan (2004-2007)

TS03D - The Use of Geoinformation - 6313
Oloyede-Kosoko, and Ayoola Akinola Akingbogun
Geospatial Application in Public Health: Using Geographical Information Systems to model the spread of
Tuberculosis
FIG Working Week 2013
Environment for Sustainability
Abuja, Nigeria, 6 – 10 May 2013
5/16
Figure 3 The quadrangle, showing the Tuberculosis Locations in the eleven Local Government area
of Ibadan
Figure 4 The quadrangle, showing the subset of Tuberculosis Locations of five Local Government
areas
TS03D - The Use of Geoinformation - 6313
Oloyede-Kosoko, and Ayoola Akinola Akingbogun
Geospatial Application in Public Health: Using Geographical Information Systems to model the spread of
Tuberculosis
FIG Working Week 2013
Environment for Sustainability
Abuja, Nigeria, 6 – 10 May 2013
6/16
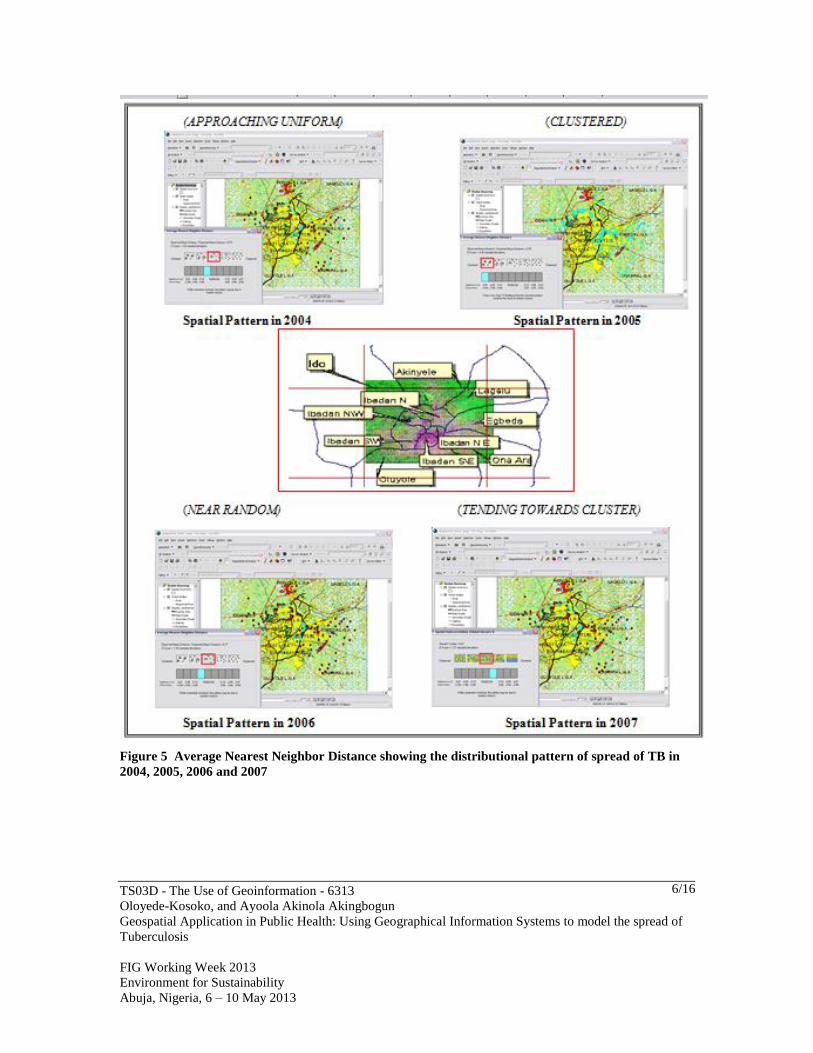
Figure 5 Average Nearest Neighbor Distance showing the distributional pattern of spread of TB in
2004, 2005, 2006 and 2007

TS03D - The Use of Geoinformation - 6313
Oloyede-Kosoko, and Ayoola Akinola Akingbogun
Geospatial Application in Public Health: Using Geographical Information Systems to model the spread of
Tuberculosis
FIG Working Week 2013
Environment for Sustainability
Abuja, Nigeria, 6 – 10 May 2013
7/16
Figure 6 Spatial distribution of tuberculosis infection into low, medium and high zones
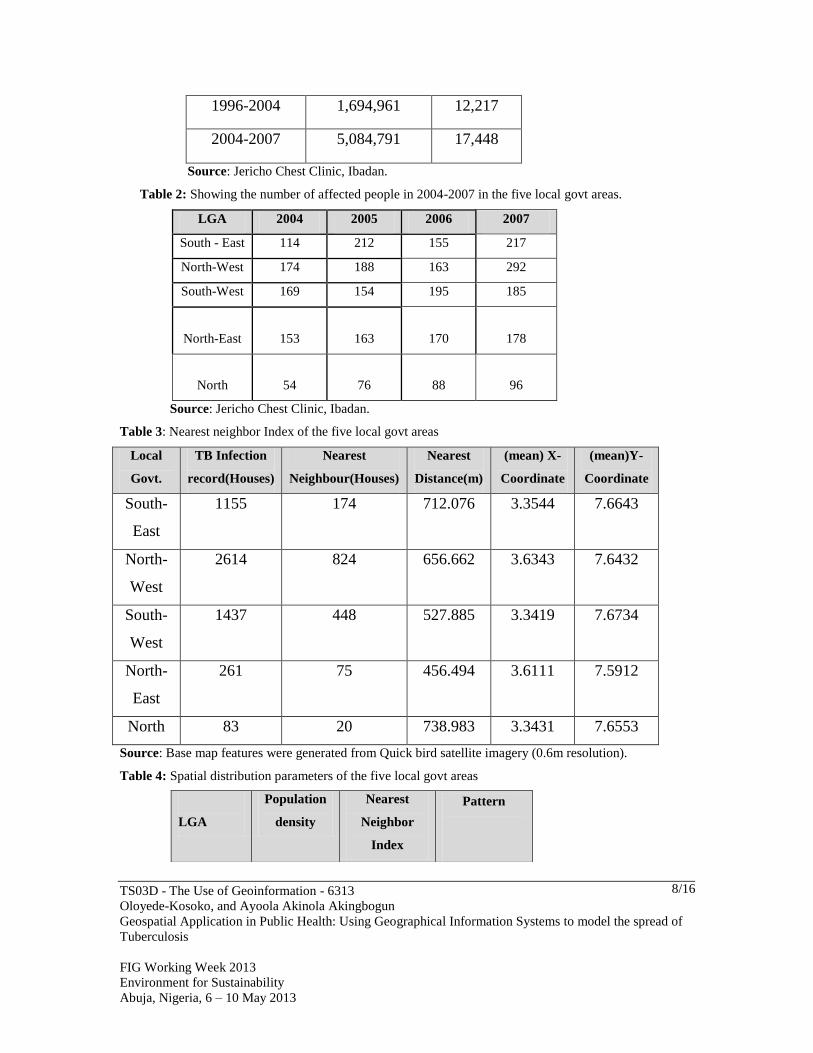
Table 1: Showing the number of confirmed cases of Tuberculosis in Ibadan
YEAR POPULATION CASES
TS03D - The Use of Geoinformation - 6313
Oloyede-Kosoko, and Ayoola Akinola Akingbogun
Geospatial Application in Public Health: Using Geographical Information Systems to model the spread of
Tuberculosis
FIG Working Week 2013
Environment for Sustainability
Abuja, Nigeria, 6 – 10 May 2013
8/16
1996-2004 1,694,961 12,217
2004-2007 5,084,791 17,448
Source: Jericho Chest Clinic, Ibadan.
Table 2: Showing the number of affected people in 2004-2007 in the five local govt areas.
LGA 2004 2005 2006 2007
South - East 114 212 155 217
North-West 174 188 163 292
South-West 169 154 195 185
North-East 153 163 170
178
North 54 76 88
96
Source: Jericho Chest Clinic, Ibadan.
Table 3: Nearest neighbor Index of the five local govt areas
Local
Govt.
TB Infection
record(Houses)
Nearest
Neighbour(Houses)
Nearest
Distance(m)
(mean) X-
Coordinate
(mean)Y-
Coordinate
South-
East
1155 174 712.076 3.3544 7.6643
North-
West
2614 824 656.662 3.6343 7.6432
South-
West
1437 448 527.885 3.3419 7.6734
North-
East
261 75 456.494 3.6111 7.5912
North 83 20 738.983 3.3431 7.6553
Source: Base map features were generated from Quick bird satellite imagery (0.6m resolution).
Table 4: Spatial distribution parameters of the five local govt areas
LGA
Population
density
Nearest
Neighbor
Index
Pattern

TS03D - The Use of Geoinformation - 6313
Oloyede-Kosoko, and Ayoola Akinola Akingbogun
Geospatial Application in Public Health: Using Geographical Information Systems to model the spread of
Tuberculosis
FIG Working Week 2013
Environment for Sustainability
Abuja, Nigeria, 6 – 10 May 2013
9/16
Table 5: Distance between TB infected area and non-infected area (m) in Ibadan North- East Local
Government area.
Distance between TB
infected area and non-
infected area (m)
Nearest points to the infected areas
in Ibadan North-East
Total
Institution/Schools Commercial
centers
Residential
quarters
100-300 14 23 75 65
300-500 25 47 92 44
Table 6: Distance between TB infected area and non-infected area (m) in Ibadan South- East Local
Government area.
Distance between TB
infected area and non-
infected area (m)
Nearest points to the infected areas
in Ibadan South-East
Total
Institution/Schools Commercial
centers
Residential
quarters
100-300 13 38 47 98
300-500 18 72 85 175
Table 7: Distance between TB infected area and non-infected area (m) in Ibadan North- West Local
Government area.
South-East 11299 0.674 Near cluster
North -East 5317 0.533 Clustered
South-East 11299 0.674 Near cluster
South-West 7013 0.722 Tending to
cluster
North -East 18614 1.1236 Near random
North 652 1.367 Approaching
uniform

TS03D - The Use of Geoinformation - 6313
Oloyede-Kosoko, and Ayoola Akinola Akingbogun
Geospatial Application in Public Health: Using Geographical Information Systems to model the spread of
Tuberculosis
FIG Working Week 2013
Environment for Sustainability
Abuja, Nigeria, 6 – 10 May 2013
10/16
Distance between TB
infected area and non-
infected area (m)
Nearest points to the infected areas
in Ibadan North-West
Total
Institution/Schools Commercial
centers
Residential
quarters
100-300 8 44 158 210
300-500 12 60 183 215
Table 8: Distance between TB infected area and non-infected area (m) in Ibadan South- West Local
Government area.
Distance between TB
infected area and non-
infected area (m)
Nearest points to the infected areas
in Ibadan South-West
Total
Institution/Sc
hools
Commercial
centers
Residential
quarters
100-300 4 82 98 184
300-500 10 90 80 180
Table 9: Distance between TB infected area and non-infected area (m) in Ibadan North Local Government
Distance between TB
infected area and non-
infected area (m)
Nearest points to the infected areas
in Ibadan North
Total
Institution
/Schools
Commercial
centers
Residential quarters
100-300 11 9 34 54
300-500 19 30 25 74
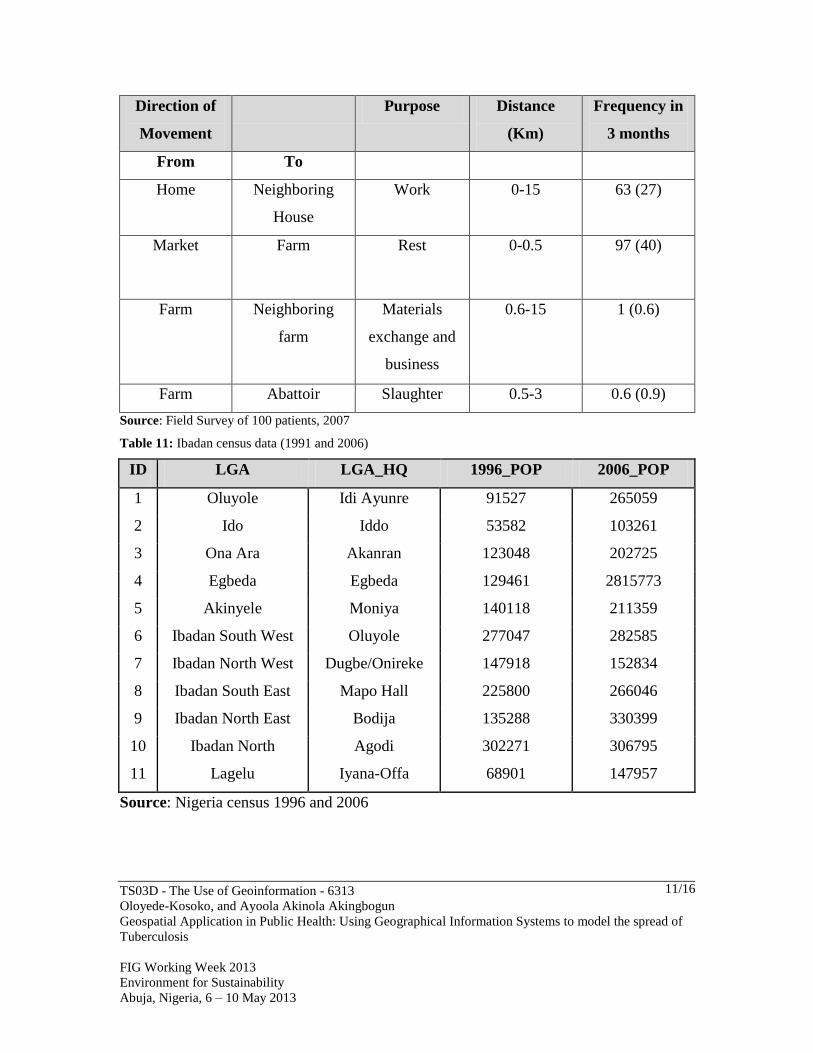
Table 10: Average movement of patients to and from Home, market and farm
Figures in parenthesis represent Standard Deviation (S.D.)
TS03D - The Use of Geoinformation - 6313
Oloyede-Kosoko, and Ayoola Akinola Akingbogun
Geospatial Application in Public Health: Using Geographical Information Systems to model the spread of
Tuberculosis
FIG Working Week 2013
Environment for Sustainability
Abuja, Nigeria, 6 – 10 May 2013
11/16
Direction of
Movement
Purpose Distance
(Km)
Frequency in
3 months
From To
Home Neighboring
House
Work 0-15 63 (27)
Market Farm Rest 0-0.5 97 (40)
Farm Neighboring
farm
Materials
exchange and
business
0.6-15 1 (0.6)
Farm Abattoir Slaughter 0.5-3 0.6 (0.9)
Source: Field Survey of 100 patients, 2007
Table 11: Ibadan census data (1991 and 2006)
ID LGA LGA_HQ 1996_POP 2006_POP
1 Oluyole Idi Ayunre 91527 265059
2 Ido Iddo 53582 103261
3 Ona Ara Akanran 123048 202725
4 Egbeda Egbeda 129461 2815773
5 Akinyele Moniya 140118 211359
6 Ibadan South West Oluyole 277047 282585
7 Ibadan North West Dugbe/Onireke 147918 152834
8 Ibadan South East Mapo Hall 225800 266046
9 Ibadan North East Bodija 135288 330399
10 Ibadan North Agodi 302271 306795
11 Lagelu Iyana-Offa 68901 147957
Source: Nigeria census 1996 and 2006
TS03D - The Use of Geoinformation - 6313
Oloyede-Kosoko, and Ayoola Akinola Akingbogun
Geospatial Application in Public Health: Using Geographical Information Systems to model the spread of
Tuberculosis
FIG Working Week 2013
Environment for Sustainability
Abuja, Nigeria, 6 – 10 May 2013
12/16
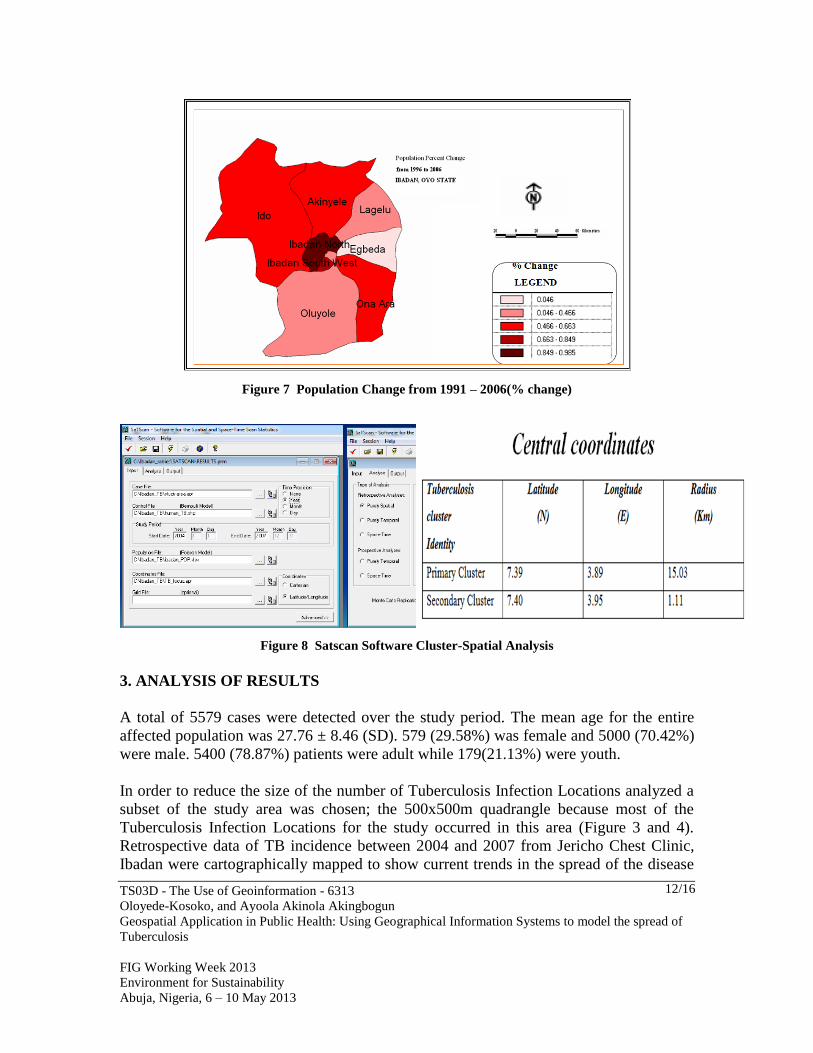
Figure 7 Population Change from 1991 – 2006(% change)
Figure 8 Satscan Software Cluster-Spatial Analysis
3. ANALYSIS OF RESULTS
A total of 5579 cases were detected over the study period. The mean age for the entire
affected population was 27.76 ± 8.46 (SD). 579 (29.58%) was female and 5000 (70.42%)
were male. 5400 (78.87%) patients were adult while 179(21.13%) were youth.
In order to reduce the size of the number of Tuberculosis Infection Locations analyzed a
subset of the study area was chosen; the 500x500m quadrangle because most of the
Tuberculosis Infection Locations for the study occurred in this area (Figure 3 and 4).
Retrospective data of TB incidence between 2004 and 2007 from Jericho Chest Clinic,
Ibadan were cartographically mapped to show current trends in the spread of the disease

TS03D - The Use of Geoinformation - 6313
Oloyede-Kosoko, and Ayoola Akinola Akingbogun
Geospatial Application in Public Health: Using Geographical Information Systems to model the spread of
Tuberculosis
FIG Working Week 2013
Environment for Sustainability
Abuja, Nigeria, 6 – 10 May 2013
13/16
and its geographic dispersion among those infected in Ibadan (Table 1 and 2). The degree
of clustering of TB locations was assessed using the Average nearest neighbour distance
method and yearly pattern differences were completed (Figure 5).
The nearest neighbour distance analysis indicated a clustered pattern of locations (Table
4). Nearest neighbour Index of the interior Local government areas of Ibadan indicated a
clustering neighbourhood spatial pattern of housing structure (Table3).
Furthermore, spatial distribution of tuberculosis infection was analyzed into zones
(Figure 6).the result of the affected areas were grouped into low (0- 0.9%) medium
(0.9%-1.8%) and high (1.8%-2.8%) areas.
The highest proportion of points with clustered TB occurred in the Ibadan North West,
South East, South West and North East with the highest incidence. These areas; such as
Gege, Orita Merin, Agbeni, Foko, Ogunpa, Idi arere, Popo-Iyemoja, Ayeye, Beere,
Opoyeosa, Labiran, Adeoyo and Idiobi were characterized by overcrowding and poor
quality housing conditions.
The distance between infected points and non-infected points are as shown in Table 5, 6,
7, 8 and 9. Field Survey of 100 TB patients were carried out to determine the average
movement of patients to and from Home, market and farm with commercial centers and
residential quarters within the nearest distance (Table 10).
In order to monitor the spread in the city, a population percent change analysis
was performed to determine the extent of land cover change over time (Figure 7).
3.1 Discussion
The affected mean age (44.7 ± 17.3 (SD)) recorded in this study further confirms the age
group most susceptible to pulmonary tuberculosis infection as asserted by Cadmus
(2007). This showed that these groups were those at highest risk from the population
studied. The results obtained are in agreement with the global picture in which the
greatest incidence and mortality are concentrated in the economically most productive
age group of the population (15-59 years) (Kochi, 1991). These age groups may therefore
be responsible for further spread of the disease in the five LGAs which are within the
inner city- Ibadan North-West, Ibadan North-East, Ibadan South-East, Ibadan North and
Ibadan South-West.
It was observed that more males (70.42%) were documented to have TB in the
community than females (29.58%). This finding is supported by the work of Uplekar, et.
al. (2001) in which about 70% more male than female patients globally were said to
suffer from Tuberculosis. This is further corroborated by the higher prevalence of TB in
males over females in India with ratios varying from 1:3 to 1:5 (Chadha, 2005).

TS03D - The Use of Geoinformation - 6313
Oloyede-Kosoko, and Ayoola Akinola Akingbogun
Geospatial Application in Public Health: Using Geographical Information Systems to model the spread of
Tuberculosis
FIG Working Week 2013
Environment for Sustainability
Abuja, Nigeria, 6 – 10 May 2013
14/16
Notification rate values are twice as large for males as for females. A possible
explanation could be that tuberculosis infection is directly and strongly related to HIV
and risk behaviours like, alcohol and drug abuse, homelessness, among others, which are
more frequent in the male population (Nunes, 2007).
However, it is known that women in poor countries confront more barriers than men in
accessing health care services (Ayele, et. al., 2004) hence; the possibility of more cases
of TB in women cannot be ruled out. This situation is also true in Nigeria where women
are economically and educationally disadvantaged; hence, reduced opportunities to
access health care. Therefore, women are less likely to be tested and treated for TB than
men. Long et al. (1999) however, also believed that women are also less likely to develop
TB infection.
This study uncovered geographical links to on-going tuberculosis transmission,
enhancing traditional public health surveillance and a clustered pattern of infection was
recorded. As such, with Ibadan North West, South East, South West and North East
recorded the highest incidence. These areas could benefit from a more detailed evaluation
to determine if it represents a real tuberculosis incidence cluster or if the cluster is caused
by other factors, for instance, a better notification rate.
More so, a limitation encountered in this study was vague description of some addresses,
which were as a result not included in the analysis. However, risk factors such as
overcrowding and the fact that most points recorded in this location were ghettos
constitute a plausible reason for this observation.
3.2 Conclusions and Recommendations
The case study of five Ibadan local governments which are within the inner city Ibadan
North-West, Ibadan North-East, Ibadan South-East, Ibadan North and Ibadan South-West
was thus an extremely small coverage of national records. Quantitatively, the model
adequately describes the general spatial patterns of affected locations, but does not
describe the interactions with environmental variables, or explicitly define terms of
neighborhood effects. Thus, the results presented here are a poor predictor of future TB
locations and any explanations need more robust statistical analysis to account for
environmental conditions and seasonal changes. Because of these issues, a combination
of spatial statistical methods should be used and any single should not be relied on.
Ideally, analysis that evaluates spatial clustering of all individuals at one moment in time
and all locations for one individual over a time period should be used. In this way,
questions of group cohesiveness and individual differences in movement patterns can be
examined.

TS03D - The Use of Geoinformation - 6313
Oloyede-Kosoko, and Ayoola Akinola Akingbogun
Geospatial Application in Public Health: Using Geographical Information Systems to model the spread of
Tuberculosis
FIG Working Week 2013
Environment for Sustainability
Abuja, Nigeria, 6 – 10 May 2013
15/16
Further research should include a spatial weighting factor to account for variations in and
the significance of environmental variables. Spatial adjacency of a set of environmental
variables, consisting of human activities needs to be included in future analysis. Charges
in the spatial pattern of affected locations over time need to be addressed due to human
movement. Other spatial patterns and processes can be examined using techniques such
as multi-response sequence testing, which can test for differences in distance moved
between individual animals and groups of animals.
Due to inaccessibility of up to date survey maps of the area new streets may have been
left out However, all the available data have been geo-referenced and the streets in which
they fall have been identified. Land use maps are not up to date hence the type of
structure presently occupying the area and land use cannot be identified without a
reconnaissance survey. The use of GIS has not been fully integrated into the public
health sector. Availability of data would go a long way to encourage researchers to fully
delve into problems experienced within this sector because data is the bedrock of any
analysis done with a GIS.
Our result shows that GIS can be used to classify the spread of tuberculosis; therefore,
providing clues for its control measures particularly as it concerns point distribution of
the disease in relation to the location and population density. Simultaneous use of GIS
analysis and epidemiological surveillance will be an effective method for identifying
instances of local transmission. Finally, further studies using GIS techniques will be
required.
REFERENCES
Ayele, W. Y., Neill, S. D., Zinsstag, J.,Weiss, M. G. and Pavlik, I. (2004), Bovine
Tuberculosis: An Old Disease but a new threat to Africa, The International
Journal of Tuberculosis and Lung Disease, 8, 924-937.
Beyers, N., Gie, R.P., Zietsman, H.I.(1996) The Use of a Geographical Information
System (GIS) to Evaluate the Distribution of Tuberculosis in a High Incidence
Community, South African Medical Journal, 86, 40–44.
Cadmus, S.I.B. (2007), Molecular Characterization of Human and Bovine Tubercle
Bacilli in Ibadan, Ph.D Thesis.University of Ibadan, Ibadan, Nigeria, Pp 338.
Chadha, V.K. (2005), Tuberculosis Epidemiology in India: A Review, International
Journal of Tuberculosis and Lung Disease, 9(10): 1072-1082.
Enarson, D.A., and Chretien, I. E (1999): Epidemiology of respiratory infectious
Diseases, Curr. Opin. Pulm. Med, 5:128-35.
Kochi, A.(1991), The Global Tuberculosis Situation and the New Control Strategy of the
World Health Organisation, Tubercle, 72, 1-6.
Lolch, I., Hernandez, I., Barragen, M. and Trance-Paredes, C. (2003): Infectious disease,

TS03D - The Use of Geoinformation - 6313
Oloyede-Kosoko, and Ayoola Akinola Akingbogun
Geospatial Application in Public Health: Using Geographical Information Systems to model the spread of
Tuberculosis
FIG Working Week 2013
Environment for Sustainability
Abuja, Nigeria, 6 – 10 May 2013
16/16
Non Zero Sum Thinking and the Developing World, Am. J. Med. Sci,. 376:66-77.
Long, N.H., Johansson, E., Lönnroth, K., Eriksson, B., Winkvist, A. and Diwan, V.
(1999). Longer Delays in Tuberculosis Diagnosis Among Women in Vietnam,
International Journal of Tuberculosis and Lung Diseases, 3, 388-93.
Mycal, P., Ssiknth, T., Vikas, I., Manoj, B., Date, H. and Iyyer, R. (2005): Drug
Resistance Pattern of Mycobacterium Tuberculosis in Seropositive HIV-TB
Patients in Pune, India. Ind. J. Med. Res, 121: 235-9.
Porter, J.D.H., Ogden, J.A. and Pronyk, P. (1999). The way forward: an integrated
Approach to Tuberculosis Control. In: Tuberculosis – An Interdisciplinary
Perspective (eds JDH Porter and JM Grange), Imperial College Press, London,
pp. 359 – 378.
Sherestha, D., Bhattacharya, S.K., Lekhak, B., and Rajendra Kuma, B.C. (2005):
Evaluation of Different Staining Techniques (Ziel Nielsen Stain, Kinyon Stain,
Modified Cold Stain, Fluorochrome Stain) for the Diagnosis of Pulmonary
Tuberculosis, J. Nepal. Health Res. Council, 3:8-16.
Upleker, M. W., Rangan, S., Weiss, M.G., Ogden, J., Borgdorff, M. W. and Hudelson, P.
(2001), Attention to Gender Issues in Tuberculosis Control (Unresolved Issues),
The International Journal of Tuberculosis and Lung Disease,5(3): 220-224.
World Health Organization (1998) WHO Report on the Global Tuberculosis Epidemic,
WHO/TB/98.247. WHO, Geneva
CONTACTS
S.O.A OLOYEDE-KOSOKO (GIS Expert)
Department of Geoinformatics
Federal School of Surveying,
P.M.B. 1024, Oyo, Oyo State, Nigeria
Email: [email protected]
234-8033950908
Ayoola Akinola AKINGBOGUN
POINTMILE GEOTECH, LAGOS
Email: [email protected]
234-8032379644