using girth measurements to estimate the · pdf filefaculty of veterinary science, the...
TRANSCRIPT

Faculty of Veterinary Science, The University of Sydney. Camden NSW 2570
USING GIRTH MEASUREMENTS TO ESTIMATE THE LIVE WEIGHT OF CATTLE AND BUFFALO IN LAO PEOPLE’S DEMOCRATIC REPUBLIC (PDR)
T. MACDONALD1, P. WINDSOR1, L. RAST2, R. BUSH1
Summary
A girth tape was developed specifically for buffalo and cattle in Lao PDR to empower farmers with knowledge on the value of their animals (by weight for trading) and to improve their management which in turn improves the welfare of the livestock and the economic standing of subsistence farmers. Data was obtained from six villages within the three provinces Louang Phaband, Xieng Khouang and HouPhan during the wet and dry seasons. Approximately 6000-8000 animals were used in the study. Weight was modelled against, girth, height and width. Width could not be compared to height and girth due to its complexity. The variable “Village” highly influential on the relationship of Girth~Width and was considered as a random variation within the analysis to explain the variation within the data and therefore to create a better model. Girth was found to be the best predictor of weight using a quadratic model (polynomial two). The weight data contained a high number of outliers (284 out of 6154 of the dry season data) which were removed using Pearsons model as this will have negatively impacted on the development of the model for predicting weight from girth measurements. There were little observable graphical differences between the wet and dry season models. However, in the field small weight changes make a significant difference to the value and management of animals. Hence, it may be important to develop separate tapes for the seasons. Further study is needed to develop statistical analysis on repeated measures and to model weight~width for comparison. Future research is needed to identify animals in the field that do not fit the model. Farmers will then require training in order to identify these animals. There needs to be further investigations into the effects of age and condition on the model of weight~girth and the interaction of more than one body size measurement and variables in improving the prediction of liveweight of buffalo and cattle in Lao PDR to improve scientific knowledge. Field evaluations are needed to assess the feasibility of using the girth tape.
I. INTRODUCTION Currently, human populations within Lao PDR and the greater Southeast Asia region have an increase in demand for animal products due to urbanisation (Wilson, 2007; Stür et al., 2002). This is because incomes and local populations are rising and aspire to live better and wholesome lives. Approximately 16% of the Gross Domestic Product (GDP) is from the livestock sector with buffalo (1.1 million head) and cattle (1.3 million head) being the main ruminant species (Wilson, 2007). “In 2004 estimated production of meat from buffalo was 33 102 tonnes equivalent to an availability of 5.7 kg per head of the human population per year” (Wilson, 2007). Approximately 75% of cattle and buffalo produced are consumed domestically and 25% are exported (Millar and Photakoun, 2008). Lao PDR is a landlocked country surrounded by potentially major markets in Thailand, Cambodia, Myanmar, Vietnam and People’s Republic of China. In Lao PDR, 85% of the population are subsistence farmers relying on agriculture for their livelihood (Stür et al., 2002) and buffalo and cattle are a source of income and draught power. Animals are mostly grazed and the strongest and
1 Faculty of Veterinary Science, University of Sydney, Private Bag 4003, Narellan, NSW 2 Faculty of Veterinary Science, University of Sydney, Luang Prabang, LAO PDR

Faculty of Veterinary Science, The University of Sydney. Camden NSW 2570
biggest bulls are castrated and used for draught power. Animals are kept beyond their productive capacity as an accumulation of wealth (Stür et al., 2002). In a final report on the economic and policy environment of smallholders in Cambodia and Laos by Harding et al. (2007), the estimated value of stock on average was $517 per household in Vietnam. This is believed to a good representation of the current situation in Laos and Cambodia (Harding 2007). Farmers report that females usually produce their first calf at an age of three years (Stür et al., 2002) and miss a breeding season once every 2-4 years which may be attributed to nutritional management of the animals. In addition, there is little literature on estimating the liveweight of Asian yellow cattle and swamp buffalo using body size measurements in Lao PDR.
At present, buffalo and cattle liveweight is estimated visually and is prone to human error and bias by both traders and farmers (Machila et al., 2008). Cattle scales are expensive and generally inaccessible to smallholder farmers. The girth tape is a cheap and accessible method with the potential of being more reliable than visual estimation and has been widely validated as the best single body size predictor for liveweight (Dingwell et al., 2006; Heinrichs et al., 1992; Yan et al., 2009). Other body size measurements such as height, width and heart girth around the hump have also been assessed as predictors of liveweight in cattle. The girth tape empowers the farmer with knowledge about the value of their animals which in turn improves trade and their economic situation. In addition, farmers with better knowledge about the weight of their animals can improve their management (e.g. nutrition, weight gain) which in turn can improve the welfare and production of buffalo and cattle in Lao. The girth tape is a measuring band marked in centimetres (or another measuring unit) with the predicted body weight for that unit which has been obtained from a model created from measuring the weight and girth of cattle. The girth tape measures the minimal circumference around the body behind the front shoulder (Figure 1).
Figure 1: Sourced from Abdelhadi and Babiker (2009). H.G = Heart Girth
H.G.H =Heart Girth around the Hump The reliability of models to estimate liveweight using body size measurements is greatly improved with the use of demographic information such as location, breed, gender and age and this can obtained by developing models at a specific site (Enevoldsen and Kristensen, 1997; Weerasinghe et al., 2009; Yan et al., 2009). Therefore, a girth tape was developed to estimate the live of buffalo and cattle in Lao PDR using data from six villages of high and low intervention from three provinces in Northern Lao PDR: HouaPhan, Luang Phabang and Xieng Khouang during the wet and dry seasons. The girth tape was developed to empower farmers with knowledge about the value and weight of their animals to improve trade and livestock management.
II. MATERIALS AND METHODS

Faculty of Veterinary Science, The University of Sydney. Camden NSW 2570
The girth tape was developed using data obtained from buffalo and cattle from within six villages (two x low & high intervention villages) within three provinces.
Two different intervention techniques were used to ensure methods of improving livestock management were conveyed. These are summarised below in Table1. Table1. Approximate Intervention Outline Intervention HS FMD Int. & Ext.
Parasites Calf Dis. VVW
Training Forage Enhancement
Market Analysis
Breeding Management
Biosecurity
Low Yes No Diag. & Advise
Diag. & Advise
Yes Observe Observe Observe No
High Yes Yes Diag. & Manage
Diag. & Manage
Yes Yes Observe Observe Yes
The villages were as follows: Ban Navieng (Low), Ban Na Kud (High) in the Province HouaPhan; Ban Huay Paen (Low) and Ban Hard Pang (High) in the Province Luang Phabang; Ban Nadee (Low) and Ban Nong (High) in the province Xieng Khouang (Figure 2).
Two trainers from each province obtained data on: Village, sex, breed, the year of birth of the animal, use (breeding, cash, draught, slaughter, other), origin (village, bought/introduced), condition (skinny, medium, fat), weight (kg), height (cm), girth (cm), width (cm) from approximately 6000 cattle in the dry season and 8500 in the wet season of which approximately 32% are buffalo and 68% are cattle. Weight is obtained using cattle scales, height, girth and width with a tape measure. Data were analysed using free statistical software TinnR and Rgui using the package nlme: Linear and Nonlinear Mixed Effects Models (Pinheiro and Bates 2006). Statistical summaries and graphs were produced for the dry season. A pearsons model was developed to remove outliers outside 3.5 standard deviations for weight, girth, height
and width. Separate models were created for breed. Using the function lme() a linear mixed effects model was created for the dry and wet season. A
linear and polynomial 2 (quadratic) models to weight~girth and weight~height. Summaries of these models were obtained. A third model polynomial 3 (cubic) was fitted to weight~girth. Plots of weight~width by sex, the year of date of birth, use of animal, origin of animal, condition and village were created. Specific plots of weight~width were done for the village BanNong unclassed by sex, breed, use, year of date of birth, origin and condition. Predictions of weight from model for weight~girth at polynomial 2 were created separately for breed and seasons.
Logeweight = const + β1logGirth + β2logGirth2 + Village + βVillage+ ε The generic equation is given as the orthogonal polynomial coefficients are difficult to convert to ordinary polynomial coefficients.
Statistical analysis on repeated measures is still under development. The prediction outputted a series of widths starting from 50 cm to 225 cm with predicted weights for each value for separate breeds (buffalo and cattle) and for separate seasons (wet and dry). Using two lengths of plastic strip and a permanent marker a tape was developed using the prediction
Figure 2: Figure 2. Map of the Provinces where buffalo and cattle data were obtained

Faculty of Veterinary Science, The University of Sydney. Camden NSW 2570
for the dry season only. Prediction intervals using the standard errors from the predictions were obtained for the dry season data and these were also labelled on the tapes. Eight tapes were created, one for each breed for each province and backup pair of tapes.
Faculty of Veterinary Science, The University of Sydney. Camden NSW 2570
III. RESULTS
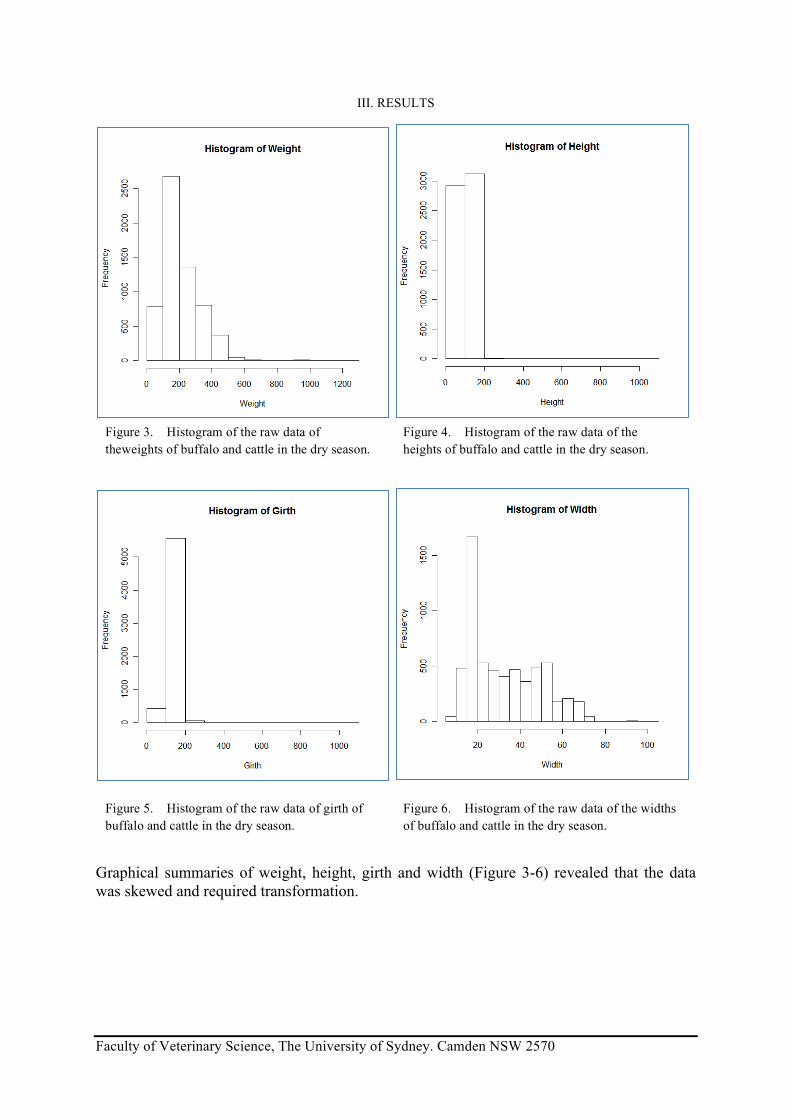
Graphical summaries of weight, height, girth and width (Figure 3-6) revealed that the data was skewed and required transformation.
Figure 3. Histogram of the raw data of theweights of buffalo and cattle in the dry season.
Figure 4. Histogram of the raw data of the heights of buffalo and cattle in the dry season.
Figure 5. Histogram of the raw data of girth of buffalo and cattle in the dry season.
Figure 6. Histogram of the raw data of the widths of buffalo and cattle in the dry season.

Faculty of Veterinary Science, The University of Sydney. Camden NSW 2570
Graphical plots of weight and body size measurement revealed that height and girth had an exponential relationship (Figure 7-8). Width had three distinct groups making it difficult to model (Figure 9). These were unclassed graphically and the results revealed a strong relationship between width and the province in which the animals were in (Figure 10). Suggesting location may significantly influence the weight and size of the animals. The village BanNong (Figure 10, black) had two separate groups one more associated with animals from Luang Phabang. However, closer inspection of the origin of the animals revealed that they were from within the village and not bought and introduced. Figures7-9 revealed a large number of outliers from the observed general trend.
Figure 7. Raw data plot of weight and girth of buffalo and cattle for the dry season.
Figure 8. Raw data plot of weight and height of buffalo and cattle for the dry season.
Figure 9. Raw data plot of weight and width of buffalo and cattle for the dry season.
Figure 10. Raw data plot of weight and width of buffalo and cattle for the dry season, colour
separated by village.

Faculty of Veterinary Science, The University of Sydney. Camden NSW 2570
Figure 11. Rgui modeloutput of logWeight vs. logGirth with the inclusion of Village as a Random factor.
Figure 12. Rgui model output of logWeight vs. logHeight with the inclusion of Village as a Random factor. The standard deviation residual revealed that girth was the better predictor of weight having the lower value (Figure 11-12). Linear and polynomial 3 models were not considered better than polynomial 2 (Figure 13) due to unrealistic curve on the tails of the model and the slight curve of the logged data points.
Figure 13. Polynomial 3 model on logWeight vs logGirth on dry season data.

Faculty of Veterinary Science, The University of Sydney. Camden NSW 2570
III. RESULTS (Page 4 of 5)
Girth was contained approximately within the range of 50 to 225 cm. Weight was approximately within the range of 0 to 600 kg. The raw dry season data revealed distinct groups of buffalo and cattle (Figure 14). There was generally even across the range (Figure 15). Figure 16. revealed an influence of the year of birth on cattle on the trend within the series (Age). Figure 17. did not show an observable effect of village on girth unlike width (Figure 10). The animals were found to be largely used for breeding and originated within the village and were not factors influencing the grouping of the data points by colour. Condition was found to also be grouped.
Figure 14. Raw data plot of weight and girth from dry season data, colour separated by breed.
Figure 15. Raw data plot of weight and girth from dry season data, colour separated by sex of dry season data.
Figure 16. Raw data plot of weight and girth from dry season data, colour separated by year of birth.
Figure 17. Raw data plot of weight and girth from dry season data, colour separated by village.

Faculty of Veterinary Science, The University of Sydney. Camden NSW 2570
As data values become larger there is an observed fanning of the data indicating more accuracy at a smaller size (Figure 20). A better fitting model using polynomial two was successfully created for the dry season data (Figure 18) and Figure 19 shows the original data values and how the model fits to these. The separate models for the seasons are very similar (Figure 21). Statistical tests assessing the differences between these are still under development.
Figure 18. Plot of logWeight and logGirth dry season data with model for predicting weights for each breed.
Figure 19. Plot of weight and girth dry season data with model for predicting weights for each
breed, back transformed.
Figure 20. Plot of weight and girth model for buffalo and cattle of both seasons back transformed with model for predicting weights for both season.
Figure 21. Plot of logWeight and logGirth wet season data with models for predicting weight in
dry and wet season.

Faculty of Veterinary Science, The University of Sydney. Camden NSW 2570
IV. DISCUSSION
The histograms (Figure 3-6) revealed that the numerical data obtained from the villages in Lao PDR of buffalo and cattle were left skewed and required transformation. Raw data plots of weight vs. Girth and height using dry season data revealed an exponential relationship concurring with the need to transform the data for analysis (Figure 7-8). A raw data plot of weight to width of revealed a more complicated relationship that requires further statistical development. Inspection of the weight~width plot distinctly showed three separate groups (Figure 9). Colour separation of the graphs was used to determine what other parameters obtained from the animals such as sex, breed, year of birth, village, use and origin in attempt to identify the cause of trend. The groups were found to be largely separated according to the provinces in which the villages belonged to (Figure 10). This indicates that location may be a contributing factor to predicting the weight of animals using body size measurements as discovered by Enevoldsen et al. (1997) in including demographic variables. Study be Weersinghe et al. (2009) and Otte et al. (1992) found that use of a girth tape not created specifically for that population of cattle needed to be transformed to fit.
Possible influences on the effect of province on width measurements may have been due to differences in livestock management, genetics or environmental conditions. The village BanNong was an exception and had two groups, where one had a closer relationship with cattle from the province Luang Phabang than within it province Xieng Khouang. This is possible as the provinces used in this study are located adjacent to each other. However, a plot of data from BanNong colour separated for origin of their cattle revealed that they originated within the village and were not bought or introduced. However, a raw data plot of weight vs. girth, colour separated by village revealed no such relationship. This indicates the potential for girth to be the least likely of the three body size measurements to be influenced by environmental factors. Nevertheless, village was included in the modelling for predicting liveweight using body size measurements. A model of width at this moment in time could not be compared to Weight~girth and weight~height.
Linear, polynomial 2 and 3 models were developed for the relationship between weight and girth using dry season data and polynomial two was found to be best fit graphically (Figure 13). A polynomial two model was also fitted for weight and height using dry season data and was compared to the first polynomial two model (Figure 11-12) and girth was found to be the better predictor of weight having the lower standard deviation residual. This concurred with other studies from Buvanendran et al. (1980), Johari et al. (2009), Wilson et al. (1997) and Yan et al. (2009). Girth was restricted within a range of 50-225 cm with weight ranging from 0-600 kg. Further plots were created to observe the effect of other factors on the relation of Weight~Girth such as breed, sex, year born, village location, use, origin of the animals and their condition (skinny, medium, fat (BSC=3)). There was no observable grouping of use or origin of animals. Approximately 98% of the animals were used for breeding and originated from within the village. Approximately 70% of the animals were in medium condition during the dry season within a one percent increase for the wet season. There was a decrease in the percentage of fat cattle in the wet season from 24% in the dry season to 21% in wet. Two animals were reported dead when the wet season data was collected. There was an observable grouping of breed in the relationship of weight~girth with buffalo being fatter and bigger in circumference. Gender appeared to be evenly spread across the trend, however, age was observed to cause groupings. Wilson et al. (1997) suggested that different weight management in younger animals compared with adult animals may require separate equations for predicting body weight using body size measurements.

Faculty of Veterinary Science, The University of Sydney. Camden NSW 2570
For practical purposes breed was included in the modelling for predicting weight using girth. Plots of the raw data for the dry season revealed an extensive number of outliers. For the statistical analysis to work, there is an assumption that the model is applicable to a normal bell curve shape and so a pearsons statistical code was used to remove any outliers outside 3.5 standard deviations. Approximately 284 animals from dry season data were not included in the model which approximates to 4% of the 6154 animal data obtained in the dry season. 8681 animals were used to obtain data from the wet season. As a result, due to the high noise level of the data and for the girth tape to be applicable these animals need to be identified and farmers to be trained to identify animals to be excluded from the use of the girth tape.
Figure 18 and 19 reveal that the models for buffalo and cattle are very similar and theoretically a single model would be used. However, in the field, changes in weight is a significant influence on the value and management of animals, hence two separate tapes and models were created for breed. Back transformation of the model and data points revealed that model fit very well with the observed points (Figure 19). Wet season data was overlayed with the dry season model for predicting weights and was found also to be a good model (Figure 21). Wet season models were developed and overlayed (Figure 21) and revealed that they did not differ much from the dry season. Nevertheless, changes in weight are a significance for subsistence farmers in Lao PDR and therefore it is suggested that separate tapes also be created for the seasons.
In conclusion, girth was found to be the better predictor for weight and a model and tape were created. Comparison of the dry season model tape to the wet season data revealed that it could give a fair idea of the weight of the animal. Separate tapes should be created for breed and season. Further research is required to develop statistical analysis on repeated measures in comparing wet and dry season data. Future research is needed for identifying animals that are excluded from the model to improve the practicality of the girth tape. Further research is also needed to assess the effects of age and condition on the model of Weight~Girth; and to assess the feasibility of the girth tapes in the field by comparing tape measurement, actual liveweight and weight by visual observation of farmers. Further research could look into the interactions of more than one body size measurement and variables in predicting liveweight to fill a gap in scientific knowledge.
Faculty of Veterinary Science, The University of Sydney. Camden NSW 2570
V. ACKNOWLEDGEMENT
The statistical aid from Peter Thompson is greatly acknowledged.
REFERENCES
Abdelhadi OMA, Babiker SA (2009) Livestock Research for Rural Development 21(8): 133. Buvanendran V, Umoh JE, Abubaka BY (1980) Journal of Agricultural Science 95(AUG): 219-224. Dingwell RT, Wallace MM, Mclaren CJ, Leslie CF, Leslie KE (2006) Journal of Dairy Science 89(10): 3992-3998. Enevoldsen C, Kristensen T (1997) Journal of Dairy Science 80(9): 1988-1995. Harding MD, Quirke D, Warner R (2007) "Cattle and buffalo in Cambodia and Laos: the economic and policy environment for smallholders." ACIAR Heinrichs AJ, Rogers GW, Cooper JB (1992) Journal of Dairy Science 75(12): 3576-3581. Johari S, Kurnianto E, Sutopo S, Hamayanti, WA (2009) J. Indonesian Trop. Anim. Agric 34(4): 289-294. Machila N, Fevre EM, Maudlin I, Eisler MC (2008) Preventive Veterinary Medicine 87(3-4): 394-403 Millar J, Photakoun V (2008) International Journal of Agricultural Sustainability 6(1): 89-102. Otte MJ, Woods AJ, Abuabara Y (1992) Tropical Animal Health and Production 24(2): 109-114. Pinheiro J, Bates D (2006) “Linear and nonlinear mixed effects models.” Stür W, Gray D, Bastin G (2002) "Review of the Livestock Sector in the Lao People's Democratic Republic." International Livestock Research Institute Wilson LL, Egan CL, Terosky, TL (1997) Journal of Dairy Science 80(11): 3077-3082. Wilson RT (2007) Tropical Animal Health and Production 39(6): 443-452. Weerasinghe, WMCB, Marapana RAUJ, Seresinhe T (2009) Pakistan Journal of Zoology Supplement Series (9): 155-157. Yan T, Mayne CS, Patterson DC, Agnew RE(2009) Livestock Science 124(1/3): 233-241.