using haptics as an alternative to visual map interfaces for
TRANSCRIPT

Using haptics as an alternative to visual map interfaces for public transport
information systems
Bashir Shalaik, Ricky Jacob, Peter Mooney, Adam Winstanley
Department of Computer Science, NUIM, Ireland
[email protected], [email protected], [email protected], [email protected]
ABSTRACT
The use of public transport for daily commutes or for journeys within a new city is
something most people rely on. To ensure users actively use public transport
services the availability and usability of information relevant to the traveler at any
given time is very important. In this paper we describe an interaction model for
users of public transport. The interaction model is divided into two main
components – the web interaction model and the mobile interaction model. The
web interface provides real-time bus information using a website. The mobile
interaction model provides similar information to the user through visual user
interfaces, gesture based querying, and haptic feedback. Improved access to transit
services is very dependent on the effectiveness of communicating information to
existing and potential passengers. We discuss the importance and benefits of our
multi-modal interaction in public transport systems. The importance of the
relatively new mode of haptic feedback is also discussed.
Keywords: public transit, GPS, haptics, AVL, real-time location, visualisation.
1 INTRODUCTION
One of the main objectives of any public
transport system in providing information about its
services is to provide relevant information in an
accessible way through various kinds of media. The
information must be provided while understanding
that current or potential users are in different spatio-
temporal contexts. Often the same types of
information must be provided in different but easy to
understand ways. If adequate attention is focused on
the user needs then resultant services should match
those needs and the public transport operator can
deliver an efficient service. Usability is the extent to
which a product or service can be used to achieve
specific goals with effectiveness, efficiency and
satisfaction in a specified context of use [1]. Public
transport operators should try to identify highly user
friendly, usable methods, for provision of transit
information for passengers. The most important
pieces of information provided to transit users are:
pre-trip planning services about stops and stations,
the available services (buses, trains, trams, etc),
accurate arrival times of service vehicles, and also
in-vehicle information systems such as expected time
of arrival at destination stops, and alerts for when the
user is arriving at the destination stop. Additionally
the guidance to the actual destination from the
destination stop through pedestrian navigation
system integration should also be considered thereby
offering a complete end-to-end journey planning and
assistance system. The increase of smartphone usage
[42] means mobile interaction for passengers must
also be considered for public transport services.
1.1 Our Proposed Model
In this paper we propose a model for using
haptics as an alternative interface for the provision of
public transport information to passengers with
smartphones. For the purposes of a case-study we
have focused on public transportation by bus.
However, as we will explain in the paper our model
is applicable to any mode of public transport. We
chose bus transportation for a number of reasons
including: the presence of bus transportation in
almost every city in the world, the disruption caused
to bus timetables due to buses sharing roads and
streets with other motor vehicle traffic, and access to
a real-world dataset of bus tracking information. Due
to the increase in popularity of mobile interaction our
model includes visual interfaces for mobile devices
with the addition of haptic-enabled feedback. In any
public transport system (in our case bus
transportation) a journey begins with planning the
trip, finding the nearest location to board the bus,
finding the time the bus should arrive, waiting at bus
stop, payment before journey, in journey activity,
alighting from the bus, and finally moving to the
destination. This process has been discussed by
many authors [2,3,4,5,6]. In this paper we describe a
public transport interaction model which
encompasses both web and mobile interaction
techniques. We highlight the need for multimodal

interaction techniques of communication and
integrate a haptic interaction model for various
phases in a user‟s journey. The structure of the paper
is as follows. In section 2 we review literature
covering research from both web and mobile
interaction techniques for public transport users. In
section 3 we describe our public transit interaction
model. The system implementation is described in
section 4. The user feedback and initial findings are
discussed in section 5. We close the paper with some
concluding remarks on the integration of haptics for
public transportation information provision while
providing a summary of possibilities for future work.
2 LITERATURE REVIEW
The traditional format for physical distribution
of transit information in the public transit has long
been printed media [7]. Transit information in paper
form has long been distributed aboard buses, trains
and in stations requiring significant human and
paper/graphic resources when updates are made.
Passengers are always seeking for a printed reference
of routes, schedules, or other service information.
These materials are typically published by transit
agencies and offered freely. The lack of any access
cost to passengers to these materials makes them the
most popular means of dissemination the transit
information. Despite their popularity all transit
information disseminated through printed media
require the continued publication of printed materials
which requires costly and labor-intensive resources.
Information about unexpected timetable or service
changes cannot be disseminated quickly through
printed media. These shortcomings have seen public
transit agencies increase their efforts to investigate
and develop new replacement media. As an
alternative to providing transit information on
printed media transit agencies have historically
provided free telephone-based support for their
passengers [7]. Today it is almost standard that real-
time transit information is provided via the Internet
and telephone [8]. Public transit agencies have
increasingly implemented methods for passengers to
access transit information using new media and
personal mobile devices. In the recent past
interactive-voice-response (IVR) phone interfaces
and SMS interfaces were also used for providing
real-time transit information. Transit agencies now
almost always provide transit information on their
web sites. Recently transit agencies have developed
the means to distribute real-time information to
mobile devices. Real-time public transportation
tracking systems combine a passenger accessible
web-based/mobile interface with back-end, wireless
data-based hardware to continuously transit vehicle
location to the Internet and compute estimated arrival
times of these vehicles. The use of web interfaces
has become the standard way to represent real-time
transit data and provide real-time arrival times for
services. Overall this has been perceived by
passengers as an effort by public transportation
agencies to improve quality of service. In the next
section we will discuss some literature on web-based
interfaces to public transportation information.
2.1 Web interfaces for public transport
information
Websites have become essential tools in
delivering real-time transport information for public
transportation agencies. Most transportation agencies
have a web site where users can retrieve real-time,
static information, including route schedules, vehicle
locations, etc. Transit applications can be created as
web applications receiving direct input from users
via web browsers and then query the transportation
agency databases or other sources of information to
generate results. Web applications are under constant
evolution. Over the past few years there are has been
many improvements in client-side web browser
technologies which improve the user interface
experience. AJAX technologies [9] allow users to
dynamically interact with content on the screen to
quickly retrieve and display server-side data within
the browser view itself. These user experiences
enhancements have a great potential to deliver real-
time transport information to users. There is now a
proliferation of web map Applications Programming
Interface (API) [10,11,12] which allow developers to
overlay and combine data from different sources and
make them appear on a top of interactive web-based
maps. Data can be shown as points, such as bus stop
locations, or as lines representing service routes.
Map-based representations can assist in the
visualisation of transportation data. They are
particularly well suited to real-time updates.
Combined with AJAX technologies the user is not
required to interact with the map interfaces to
retrieve updates. These updates to the map content
can happen automatically on the browser. Icons on a
map can represent vehicles and with no action by the
user these icons can automatically move representing
up-to-minute the last current location of vehicle. One
of the first online bus tracking systems, BusView,
was developed by Daniel D. et al [13]. This system
displays real-time vehicle locations on a digital map
for the University of Washington campus
community. The system designed an advanced
graphical transit information system using data from
King Count Metro‟s existing automatic vehicle
location (AVL) system. OneBusAway [14] is a set of
transit tools focused on providing real-time arrival
information on web-based maps and Internet-enabled
mobile devices. This application made use of the
increased availability of powerful mobile devices
and the possibility of displaying transportation data
in machine readable format. The NextBus system
[15] uses GPS technology to deliver real time
transportation information when and where

passengers need it so passengers always know when
the next bus will arrive. Each bus is fitted with a
satellite tracking system. A web based geographic
information system which disseminates the same
schedule information through intuitive GIS
techniques is described in [16]. Using data from
Calgary, Canada, a map based interface has been
created to allow users to see routes, stops and
moving buses all at once. In transportation services
vehicle information can be visualized in an on-line or
off-line environment through tables, maps, data plots
and other graphical outputs. To visualize real-time
information, such as the current/last vehicle location,
time at location, this is integrated with real-time data
sources from the vehicles. In a joint project between
NUI Maynooth and Blackpool Transport [17],
methods are being explored to visualise the
behaviour of vehicles in ways to allow the operator
to better assess and improve the quality of their
services. The system uses off-the-shelf GPS/GPRS
integrated units programmed to transmit location at
regular intervals (45 seconds approximately) while
the vehicles are in motion. The data is stored on a
server and can be visualised through a standard web
browser to provide views representing current
locations of vehicles in close-to-real-time. In
addition tools are provided to visualise vehicle
behaviour over time and to calculate various quality
metrics and summaries. The system uses web
technologies such as JavaScript, MySql, XML, PHP
and AJAX. In addition there is a public interface that
can display and update vehicle locations on maps
based on the mapping provided by Microsoft Virtual
Earth (Bing Maps). The system displays real time
locations of buses pictorially, textually and, using the
facilities provided by the Microsoft Virtual Earth
API, with 2D and 3D map visualizations. The
display shows adherence to the published timetable
through colour coding. In the next section we
provide an overview of the literature related to
mobile interfaces as a means of providing public
transport information.
2.2 Mobile interfaces for public transport
information
Applications can be created for smart mobile
devices for receiving transportation information. For
mobile applications they require the user‟s current
location. Today most smart phones are equipped
with built-in Global Positioning System (GPS)
receivers. This allows for more user-centric and
context-sensitive application development. Mobile
applications can take advantage of knowing the
smartphone user's current location and then provide
information such as the nearest bus stop or the
estimated arrival times for the next bus at that stop.
These applications bring considerable potential for
improvement of the way that people use public
transport systems and access information about the
services. Shwu-Jing et al [19] have developed
location aware mobile transportation information
services with a map database for a public bus
network. Their system provides map-based
information of the nearest Mass Rapid Transit
(MRT) station, the nearest bus stop of the bus route
chosen by the user, and the nearest bus stop of the
bus route that can take the user to their chosen
destination. Maclean et al [20] have shown that a
WAP-enabled cell phone is a suitable device for
receiving real-time transit information. The
development of a transportation vehicle information
system that delivers estimated departure times for a
large transit fleet is described. Here the physical
restrictions of the mobile device were overcome by
using an appropriate user interface design. The main
issues include the small screen space and difficulty
to read small text. The characteristics of the
information delivered by the MyBus prediction
system are better suited to mobile users such as bus
passengers. The overall functionality is to transform
a raw transit agency AVL feed into departure-time
predictions for display on the MyBus website. The
Wireless Markup Language (WML) has been
introduced here as the new language for WAP-
enabled devices. OneBusAway [14] provides a suite
of tools to improve the usability of public transport
information. It provides real-time arrival information
for Seattle-area buses with details about the design
and development of those tools. The main outcomes
of their work were – increasing overall satisfaction
with public transport, decreased waiting time,
increased transit trips per week, increased feeling of
safety, increased distance walked when using transit
resulting in health benefits as well. Transitr is a
transit trip planner (TTP) system from the University
of California, Berkeley [21]. The system provides the
shortest paths between any two points within the
transit network using the real-time information
provided by a third party bus arrival prediction
system relying on GPS equipped transit vehicles.
Users submit their origin and destination points
through a map-based iPhone application or through a
Javascript enabled web browser. The main
functionality provided by the BusCatcher system
described by Bertolotto et al [22] include: display of
maps, overlays of routes plotted on the maps, user
and bus location, and display of bus timetables and
arrival times. Barbeau, J. et al [18,23] have
developed Travel Assistance Device software for
GPS enabled mobile devices. This system shows the
estimated time to arrival of a bus while passengers
are waiting at their bus stop. Additionally, the real-
time vehicle locations are shown on the maps on the
TAD website. Because both of these features are
driven by the GPS location of the cell phone and the
bus the passenger does not have to supply any
additional information such as a bus stop ID or route
number in order to receive information. Turunen et
al [24] present approaches for mobile public

transport information services such as route guidance
and the supply of timetables using speech based
feedback. Bantre et al [25] describes an application
called “UbiBus” which is used to help blind or
visually impaired people to take public transport.
This system allows the user to request in advance the
bus of his choice to stop and to be alerted when the
right bus has arrived. Shalaik et al [5] have shown
that transit information collected in real time can be
shown on freely available mapping services such as
OpenStreetMap (OSM) for tracking and monitoring
purposes. The authors developed an application for
Internet enabled mobile phones to receive real-time
transit information. The system displays the transit
information on an OpenStreetMap (OSM) web
interface and delivers this information on the Google
Android mobile device. Instead of publishing static
information on the Internet the development of
dynamic transit system applications which can be
tailored to mobile devices are rapidly broadening the
scope of public transportation information provision.
The updated sources of real-time services
information, such as feeds from automatic vehicle
location (AVL) systems, can be used to create
applications that inform public transportation users
of the precise location of the transit vehicle they wish
to catch or estimate the arrival times of the next
vehicle at a particular bus stop.
2.3 Quality of Service for public transport
information
Qualities of Service (QoS) indicators are metrics
that are used in evaluating public transit
performance. These provide passengers and
operators a measure of how reliable services are and
help operators to improve schedule adherence and
service efficiency. Similar the regulatory authorities
usually require reporting of QoS metrics to comply
with licensing rules and the conditions for operating
subsidies. QoS is defined as the “overall measured or
perceived performance of a transit service from the
passenger‟s point of view”[41]. With respect to QoS,
frequency of service can be divided into two
categories, high and low depending on the number of
vehicles serving an individual route. For low
frequency routes, defined as those with four or less
vehicles per hour, it is important that the service runs
exactly to the time specified on timetable and QoS is
specified as the mean deviation of buses from their
scheduled time. On high frequency routes (with five
or more buses per hour), passengers tend to arrive at
stops without consulting a timetable because they
expect buses are running at evenly spaced headways.
QoS is measured by calculating the average Excess
Waiting Time (EWT) that passengers have waited
above the theoretical waiting time given by the
service interval.
A standard metric, the Excess Waiting Time (EWT)
is commonly used to measure the quality of service.
It can be defined as the average additional wait
experienced by passengers due to the irregular
spacing of buses or those that failed to run. This
indicator is a key performance indicator since it
denotes how much time the passengers had to
actually wait „in excess of‟ what one would have
expected them to if the service were perfect. AWT is
the average time that passengers actually waited.
SWT is the time a passenger would wait, on average,
if the services ran exactly as planned during the
periods observed. EWT is calculated by subtracting
Scheduled Waiting Time (SWT) from Average
Waiting Time (AWT) and it is used as the measure
of reliability. The greater the EWT is, the less
reliable the service [17].
EWT=AWT-SWT
The system can automatically generate daily,
weekly, monthly and annual reports of EWT for any
stop.
In the next section we will describe our public
transportation information provision model.
3 PUBLIC TRANSPORTATION SYSTEM INTERACTION MODEL
To improve the public transport quality of
service, the passengers must be provided with easy to
use, highly accurate, and reliable information
retrieval system based on their needs. Our public
transportation system interaction model is shown in
Figure 1.
Figure 1: Public transit system interaction model
When using public transportation systems, users
engage in a series of high-level activities that include
planning, waiting, and moving [29]. Web-based
systems for public transportation users are very
popular and are of great importance to help users
plan their travel and trips. The web based system is

provided using a visual map interface displaying
locations of bus stops and additional details about
walk times to bus stops, bus arrival times, etc. The
user interaction with such web-based systems is
straightforward when the user is in front of a
computer at home or in a closed environment. When
the user is on the move and as they walks outdoors
such a web-based desktop orientated model may not
be ideal. In such cases an interaction system
specifically developed for mobile clients is very
important. The mobile interaction model in our
system consists of a number of subsystems. These
interactions between the user and the mobile device
ensure activities for all parts of a user's journey. The
3 main phases in a user's journey include – a) pre-
journey information about bus stop locations and bus
arrival time, b) in-bus information system which
provides assistance about the destination stop (using
alerts/notification systems) to ensure user does not
miss their stop and/or in-bus information about
points of interest along the route if the user is a
tourist and c) The „pedestrian navigation phase‟, to
get to the bus stop from the current user location
and/or get from the destination bus stop to the actual
final user destination (ie a specific shop, tourist
attraction, etc).
Updated sources of real-time services information
generated by automatic vehicle location (AVL)
systems are used to create real-time bus tracking
applications. A spatial database stores the road
network and all the points of interests in the region.
The location of bus stop locations and route
geometries are stored in tables within this spatial
database. A separate table is created in the spatial
database to store the real-time location of the buses
connected using the AVL. This information is used
to provide the user with real-time information about
arrival time and reduces passenger wait time at bus
stops. The users want different kinds of information
presented in different formats in a trip to suit their
needs and the kind of user they are. The user context
is also integrated into the system.
3.1 Pre-journey interaction
At the start of the journey the user needs
information about – which is the ideal bus stop to go
to [27], when does the next bus leave in real-time [5]
and how to get to the nearest bus stop and how long
will it take to get there [4]. In Figure 3, the user‟s
current location is taken to be L and the user‟s actual
destination is set to be D. The expected arrival time
of the next bus at the origin bus stop, Bo is to. The
expected time the bus will reach the desired
destination bus stop (Bd) is td. The time taken to walk
from the user‟s current location (L) to the origin bus
stop (Bo) is two. Based on the time taken to walk to
the bus stop, Bo the user is provided with information
about the bus arrival time and the system advises the
user about the appropriate actions to take. The arrival
time of the bus at the origin bus stop Bo is to. If the
user has a smartphone and is new to a city or is
unaware about the bus stop to go to they can choose
the „point-to-query‟ element of the system where the
user selects the destination and then scans the area to
find the general direction of the bus stop Bo. The
“scan” operation is performed as follows.
Figure 2: The user „scans‟ the area to find the
location of the origin bus stop, Bo
The user holds the phone parallel to the ground and
moving it around them as shown in figure 2. The
compass and the location information via GPS will
help query the system and provide directional
information to the bus stop. This feedback is
provided by textual description with number and
arrival time at the bus stop along with the walking
distance and time taken to reach the bus stop. Haptic
feedback in the form of vibration alarm is used to
provide the user with information of the general
direction of the bus stop when the user points the
smartphone in the direction of the bus stop, Bo. Thus,
this minimises the interaction with the visual
interface while the user walks towards the bus stop
thus ensuring faster travel to the bus stop. The user
gets real-time information about the arrival time of
the ideal bus to take to get to the bus stop Bd which is
nearest to the actual destination (D) of the user. This
sub-system within the public transit system for
mobile provides the user with information about the
bus stops, the arrival time of the bus at the origin bus
stop based on the real-time location of the buses and
also navigation assistance to get from the user‟s
current location (L) to the bus stop Bo.
3.2 In–bus interaction system
HapticTransit is a tactile feedback based
alert/notification model of a system which provides
spatial information to the public transport user [28].
The model uses real-time bus location with other
spatial information to provide user feedback about
the user journey. The system allows users make
better „in-bus‟ use of time. It lets the user be

involved with other activities and not be anxious
about the arrival at the destination bus stop. Our
survey shows a majority of users have missed a bus
stop/station, and thus this system ensures such an
information system can be of great advantage to
certain user groups. The vibration alarm is used to
provide tactile feedback. Visual feedback in the form
of colour coded buttons and textual description is
provided. This model on further research can provide
the platform to develop such information systems for
public transport users with special needs – deaf,
visually impaired and those with poor spatial
abilities.
The HapticTransit system provides assistance to the
user to indicate when their destination bus-stop is
approaching. Instead of providing the user with a
map based system which provides detailed
information which may/may not be of use to the user
instead the users are informed using haptic feedback
when their stop is approaching. This gives them
enough time to prepare to disembark from the bus
[28]. Along with the destination, the user also selects
the information mode – destination only or tourist
mode. This provides additional assistance with
information/alerts about POIs along the way using
haptic/visual feedback. The arrival time prediction
algorithm is used to ensure that the expected arrival
time at their destination bus stop is provided
accurately. There is a broker service running on the
server responsible for calculating the proximity of
the user to their destination bus stop. The visual
interface on the device provides the user with the
time and distance to the destination stop. The system
computes the time and distance to the user's
destination stop and gives a subtle alert to the user
when they are nearing the destination. This alert is
provided by a low frequency vibration feedback. The
alert is triggered when the user reaches the stop just
before the destination stop. This enables the user to
prepare to disembark the bus when the next stop is
reached. The intensity of the vibration alert on the
mobile device increases as the bus is approaching the
desired stop. As an alternative the colour-coded
button on the visual interface provides the user with
information to represent far, close and very close
using the red, amber and green colours. An amber
button displayed indicates that the user is very close
to their destination stop. A red button indicates that
the user has reached the penultimate stop. Green
indicates that the user still has some distance to
travel. The HapticTransit model incorporates
additional feedback along the route to improve the
„in-bus‟ interaction. If the user is a tourist and has
selected the option of being informed when they are
passing or are nearby an important POI along the
way. The user is alerted by a unique vibration
feedback corresponding to being close to a
landmark/POI along the route. Along with haptic
feedback visual feedback with name and description
of the landmark POI is provided. The real-time bus
arrival time algorithm computes the arrival time of
buses at various bus stops [5]. The haptic feedback
ensures that the user is not required to constantly
interact or looking at the mobile device for assistance
during the journey. This allows the user to enjoy the
trip and will be informed about the destination stop
and/or important landmarks along the route.
The model of the route is stored in the spatial
database. Consider a route R is an ordered sequence
of stops {Bo, B0, ..., Bn, Bd}. The destination bus stop
on a route is given by Bd and the terminus or
destination stop is given by Td. Each stop Bi has
attribute information associated with it including:
stop number, stop name, etc. Using the
timetable/real-time bus arrival information for a
given journey Ri along route R, we store the timing
for the bus to reach that stop. The number of minutes
it will take the bus to reach an intermediate stop Bi
after departing from Bo is stored. The actual time of
day that a bus on journey Ri will reach a stop Bi
along a given route R is also stored. Figure 3
illustrates this with a sample route where t0, t1, etc
are time taken to reach stop B1, B2, etc respectively.
Other modes of public transportation including: long
distance coach services, intercity trains, and trams
can be easily incorporated by extending this model.
Figure 3: An example of how a route and the stops
along that route are stored in the spatial database.
3.3 Pedestrian navigation phase
There are two stages in the trip where the user
needs pedestrian navigation assistance. The first
stage is getting from their origin to the origin bus
stop and then from the destination to the actual user
destination. The time taken to travel from user‟s
origin, L to the origin bus stop Bo is two. This is also
shown in Figure 3. The user reaches the destination
bus stop (Bd) in time td. The final phase of travel
using public transport is the pedestrian navigation
stage where the user needs to get from the
destination bus stop to the actual destination (D). The
time taken to travel from the destination bus stop Bd

to the actual destination, D is twd. The user must
specify the requirements of their journey and provide
information about their destination. The user chooses
which mode of pedestrian navigation they want to
use – visual or haptic feedback. Within the haptic
feedback option the user can choose from two
pedestrian navigation system options: the waypoint
by waypoint shortest path information using haptic
feedback (HapticNavigator) or the destination
pointer system where the user is alerted (via
vibration alarm) of the general walking direction of
the destination (HapticDestinationPointer) where the
user has to make decisions on the path to follow [30].
As shown by various authors [31,32,33] haptic
feedback can be used at times when the use of other
senses like hearing or vision is inappropriate. Users
can navigate between any two locations using subtle
haptic feedback [33,34,35,36]. The in-bus journey
time, Tj is the difference between bus arrival time (td)
at the destination bus stop and the bus arrival time
(to) at the origin bus stop and this is represented as,
Tj = td-to. Thus the total trip time, T is the sum of -
the walking time from user‟s origin to the origin bus
stop (two), the in-bus journey time (Tj), and the
walking time between the destination bus stop and
the actual user destination (twd). Thus we represent
the total trip time, T = two+Tj+twd.In the next section
we discuss the system implementation.
4 SYSTEM IMPLEMENTATION
The real-time location data of buses in
Blackpool Transport were used to develop the web
interaction interface and develop the bus arrival time
prediction algorithms. The system uses off-the-shelf
GPS/GPRS integrated units programmed to transmit
location at regular intervals (45 seconds
approximately) while the vehicle is in motion. The
data is stored in a database server and can be
visualised through a standard web browser to show
views representing current locations of vehicles in
close-to-real-time. For implementing our system
using a visual map interface for desktop interaction,
we developed a public interface that can display and
update vehicle locations in Microsoft Virtual Earth
web mapping API. The mapping API provides us
with the functionality to provide 2D and 3D map
visualizations. These visualisations can display bus
vehicle adherence to the published timetable through
colour coding as shown in figure 5. Figure 4a shows
real-time locations of buses pictorially, textually and,
using the facilities provided by the Microsoft Virtual
Earth API. Transit user has options to switch
between bus routes. A list of bus stops allows transit
user to query about the next bus(s) for a stop of
interest. Other options are available for transit users
to allow bus route or stops to be displayed on the
map. Through this interface, transit users can access
many other services such as Trip planning service,
Arrivals Times for all buses or allocate a particular
bus on map. In addition to showing currents location
of buses with real-time information of transit
vehicles, Figure 4b provides transit operator with
options of efficient tools to manage and evaluate
transit vehicles performance. Tools for calculating
QoS and summaries are provided. Bus bunching can
also be detected on map or though the graphical
view. Tools for reporting facilities are provided to
generate on-line or off-line reports. In addition, tools
are provided to visualise vehicle behaviour over time
and to calculate various metrics and summaries. A
PHP script running on the server acts as the broker
service between the server and the client. On the
database server the bus arrival time prediction model
allows the applications to determine, with greater
accuracy, the arrival time of bus at bus stops. This
will reduce the passenger wait time and thus improve
the overall quality of service. The mobile interfaces
for three different kinds of interactions were
developed – 1) displaying real-time public transport
information 2) querying using the pointing gestures
for bus stop location and real-time data and 3)
pedestrian navigation phase during commuting using
public transport. The applications were developed
using the Android SDK. On running the applications,
through the broker service (PHP script), the
application accesses the database with real-time bus
data and bus stop locations and provides the user
with details about expected arrival time, time taken
to walk to destination, the direction of the origin bus
stop etc. To alert the passenger when they reach their
destination, the in-bus haptic enabled mobile
application provides the user with the expected
arrival time at destination. Colour coded buttons
representing distance to destination or haptic
feedback when the user is nearing their destination
provides the user with enough time to get ready to
disembark from the bus. Here if the button colour
changes to red, it shows that the user is at or very
close (within a few metres) from the destination stop.
The green colour button shows that the user is atleast
2 stops away from the destination bus stop while
amber colour button shows that the next bus stop is
the destination bus stop. The user can choose the
„tourist‟ mode to be notified using haptic feedback
when the bus crosses points of interests along the
route. The user can thus mark and identify these
locations for visiting later. The
HapticDestinationPointer integrates the digital
compass and the GPS location in the phone and thus
provides haptic feedback when the user points in the
direction of the destination location.
5 FINDINGS AND REMARKS
To understand how people use public transport,
both within their own city and as a tourist in other
cities where they are not aware of their destination
bus stops, a group of users (50) were sent an online
survey form.
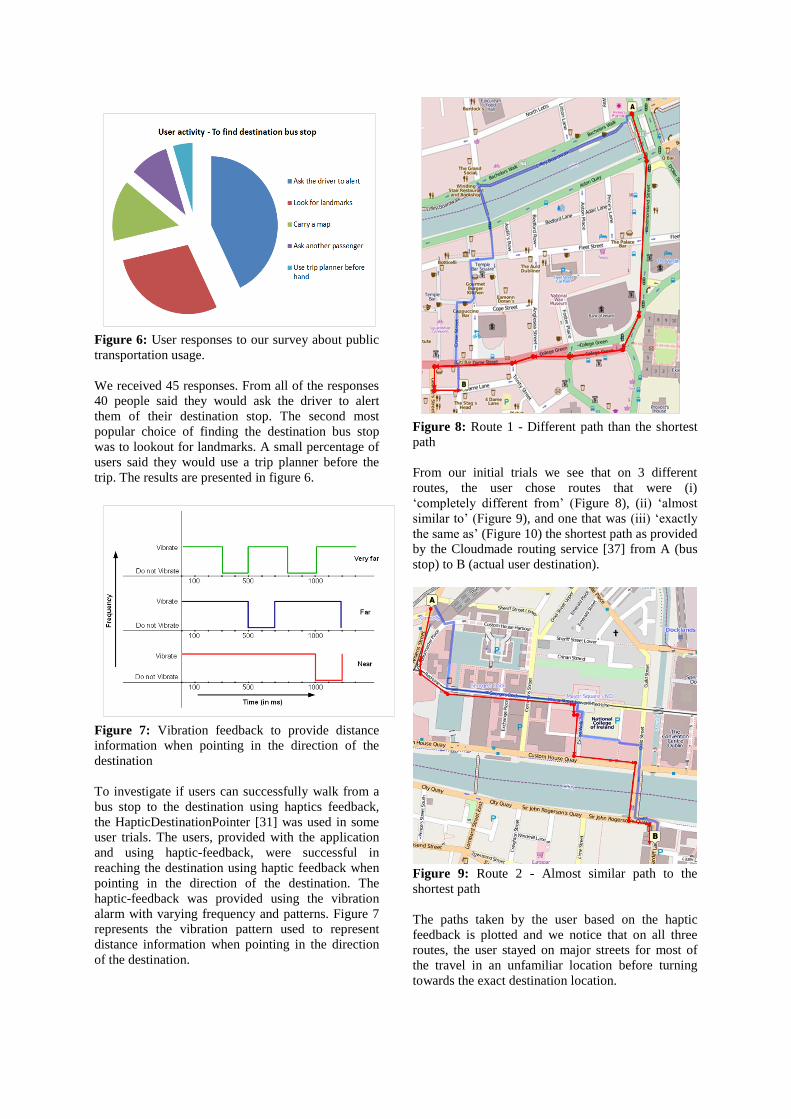
Figure 6: User responses to our survey about public
transportation usage.
We received 45 responses. From all of the responses
40 people said they would ask the driver to alert
them of their destination stop. The second most
popular choice of finding the destination bus stop
was to lookout for landmarks. A small percentage of
users said they would use a trip planner before the
trip. The results are presented in figure 6.
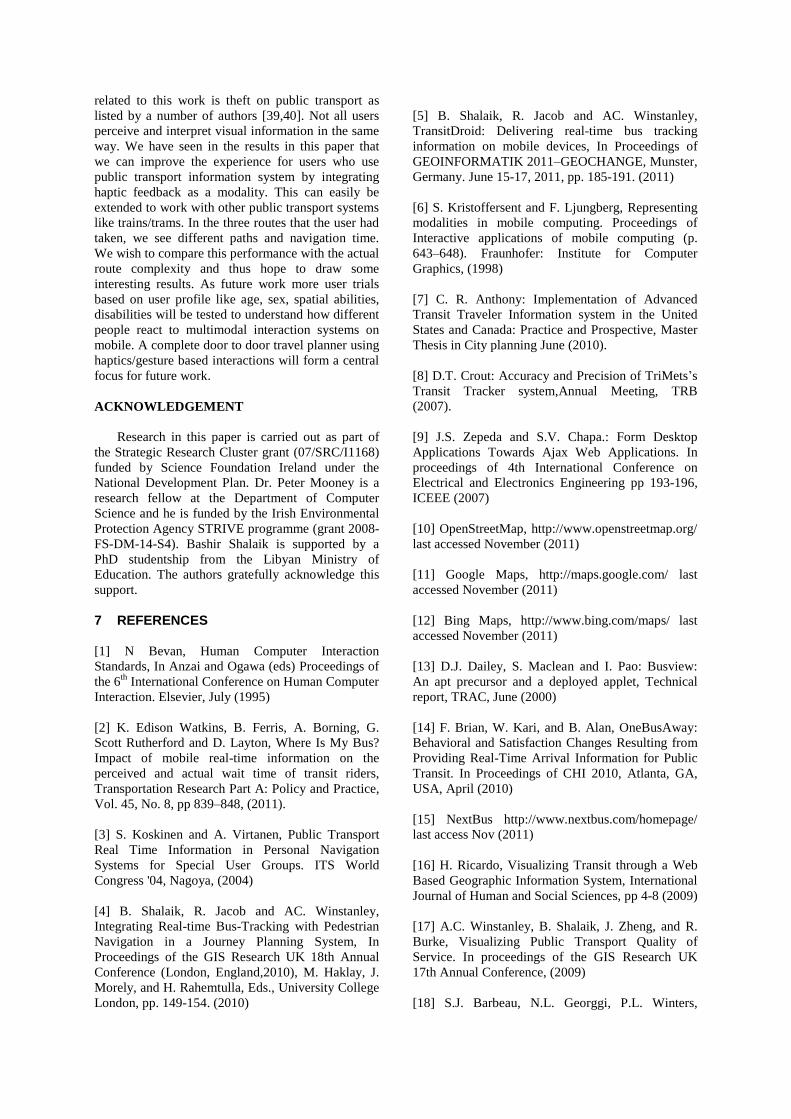
Figure 7: Vibration feedback to provide distance
information when pointing in the direction of the
destination
To investigate if users can successfully walk from a
bus stop to the destination using haptics feedback,
the HapticDestinationPointer [31] was used in some
user trials. The users, provided with the application
and using haptic-feedback, were successful in
reaching the destination using haptic feedback when
pointing in the direction of the destination. The
haptic-feedback was provided using the vibration
alarm with varying frequency and patterns. Figure 7
represents the vibration pattern used to represent
distance information when pointing in the direction
of the destination.
Figure 8: Route 1 - Different path than the shortest
path
From our initial trials we see that on 3 different
routes, the user chose routes that were (i)
„completely different from‟ (Figure 8), (ii) „almost
similar to‟ (Figure 9), and one that was (iii) „exactly
the same as‟ (Figure 10) the shortest path as provided
by the Cloudmade routing service [37] from A (bus
stop) to B (actual user destination).
Figure 9: Route 2 - Almost similar path to the
shortest path
The paths taken by the user based on the haptic
feedback is plotted and we notice that on all three
routes, the user stayed on major streets for most of
the travel in an unfamiliar location before turning
towards the exact destination location.

Figure 10: Route 3- Exactly similar path to the
shortest path
Route 1 as shown in Figure 8 was the most complex
route among the 3 as it was through the most dense
and crowded parts of the city. The time required for
completing route 1 as suggested by the routing
service was 10 minutes and the user reached the
destination in about 12 minutes. According to the
routing service, it would take the user 15 minutes to
complete route 2 (Figure 9), but using haptic
feedback the user completed it in 13 minutes. This
route consisted on long stretches and small bends in
the path. The long stretches allowed the user to move
much faster. The route 3 (as shown in figure 10) was
the simplest route as the actual roads to take were
aligned along the general walking direction and thus
meant the user did not have to change the general
walking direction to reach the destination. Thus the
shortest path and the path taken by the user based on
haptic feedback is the same with no substantial
difference in time taken to complete the task. We
compare the distance travelled and time taken to
travel that distance based on the (i) routing service
and based on (ii) the haptic feedback enabled
navigation test as carried out by the user. The
summary is provided in table 1. We see that although
there isn‟t very significant difference in time
taken/distance travelled to complete the task, the
overall experience while navigating can be improved
using haptics as it ensures heads-up interaction. The
main positive outcomes from these trials are that the
navigation was based on purely the user‟s judgment
and the user was able to walk faster as it involved
heads-up interaction with the real world as compared
to the interaction with the mobile device (for the
shortest path) which normally slows the user down
[30].
Table 1: User navigation performance using haptic
feedback compared to the routing service.
Route
No.
Distance
Travelled
(metres)
Time Taken
(mins)
Routing
Service
Haptics Routing
Service
Haptics
1
2
3
860
1210
720
890
1220
720
10
15
8
12
13
7
6 CONCLUSION AND FUTURE WORK
Public transportation systems are among the
most ubiquitous and complex large-scale systems
found in modern society. There is a need for easy to
use public transit information systems. There are
certain groups of passengers such as the
visually/mobility impaired, people with cognitive
disabilities, senior citizens, and out-of-town visitors
who might not be able to use current types of public
transit information systems. Providing them with
different kinds of interaction based mobile systems
can be useful. We have seen here that haptic
interaction can be useful for out-of-town passengers
and this work can be extended to prepare smart
interfaces to help the mobility impaired. To reduce
the cognitive burden alternate means of information
retrieval and feedback needs to be developed [38].
This paper has given an overview of the interaction
model to access public transit information. The
haptic-feedback based system assists in providing
location based information in a subtle for passengers
using public transport (specifically buses). The main
benefit of this system is that passengers can now use
the system on their mobile devices to reduce the
anxiety about finding the nearest bus stop and the
actual arrival time of buses and if an out-of-town
visitor, missing their destination stops. The vibration
alarm provided by the system helps notify passengers
about the bus approaching their destination bus stop.
The system also provides pedestrian navigational
assistance to help users get from origin to the nearest
bus stop and from the destination bus stop to the
actual user destination. Enhancing the “in-bus”
experience of the user is achieved by reducing
interaction with visual/audio notification interfaces
on the mobile device. The passenger can enjoy the
trip and be involved with other activities while in
transit. Another aspect of public transportation
related to this work is theft on public transport as
listed by a number of authors [39,40]. Not all users
perceive and interpret visual information in the same
way. We have seen in the results in this paper that
we can improve the experience for users who use
public transport information system by integrating
haptic feedback as a modality. This can easily be
extended to work with other public transport systems
like trains/trams. In the three routes that the user had
taken, we see different paths and navigation time.
We wish to compare this performance with the actual
route complexity and thus hope to draw some
interesting results. As future work more user trials
based on user profile like age, sex, spatial abilities,
disabilities will be tested to understand how different
people react to multimodal interaction systems on
mobile. A complete door to door travel planner using
haptics/gesture based interactions will form a central
focus for future work.
ACKNOWLEDGEMENT
Research in this paper is carried out as part of
the Strategic Research Cluster grant (07/SRC/I1168)
funded by Science Foundation Ireland under the
National Development Plan. Dr. Peter Mooney is a
research fellow at the Department of Computer
Science and he is funded by the Irish Environmental
Protection Agency STRIVE programme (grant 2008-
FS-DM-14-S4). Bashir Shalaik is supported by a
PhD studentship from the Libyan Ministry of
Education. The authors gratefully acknowledge this
support.
7 REFERENCES
[1] N Bevan, Human Computer Interaction
Standards, In Anzai and Ogawa (eds) Proceedings of
the 6th
International Conference on Human Computer
Interaction. Elsevier, July (1995)
[2] K. Edison Watkins, B. Ferris, A. Borning, G.
Scott Rutherford and D. Layton, Where Is My Bus?
Impact of mobile real-time information on the
perceived and actual wait time of transit riders,
Transportation Research Part A: Policy and Practice,
Vol. 45, No. 8, pp 839–848, (2011).
[3] S. Koskinen and A. Virtanen, Public Transport
Real Time Information in Personal Navigation
Systems for Special User Groups. ITS World
Congress '04, Nagoya, (2004)
[4] B. Shalaik, R. Jacob and AC. Winstanley,
Integrating Real-time Bus-Tracking with Pedestrian
Navigation in a Journey Planning System, In
Proceedings of the GIS Research UK 18th Annual
Conference (London, England,2010), M. Haklay, J.
Morely, and H. Rahemtulla, Eds., University College
London, pp. 149-154. (2010)
[5] B. Shalaik, R. Jacob and AC. Winstanley,
TransitDroid: Delivering real-time bus tracking
information on mobile devices, In Proceedings of
GEOINFORMATIK 2011–GEOCHANGE, Munster,
Germany. June 15-17, 2011, pp. 185-191. (2011)
[6] S. Kristoffersent and F. Ljungberg, Representing
modalities in mobile computing. Proceedings of
Interactive applications of mobile computing (p.
643–648). Fraunhofer: Institute for Computer
Graphics, (1998)
[7] C. R. Anthony: Implementation of Advanced
Transit Traveler Information system in the United
States and Canada: Practice and Prospective, Master
Thesis in City planning June (2010).
[8] D.T. Crout: Accuracy and Precision of TriMets‟s
Transit Tracker system,Annual Meeting, TRB
(2007).
[9] J.S. Zepeda and S.V. Chapa.: Form Desktop
Applications Towards Ajax Web Applications. In
proceedings of 4th International Conference on
Electrical and Electronics Engineering pp 193-196,
ICEEE (2007)
[10] OpenStreetMap, http://www.openstreetmap.org/
last accessed November (2011)
[11] Google Maps, http://maps.google.com/ last
accessed November (2011)
[12] Bing Maps, http://www.bing.com/maps/ last
accessed November (2011)
[13] D.J. Dailey, S. Maclean and I. Pao: Busview:
An apt precursor and a deployed applet, Technical
report, TRAC, June (2000)
[14] F. Brian, W. Kari, and B. Alan, OneBusAway:
Behavioral and Satisfaction Changes Resulting from
Providing Real-Time Arrival Information for Public
Transit. In Proceedings of CHI 2010, Atlanta, GA,
USA, April (2010)
[15] NextBus http://www.nextbus.com/homepage/
last access Nov (2011)
[16] H. Ricardo, Visualizing Transit through a Web
Based Geographic Information System, International
Journal of Human and Social Sciences, pp 4-8 (2009)
[17] A.C. Winstanley, B. Shalaik, J. Zheng, and R.
Burke, Visualizing Public Transport Quality of
Service. In proceedings of the GIS Research UK
17th Annual Conference, (2009)
[18] S.J. Barbeau, N.L. Georggi, P.L. Winters,

Integration of GPS-enabled Mobile Phones and AVL
– Personalized Real-time transit navigation
information on your phone, Technical report, Nov
(2009)
[19] S.J. Chang, G.Y. Hsu, and S.J. Huang, Location
–a ware mobile Transportation information service.
In proceedings of Mobile Technology, Applications
and Systems, 2005 2nd International Conference pp
5 Nov. (2005)
[20] S.D Maclean and D.J. Daily, “The use of
Wireless Internet Services to Access Real-Time
Transit Information”, in the proceedings of IEEE
Intelligent Transportation Systems Conferences,
USA (2001).
[21] J. Jerald, D. B. Work, B. Kerkez, Sengupta,
A.M. Bayen, and S. Glaser, Mobile Transit Trip
Planning with Real–Time Data. In processdings of
Transportation Research Board 89th Annual Meeting
Jan (2010)
[22] M. Bertolotto, G. O'Hare, R. Strahan, A.
Brophy, A. Martin, E. Mcloughlin, Bus Catcher: a
Context Sensitive Prototype System for Public
Transportation Users, Proceedings Second
International Workshop on Web and Wireless
Geographical Information Systems (W2GIS), (2002)
[23] S.J. Barbeau, P.L Winters, N.L. Georggi, and
M.A. Labrador, and R. Perez, Travel assistance
device: utilising global positioning system-enabled
mobile phones to aid transit riders with special
needs, Intelligent Transport Systems, IET,2010, Vol.
4, No. 1, pp 12-23, (2010)
[24] M.Turunen, T. Hurtig, J. Hakulinen, A.
Virtanen, and S. Koskinen, Mobile Speech-based and
Multimodal Public Transport Information Services.
In proceedings of MobileHCI 2006 Workshop on
Speech in Mobile and Pervasive Environments.
(2006)
[25] M. Bantre, P. Couderc, J. Pauty, M. Becus,
Ubibus: Ubiquitous computing to help blind people
in public transport. In S. Brewster and M. Dunlop,
editors, Mobile Human Computer Interaction
MobileHCI 2004, volume 3160 of Lecture Notes in
Computer Science, pages 535–537. Springer Berlin /
Heidelberg, (2004)
[26] C.L. Schweiger, Methods of rider
communication, United States. Federal Transit
Administration, Transit Cooperative Research
Program, Transit Development Corporation,
National Research Council (U.S.) (2006)
[27] B. Shalaik, R. Jacob, and A.C. Winstanley,
Smart mobile devices for extracting real-time transit
information, In proceedings of 8th International
Symposium on Location-Based Services &
Telecartography, Vienna, Austria, 21-23 November
(2011)
[28] R. Jacob, P. Mooney, B. Shalaik, and A.C.
Winstanley, HapticTransit: Tactile feedback to notify
public transport users, International Journal of
Digital Information and Wireless Communication
(IJDIWC) 1(3): 238-252, The Society of Digital
Information and Wireless Communications, (2011)
[29] G. Fischer and J. F. Sullivan, Human-Centered
Public Transportation Systems for Persons with
Cognitive Disabilities - Challenges and Insights for
Participatory Design, In proceedings of 7th
Participatory Design Conference, pp 194-198, (2002)
[30] R. Jacob, P. Mooney, A.C. Winstanley, Guided
by touch: Tactile pedestrian navigation, 1st Mobile
Location Based Services (MLBS) Workshop in
conjunction with the 13th ACM International
Conference on Ubiquitous Computing, Beijing,
China, (2011)
[31] M. Srikulwong, and E. O‟Neill, Tactile
representation of landmark types for pedestrian
navigation: user survey and experimental evaluation,
HCI 2010: In Workshop on Using audio and haptics
for delivering spatial information via mobile devices,
pp 19-22, (2010)
[32] R. Jacobson. Representing spatial information
through multimodal interfaces. In Information
Visualisation, 2002. Proceedings. Sixth International
Conference on, pages 730--734, (2002)
[33] M. Pielot and S. Boll. Tactile wayfinder:
Comparison of tactile waypoint navigation with
commercial pedestrian navigation systems. 6030:76--
93, (2010)
[34] S. Robinson, M. Jones, P. Eslambolchilar, R.
Murray-Smith, and M. Lindborg, "I did it my way":
moving away from the tyranny of turn-by-turn
pedestrian navigation, Proceedings of the 12th
international conference on Human computer
interaction with mobile devices and services,
September 07-10, (2010)
[35] R. Jacob, P. Mooney, P. Corcoran, and A.C.
Winstanley, Haptic-GIS: Exploring the possibilities,
ACM SIGSPATIAL Special, Volume 2, Number 3,
November 2010. pp. 16-21, (2010)
[36] J. S. Zelek. Seeing by touch (haptics) for
wayfinding. International Congress Series,
1282:1108--1112, April, (2005)
[37] Cloudmade, http://cloudmade.com/, last

accessed - November, (2011)
[38] Carmien, S., Dawe, M., Fischer, G., Gorman,
A., Kintsch, A., Sullivan, J., James, F.: Socio-
technical environments supporting people with
cognitive disabilities using public transportation.
ACM Transaction. Computer-Human Interactaction,
12:233–262, June (2005)
[39] Parisians Told to Hold IPhones Tight After
Thefts on Subways:
http://www.businessweek.com/news/2011-01-
11/parisians-told-to-hold-iphones-tight-afterthefts-
on-subways.html Last accessed - November (2011)
[40] City of London Police, Keep smartphone out of
sight -
http://www1.cityoflondon.gov.uk/CityPolice/Media/
News/16082011smartphonetheftvictimwarns.htm
Last accessed - November (2011)
[41] P.E. Okunieff, Synthesis of Transit Practice 24,
AVL Systems for Bus Transit, Transportation
Research Board, (1997)
[42] D. Kellogg, Average U.S. Smartphone Data
Usage Up 89% as Cost per MB Goes Down 46%,
Telecom Research & Insights, Nielsen, (2011)
Figure 4a: The Public interface showing updating textual display plus moving locations on Microsoft Virtual
Earth.

Figure 4b: The operator interface showing updating textual display plus moving locations on Microsoft Virtual
Earth.
Figure 5: Route diagram visualization (colours indicating adherence to timetable)