using indicators to assess evolving industry-science ... · using indicators to assess evolving...
TRANSCRIPT

0
Using Indicators to Assess EvolvingIndustry-Science Relationships
Presented at:Joint German-OECD Conference
Benchmarking Industry-Science Relationships
Hotel Maritim pro Arte, Berlin, Germany
Presented by:Diana Hicks
CHI Research, Inc.
10 White Horse Pike, Haddon Heights, NJ, USATel.: 856.546.0600 Fax: 856.546.9633
E-mail: [email protected]
October 16-17, 2000

1
Outline
§ The knowledge economy emerges in patterns of patenting
§ Networked science and technology and its quality
§ Linkage between science and technology visible in patentreferences
§ Pulling it all together - the public/private sector roles in 1organization’s science & technology networks

2
Patterns of Patenting and theKnowledge Economy
§ Growth in information and health technology patenting
§ Growth in patenting from the West Coast
§ Growth in university patenting/company publishing

3
Patenting in Information and HealthTechnology Grows Strongly
1,000
10,000
100,000
80 81 82 83 84 85 86 87 88 89 90 91 92 93 94 95 96 97 98 99
Health
IT
All other
All Other
Information Technology
Health
Number of patents (logarithmic scale)

4
Patenting From the Pacific RegionOvertakes the Largest East Coast Regions
0
2
4
6
8
10
12
14
16
1983 1984 1985 1986 1987 1988 1989 1990 1991 1992 1993 1994 1995 1996 1997
East North CentralMiddle AtlanticPacific
Pacific
Number of patents/1,000
East North Central = Illinois, Indiana, Michigan, Ohio, WisconsonMiddle Atlantic = New Jersey, New York, PennsylvaniaPacific = California, Nevada, Oregon, Washington

5
University Patenting Rises
10
100
1,000
10,000
100,000
1980 1985 1990 1995
GovernmentIndustryUniversities
Logrithmic scale
Number of patents
0% 5% 10% 15% 20%
InformationTechnology
Other
Health
Alltechnologies
University share of total patenting in 1999

6
Citations per University Patent Declines
0.5
0.6
0.7
0.8
0.9
1.0
1.1
1.2
1.3
1.4
1.5
1985 1992 1999
GovernmentIndustryUniversities
Current Impact Index = Citations to patents in last five years divided by same for all patents

7
Companies Publish More Papers ThatAre Very Highly Cited
0
20
40
60
80
100
120
140
160
180
200
1981 1982 1983 1984 1985 1986 1987 1988 1989 1990 1991
1,000 published in each year (excluding review papers)
Number of papers listing a U.S. company address among the most cited

8
Networking
§ Growth in collaborative patenting
§ Growth in collaborative publishing
§ Collaborative papers are of higher quality, patents are not.
§ Does the university agenda shift?

9
Co-patenting Increases, ThoughIt Is Still Rare
0
100
200
300
400
500
600
700
800
900
80 81 82 83 84 85 86 87 88 89 90 91 92 93 94 95 96 97 98 99
Public sector
Public-private
Private
0.3%
1.3% of total*
* %of total U.S.-invented, assigned, USPTO patentsU.S.-invented, individual patenters and parent-subsidiary excluded
Number of coassigned patents

10
Co-assigned Patents Are Not Highly Cited
§ Current Impact Index (CII)
§ The number of times the last 5 years of patents are citedin 1999, relative to all patents in the U.S. system:
– 1.00 for All Patents
– 1.24 for All Assigned, US-invented
– 1.07 for All Co-assigned, US-invented

11
University-industry Collaboration Grows
6,129
8,604
0
1,000
2,000
3,000
4,000
5,000
6,000
7,000
8,000
9,000
10,000
88 89 90 91 92 93 94 95 96 97
31%
44%
4% 6%0%
10%
20%
30%
40%
50%
88 89 90 91 92 93 94 95 96 97
Share of industry papers
Share of university papers
Number of university-industrycollaborative papers
University-industry collaboration -percentage of sector papers

12
Average citations per paper
5.4 5.6 5.8 6.0 6.2 6.4
SingleUniversity
More than 1University
University-Industry
Papers in the most cited 1000 papers (per 1000 published)
0 1 2 3 4
SingleUniversity
More than1
University
University-Industry
University-industry Collaborative PapersAre Well Cited
1981-1992, 4 year lagged window

13
When Collaborating With Industry, UniversityResearch Becomes More Applied
4 3 2 1
0% 10% 20% 30% 40% 50% 60% 70% 80% 90% 100%
Single university
University-Industrycollaboration
Single company
More basic ------------------------------------------------------------------> More applied
Percentage of papers 1981-95 from U.S. institutions by research level
Level 4 is most basic and level 1 is most applied

14
Science Linkage
§ The references made in U.S. patents to the scientificliterature.– References from the front page of patents to journal
articles.
§ The increase in science linkage has made visible therelevance of science to technological innovation
§ Linkage to science is a visible link between corporatetechnology and the public sector
§ Highly cited science is preferentially cited in patents
§ Local science is preferentially cited.

15
United States Patent 4,713,814
[Inventors] Andrusch et al. (Germany) Dec. 15, 1987 [Assignee] IBM (Armonk, NY)
STABILITY TESTING OF SEMICONDUCTOR MEMORIES
References Cited: U.S. PATENT DOCUMENTS
Firms Inventors
3,995,215 11/1976 IBM Chu et al. ....324/158 4,004,222 1/1977 Semi Corp. Gebhard .......324/158 4,418,403 11/1983 Mostek Corp. O'Toole et al. ....365/201 4,430,735 2/1984 Burroughs Corp. Catiller ...........371/25 4,502,140 2/1985 Mostek Corp. Prochsting .........371/21 4,503,538 3/1985 Robert Bosch GmbH Fritz ..............371/21
OTHER REFERENCES CITED
Wiedmann, IEEE Journal of Solid-State Circuits, Vol. SC-19, no. 3, pp. 282-290, Jun. 1984.
These Citations Link This Patent With Earlier U.S.
Patents
These Citations
Link This Patent to Science
Extract from the Front Page ofa U.S. Patent

16
The Amount of Science Cited in U.S. PatentsQuadrupled Between 1994 and 1998
Number of references on U.S. patents to the U.S. scientific and technical literature
0
20,000
40,000
60,000
80,000
100,000
120,000
1987 1988 1989 1990 1991 1992 1993 1994 1995 1996 1997 1998
Source: Science & Engineering Indicators and CHI Research, Inc.

17
Science Linkage is Increasing inMany Countries
0.0
0.5
1.0
1.5
2.0
2.5
3.0
3.5
4.0
1987 1988 1989 1990 1991 1992 1993 1994 1995 1996 1997 1998 1999
Israel
US
UK
France
Germany
Japan
Australia
Canada
3 year moving averagesU.S. excludes individual inventors
Science References per U.S. Patent

18
Excluding Biotechnology - Science Linkageis Increasing in Many Countries
0.0
0.2
0.4
0.6
0.8
1.0
1.2
1.4
1.6
1.8
2.0
1987 1988 1989 1990 1991 1992 1993 1994 1995 1996 1997 1998 1999
Science References per Patent with Biotechnology ExcludedU.S.
Israel
U.K.
Canada
AustraliaFrance
Germany
Japan
3 year moving averages
U.S. excludes individual inventorsPatents in pharmaceuticals, biotechnology and agriculture are excluded

19
The Science Base of U.S.-Invented Patents ComesIncreasingly from the Public Sector
Source: Science & Engineering Indicators and CHI Research, Inc.
% of references on U.S. patents to U.S. scientific literature
1998
University
Non-Profit
Government
Industry
University Industry Government Non-Profit
54
19
13
13 7480
0
20
40
60
80
100
1988 1998
Public Sector
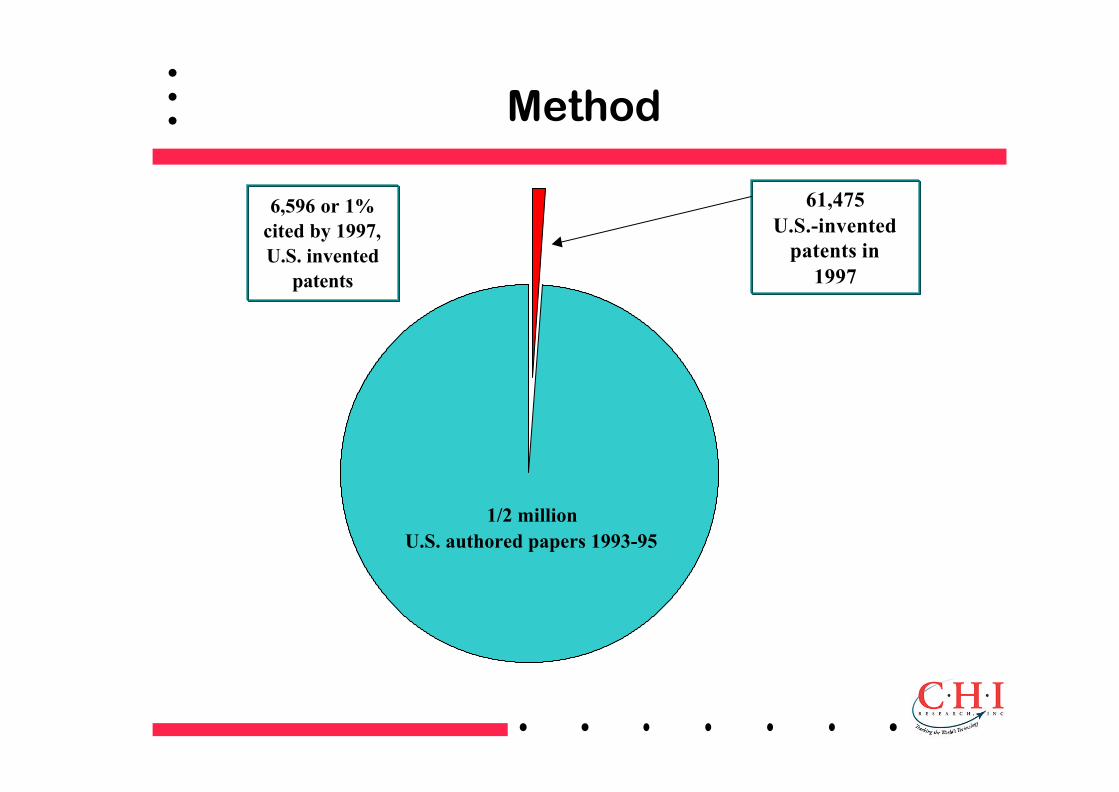
Method
1/2 million U.S. authored papers 1993-95
6,596 or 1% cited by 1997, U.S. invented
patents
61,475U.S.-invented
patents in1997

21
Highly Cited Papers Are Much More Likelyto Be Cited in Patents
10% of Top1%
61,475 U.S.inventedpatents in
1997
Science Citation StrataShare Cited in Patents
3% of Top 2-10%
1% of Top 11-50%
0.4% of Bottom half
22
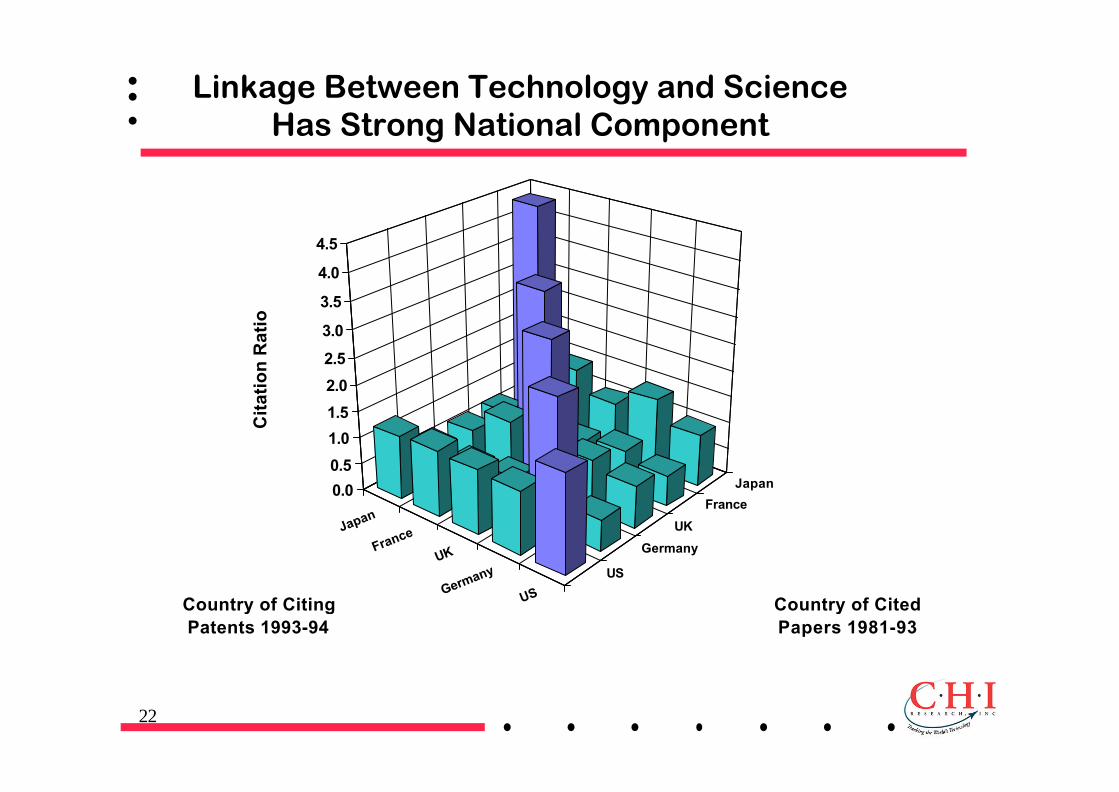
Linkage Between Technology and ScienceHas Strong National Component
US
Germany
UK
France
Japan
US Germany
UK France Japan
0.0
0.5
1.0
1.5
2.0
2.5
3.0
3.5
4.0
4.5C
itat
ion
Rat
io
Country of Cited Papers 1981-93
Country of Citing Patents 1993-94

23
One Organization's network
§ CHI deals with eight of ten possible bibliometric citationand collaboration, publishing and patenting indicators
§ These dimensions map out various combinations:– science/ technology/ science-technology links– co-producing/ “using” / “providing”
§ Together they map out the visible part of an organization'sscience and technology network

24
360 Degree Analysis
Whose paperscite X’spapers?
Whosepatentscite X’spapers?
Whosepatents citeX’s patents?
With whomdoes X
copatent?
Whosepapers
does X citein its
patents?
Whosepatents does
X cite?
X’spapers
With whomdoes X
coauthor?
Whosepapers does
X cite?
X’spatents
Note: Papers Patent cites not included

25
Public/private Composition of Chiron’sInnovation Network
Papers citingChiron’s papers
Patents citingChiron papers
Patents citingChiron patents
copatenters
Papers cited inChiron patents
Patents cited inChiron patents
Chiron’spaperscoauthors
Papers cited inChiron papers
Chiron’spatents
Private sector
Public sector
Pies display the numberof public & privatesector institutions
among the 100 mostlinked institutions in any
dimension.

26
Summary
§ The knowledge economy has changed U.S. science andtechnology and public/private roles:– rapid growth in information and health technology
patenting– shift to West Coast– increased participation of universities in technology
and companies in science– more collaborative technology and science– growth in links between science and technology visible
in patent referencing
§ An organization’s position the science and technologynetwork can be mapped and the balance of itsprivate/public linkages revealed.