using kaizen events to produce short bursts of improvement ... · pdf fileusing kaizen events...
TRANSCRIPT

Using Kaizen Events to Produce Short Bursts of Improvement that is Easily Sustained
Mary Ann Womack, MBA (ASCP) SBB
Process Improvement Manager Certified Lean Sigma Green Belt
1

2

Objectives Implementing Lean Six Sigma in the Clinical
Microbiology Laboratory for improved cost savings with increased clinical delivery demands
Implementing change quickly and with minimal costs, using a Kaizen model
Centralizing of key processes without reduction in service
Survival in ‘ACO mandated cut’ environment
3

Common Denominator How do hospital and lab administration manage with
decreasing budgets and revenue? Employ Lean Six Sigma Focus on cost savings with improved efficiencies Make changes quickly with minimal costs
Strategy at Florida Hospital withACO Mandated Cuts Ratchet down costs Insurance companies going to a DRG model Decreased utilization (cost avoidance) Avoid penalties through HCAAPS
4

Florida Hospital Background Centralized Microbiology from 7 campuses to 1 core
lab: Before: campuses streaked plates and sent plates and
specimens to Orlando Microbiology Now: campuses send specimens only to Orlando Micro
Only rapid tests and stat gram stains are done at the campuses
Campuses pre-sort when sending batches by eswabs/urines/blood cultures
Implemented boric acid tubes for all Urine C&Ss
5

Why Change? Staffing
It take 1 year to begin to understand Micro It takes 5 years to have an understanding of Micro “Seasoned” staff is heading towards retirement
Timely Resulting Infectious Disease Physicians to act on results The hospital wants to move patients out of rooms;
Reduce LOS, thus reduce costs to the hospital
6

2010 - 2012
7

Test Volume
Percent Cum %
21 18 14 13 9 4 4 4 3 2 2 2 5 21 38 52 65 74 78 82 85 89 91 93 95 100
70000 100
60000
50000
40000
30000
20000
10000
0
80
60
40
20
0
Perc
ent
Florida Hospital Micro Test Volume - Specimen Family
0 Lab
Percent Cum %
ORL EO ALT FPL WPK CH KSM APK Other 32.3 14.3 13.8 11.7 11.5 6.5 5.8 3.3 0.9 32.3 46.6 60.4 72.1 83.6 90.0 95.8 99.1 100.0
70000 100
60000
50000
40000
30000 40
20000
10000
80
60
20
0
Perc
ent
Florida Hospital Micro Test Volume by Lab
Outreach
CURRENT STATE
Understand what to address 1st
8

Florida Hosp Micro - Urine Value Stream
Sunquest
ORL & Outreach Label & Plate
Incubate Bench Prelim Report
ID-AST Vitek2
Final Report
Physician Order
0.3-1.6hrs 0.6-3.2hrs
Positive Turn-Around Time Median = 47 Hours, typically 41-58 Hours for Positives
Receive at Core Micro Collect
Receive at Satellite
Lab
Satellites Label & Plate
ORL Specimen Receiving
Cerner Mil
• Understand the Value Stream • Identify where the “waste” is and where the opportunities are
9

History of Performance
TAT (Hours) 2010 Jan-Feb 2013
Positives
Median 47 39
Q3 58 48
Negatives
Median 23
Q3 25
10
Turn Around Time – Receive to Final

Positive Urine – Turn Around Time (Hours)
210 180 90 120 150 TAT - Receive to Final
60 30 0
900
800
700
600
500
400
300
200
100
0
Freq
uenc
y
Florida Hospital - Positive Urine TAT
47 hr Median 25% greater than 58hrs
1St Opportunity: 10-15 hour difference between peaks seems to be driven by the 9 to 9 MST cut-off for plate reading
schedule.
2 3 4 5 6 7 8 9 10 11 12 13 14 15 16 17 18 19 20 21 22 23
Result Hour
70
60
50
40
30
20
Mea
n
51.13
40.66
61.60
Positive Urine TAT - by Final Resulting Hour
Alpha = 0.05
55 hrs
33 hrs
45 hrs
11
98 84 42 56 70 TAT Receive to Result
28 14
1400
1200
1000
800
600
400
200
0
Freq
uenc
y
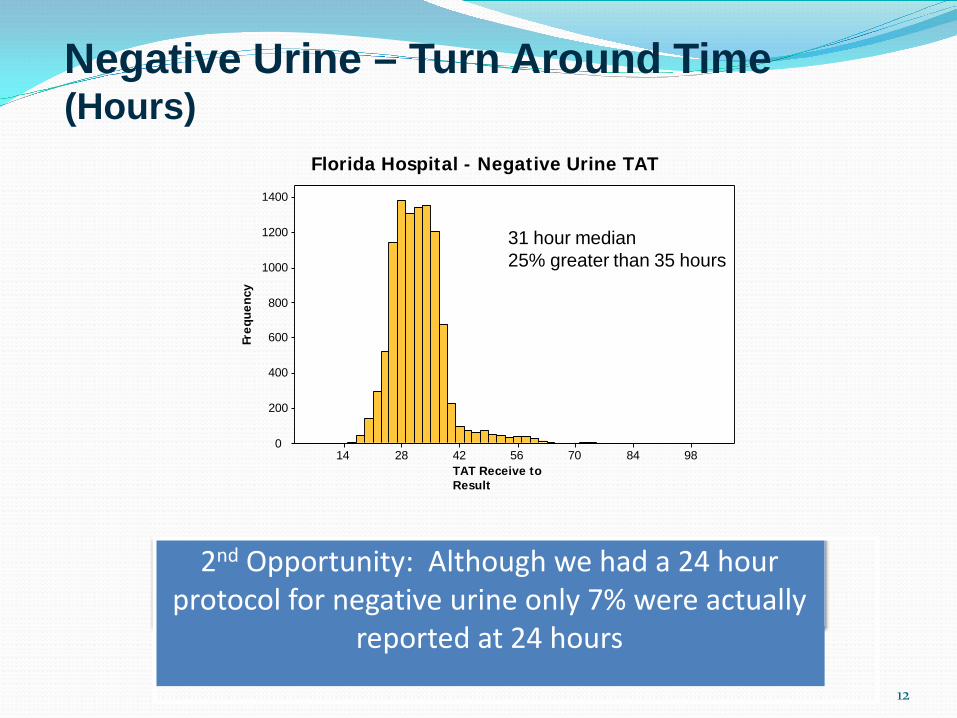
Florida Hospital - Negative Urine TAT
31 hour median 25% greater than 35 hours
Negative Urine – Turn Around Time (Hours)
2nd Opportunity: Although we had a 24 hour protocol for negative urine only 7% were actually
reported at 24 hours
12

Other Waste Opportunities
Implement standardized container. Reduce pour-offs & contamination. (Note that the ~30% positive rate seems low, but there may be approximately 30% “mixed” as well)
Multiple sorting of plates: 1) pos/neg and Mixed 2) Resort positives by G+/G-/PYR/TYR –
Delays in Flow
As much as 3 hours delay in getting plates to the incubator
Negative cultures wait to be resulted until positives completed
Vitek 2 batched and wait for available resource
Account for all specimens on inactivity list and overdue log (avoids 40 hrs/month)
13

Technical/Processor Capacity Utilization
45-50% of time in micro lab is on technical task, 27% transport/motion, 23% admin
Opportunity to leverage cellular processing, new layout, daily management, and
schedule changes to improve the Ratio
Administration: •Data keying •Paper work •Labeling •Calls •Log books •Validating WIP
Other Activity •QC •Transportation •Receive/Unpack •Waiting •Searching
44%
23%
14%
13% 6%
Technical
Administration
Transport
Motion
Other
14

Resources External Consultants
“Fresh eyes” approach Bring experiences from other facilities
Internal Consultants Formal DMAIC project on blood Microbiology Workflow PI Project
Laboratory Process Improvement Manager
15

IMPLEMENT ISOLA (DEC)
URINES AT ORLANDO ON
ISOLA (JAN)
URINES FROM CAMPUSES SETUP
ON ISOLA (FEB)
OTHER CULTURES AT ORLANDO ON
ISOLA (MARCH)
OTHER CULTURES FROM CAMPUSES SETUP ON ISOLA (MARCH/APRIL)
ALL CAMPUSES PHASE I: ISOLA IMPLEMENTATION WITH ALL CULTURES (2013)
16

DEVELOP PROCESS/WORKFLOW
(MAY)
DEVELOP LAYOUT OF DEPARTMENT (APRIL/MAY)
DEVELOP TRAINING PLAN FOR READING
OF ALL CULTURES/ALL STAFF (MAY)
CONSTRUCTION PROJECT
(MAY/SEPT)
IMPLEMENT TRAINING PLAN
(MAY/SEPT)
DEPLOY OVERALL PLAN
(SEPT/DEC)
ORLANDO MICRO PHASE II: NEW PROCESS IMPLEMENTATION (2013)
17

18
Microbiology: How it Looks Today

Challenges in Micro - Orlando
Cross train all staff to “read” plates on all shifts Reading on one shift is no longer sufficient Low employee satisfaction Shortage of qualified technologists, high turnover Retirement of “seasoned” techs in the next 5 years Limited space, crowded, 35+ years old Staffing mismatched with incoming workload
19

Solutions Brought in outside consultants to assist with Kaizen
process improvement projects Assessment: 10/12
Review current process; Kaizen event (05/13), ongoing continuous improvement
Implement new technology with process change, 03/13 Plan a space redesign, 5/13 Scheduling to match staff to workflow -ongoing
20

May 2013
21

Implementing Technology Previ – Isola 40%
reduction in time to plate
Consistency in plating
2nd Isola installed 06/13 (Plan B)
22

Kaizen – Rapid Improvement
Standardize & Monitor Presentation
Implementation Create Improvement Plan
Analyze the Process Observe the Process
Set Objectives & Goal Create a Team
Select Target Process

Pre-Kaizen Urine Process Map
24
Total Number of Steps: 56

Enlisting Help – Robotic Delivery

Arrival Pattern - Hour
26
0%
1%
2%
3%
4%
5%
6%
7%
8%
- 1 2 3 4 5 6 7 8 9 10 11 12 13 14 15 16 17 18 19 20 21 22 23
37%
21%
31%
11%

Hood
Hood
Hood
Specimen Flow
Blood Urine
Large spread to the layout drives waste of transportation and motion. Also makes visual management more challenging.
Blood bench Micro Receive/Set-up
27

Post Kaizen Urine Process Map
28
Total Number of Steps: 34 - 40%

Future State - Concept
29
Hour Total Avg / Day Received % +18 hrs New Batches Racks
0 539 12 3% 12
3rd
Shift
Te
chno
logi
st
1 505 11 3% 13 2 429 10 3% 10 3 400 9 2% 12 52 2.0 4 388 9 2% 17 5 401 9 2% 16 6 520 12 3% 16 46 1.8
1st S
hift
Tech
nolo
gist
7 578 13 4% 19 8 452 10 3% 19 9 556 12 3% 17 55 2.1 10 761 17 5% 18 11 732 16 4% 20 12 741 16 4% 20 56 2.1 13 866 19 5% 20 14 850 19 5% 21 15 784 17 5% 25 61 2.4
2nd
Shift
Tec
hnol
ogis
t
16 820 18 5% 17 17 894 20 5% 14 18 901 20 5% 12 55 2.1 19 915 20 6% 11 20 951 21 6% 10 21 1,106 25 7% 9 22 751 17 5% 9 42 1.6 23 636 14 4% 9
Grand Total 16,476 366 366
Daily cycles

New Batch Process
New Urine Culture Processing
Day 0
Set-Up Time Plate Rack Color
04:00-08:59 09:00-11:59 12:00-14:59 13:00-17:59 18:00-20:59 21:00-23:59 0:00-03:49
Day 1 Urine Culture Pull from Incubator Read
Read Time Plate Rack Color Too
Young/Further Workup
Final ID/Sens Ready Cath Urine 48 hold
3:00 3:00 3:00 3:00 6:00 6:00 6:00 6:00 9:00 9:00 9:00 9:00
12:00 12:00 12:00 12:00 15:00 15:00 15:00 15:00 18:00 18:00 18:00 18:00 22:00 22:00 22:00 22:00
Day 1+ Urine Culture Placement for Incubation Place in Labeled Containers (Empty)
Set-Up Time Too
Young/Further Workup
Final ID/Sens Ready Cath Urine 48 hold
3:00 12:00 18:00 3:00 6:00 15:00 22:00 6:00 9:00 18:00 3:00 9:00
12:00 22:00 6:00 12:00 15:00 3:00 9:00 15:00 18:00 6:00 12:00 18:00 22:00 9:00 15:00 22:00 30
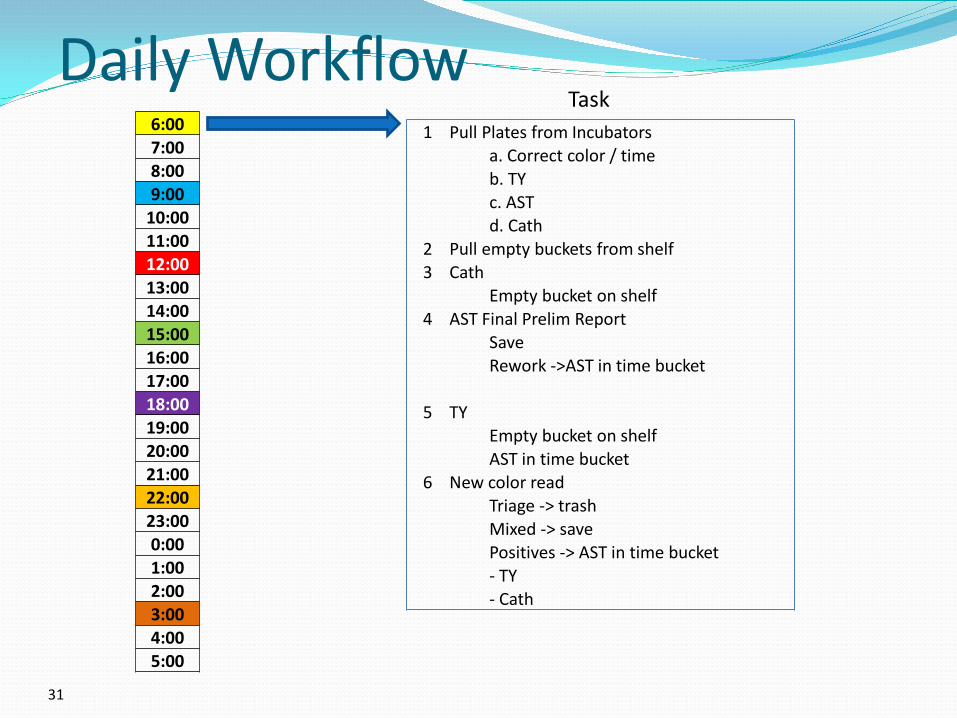
Daily Workflow
31
6:00 7:00 8:00 9:00
10:00 11:00 12:00 13:00 14:00 15:00 16:00 17:00 18:00 19:00 20:00 21:00 22:00 23:00 0:00 1:00 2:00 3:00 4:00 5:00
1 Pull Plates from Incubators a. Correct color / time b. TY c. AST d. Cath
2 Pull empty buckets from shelf 3 Cath
Empty bucket on shelf 4 AST Final Prelim Report
Save Rework ->AST in time bucket
5 TY Empty bucket on shelf AST in time bucket
6 New color read Triage -> trash Mixed -> save Positives -> AST in time bucket - TY - Cath
Task

Implementation! In 3 days!
32

33

Incubator #13 – Batch Visual Control
34
Top to Bottom 7 cycles / day
03:00 06:00 09:00 12:00 15:00 18:00 22:00

Urine Reading Template
35
Colony Count
Ignore Colonies in Red Zone1
2
3 10 – 40K
4 50 – 100K
5 > 100K
No Read Zone 6
> 100K
<10 colonies, ignore >=10 colonies, report as “less than 10K”
It was discovered that we were over-reporting on urines!

Visual Aids and Standards
36
Only 3 ml’s are needed to pour off in to gray top tubes for Micro.
This red line indicates where 3 ml’s are located on the cups; very low, barely
covering the bottom of the cup.
URINE POUR OFF’S FOR MICROBIOLOGY GUIDE FOR VOLUME
Isola Poka Yoke, to reduce errors and facilitate identification
Later, added “arrows” to limit batch size between the 5 & 6 slots!
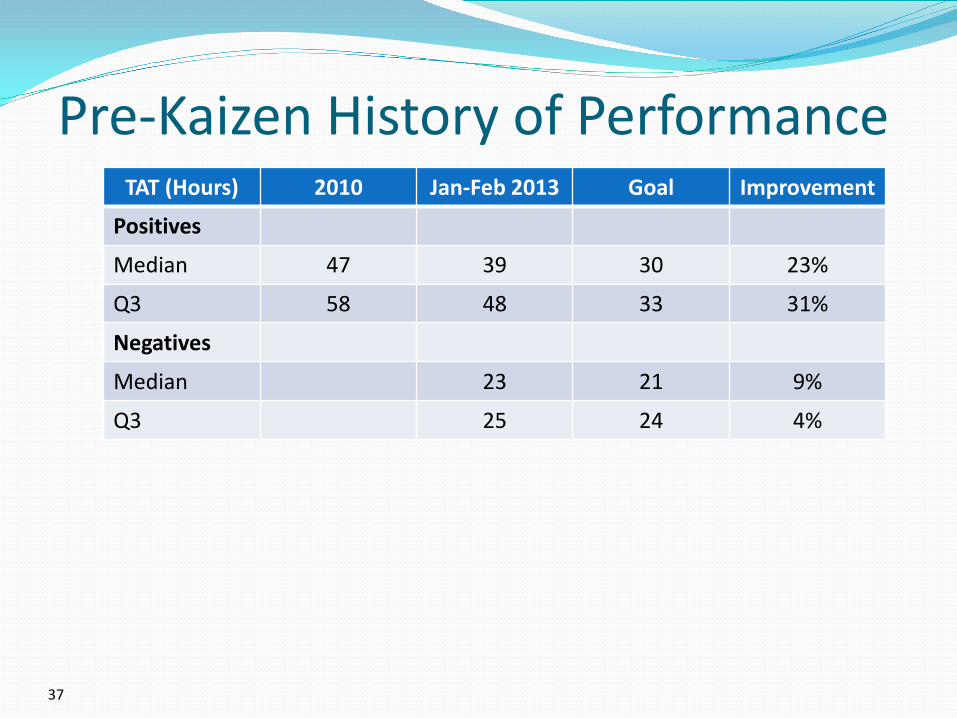
Pre-Kaizen History of Performance
37
TAT (Hours) 2010 Jan-Feb 2013 Goal Improvement
Positives
Median 47 39 30 23%
Q3 58 48 33 31%
Negatives
Median 23 21 9%
Q3 25 24 4%
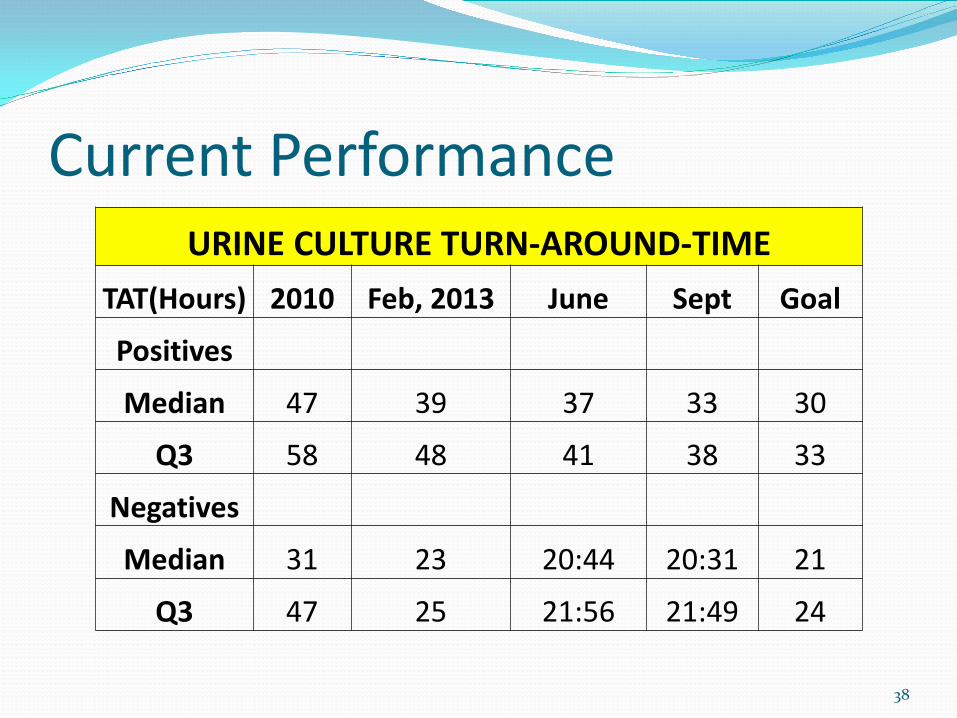
Current Performance URINE CULTURE TURN-AROUND-TIME
TAT(Hours) 2010 Feb, 2013 June Sept Goal
Positives
Median 47 39 37 33 30
Q3 58 48 41 38 33
Negatives
Median 31 23 20:44 20:31 21
Q3 47 25 21:56 21:49 24
38

Fall 2013
39
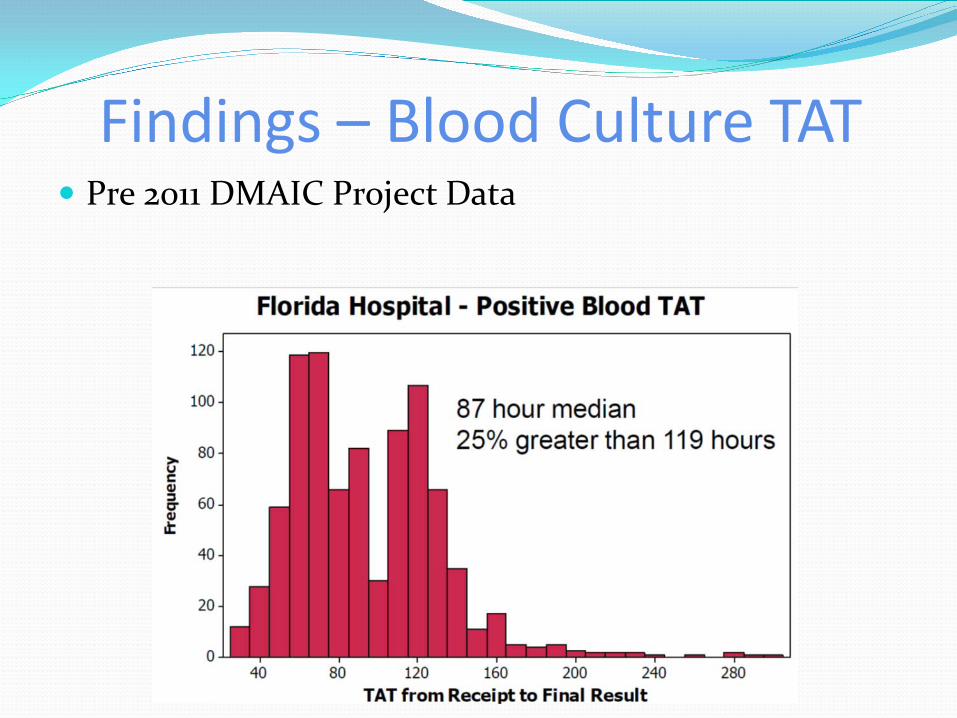
Findings – Blood Culture TAT Pre 2011 DMAIC Project Data

Findings – Blood Culture TAT Staffing Variation
Processing Technical

48040032024016080
Median
Mean
8580757065
1st Q uartile 58.196Median 68.4173rd Q uartile 91.383Maximum 525.467
77.761 83.621
67.110 69.745
45.381 49.530
A -Squared 72.16P-V alue < 0.005
Mean 80.691StDev 47.364V ariance 2243.391Skewness 4.7395Kurtosis 33.8349N 1006
Minimum 27.183
A nderson-Darling Normality Test
95% C onfidence Interv al for Mean
95% C onfidence Interv al for Median
95% C onfidence Interv al for StDev95% Confidence Intervals
Summary for + Blood Culture TAT (June/July)
June/July 2011
480400320240160800
LB USL
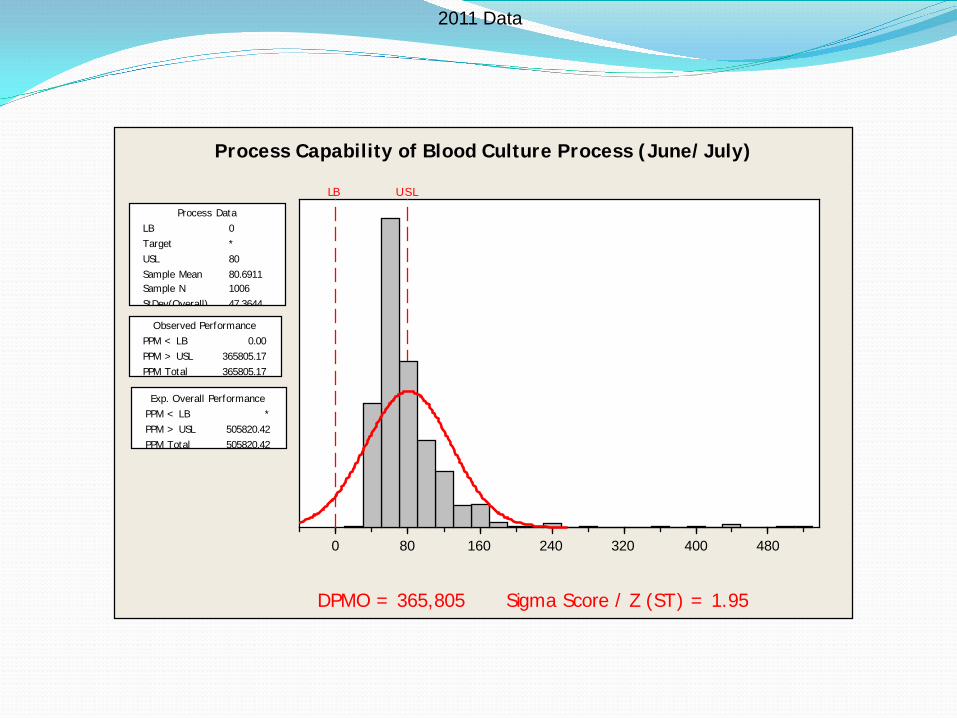
LB 0Target *USL 80Sample Mean 80.6911Sample N 1006StDev(Overall) 47.3644
Process Data
PPM < LB 0.00PPM > USL 365805.17PPM Total 365805.17
Observed Performance
PPM < LB *PPM > USL 505820.42PPM Total 505820.42
Exp. Overall Performance
Process Capability of Blood Culture Process (June/July)
DPMO = 365,805 Sigma Score / Z (ST) = 1.95
2011 Data
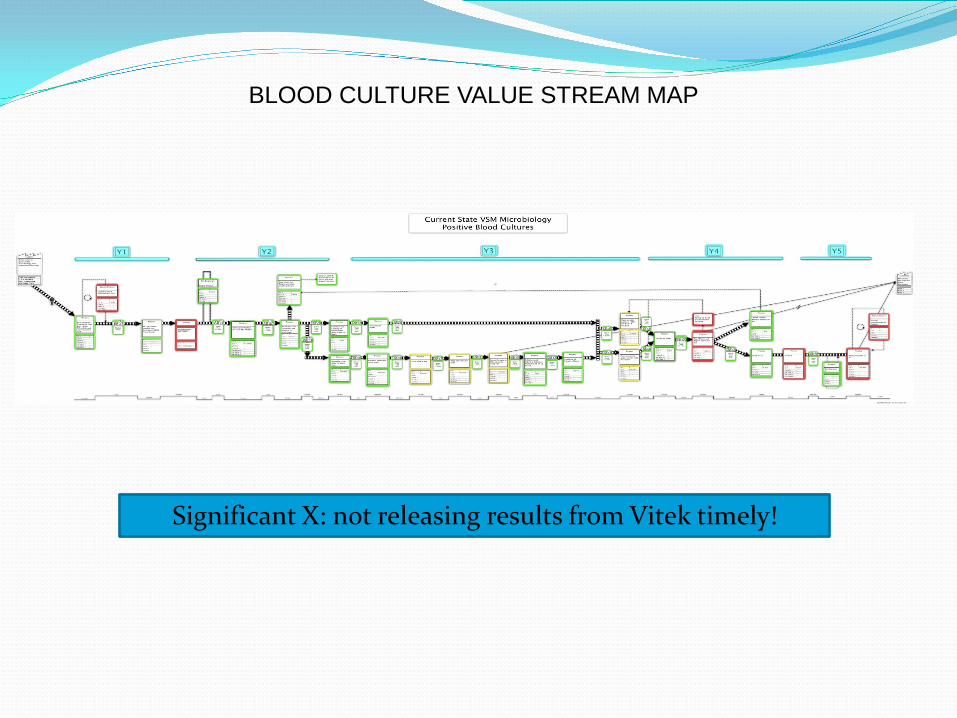
BLOOD CULTURE VALUE STREAM MAP
Significant X: not releasing results from Vitek timely!

BLOOD CULTURE FISHBONE ANALYSIS
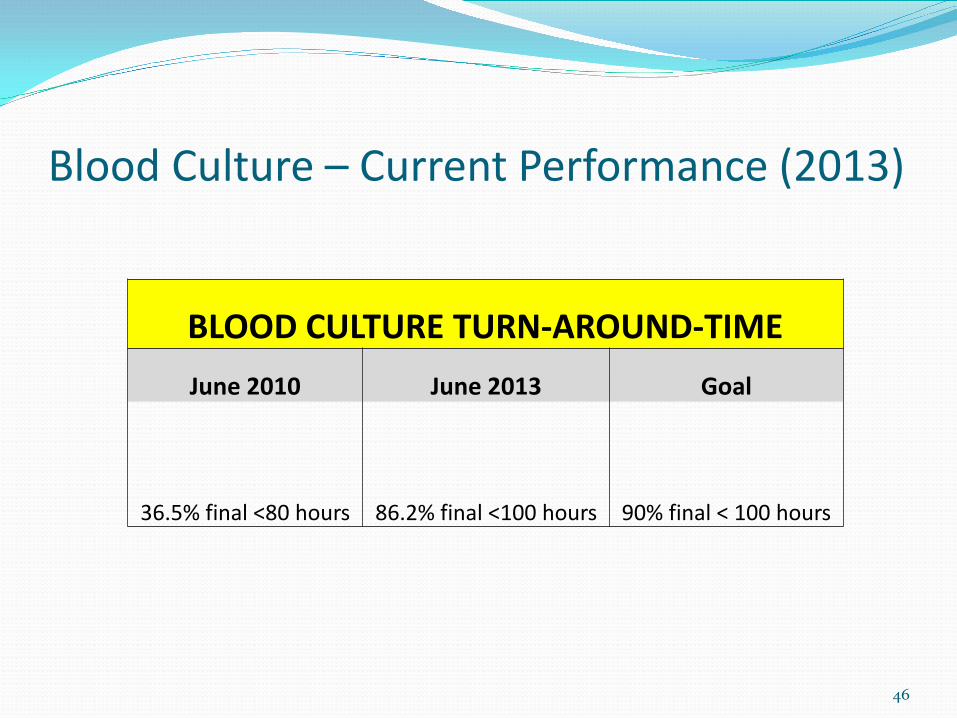
Blood Culture – Current Performance (2013)
46
BLOOD CULTURE TURN-AROUND-TIME June 2010 June 2013 Goal
36.5% final <80 hours 86.2% final <100 hours 90% final < 100 hours

QUICK WINS - 2013 Changed GOAL
Never going to get to 80% in <100 hours, because of the 120 hr incubation for negatives
Goal made more meaningful 90% reported at 48 hours
from received/result
Increased frequency of MNG from 1-2x/day to 6 times per day
Increased frequency of releasing results from Vitek from 1-2x/day to 4 times per day
Reduced or eliminated paperwork
47

Micro Setup – Future State
Benches have V2 Smart
Carriers
Direct access to V2 (small
batches)
Design Bench Layout and
Workflow to Reduce Rework,
Motion, and Unnecessary Processing
Day “zero” incubators
48
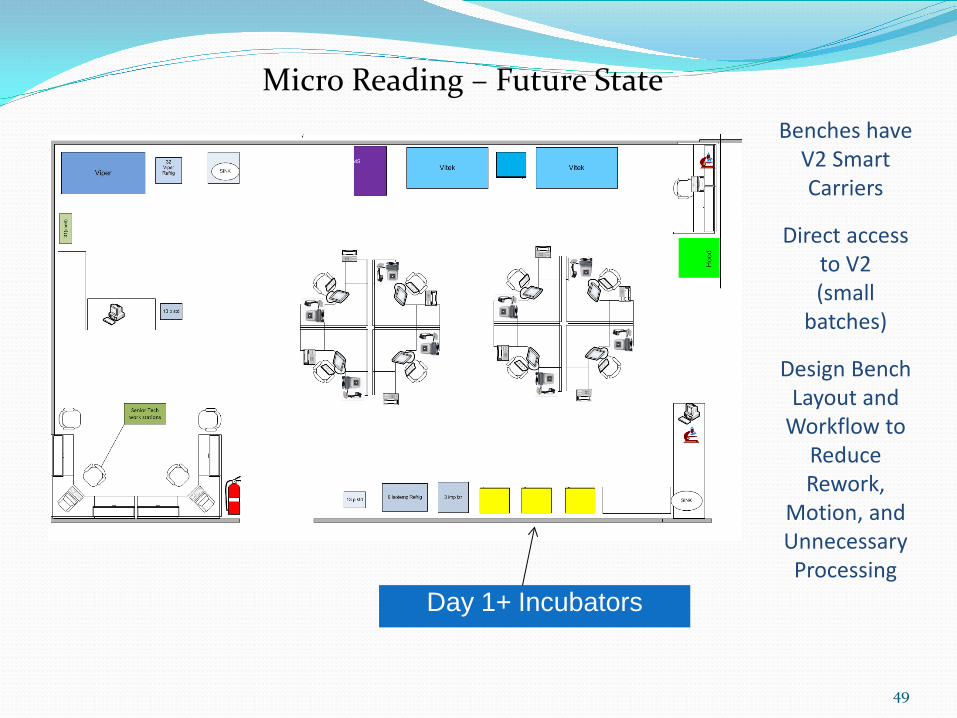
Micro Reading – Future State Benches have
V2 Smart Carriers
Direct access to V2 (small
batches)
Design Bench Layout and
Workflow to Reduce Rework,
Motion, and Unnecessary Processing
Day 1+ Incubators
49

Lessons We Learned from our Kaizen Events: Must Do's for Success Before the Kaizen event:
Pick out an “engaged” team; you want the best & brightest Lay out the “expectations” for the team members If you have metrics, crunch numbers and share with the team
During the Kaizen event: Make for a comfortable environment Share in the “positivity” with the team and expanded team
Post Kaizen event: Communicate results to the expanded team Celebrate success! (don’t under estimate the importance here) Continue with improvement efforts & Communicate, communicate communicate!!!
51

Lessons We Learned from our Kaizen Events: Must Don‘ts for Success”
Fail to record metrics or dilute reporting Set unrealistically low or high targets
Pick team members based on seniority or position Allow process owner to discontinue sustainability Allow “Executive Sponsor” to ignore process change
post Kaizen and beyond (leading to zero sustainability)

Benefits to the People Physicians/Patients:
Faster TAT, physicians can act quicker on results Reduce false positive Urine C&S with boric acid tubes
Microbiology: Alignment of staff with workload; smooths out the
processes and reduces stress Cross-training of all staff on “reading” enhances job
satisfaction Reduces errors due to “over work” conditions Creates “teamwork” environment through shared work
53

Questions?
54

30 days Plan
55
Action Who When Completion 1 Reflex order UA short term improvement Sany 14-May 100% 2 Create guideline for rack / batch standard size Team 14-May 100% 3 Wrong plates loadeed on Previ Isola - how to fix it Angela 14-May 100% 4 Record today's work flow 3 shifts Angela 15-May 100% 5 Create incoming Urine Cultures profile Manuel 15-May 100% 6 Create and communicate Std operating procedure Maryanne 23-May 50% 7 Specimen batching process Manuel 14-May 100%
8 Observe specimen waiting receiving and micro specimen receiving Maryanne 14-May 100%
9 Ask Technologiest why they wait in front of Previ Isola Manuel 14-May 100% 10 Turning off workcards (automatic print) Mary Ann 20-May 100%
11 Establish new colony count template Angela/Maryanne/Anne 15-May 100%
12 Traning for all shift on changes Angela / Sandy / Maryanne 31-May 25%
13 Result ORDRCS batch result entry Maryanne / Patrick 15-Aug 25%
14 Training Matrix Maryanne 31-May 100% 15 Metrics to track (TAT & Volumes) Team 15-May 100%

30 days plan
56
Action Who When Completion 16 Look for smaller containers / racks Team / Mary Ann 15-May 75% 17 Engineer the incubator spaces (Draw) Mary Ann 16-May 50% 18 Resulting of reflex order 100% 19 Create a visual control for Urine level for Isola Mary Ann 16-May 100% 20 Update process map Team 15-May 100% 21 Autoverification Vytek Mary Ann 25% 22 Purchase acrilic plate holders Mary Ann 17-May 100% 23 Data collection plan Manuel 16-May 100% 24 Schedule for following weeks Team / Sandy 16-May 0% 25 Purchase a shelf for the incubator Mary Ann 16-May 100%
26 Maintain daily operation volume by batch and record time to read - create a standard Maryanne 31-May 25%
27 Request a new crystal report that full fill Micro Lab requirements Mary Ann 15-Jun 0%