using labor market information to inform worker training efforts presented to the wyoming workforce...
TRANSCRIPT

Using Labor Market Information to Inform Worker Training Efforts
Presented to the Wyoming Workforce and Safety Summit
June 26, 2014
1
Who We Are
OUR ORGANIZATION:R&P is a separate, exclusively statistical entity.
WHAT WE DO:R&P collects, analyzes, and publishes timely
andaccurate labor market information (LMI)meeting established statistical standards.
OUR CUSTOMERS:LMI makes the labor market more efficient byproviding the public and the public’srepresentatives with the basis forinformed decision making.
2

Preparing Tomorrow’s Workforce
“It is critical that the Federal Government ensure that its policies…are designed to equip the Nation's workers with skills matching the needs of employers looking to hire. To achieve this goal, employers must identify the skills and credentials required for in-demand jobs…”
*Source: Presidential Memorandum, Job-Driven Training for Workers, The Federal Gazette, 2014
3

Science Technology Engineering Math (STEM): How Many Workers Will We Need?
• STEM jobs make up an estimated 5.3% of jobs in the U.S., and an estimated 4.8% of jobs in Wyoming.
• Between 2010-2020, STEM jobs will grow at roughly the same rate for the U.S. and Wyoming: 17.4%
• We can expect to add an estimated 226 STEM jobs in Wyoming per year.
• Although STEM occupations make up a small percentage of the total jobs worked in Wyoming and the U.S., there are skills associated with STEM that are required in many other occupations.
4
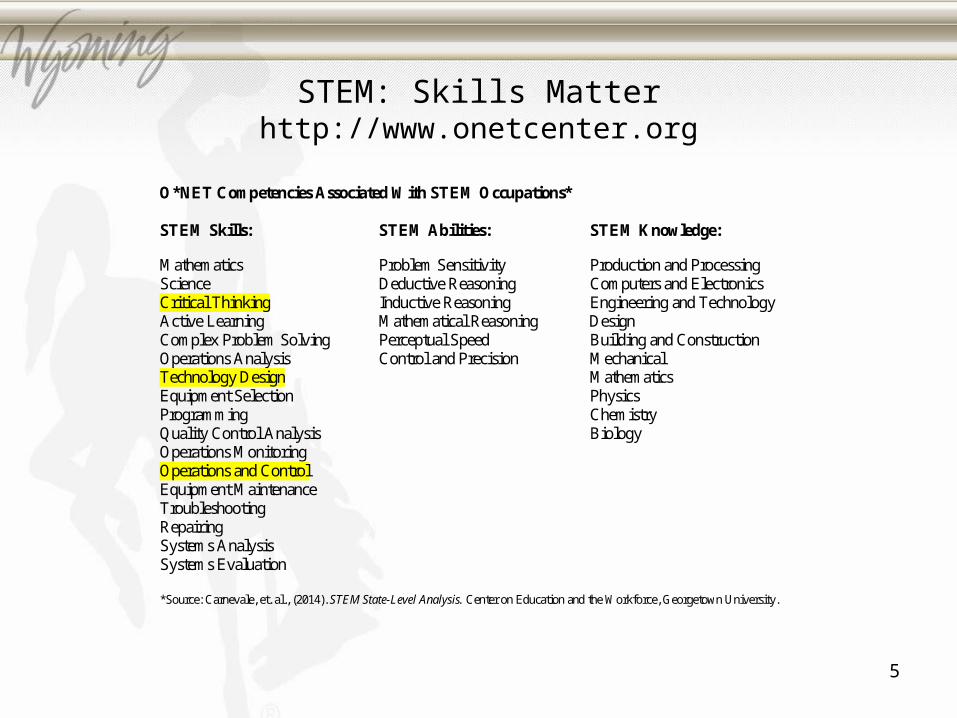
STEM: Skills Matterhttp://www.onetcenter.org
O*NET Competencies Associated With STEM Occupations* STEM Skills: STEM Abilities: STEM Knowledge:
Mathematics Problem Sensitivity Production and Processing Science Deductive Reasoning Computers and Electronics Critical Thinking Inductive Reasoning Engineering and Technology Active Learning Mathematical Reasoning Design Complex Problem Solving Perceptual Speed Building and Construction Operations Analysis Control and Precision Mechanical Technology Design Mathematics Equipment Selection Physics Programming Chemistry Quality Control Analysis Biology Operations Monitoring Operations and Control Equipment Maintenance Troubleshooting Repairing Systems Analysis Systems Evaluation *Source: Carnevale, et. al., (2014). STEM State-Level Analysis. Center on Education and the Workforce, Georgetown University.
5
6
Defining Selected Job Skills
• Critical ThinkingInvolves using logic and reasoning to identify the strengths and weaknesses of alternative solutions or approaches to problems.
• Operation and ControlInvolves generating or adapting equipment and technology to serve user needs.
• Technology DesignInvolves controlling operations of equipment or systems.
Source: O*NET Online (http://www.onetcenter.org/).
7
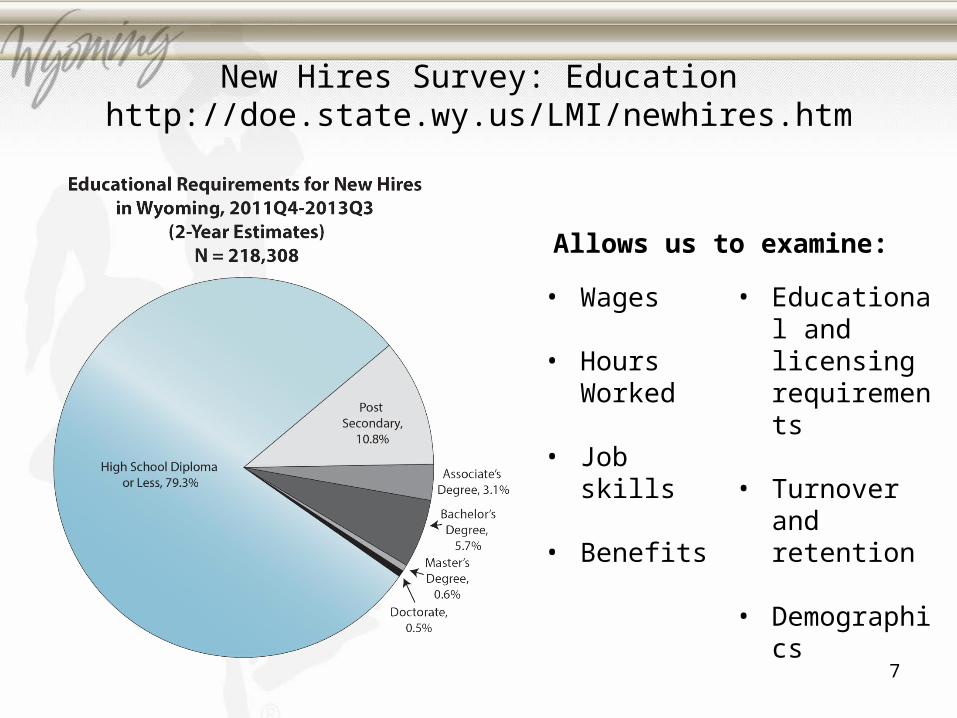
New Hires Survey: Educationhttp://doe.state.wy.us/LMI/newhires.htm
Allows us to examine:
• Wages
• Hours Worked
• Job skills
• Benefits
• Educational and licensing requirements
• Turnover and retention
• Demographics
8
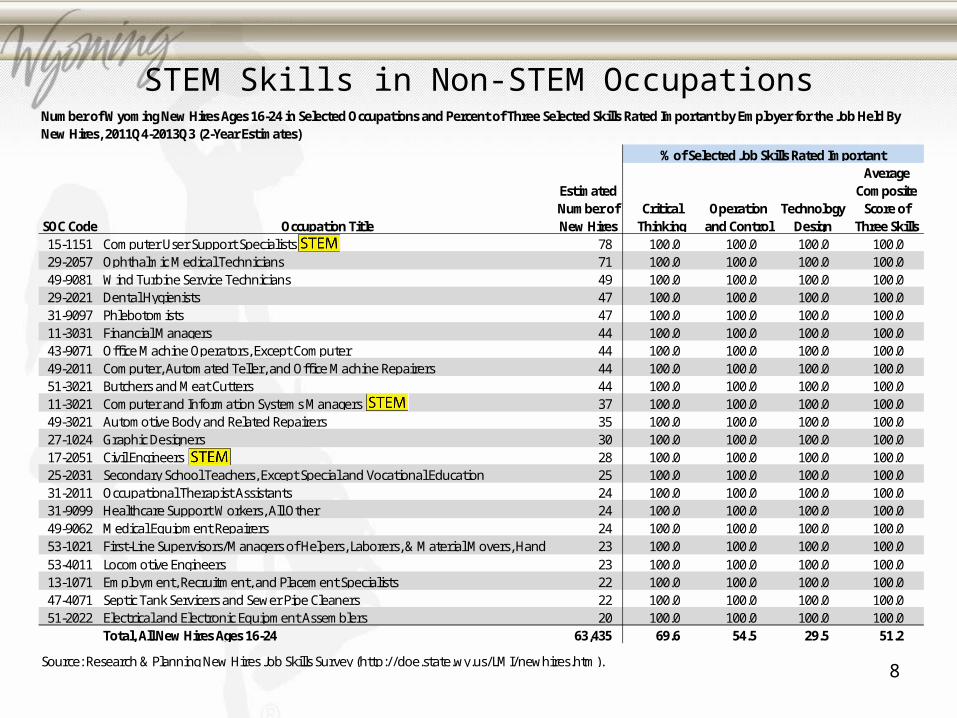
STEM Skills in Non-STEM Occupations
SOC Code Occupation Title
Estimated Number of New Hires
Critical Thinking
Operation and Control
Technology Design
Average Composite
Score of Three Skills
15-1151 Computer User Support Specialists 78 100.0 100.0 100.0 100.029-2057 Ophthalmic Medical Technicians 71 100.0 100.0 100.0 100.049-9081 Wind Turbine Service Technicians 49 100.0 100.0 100.0 100.029-2021 Dental Hygienists 47 100.0 100.0 100.0 100.031-9097 Phlebotomists 47 100.0 100.0 100.0 100.011-3031 Financial Managers 44 100.0 100.0 100.0 100.043-9071 Office Machine Operators, Except Computer 44 100.0 100.0 100.0 100.049-2011 Computer, Automated Teller, and Office Machine Repairers 44 100.0 100.0 100.0 100.051-3021 Butchers and Meat Cutters 44 100.0 100.0 100.0 100.011-3021 Computer and Information Systems Managers 37 100.0 100.0 100.0 100.049-3021 Automotive Body and Related Repairers 35 100.0 100.0 100.0 100.027-1024 Graphic Designers 30 100.0 100.0 100.0 100.017-2051 Civil Engineers 28 100.0 100.0 100.0 100.025-2031 Secondary School Teachers, Except Special and Vocational Education 25 100.0 100.0 100.0 100.031-2011 Occupational Therapist Assistants 24 100.0 100.0 100.0 100.031-9099 Healthcare Support Workers, All Other 24 100.0 100.0 100.0 100.049-9062 Medical Equipment Repairers 24 100.0 100.0 100.0 100.053-1021 First-Line Supervisors/Managers of Helpers, Laborers, & Material Movers, Hand 23 100.0 100.0 100.0 100.053-4011 Locomotive Engineers 23 100.0 100.0 100.0 100.013-1071 Employment, Recruitment, and Placement Specialists 22 100.0 100.0 100.0 100.047-4071 Septic Tank Servicers and Sewer Pipe Cleaners 22 100.0 100.0 100.0 100.051-2022 Electrical and Electronic Equipment Assemblers 20 100.0 100.0 100.0 100.0
Total, All New Hires Ages 16-24 63,435 69.6 54.5 29.5 51.2
Number of Wyoming New Hires Ages 16-24 in Selected Occupations and Percent of Three Selected Skills Rated Important by Employer for the Job Held By New Hires, 2011Q4-2013Q3 (2-Year Estimates)
% of Selected Job Skills Rated Important
Source: Research & Planning New Hires Job Skills Survey (http://doe.state.wy.us/LMI/newhires.htm).
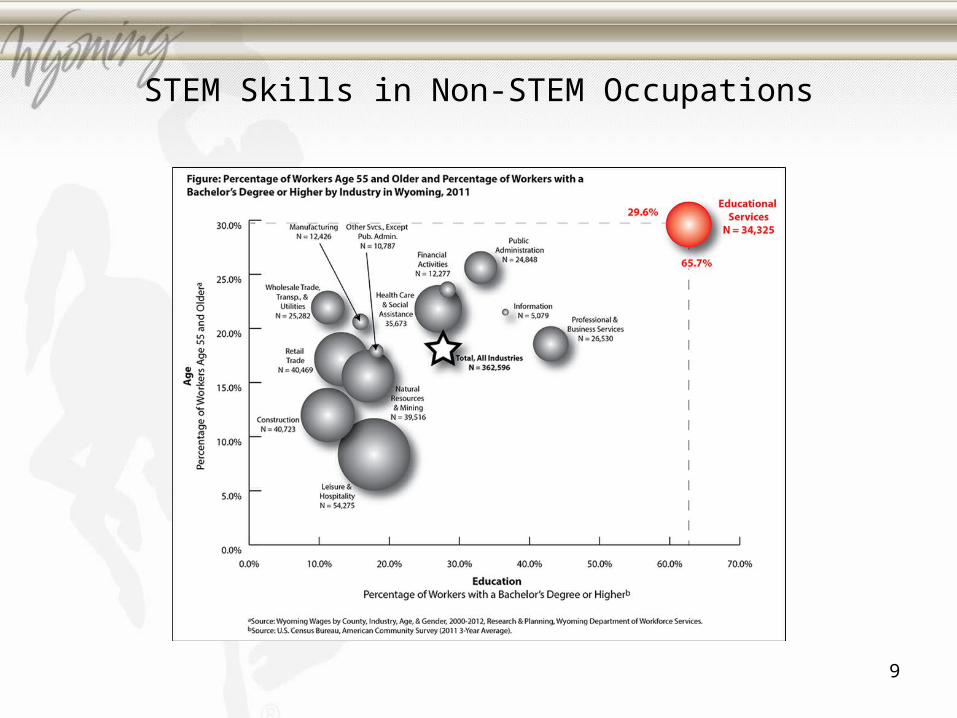
STEM Skills in Non-STEM Occupations
9
10
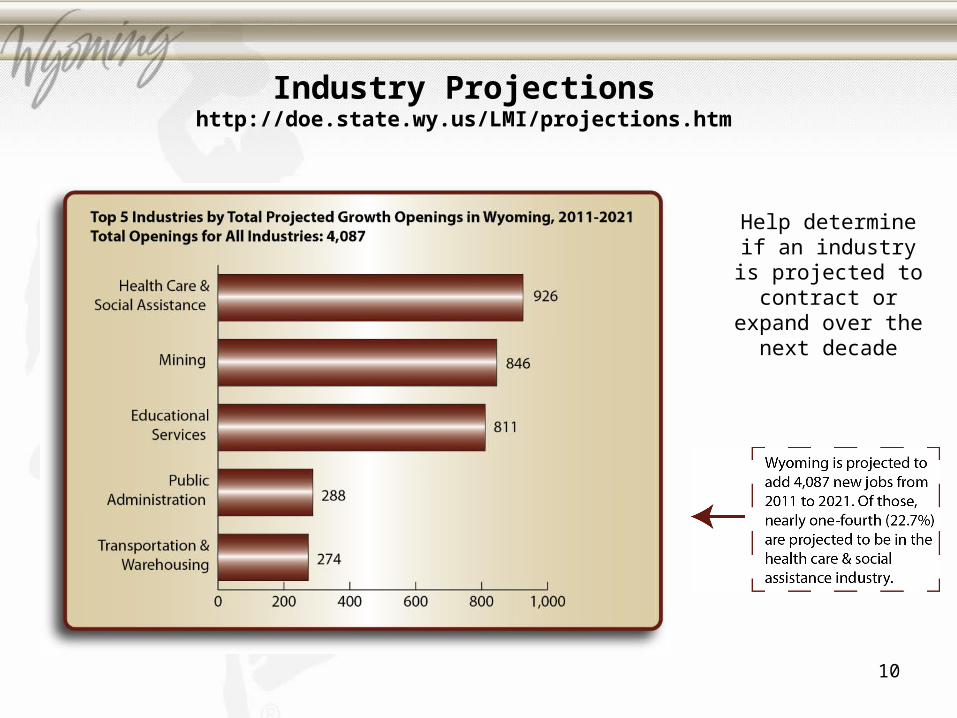
Industry Projectionshttp://doe.state.wy.us/LMI/projections.htm
Help determine if an industry is projected to contract or
expand over the next decade

11
Training for What Occupation: Re-employment of UI Claimants
• Occupations requiring more than a high school diploma
• Relatively high paying jobs ($20 or more per hour)
• Employers relying on nonresident workers (at least 20% of all new hires)
Questions we can address:
• Are employers looking outside of Wyoming when they hire for these jobs?
• Are employers satisfied with their new hires’ skills?
• Are employers retaining these workers after hiring them?

12
Training for What?
Turnover
SOC Code Occupation Typical
Educationc N
Average Hourly
Wage ($) % NService
OrientationCritical
ThinkingReading Comp.
Tech. Design
Operation and
Control SatisfiedNot
Satisfied Neither Other
% Still Working 1
Quarter After Hire
47-2073 Operating Engineers and Other Construction Equipment …
Post Secondary
3,316 20.00 20.0 646 42.6 90.2 53.5 45.2 94.4 61.9 1.5 16.5 20.1 81.2
11-9021 Construction Managers Bachelors 346 43.26 42.4 147 87.3 88.5 88.5 65.6 100.0 100.0 0.0 0.0 0.0 88.539-1021 First-Line Super./Manag.,
Personal Service WorkersBachelors 278 20.19 29.2 81 100.0 100.0 100.0 3.0 5.9 83.4 0.0 16.6 0.0 100.0
29-9011 Occupational Health and Safety Specialists
Bachelors 276 30.77 24.5 68 85.6 100.0 98.8 49.0 71.5 89.7 0.0 3.4 6.9 96.5
29-1123 Physical Therapists Masters 181 37.91 26.0 47 100.0 100.0 100.0 87.0 100.0 100.0 0.0 0.0 0.0 74.017-2151 Mining and Geological
Engineers, Including Mining
Bachelors 177 41.15 26.2 46 41.8 79.1 58.2 79.1 68.7 63.3 15.8 0.0 20.9 100.0
11-9141 Property, Real Estate & Community Association Manager
Post Secondary
167 43.75 22.2 37 65.0 100.0 100.0 16.3 65.0 100.0 0.0 0.0 0.0 95.7
11-1011 Chief Executives Bachelors 131 42.21 26.1 34 69.1 100.0 100.0 53.6 64.6 90.5 0.0 0.0 9.5 80.949-3011 Aircraft Mechanics and
Service TechniciansPost Secondary
127 25.00 36.4 46 36.4 100.0 72.7 100.0 100.0 18.2 0.0 54.5 27.3 54.5
17-2051 Civil Engineers Bachelors 122 23.00 23.1 28 61.5 100.0 100.0 100.0 92.3 76.9 0.0 0.0 23.1 100.0
17-2171 Petroleum Engineers Bachelors 115 39.00 32.5 37 67.5 100.0 100.0 83.9 67.7 83.9 0.0 0.0 16.1 100.0
11-9199 Managers, All Other Bachelors 105 43.75 28.8 30 69.3 92.4 87.0 40.6 41.6 92.4 0.0 0.0 7.6 100.0Total, All Occupations N/A 218,308 11.00 15.0 32,746 75.4 73.9 64.1 34.6 58.1 60.1 8.9 15.5 15.5 77.4
Source: Research & Planning New Hires Survey, 2011Q4-2013Q3.
cTypical education source: O*Net Online (http://www.onetonline.org/).
Selected New Hire Occupationsa for Nonresidents in Wyoming, 2011Q4-2013Q3 (2-Year Estimates)
Nonresidentsb Selected Job Skills Marked "Important" by EmployersEmployer Satisfaction with New
Hires' Skills
aSelected new hires occupations are those occupations that: (1) require more than a high school diploma; (2) have an average hourly wage of at least $20; and (3) nonresidents accounted for at least 20% of all new hires for that occupation.bNonresidents are individuals for whom Research & Planning could not identify residence using administrative databases.

13
Training for What?
Turnover
SOC Code Occupation Typical
Educationc N
Average Hourly
Wage ($) % NService
OrientationCritical
ThinkingReading Comp.
Tech. Design
Operation and
Control SatisfiedNot
Satisfied Neither Other
% Still Working 1
Quarter After Hire
47-2073 Operating Engineers and Other Construction Equipment …
Post Secondary
3,316 20.00 20.0 646 42.6 90.2 53.5 45.2 94.4 61.9 1.5 16.5 20.1 81.2
11-9021 Construction Managers Bachelors 346 43.26 42.4 147 87.3 88.5 88.5 65.6 100.0 100.0 0.0 0.0 0.0 88.539-1021 First-Line Super./Manag.,
Personal Service WorkersBachelors 278 20.19 29.2 81 100.0 100.0 100.0 3.0 5.9 83.4 0.0 16.6 0.0 100.0
29-9011 Occupational Health and Safety Specialists
Bachelors 276 30.77 24.5 68 85.6 100.0 98.8 49.0 71.5 89.7 0.0 3.4 6.9 96.5
29-1123 Physical Therapists Masters 181 37.91 26.0 47 100.0 100.0 100.0 87.0 100.0 100.0 0.0 0.0 0.0 74.017-2151 Mining and Geological
Engineers, Including Mining
Bachelors 177 41.15 26.2 46 41.8 79.1 58.2 79.1 68.7 63.3 15.8 0.0 20.9 100.0
11-9141 Property, Real Estate & Community Association Manager
Post Secondary
167 43.75 22.2 37 65.0 100.0 100.0 16.3 65.0 100.0 0.0 0.0 0.0 95.7
11-1011 Chief Executives Bachelors 131 42.21 26.1 34 69.1 100.0 100.0 53.6 64.6 90.5 0.0 0.0 9.5 80.949-3011 Aircraft Mechanics and
Service TechniciansPost Secondary
127 25.00 36.4 46 36.4 100.0 72.7 100.0 100.0 18.2 0.0 54.5 27.3 54.5
17-2051 Civil Engineers Bachelors 122 23.00 23.1 28 61.5 100.0 100.0 100.0 92.3 76.9 0.0 0.0 23.1 100.0
17-2171 Petroleum Engineers Bachelors 115 39.00 32.5 37 67.5 100.0 100.0 83.9 67.7 83.9 0.0 0.0 16.1 100.0
11-9199 Managers, All Other Bachelors 105 43.75 28.8 30 69.3 92.4 87.0 40.6 41.6 92.4 0.0 0.0 7.6 100.0Total, All Occupations N/A 218,308 11.00 15.0 32,746 75.4 73.9 64.1 34.6 58.1 60.1 8.9 15.5 15.5 77.4
Source: Research & Planning New Hires Survey, 2011Q4-2013Q3.
cTypical education source: O*Net Online (http://www.onetonline.org/).
Selected New Hire Occupationsa for Nonresidents in Wyoming, 2011Q4-2013Q3 (2-Year Estimates)
Nonresidentsb Selected Job Skills Marked "Important" by EmployersEmployer Satisfaction with New
Hires' Skills
aSelected new hires occupations are those occupations that: (1) require more than a high school diploma; (2) have an average hourly wage of at least $20; and (3) nonresidents accounted for at least 20% of all new hires for that occupation.bNonresidents are individuals for whom Research & Planning could not identify residence using administrative databases.
14
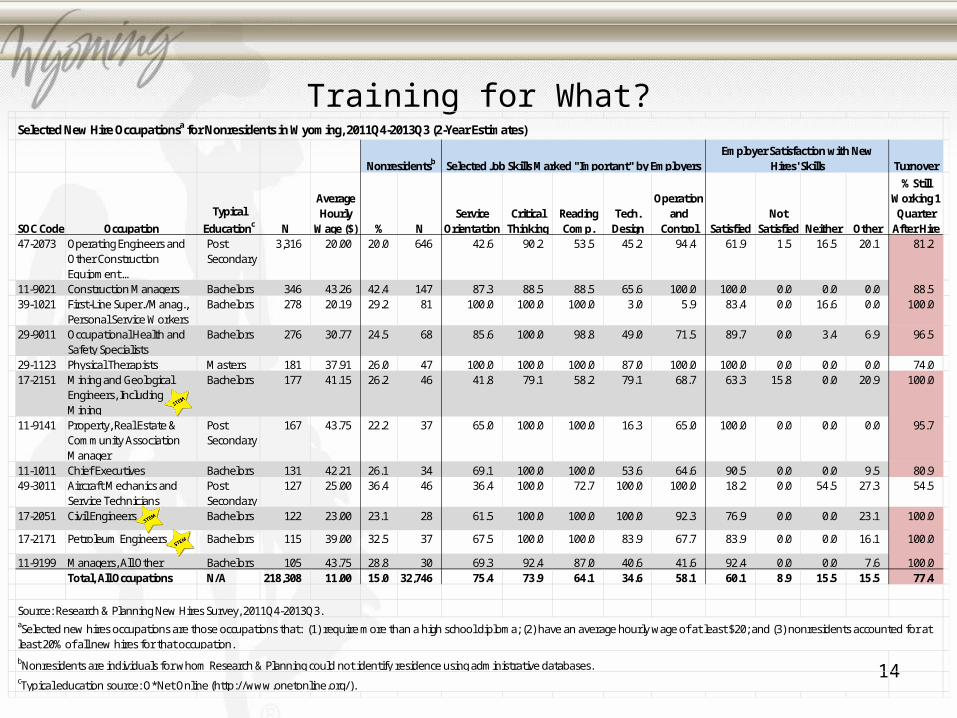
Training for What?
Turnover
SOC Code Occupation Typical
Educationc N
Average Hourly
Wage ($) % NService
OrientationCritical
ThinkingReading Comp.
Tech. Design
Operation and
Control SatisfiedNot
Satisfied Neither Other
% Still Working 1
Quarter After Hire
47-2073 Operating Engineers and Other Construction Equipment …
Post Secondary
3,316 20.00 20.0 646 42.6 90.2 53.5 45.2 94.4 61.9 1.5 16.5 20.1 81.2
11-9021 Construction Managers Bachelors 346 43.26 42.4 147 87.3 88.5 88.5 65.6 100.0 100.0 0.0 0.0 0.0 88.539-1021 First-Line Super./Manag.,
Personal Service WorkersBachelors 278 20.19 29.2 81 100.0 100.0 100.0 3.0 5.9 83.4 0.0 16.6 0.0 100.0
29-9011 Occupational Health and Safety Specialists
Bachelors 276 30.77 24.5 68 85.6 100.0 98.8 49.0 71.5 89.7 0.0 3.4 6.9 96.5
29-1123 Physical Therapists Masters 181 37.91 26.0 47 100.0 100.0 100.0 87.0 100.0 100.0 0.0 0.0 0.0 74.017-2151 Mining and Geological
Engineers, Including Mining
Bachelors 177 41.15 26.2 46 41.8 79.1 58.2 79.1 68.7 63.3 15.8 0.0 20.9 100.0
11-9141 Property, Real Estate & Community Association Manager
Post Secondary
167 43.75 22.2 37 65.0 100.0 100.0 16.3 65.0 100.0 0.0 0.0 0.0 95.7
11-1011 Chief Executives Bachelors 131 42.21 26.1 34 69.1 100.0 100.0 53.6 64.6 90.5 0.0 0.0 9.5 80.949-3011 Aircraft Mechanics and
Service TechniciansPost Secondary
127 25.00 36.4 46 36.4 100.0 72.7 100.0 100.0 18.2 0.0 54.5 27.3 54.5
17-2051 Civil Engineers Bachelors 122 23.00 23.1 28 61.5 100.0 100.0 100.0 92.3 76.9 0.0 0.0 23.1 100.0
17-2171 Petroleum Engineers Bachelors 115 39.00 32.5 37 67.5 100.0 100.0 83.9 67.7 83.9 0.0 0.0 16.1 100.0
11-9199 Managers, All Other Bachelors 105 43.75 28.8 30 69.3 92.4 87.0 40.6 41.6 92.4 0.0 0.0 7.6 100.0Total, All Occupations N/A 218,308 11.00 15.0 32,746 75.4 73.9 64.1 34.6 58.1 60.1 8.9 15.5 15.5 77.4
Source: Research & Planning New Hires Survey, 2011Q4-2013Q3.
cTypical education source: O*Net Online (http://www.onetonline.org/).
Selected New Hire Occupationsa for Nonresidents in Wyoming, 2011Q4-2013Q3 (2-Year Estimates)
Nonresidentsb Selected Job Skills Marked "Important" by EmployersEmployer Satisfaction with New
Hires' Skills
aSelected new hires occupations are those occupations that: (1) require more than a high school diploma; (2) have an average hourly wage of at least $20; and (3) nonresidents accounted for at least 20% of all new hires for that occupation.bNonresidents are individuals for whom Research & Planning could not identify residence using administrative databases.
15
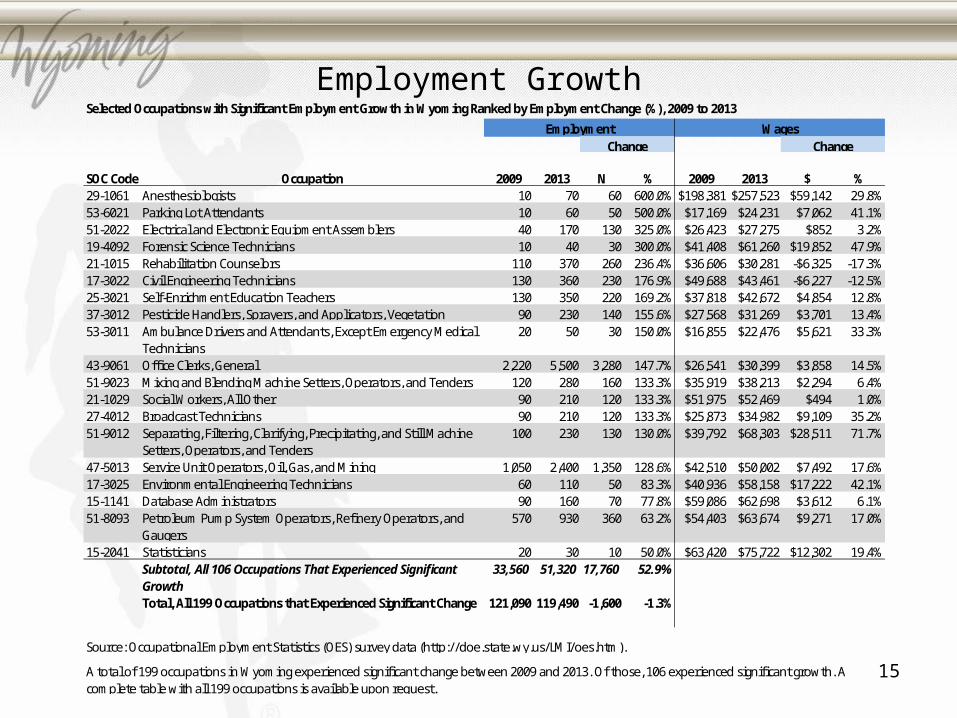
Employment Growth
SOC Code Occupation 2009 2013 N % 2009 2013 $ %29-1061 Anesthesiologists 10 70 60 600.0% $198,381 $257,523 $59,142 29.8%53-6021 Parking Lot Attendants 10 60 50 500.0% $17,169 $24,231 $7,062 41.1%51-2022 Electrical and Electronic Equipment Assemblers 40 170 130 325.0% $26,423 $27,275 $852 3.2%19-4092 Forensic Science Technicians 10 40 30 300.0% $41,408 $61,260 $19,852 47.9%21-1015 Rehabilitation Counselors 110 370 260 236.4% $36,606 $30,281 -$6,325 -17.3%17-3022 Civil Engineering Technicians 130 360 230 176.9% $49,688 $43,461 -$6,227 -12.5%25-3021 Self-Enrichment Education Teachers 130 350 220 169.2% $37,818 $42,672 $4,854 12.8%37-3012 Pesticide Handlers, Sprayers, and Applicators, Vegetation 90 230 140 155.6% $27,568 $31,269 $3,701 13.4%53-3011 Ambulance Drivers and Attendants, Except Emergency Medical
Technicians20 50 30 150.0% $16,855 $22,476 $5,621 33.3%
43-9061 Office Clerks, General 2,220 5,500 3,280 147.7% $26,541 $30,399 $3,858 14.5%51-9023 Mixing and Blending Machine Setters, Operators, and Tenders 120 280 160 133.3% $35,919 $38,213 $2,294 6.4%21-1029 Social Workers, All Other 90 210 120 133.3% $51,975 $52,469 $494 1.0%27-4012 Broadcast Technicians 90 210 120 133.3% $25,873 $34,982 $9,109 35.2%51-9012 Separating, Filtering, Clarifying, Precipitating, and Still Machine
Setters, Operators, and Tenders100 230 130 130.0% $39,792 $68,303 $28,511 71.7%
47-5013 Service Unit Operators, Oil, Gas, and Mining 1,050 2,400 1,350 128.6% $42,510 $50,002 $7,492 17.6%17-3025 Environmental Engineering Technicians 60 110 50 83.3% $40,936 $58,158 $17,222 42.1%15-1141 Database Administrators 90 160 70 77.8% $59,086 $62,698 $3,612 6.1%51-8093 Petroleum Pump System Operators, Refinery Operators, and
Gaugers570 930 360 63.2% $54,403 $63,674 $9,271 17.0%
15-2041 Statisticians 20 30 10 50.0% $63,420 $75,722 $12,302 19.4%Subtotal, All 106 Occupations That Experienced Significant Growth
33,560 51,320 17,760 52.9%
Total, All 199 Occupations that Experienced Significant Change 121,090 119,490 -1,600 -1.3%
A total of 199 occupations in Wyoming experienced significant change between 2009 and 2013. Of those, 106 experienced significant growth. A complete table with all 199 occupations is available upon request.
Selected Occupations with Significant Employment Growth in Wyoming Ranked by Employment Change (%), 2009 to 2013
Employment WagesChange Change
Source: Occupational Employment Statistics (OES) survey data (http://doe.state.wy.us/LMI/oes.htm).

Monitoring Need to Focus Training Efforts: Resources at Your Fingertips
Industry Projections
New Hires Survey Data
Wage Data
Custom Research
16
17
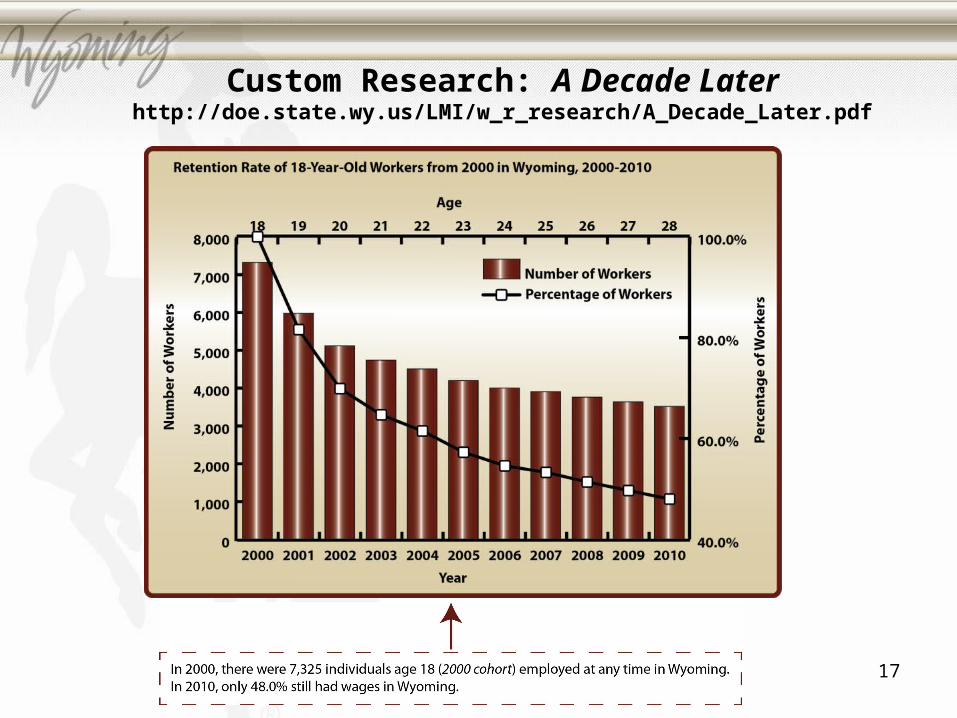
Custom Research: A Decade Laterhttp://doe.state.wy.us/LMI/w_r_research/A_Decade_Later.pdf
18
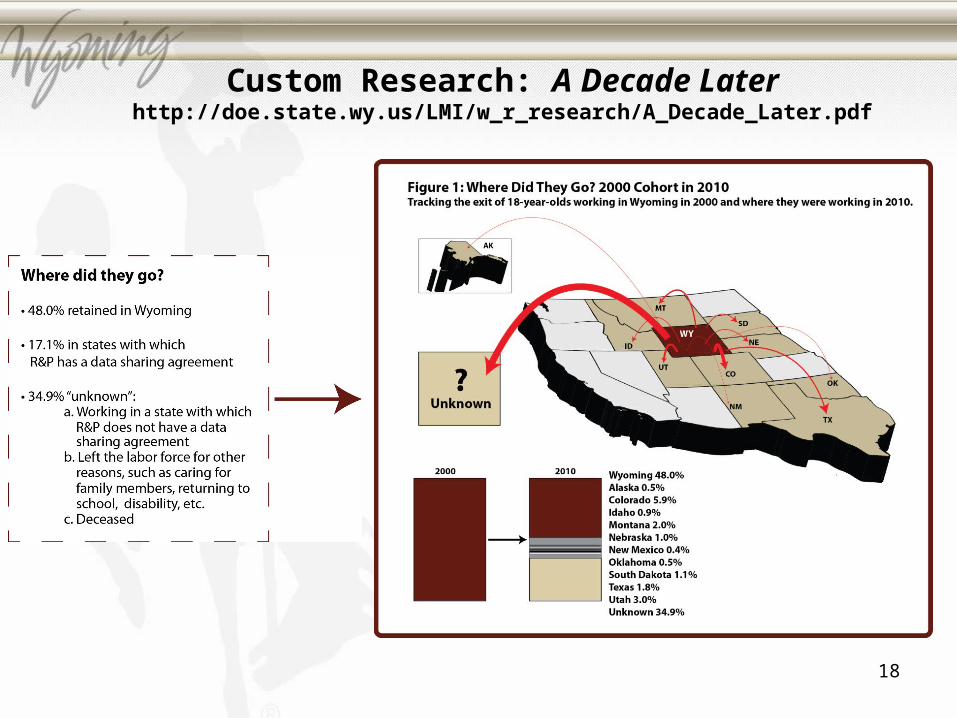
Custom Research: A Decade Laterhttp://doe.state.wy.us/LMI/w_r_research/A_Decade_Later.pdf

Monthly Features:Local Area Unemployment Statistics
(LAUS)Employment statisticsEconomic indicators
Unemployment Insurance (UI) claims
Quarterly Features:Quarterly Census of Employment & Wages
(QCEW)Wage Records data
Quarterly turnover statisticsWorkers’ Compensation Claims
Wyoming Labor Force TRENDShttp://doe.state.wy.us/LMI/trends.htm
Sign up for Wyoming Labor Force Trendshttp://doe.state.wy.us/LMI/puborder.htm

Research & PlanningWyoming Department of Workforce ServicesP.O. Box 2760246 S. Center St. Casper, WY 82601(307) 473-3807
[email protected]://wyomingLMI.org
Michele HolmesPublic Relations [email protected]