using patient panel as a principle element in primary care
TRANSCRIPT

Using Patient Panel as a
Principle Element in Primary
Care Physician Compensation
White Paper
JUSTIN CHAMBLEE, CPA Senior Vice President
STEPHEN ROSS, MHA, FHFMA, CMPE Senior Manager
February 2018
CONTACT For further information about Coker Group and how we could be of
assistance, call 800-345-5829 x137 or visit www.cokergroup.com.

White Paper – Using Patient Panel February 2018 Page 2 of 17
as a Principle Element in Primary Care Physician Compensation
TABLE OF CONTENTS Introduction ................................................................................................................................................. 3
Background .................................................................................................................................................. 3
What is a Patient Panel? ............................................................................................................................ 5
How is Patient Panel Used and Why is it Important? ............................................................................ 6
What is an Ideal Panel Size and How is Patient Panel Calculated? .................................................... 7
Impact of Patient Age, Gender, and Acuity on a Panel ........................................................................ 9
Panel as a Primary Care Physician Compensation Strategy ............................................................... 12
Integrating Panel/Quality Incentives within Existing Compensation Plans ...................................... 16
Conclusion .................................................................................................................................................. 17

White Paper – Using Patient Panel February 2018 Page 3 of 17
as a Principle Element in Primary Care Physician Compensation
Abstract: The understanding of patient panel is essential to achieving success in a value-based
environment. Payers have begun providing financial rewards and penalties to providers based on panel
management and associated outcomes. In this white paper, we discuss the importance of identifying a
patient panel as well as practical strategies for aligning provider compensation with a patient panel as a
means of encouraging provider and organization alignment.
Key Areas of Focus:
Define patient panel Explain why patient panel is key to achieving success in a value-based environment Explore how patient panel can be leveraged to gain clinical efficiencies Understand the impact of patient age, gender, and acuity on patient panel Learn common panel calculation methodologies Use patient panel as a provider compensation strategy
Key Words: Physician Compensation, Patient Panel, Value-Based Reimbursement, Compensation
Strategy
INTRODUCTION
Significant shifts are occurring within healthcare reimbursement policy as the Centers for Medicare and
Medicaid (CMS) and other payers explore new approaches to reimbursement, moving from mainly fee-
for-service to payment tied to value. These changes in reimbursement paradigms and the associated
care delivery models require healthcare administrators and physician leaders to ensure stakeholder
incentives are aligned to achieve the goals and objectives of value-based healthcare. This paper
examines the importance of integrating patient panel as an essential element within primary care
physician (PCP) compensation models as a means of alignment with the goals and objectives of external
pay-for-performance reimbursement methodologies. It also presents some specific modifications to
make when revising compensation models to reflect the degree of shift in volume-to-value
reimbursement allocations, as determined by the national and local market environments. (Note:
Though panel can apply to other specialties, the broadest application is in primary care. Thus, this paper
concentrates on that area.)
BACKGROUND
Healthcare costs as a percentage of the U.S. gross domestic product (GDP) have risen dramatically over
the past 30 years, with healthcare costs in 2016 at 17.9% of GDP and projections reaching 19.9% of GDP
by 2025.1 Traditionally, hospitals and physicians primarily have been paid based on the number of
services rendered, which many experts point to as the chief reason that costs are so high. In attempts to
1 Centers for Medicare and Medicaid Services. “National Health Expenditure Projections 2016-2025.”
https://www.cms.gov/Research-Statistics-Data-and-Systems/Statistics-Trends-and-
Reports/NationalHealthExpendData/Downloads/proj2016.pdf. Accessed January 31, 2018.

White Paper – Using Patient Panel February 2018 Page 4 of 17
as a Principle Element in Primary Care Physician Compensation
bend the cost curve, attention has been given to define and deliver better value through various
payment reform initiatives, as with the Affordable Care Act passed in 2010. This legislation has been a
catalyst for administrators and physicians to work closely together to achieve better patient outcomes
at lower costs, as opposed to merely churning volume.2
Beginning January 1, 2017, the federal government upped the ante even more by passing into law the
Medicare Access and CHIP Reauthorization Act (MACRA) of 2015’s Quality Payment Program (QPP) to
engage physicians further in the health care reform process by tying physician payment more closely to
patient outcomes for Medicare beneficiaries.3 QPP has several programs, such as the Merit-based
Incentive Payment Program (MIPS) and alternative payment models (APMs), where value is quantified
via defined quality expectations, which are measured and reported, with payment either penalized or
rewarded based on performance.
Though the CMS is in some respects leading the charge in the shift from volume-based to value-based
healthcare payment reform, the impact on individual organizations varies widely based on their overall
payer mix. Another factor is what is occurring in local markets concerning Medicaid, managed care, and
commercial insurance products at the state level. Western, northern, and northeastern states have
experienced greater shifts in tying overall reimbursement to value, whereas the pace of change has
lagged in eastern, southern, and central states.4
While the verdict is still out on whether pay-for-performance programs, such as CMS’s QPP programs,
are an effective means of achieving better value in healthcare, most healthcare leaders believe that
these programs are here to stay and have been strategic about positioning their organizations to exert
control over the patient care value stream.5 In response to this new environment, organizations have
implemented strategies that include direct physician employment, alignment through Professional
Service Agreements (PSAs), and/or creation of community-based clinically integrated networks (CINs). In
particular, organizations have sought to secure sufficient primary care physician resources in recognition
that success under pay-for-performance is primarily determined by improvements made to the overall
health of specific patient populations, where primary care physicians serve on the front line via their
traditional role as gate-keepers to primary and specialty healthcare. Thus, according to the 2016
American Medical Association Physician Benchmark Survey, over 50% of family practice physicians in the
U.S. are employed by a hospital or wholly-owned subsidiary, with direct employment trends expected to
continue to increase over the next few years.6
2 Janet Weiner, PhD, MPH, Clifford Marks, MD/MBA Candidate, Mark Pauly, PhD. Effects of the ACA of Health Care Costs
Containment. https://ldi.upenn.edu/brief/effects-aca-health-care-cost-containment. Accessed February 8, 2018. 3 Department of Health and Human Services. “What’s the Quality Payment Program.” https://qpp.cms.gov/. Accessed January
31, 2018. 4.Advisory Board. “Where the States Stand on Medicaid Expansion.” https://www.advisory.com/daily-
briefing/resources/primers/medicaidmap. Accessed February 8. 2018. 5 Sabriya Rice. Physician Quality Pay Not Paying Off.”
http://www.modernhealthcare.com/article/20150530/magazine/305309979. Accessed February 8, 2018.
6 Carol K. Kane, PhD. “Policy Research Perspectives.” https://www.ama-assn.org/sites/default/files/media-
browser/public/health-policy/PRP-2016-physician-benchmark-survey.pdf. Accessed February 8, 2018.

White Paper – Using Patient Panel February 2018 Page 5 of 17
as a Principle Element in Primary Care Physician Compensation
Organizations have adopted various approaches to their physician compensation philosophy to align
physician stakeholders with the goals of value-based care. Entities such as the Mayo Clinic, the
Cleveland Clinic, and Kaiser Permanente have found success putting employed physicians on a fixed
salary as a means to reduce over-treatment of patients and incentivize quality of care and administrative
efficiency.7 More commonly, community-based healthcare systems seek to align employed physician
compensation by ensuring compensation plans reflect the organization’s risk, relative to at-risk quality
performance reimbursement. According to the 2017 Sullivan Cotter and Associates (SCA) Physician
Compensation and Productivity Survey, the median benchmark for primary care physician total
compensation tied to quality performance incentives is 7.8%.8 Quality, patient satisfaction, and
citizenship are rising in prevalence as payment methodologies change.
An essential concept in physician compensation is matching the organization’s reimbursement structure
with physician compensation incentives. The bulk of physician compensation traditionally is derived
from volume-oriented measures, such as wRVUs. However, the new value-based paradigm requires that
we consider alternative means with which to align physician compensation. Given the increasing shift in
reimbursement to reward quality outcomes and population health, physicians must focus on non-wRVU-
based activities. Thus, patient panels work well within primary care physician compensation structures
by aligning physicians, as essential stakeholders, with the reality of shifting reimbursement drivers.
WHAT IS A PATIENT PANEL?
A patient panel is commonly defined as a list of unique patients from a specific period assigned to a
physician or care team member in a medical practice. The care team (e.g., a physician, advanced
practice provider, medical assistant, and health educator) is responsible for the preventive care, disease
management, and acute episodic care for all the patients on its panel. This assignment means that a
patient will have the opportunity to receive care from the same clinician and his or her care team.9
According to the American Medical Group Association (AMGA), patient panel is further defined to be “a
provider’s population of living patients, based on a count of unique patients seen within the last 18
months.”10
The applicability of patient panel crosses many medical specialties. However, from a physician
compensation standpoint, specialties associated with primary care have the highest relevance chiefly
7 Carnegie Mellon University. “Doctors Should be Paid by Salary, not Fee-for-service, Argue Behavioral Economists.” Science
Daily, May 9, 2017. https://www.sciencedaily.com/releases/2017/05/170509121934.htm. Accessed February 8, 2018. 8 Sullivan, Cotter & Associates. “Physician Compensation and Productivity Survey.”
https://www.sullivancotter.com/surveys/physician-compensation-and-productivity-survey/. Accessed February 8, 2018.
9 Agency for Healthcare Research and Quality. “Practice Facilitation Handbook.”
https://www.ahrq.gov/professionals/prevention-chronic-care/improve/system/pfhandbook/mod20.html. Accessed February 8,
2018. 10 American Medical Group Association. “2016 AMGA Medical Group Compensation Survey Instructions and Definitions.”
http://www.amga.org/docs/AboutAMGA/AMGAC/2016_AMGA_Medical_Group_Compensation_Survey_Instructions_and_Dat
a_Definitions.pdf. Accessed February 8, 2018.

White Paper – Using Patient Panel February 2018 Page 6 of 17
as a Principle Element in Primary Care Physician Compensation
due to the functional aspects of primary care physicians serving as gatekeepers to more specialized care
within the current structure of the healthcare delivery system. Thus, they tend to have an enduring
relationship with patients, whereas many specialty care physicians are treating a specific healthcare
episode only and then releasing that patient back to their primary care physician.
Traditionally, both primary care and specialty care compensation have been all productivity-based,
where volume has been encouraged. As the reimbursement paradigm has begun to shift, so have the
incentive structures. Specifically, primary care compensation incentives are shifting to focus on
increased patient access and population health management, whereas specialty care incentives
concentrate more on specific procedures and specialized care that relates to the particular specialty.
This shift in primary care requires new measures of performance, with panel size being one of them.
In the new reimbursement environment, primary care physicians generally have embraced the concept
of managing the health of a population by encouraging patients to have a medical home. The patient
medical home has become a widely accepted model for how primary care should be organized and
delivered throughout the healthcare system and encompasses the simplest to the most complex
conditions.11 According to the Patient-Centered Primary Care Collaborative, the medical home is best
described as a “model or philosophy of primary care that is patient-centered, comprehensive, team-
based, coordinated, accessible, and focused on quality and safety.”12 Further, “the medical home is not a
final destination, rather it is a model for achieving primary care excellence so that all care is received in
the right place, at the right time, and in the manner that best suits a patient's needs.”13 Patients who
see a primary care physician within the context of a medical home become a part of that physician’s
panel for which patient health and related quality performance reimbursement incentives from CMS
and other payers are tied.
HOW IS PATIENT PANEL USED AND WHY IS IT IMPORTANT?
Having an understanding of both panel size and patient demographic enables a medical practice to
design its care delivery processes and deploy sufficient resources necessary to achieve quality outcomes.
This insight is a principal objective that CMS and other payers seek to influence through value-based
reimbursement policy. Without an understanding of the size and demographic makeup of a physician’s
panel, a practice is left to manage its operation according to what it feels is best, as opposed to making
informed decisions based on data, as evidenced by the practice’s actual patient experience.
11 Patient-Centered Primary Care Collaborative. “Defining the Medical Home.” https://www.pcpcc.org/about/medical-home.
Accessed February 8, 2018.
12 “Defining.” https://www.pcpcc.org/about/medical-home. Accessed February 8, 2018. 13 “Defining.” https://www.pcpcc.org/about/medical-home. Accessed February 8, 2018.

White Paper – Using Patient Panel February 2018 Page 7 of 17
as a Principle Element in Primary Care Physician Compensation
Because patient panels are a way for organizations to understand both the number and demographic
makeup of their patients, a panel can add value operationally to patient care improvement efforts.14, 15
Three prominent uses of panel encompass:
1. Improving access to patient care by ensuring all patients regularly receive appropriate
preventive and chronic illness care through proactive management of patient volumes.
2. Upgrading patient flow by understanding how much time and resource intensity each type of
patient will require.
3. Balancing provider workload by evenly distributing patients across all providers within a
practice.
In that the focus of this paper is on physician compensation, we will defer the further discussion of these
concepts to a later report.
Further, the panel can be tied directly to reimbursement through capitation or capitation-like
reimbursement models. In these models, the measure of productivity is a provider’s panel as opposed to
RVUs, and, therefore, there is a direct linkage between panel and reimbursement.
Finally, panel can be used as a component in compensation arrangements to incentivize physicians for
behaviors outside of only wRVU generation, as we address throughout the remainder of this paper.
WHAT IS AN IDEAL PANEL SIZE AND HOW IS PATIENT PANEL CALCULATED?
In many respects, identifying the ideal panel size has become a holy grail for many physicians and
administrators from both an efficiency and quality perspective, particularly as reimbursement continues
to be tied in greater amounts to population health and overall margins become squeezed. As a practical
matter, an ideal panel size will depend much on how a practice is staffed and operated. The ideal is to
achieve alignment between the patients’ demand for services and the practice’s availability to provide
those services via appointments with an appropriate care team resource, each practicing to their highest
and best use.
While there are several notable methodologies recommended by academia and boutique consulting
firms regarding how to calculate the ideal panel size, the most recognized methods are those proposed
by the American Academy of Family Physicians (AAFP). The AAFP recommends the incorporation of the
14 Institute for Healthcare Improvement. “Manage Panel Size and Scope of the Practice,”
http://www.ihi.org/resources/Pages/Changes/ManagePanelSizeandScopeofthePractice.aspx. Accessed February 8, 2018 15 Kristina B. Ziehler, MPH, Madeline Hyden, “Define Patient Panels to Improve Practice Flow, Patient Care,”
http://www.mgma.com/practice-resources/mgma-connection-plus/online-only/2013/february/define-patient-panels-to-
improve-practice-flow-pat. Accessed February 8, 2018.

White Paper – Using Patient Panel February 2018 Page 8 of 17
as a Principle Element in Primary Care Physician Compensation
number of average visits by unique patients seen across a 12- to 18-month timeframe, as illustrated in
AAFP’s definition, below: 16
Ideal Panel size: (the number of unique patients seen at the practice by a provider at least once
in the past 12-18 months) × visits per patient per year (demand) = provider visits per day ×
provider days per year (supply).17
As is evidenced by the above equation, this methodology suggests that a physician’s ideal panel size is
based on his or her historical levels of productivity (i.e., patient visits) over time. When calculating a
physician’s ideal panel size, consideration should be given to future FTE status changes or changes in
practice type or patterns.
For calculating a primary care physician’s current panel size, AMGA and SCA suggest panel size should be
calculated by understanding a physician’s population of living patients, based on a count of unique
patients seen within the last 18 months, using the following calculation:18
Patients are assigned to a provider by the following: Patients who have seen only one provider
for all visits, verified within the last three years, are assigned to that provider. If a patient does
not have a personal provider identified, the patient is assigned to a provider based on whom the
patient saw the most often. If the patient has seen multiple doctors the same number of times,
the patient is assigned to the provider seen most recently.19
According to 2017 national blended benchmark survey data from AMGA20 and SCA21 for family medicine,
internal medicine, and general pediatric physicians, median panel size approximates 1,750 to 1,825 for
all three specialties, with the 25th percentile ranging between 1,300 to 1,430 unique patients and the
75th percentile approximating 2,300 to 2,400 unique patients, as illustrated in Figure 1.
16 Note: According to the AAFP, some practices might prefer to use data from the past 12 months; however, this method tends
to underestimate the panel size, as many patients do not visit the practice within a year. 17 Mark Murray, MD, MPA, Mike Davies, MD, Barbara Boushon, RN. “Panel Size: How Many Patients Can One Doctor Manage?”
https://www.aafp.org/fpm/2007/0400/p44.html. Accessed February 8, 2018. 18 Note: AMGA further recommends that the panel be adjusted for age and gender, which we address further in this paper. 19 American Medical Group Association. “2016 AMGA Medical Group Compensation and Productivity Survey Instructions and
Data Definitions.”
http://www.amga.org/docs/AboutAMGA/AMGAC/2016_AMGA_Medical_Group_Compensation_Survey_Instructions_and_Dat
a_Definitions.pdf. Accessed February 8, 2018. 20 American Medical Group Association. “Medical Group Compensation and Financial Survey: 2017 Report Based on 2016 Data.”
http://www.amga.org/wcm/PI/wcm/PI/SAT/physComp_sat.aspx. Accessed February 8, 2018 21 Sullivan Cotter. “Physician Compensation and Productivity Survey.” https://www.sullivancotter.com/surveys/physician-
compensation-and-productivity-survey/. Accessed February 8, 2018.

White Paper – Using Patient Panel February 2018 Page 9 of 17
as a Principle Element in Primary Care Physician Compensation
Figure 1: Panel Size Market Data Summary
Market Data Summary - Panel Data
National Average (AMGA, SCA)
25th %ile 50th %ile 75th %ile 90th %ile
Family Medicine - Panel Size (AMGA, SCA) 1,378 1,822 2,325 2,925
Internal Medicine - Panel Size (AMGA, SCA) 1,303 1,752 2,385 2,932
General Pediatrics - Panel Size (AMGA, SCA) 1,429 1,820 2,405 3,030
While certainly not representative of every practice, national survey data indicate that most physicians,
on average, manage a panel of at least 1,600 to 2,000 patients. A significant percentage of physicians
manage a panel of over 2,300 patients, though relatively few physicians have a panel of more than 3,000
patients. This degree of variation is influenced by multiple factors, including practice style, patient
demographics, and the make-up of the care team, which we discuss further below.
IMPACT OF PATIENT AGE, GENDER, AND ACUITY ON A PANEL
Physicians can at times claim that their patients are older and sicker than those on the panels of other
peer physicians, which should, therefore, justify a relatively smaller panel and/or other consideration.
These arguments can become self-fulfilling prophecies, as physicians can prove that their patients have
higher acuity by creating more return visits, which increases demand, or longer visits, which limits
supply.22 From an industry perspective, no single solution fits all applications for adjusting for risk factors
such as age, gender, and overall acuity. There are multiple methods on how best to account for these
variations, from straightforward approaches, like those suggested below, to more complex
methodologies, as in CMS’s approach of utilizing physician documentation and claims data to derive
their own risk adjustment factor scores.23 As the healthcare delivery system and resulting payment
methodologies continue to evolve, particularly within the current value-based environment, the
approaches to risk adjustment are likely to change as well.24
Because patients are human and each is distinct and special in design and physiological makeup, patient
panels similar in number are not necessarily comparable in acuity at any single point in time. For
example, a panel of 1,000 patients largely consisting of a geriatric population will look very different
from an encounters and charges perspective than a panel of 1,000 patients, representative of a
population of 25 to 35 years old. In many practices, panel acuity tends to balance out over time,
particularly in those practices that cater to a similar patient population and payer mix. In other practices,
due to many factors, real variation in acuity can exist.
22 Murray, et al. “Panel Size.” https://www.aafp.org/fpm/2007/0400/p44.html. Accessed February 8, 2018. 23 Centers for Medicare and Medicaid Services. “Risk Adjustment Fact Sheet.” https://www.cms.gov/Medicare/Medicare-Fee-
for-Service-Payment/PhysicianFeedbackProgram/Downloads/2015-RiskAdj-FactSheet.pdf. Accessed February 8, 2018. 24 Murray, et al. “Panel Size.” http://www.aafp.org/fpm/2007/0400/p44.html. Accessed February 8, 2018.

White Paper – Using Patient Panel February 2018 Page 10 of 17
as a Principle Element in Primary Care Physician Compensation
There are four approaches organizations commonly use to adjust for patient age and gender as a proxy
for overall panel acuity:
1. No Adjustment. Given the complexities associated with calculating patient panel, many
organizations opt not to adjust for panel acuity largely in recognition that the physician
compensation plan strikes a reasonable balance between volume-based incentives, such as
patient visits and wRVUs, and non-productivity-based incentives, such as using panel and quality
outcomes as a component of physician compensation, which we discuss further below.
2. Self-Adjustment. In recognition that patient age and gender can be used to predict visit
utilization and, by proxy, reflect acuity, particularly when analyzing panel data across a longer
time horizon, for example, 18 to 36 months, some organizations will self-adjust a panel for
patient acuity by dividing patients into defined subsets based on gender and age, and calculating
an average visit rate per subset or class of patient. Then by averaging all subsets together to
derive an average patient visit rate for the entire panel population, an average visit baseline can
be established from which comparisons can then be made to the various patient subsets to
determine the impact of age/gender on the overall panel.
For instance, a patient panel of 2,000 patients may have an average visit rate of 2, but when
dividing the data into demographic subsets, one may find that women 20 to 30 years old have a
1.5 annual visit rate, and therefore are 25% less likely to visit the physician. A male between 50
to 60 years old may have a visit rate of 3, thereby implying 50% more likelihood to visit the
physician across a given period. Thus, if a particular physician has a predominantly older patient
panel, the above methodology can be used as a rational basis to adjust for patient acuity when
compared to peer physicians with less acute panel demographics.
3. Utilize Industry Adjustment Factors. Similar to the self-adjustment methodology described
above, after analyzing large patient visit data sets, organizations like AMGA and AAFP provide
subpopulation categories and adjustment factors for patient age and gender based on an
average patient visit rate per year, as illustrated in Figure 2.25,26
25 AMGA. “2016 AMGA Medical Group Compensation and Productivity Survey Instructions and Data Definitions.”
http://www.amga.org/docs/AboutAMGA/AMGAC/2016_AMGA_Medical_Group_Compensation_Survey_Instructions_and_Dat
a_Definitions.pdf. Accessed February 8, 2018. 26 Murray, et al. “Panel Size.” http://www.aafp.org/fpm/2007/0400/p44.html. Accessed February 8, 2018.

White Paper – Using Patient Panel February 2018 Page 11 of 17
as a Principle Element in Primary Care Physician Compensation
Figure 2: AMGA/AAFP Age and Gender Panel Adjustment Table
Age Relative Weight
Years Male Female
0-1 5.02 4.66
1 3.28 2.99
2 2.05 1.97
3 1.72 1.62
4 1.47 1.46
5-9 0.98 1.00
10-14 0.74 0.79
15-19 0.54 0.72
20-24 0.47 0.70
25-29 0.60 0.82
30-34 0.63 0.84
35-39 0.66 0.86
40-44 0.69 0.89
45-49 0.76 0.98
50-54 0.87 1.10
55-59 1.00 1.20
60-64 1.17 1.31
65-69 1.36 1.46
70-74 1.55 1.60
75-79 1.68 1.70
80-84 1.70 1.66
85+ 1.57 1.39
While many sophisticated information systems can be programmed to auto-adjust physician
panel data based on gender and age using straightforward inputs and algorithms, such as those
represented in the above table, the process is complex and requires caution to ensure
adjustment factors are applied equally across all variables.
4. Staff/Resource Adjustment. Instead of making adjustments to the panel for perceived impacts
of patient acuity, many organizations have found success in evaluating the demands of a
particular practice relative to patient demographic needs of age/gender make-up. They have
deployed additional care team support, e.g., care managers, social workers, and mental health
professionals, to address the needs of a specific panel subpopulation, thereby mitigating the
need for panel acuity adjustments.27
Before using the panel as a physician compensation strategy, it is essential first to have a clear
understanding of panel calculation methodologies as well as how to make desired adjustments for
27 Murray, et al. “Panel Size.” http://www.aafp.org/fpm/2007/0400/p44.html. Accessed February 8, 2018.

White Paper – Using Patient Panel February 2018 Page 12 of 17
as a Principle Element in Primary Care Physician Compensation
patient acuity. Without this perspective, it is not realistic to use the patient panel as a compensation
component. One cannot incentivize what one cannot track.
PANEL AS A PRIMARY CARE PHYSICIAN COMPENSATION STRATEGY
Physicians who are compensated primarily under the fee-for-service model may need the overall
compensation arrangement to be revisited to achieve the objectives established under MIPS and other
value-based programs successfully. Failure to align compensation incentives with the goals of these
programs may increase the risk of penalties for overutilization of services that may be encouraged by
the volume-based practice mindset. From a structural standpoint, we recommend that all incentives,
including potential compensation for panel, be carved out of a target rate per wRVU rather than added
on top of the target rate per wRVU. This concept is illustrated in Figure 3, below:
Figure 3: Allocation of Value Within Compensation Model Structure
This best practice ensures that the model structure is being driven by a value that will produce total
compensation aligned within fair market value parameters and can be managed in an economically
sustainable manner.
Below is a summary of four compensation approaches that recognize the physician panel and,
consistent with the shift in reimbursement policy discussed above, can be used to integrate a physician’s
performance relative to value-based measures as the mechanism through which derived panel
compensation should be distributed. These four compensation approaches are presented sequentially,
where the physician incurs an increasing amount of risk based on the overall panel size and the quality
outcomes associated with that panel.
1. PMPM/PMPY Panel Add-On Approach. A straightforward way for an organization to
compensate physicians based on the panel size is to treat panel compensation as an add-on
component within the context of the existing physician compensation plan. A PMPM/PMPY
compensation value can be established and payment calculated by multiplying this value by the
physician’s panel size. For illustration purposes (see Figure 4), we will set a per member
compensation value at $10.00 per member per year (or $.833 PMPM). Assuming the physician’s
panel size consists of 2,000 patients, the physician’s panel incentive opportunity would be
$20,000, with the distributions of this amount treated as pass-through compensation.

White Paper – Using Patient Panel February 2018 Page 13 of 17
as a Principle Element in Primary Care Physician Compensation
Figure 4: PMPY Panel Add-On Approach
Illustration Total Note
Primary Care Panel Size 2,000 A
Panel Incentive Weight - PMPY $10.00 B
Panel Stipend $20,000 A x B = C
Though somewhat simplistic, starting to compensate for panel begins to draw the physician’s
attention to the organization’s areas of focus, such as access, team-based care, and recognition
of work that is not wRVU-generating in managing a population of patients. The physician has no
risk relative to outcomes of care; instead, the purpose is to introduce the physician to various
elements to which organizational reimbursement is tied.
To ensure total cash compensation payments to physicians remain within market norms, we
recommend the factoring of panel compensation into the overall economics of the
compensation arrangement. This method is opposed to treating cash compensation strictly as
an add-on component, where additional compensation is added on top of an already market-
based compensation arrangement.
2. PMPM/PMPY Panel and Quality Compensation Approach. Given the healthcare industry’s
emphasis on population health management and the rapid pace of reimbursement policy
changing to incentivize the proactive management and clinical outcomes of them, we would
advocate that primary care physician compensation models institute a direct link between the
physician’s panel, where the physician is responsible for the health of a sub-population of
patients, and the overall quality outcomes related to that panel. This approach can be
accomplished by making the distributions of a panel compensation opportunity contingent upon
performance relative to established quality-based measures.
Using the example in Figure 4 for establishing a panel compensation opportunity, we can derive
the physician panel opportunity of $20,000. By making the distribution of the panel
compensation opportunity contingent on quality goals that are established, in alignment with
MIPS and other value-based payer contracts, the physician begins to bear some risk for the
overall health of his or her panel (see Figure 5).

White Paper – Using Patient Panel February 2018 Page 14 of 17
as a Principle Element in Primary Care Physician Compensation
Figure 5: PMPY Panel Quality Compensation Approach
Illustration Total Note
Primary Care Panel Size 2,000 A
Panel Incentive Weight - PMPY $10.00 B
Panel Incentive Opportunity $20,000 A x B = C
Quality Performance Score (Results) 75% D
Panel Incentive Compensation $15,000 E = C x D
Before putting panel compensation opportunity at risk, consideration should be given to
understanding the outcomes an organization would like to achieve through this strategy. Critical
areas of focus should be identified with respect to what the physician can influence within the
scope of his or her practice. For example, CMS has identified four areas of focus within the MIPS
program for 2018 encompassing Quality, Cost, Clinical Improvement Activities, and Advancing
Care Information.28 Further, each of the MIPS areas of focus has established measures with a set
weighting, or allocation percentage, by which overall performance is evaluated, and incentive
payments, or penalties, are assessed via reimbursement to the practice.
3. Medical Group Panel Compensation Approach. For a medical group or practice to be successful
financially under pay-for-performance programs such as MIPS, the members should work
together to achieve quality performance outcomes to attain available incentive-based
reimbursement. Depending on how an organization chooses to report data under the MIPS
program, reimbursement incentives or penalties may be paid at the entity level versus the
individual physician level. An option for integrating a physician’s panel and related quality
performance with the group’s overall panel is to pool panel opportunity dollars into a group
panel incentive pool and then allocate the group’s panel incentive pool back to the respective
physicians based on the individual physician’s relative panel size.
Organizations can connect both volume and value within a panel-based compensation structure
by linking the collective productivity of all physicians (e.g., wRVUs or patient visits) with the
group’s collective panel size and then making distributions contingent based on overall
performance against established quality measures. For illustration purposes, we establish a rate
of $4.08 per physician wRVU, which when multiplied by all primary care physicians’ wRVUs
funds a collective Group Panel Incentive Pool. The group’s total panel size in the aggregate is
then divided into the Group Panel Incentive Pool to derive a Per Panel Member Rate. The Per
Panel Member Rate multiplied by the individual physician’s panel size equals the physician’s
Panel Incentive Opportunity. Similar to method two described above, Panel Incentive
Opportunity is then distributed as determined by the individual physician performance against
established quality performance measures.
28 Centers for Medicare and Medicaid Services. “Quality Payment Program Year 2.” https://www.cms.gov/Medicare/Quality-
Payment-Program/resource-library/QPP-Year-2-Final-Rule-Fact-Sheet.pdf. Accessed February 18, 2018.

White Paper – Using Patient Panel February 2018 Page 15 of 17
as a Principle Element in Primary Care Physician Compensation
Figure 6: Medical Group Panel Compensation Approach
Illustration Total Note
Total Group Primary Care wRVUs 122,500 A
Panel Incentive (per wRVU) Rate $4.08 B
Total Group Panel Incentive Pool $499,996 A x B = C
Total Primary Care Panel Size (Group) 50,000 D
Per Panel Member Rate $10.00 C / D = E
Individual Physician’s Panel Size 2,000 F (per MD)
Panel Incentive Opportunity $20,000 G = E x F
Quality Performance Score (Results) 75% H
Panel Incentive Compensation $15,000 I = G x H
The medial group panel compensation approach (see Figure 6) places a subtle governor on
physician churn-type productivity by creating a law of diminishing returns on productivity not
spent growing the panel or equitably rendering care across the panel due to the fact that Per
Panel Member Rate results from all wRVUs generated by the group. This matter becomes a
significant factor in deriving an individual physician’s Panel Incentive Opportunity. Highly
productive physicians may feel they are subsidizing less productive physicians because of the
Per Panel Member Rate. However, this methodology is consistent with value-based program
reimbursement incentives where greater emphasis is given to the health outcomes of a
population versus a physician’s productivity needed to achieve those outcomes.
4. Derivation of Base Pay Approach. Organizations that have adopted a largely at-risk contracting
strategy, such as capitation and/or significant at-risk-shared savings arrangements, or
organizations located in areas of the country where the local and state environment is such that
reimbursement is largely capitated, can structure physician compensation models to let the
panel size drive the majority of compensation, as opposed to wRVU productivity or other related
methodologies. This approach only makes sense when organizations are fully prepared to shift
away from wRVU-based pay.
As an example, compensation may be derived using a PMPM amount, which for illustration
purposes we will set at $10.00. Thus, a panel of 2,000 patients would equate to total annual
compensation of $240,000. Using the allocation of value concept discussed above, $9.00 of the
$10.00 PMPM (approximately 90%) could be guaranteed, with the remaining $1.00 at-risk based
on performance against established quality performance measures.
White Paper – Using Patient Panel February 2018 Page 16 of 17
as a Principle Element in Primary Care Physician Compensation
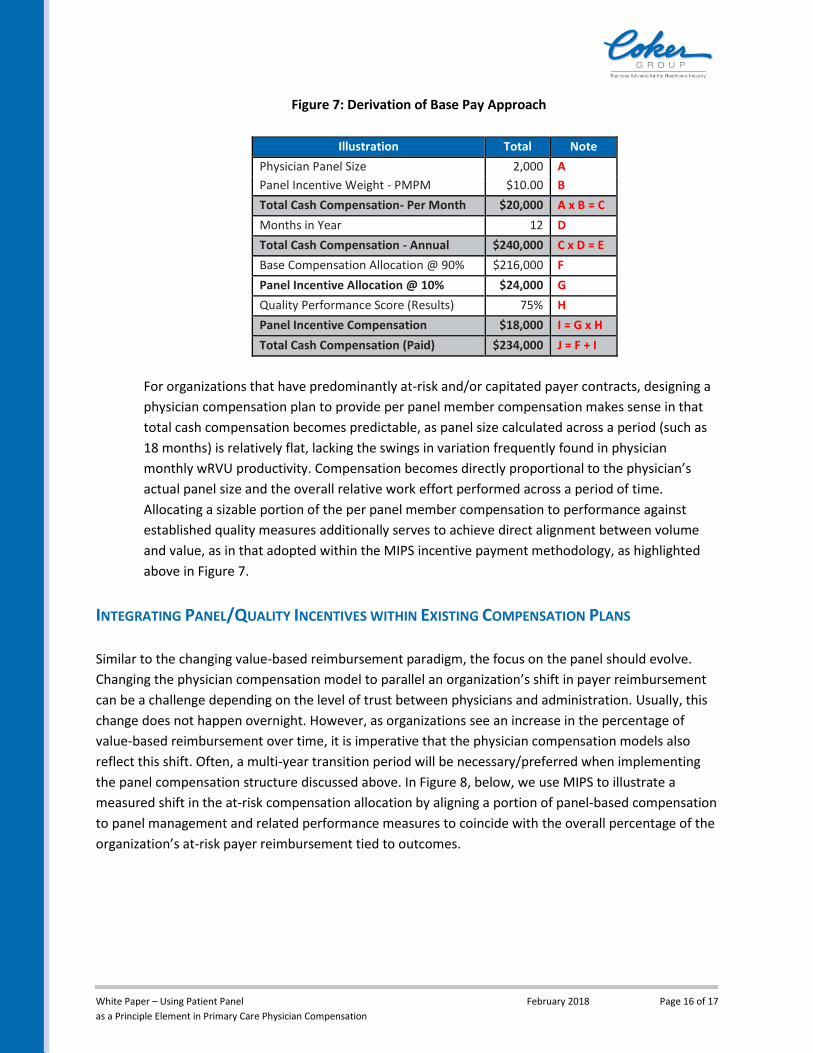
Figure 7: Derivation of Base Pay Approach
Illustration Total Note
Physician Panel Size 2,000 A
Panel Incentive Weight - PMPM $10.00 B
Total Cash Compensation- Per Month $20,000 A x B = C
Months in Year 12 D
Total Cash Compensation - Annual $240,000 C x D = E
Base Compensation Allocation @ 90% $216,000 F
Panel Incentive Allocation @ 10% $24,000 G
Quality Performance Score (Results) 75% H
Panel Incentive Compensation $18,000 I = G x H
Total Cash Compensation (Paid) $234,000 J = F + I
For organizations that have predominantly at-risk and/or capitated payer contracts, designing a
physician compensation plan to provide per panel member compensation makes sense in that
total cash compensation becomes predictable, as panel size calculated across a period (such as
18 months) is relatively flat, lacking the swings in variation frequently found in physician
monthly wRVU productivity. Compensation becomes directly proportional to the physician’s
actual panel size and the overall relative work effort performed across a period of time.
Allocating a sizable portion of the per panel member compensation to performance against
established quality measures additionally serves to achieve direct alignment between volume
and value, as in that adopted within the MIPS incentive payment methodology, as highlighted
above in Figure 7.
INTEGRATING PANEL/QUALITY INCENTIVES WITHIN EXISTING COMPENSATION PLANS
Similar to the changing value-based reimbursement paradigm, the focus on the panel should evolve.
Changing the physician compensation model to parallel an organization’s shift in payer reimbursement
can be a challenge depending on the level of trust between physicians and administration. Usually, this
change does not happen overnight. However, as organizations see an increase in the percentage of
value-based reimbursement over time, it is imperative that the physician compensation models also
reflect this shift. Often, a multi-year transition period will be necessary/preferred when implementing
the panel compensation structure discussed above. In Figure 8, below, we use MIPS to illustrate a
measured shift in the at-risk compensation allocation by aligning a portion of panel-based compensation
to panel management and related performance measures to coincide with the overall percentage of the
organization’s at-risk payer reimbursement tied to outcomes.

White Paper – Using Patient Panel February 2018 Page 17 of 17
as a Principle Element in Primary Care Physician Compensation
Figure 8: Transition of At-Risk Panel/Quality Performance Allocation – Illustration
Allocation 2018 2019 2020 2021 2022
At-Risk per Payer Contracts (MIPS) +/-4% +/-5% +/-7% +/-9%
Clinical/Productivity Compensation 100% 92% 90% 86% 82%
At-Risk Panel/Quality Performance Incentive Compensation 0% 8% 10% 14% 18%
Clinical TCC 100% 100% 100% 100% 100%
CONCLUSION
Value-based payment initiatives, such as the MIPS program, have the attention of administrators and
physicians. All parties need to work together to find ways to achieve better health outcomes at lower
costs. Shifts in reimbursement from volume to value will continue to see year-over-year increases for
the future. For the objectives of these value-based programs to be realized and maximum
reimbursement opportunity achieved, primary care physicians must actively participate in the change
efforts, particularly as they relate to the delivery of medical care within the practice setting.
In this paper, we have suggested that primary care physician compensation should keep pace with the
current change in healthcare reimbursement, where population health is of primary focus. Incorporating
patient panel as an essential element in the physician compensation model is a viable and crucial
strategy. Historical efforts to recognize panel size and related management by merely paying a pass-
through PMPM management fee will no longer suffice in an outcome-based environment, apart from
aligning these payments with a panel’s overall health outcomes. There are five key issues to address
when deciding how to approach panel compensation methodology:
1. Align the organization’s strategy with respect to at-risk contracting as well as local and state
market factors relative to at-risk reimbursement.
2. Adopt a patient attribution methodology that reflects the overall physician effort to care for the
organization’s patients.
3. Establish meaningful quality (outcome) measures tied to value-based programs that the
physician can affect.
4. Provide transparent quality performance data in predictable intervals throughout the year. and
5. Ensure the overall value of panel/quality at-risk compensation is set at a level that matches the
efforts required to achieve the desired outcomes.
Adopting an integrated panel/quality compensation approach for primary care physician compensation
will enable administrators and physician leaders to achieve better alignment, and by extension, better
results with respect to value-based program performance and related outcomes.