using plants to reduce energy - purdue university
TRANSCRIPT

Junior Cho is a graduate of mechanical engineering technology at Purdue University. He showcased his talents and experience as a Navy Seabees Veteran working as an electrician for Purdue University’s entry into the 2011 Solar Decathlon, the INhome. Cho is currently fulfi lling a career with the United States Navy and eventually would like to pursue his interests with a career in alternative energy and energy sustainability.
Jordan Mansfi eld graduated with a bachelor’s degree in mechanical engineering technology in May 2013. As an undergraduate, he was the president of Purdue University’s American Society of Heating, Refrigerating, and Air-Conditioning Engineers (ASHRAE) chapter and a technician in Knoy Hall of Technology’s Applied Energy Laboratory (AEL). His interests in sustainable technologies and energy stemmed from his involvement with AEL projects such as retro-commissioning the solar array on Knoy Hall’s rooftop and installing and troubleshooting new components in the lab’s mechanical systems.
Kyle Krockenberger graduated from the College of Technology at Purdue University with a bachelor’s degree in mechanical engineering technology in May 2013. He is an intern within Purdue working with energy, sustainability, and building automation systems. His interest in energy and sustainability has led him to the decision of continuing his education at Purdue, under Professor William Hutzel, working toward a master’s degree. Krockenberger is also a member of ASHRAE.
student authors
William Hutzel is a professor of mechanical engineering technology and is a licensed professional engineer. His teaching and research is related to high-performance buildings. He was the faculty leader for Purdue University’s participation in the 2011 Solar Decathlon. He manages the Applied Energy Laboratory, which features commercial HVAC equipment and solar energy systems that are monitored and controlled by web-enabled building automation systems.
Mentor
abstractIndoor air quality (IAQ) is an important measure of a healthy environment in which one works or lives. Traditional methods of improving IAQ can be costly. This research evaluated the Biowall designed for the INhome, Purdue University’s 2011 Solar Decathlon entry. The Biowall is a living wall of plants that is integrated with an HVAC system in a building to improve indoor air quality using natural processes. This research tested if the Biowall improves IAQ and reduces air-conditioning energy costs. Data was collected using a web-based control system that tracks energy use, runtime of appliances, levels of CO2 and volatile organic compounds (VOCs), humidity, and temperature of the indoor air. Two different operating modes were evaluated: baseline days and experimental days. This research suggests that the IAQ was improved when the Biowall was operational. Further research into a more effi cient Biowall design with less energy requirements is underway.
Cho, J., Mansfi eld, J., & Krockenberger, K. (2013). Using plants to reduce energy: Evaluation of energy, indoor air quality, and biofi ltration performance of a biowall. Journal of Purdue Undergraduate Research, 3, 24–31. http://dx.doi.org/10.5703/jpur.03.1.04
Keywordsbotanical air fi ltration, CO2, HVAC, indoor air quality, INhome, net zero energy, volatile organic compounds
U s I n G P l a n t s t o R e D U c e e n e R G Y
24 journal of purdue undergraduate research: volume 3, fall 2013http://dx.doi.org/10.5703/jpur.03.1.04

Junior Cho, Jordan Mansfi eld, and Kyle Krockenberger, Mechanical Engineering Technology
Figure 2. The Biowall fi lter as seen in the solar home.
IntRoDuCtIonIn 1989, a joint study was conducted by NASA and the Associated Landscape Contractors of America (ALCA), which concluded that certain plants had a propensity for improving indoor air quality (IAQ), namely by removing volatile organic compounds (VOCs) and carbon dioxide (CO2) and simultaneously emitting oxygen. Among the highest ranked plants from the study were the Philodendron scandens, or heartleaf philodendron (Salisbury, Gitelson, & Lisovsky, 1997).
The Biowall (BW) was an organic vertical plant wall that served as an air fi lter, which utilized the plants’ ability to remove harmful chemicals using heartleaf philodendron arranged vertically. This innovative technology was placed directly in line with the home’s return duct to assist with the IAQ issues associated with tightly sealed buildings. Air from the home was drawn across the BW, where the chemicals were removed by the plants and used as a food source (Figure 2). The intent of the BW was to help purify air in the home, reducing the need to mechanically introduce fresh air, which is costly to heat and cool.
The INhome was Purdue University’s entry into the 2011 U.S. Department of Energy Solar Decathlon. The home now resides in Chatham Square, a subdivision in Lafayette, Indiana, off of Shenandoah Drive. The INhome is an airtight building. While being more effi cient with heating and cooling, it can have other problems such as dead air or develop sick building syndrome, which demonstrates the need for an air purifying method such
as a BW being integrated into the heating, ventilation, and air-conditioning (HVAC) system. Once a competition piece and now a valuable learning tool, the INhome provided a unique laboratory to conduct an experiment on the effi cacy of the BW.
The experiment was conducted over the course of several days from July 2012 to September 2012. Baseline days with similar weather conditions were established as
U s I n G P l a n t s t o R e D U c e e n e R G Y :Evaluation of Energy, Indoor Air Quality, and Biofi ltration Performance of a Biowall
Figure 1 (above). Interior architectural photograph of Purdue's INhome with the Biowall seen on the right. Courtesy of U.S. Department of Energy—photo taken by Jim Tetro.
using plants to reduce energy 25

Figure 3. Layout of INhome HVAC system.
Figure 4. The HVAC mechanical design schematic.table 1. ERV and DD control strategy testing parameters for experimental conditions.
Experimental Dates Test ERV DD coil DD fan
Aug. 24–27, 2012 1 auto off autoAug. 27–31, 2012 2 off off auto
Aug. 31–Sept. 3, 2012 3 off auto autoSept. 3–7, 2012 4 auto auto auto
experimental controls. Experimental days were varied with different modes of operations for the HVAC components. Measurements of IAQ, temperature, relative humidity (RH), CO2, and VOC were taken for all experimental conditions, and the data were analyzed to evaluate the performance of the HVAC system and the BW. A method to measure supply and return airfl ows for different modes of operation of the HVAC system and the BW were developed. Performance of the BW was evaluated to test the hypothesis that a BW has potential for reducing energy use in a residential building while maintaining reasonable levels of IAQ.
The key fi ndings of this investigation are that the BW reduced the INhome’s CO2 and VOC levels and reduced energy use of other HVAC components. However, it did not reduce net energy use due to high energy consumption of the BW’s components. Based on the fi ndings of this experiment, design recommendations were given, which are explained further in the conclusion section of this report.
exPeRIMentsummary of hVaC system and sensorsThe major components of the INhome’s HVAC system were the BW, energy recovery ventilator (ERV), heat pump (HP), air handling unit (AHU), and ducted dehumidifi er (DD). These components worked together to provide fresh and clean air for the INhome while keeping heating and cooling energy effi cient. The BW was constantly running by having a fan in the DD pull air across it and into the return air ducts. The ERV and DD were run on an as-needed basis to introduce fresh air and remove excess humidity from the INhome.
The ERV was not integrated with the HVAC system; it was a completely separate system with isolated ductwork independent of the HVAC system and the BW. Air was conditioned and moved by the ERV into the home when fresh air was needed.
The BW return duct was on a separate branch of the return air ventilation. It fi ltered the air via the return air ducts back into the AHU, which was a Trane brand.
The DD was placed downstream of the BW and was programmed to remove excess humidity once a certain level was reached. A fan inside the DD created a stream of fl owing air across the plants of the BW.
The Trane AHU was installed as a traditional HVAC system and drew air through the return ventilation while supplying conditioned air to the INhome.
hVaC sensorsThe INhome included various sensors placed throughout the interior and exterior of the structure. These sensors monitored temperature, RH, CO2, and VOC levels. The sensors acted as inputs for the automated logic software, which controlled the entire house remotely. Thresholds were set for operating ranges so that the INhome’s HVAC environment was controlled precisely. The sensors were used in several different confi gurations, including wall mounts, duct mounts, and outdoor sensors.
Supply Air
Return Air
1. Biowall (BW)2. air handling unit (ahu)3. energy Recovery Ventilator (eRV)4. heat Recovery (hR)
26 journal of purdue undergraduate research: volume 3, fall 2013

Component power consumption in kilowatts (kW) and operating time in hours (h) were collected for the baseline and experimental days of each control strategy. Energy use in kilowatt-hours (kWh) of the BW, DD, AHU, HP, and ERV were then found by multiplying operating time by power consumption. The amount of energy used during each control strategy test by component and overall was found using the equations below, where n correlates with the control strategy used and i represents the number of days examined in each strategy.
throughout the house. In order for the INhome’s energy consumption to be monitored, a platform called eMonitor was chosen and installed in the home. This was a web-based system that individually monitored the electrical consumption on every circuit in the home. The system had the ability to monitor individual circuits in addition to net consumption of the house.
During the experiment, data were collected manually using two different methods. The fi rst involved using hot-wire anemometers to record the HVAC system’s supply and return airfl ows. The second method utilized Aircuity, research-grade IAQ sensors that collected CO2 and VOC levels for the INhome’s zone (ZN) and return air (RA).
The reasons behind executing these manual data collection procedures are justifi ed by the following: (a) supply and return airfl ow measurements were necessary in order to evaluate the performance of the BW and (b) to validate the data collected and used from the originally installed commercial-grade IAQ sensors at the INhome.
On August 29, 2012, students went to the INhome and recorded data of the supply and return airfl ow rates using hot-wire anemometers. This was accomplished by fi rst measuring the area (ft2) of every supply and return register of each room. Next, hot-wire anemometers were placed in several locations across each register, and the velocity of the air was recorded in feet per minute. Once all of the measurements were collected for each supply and return register, an average air velocity was calculated and multiplied by the area of the register to give an average airfl ow in cubic feet per minute (cfm).
The individual component energy consumption values were combined to determine the total energy consumed during each control strategy using the equation:
Manual Data Collection/Measurements Three separate software programs were used to monitor and record data in real time and to look back days, weeks, or even months in order to compare how various components of the system reacted to different internal and external parameters. A building control platform commonly used in commercial buildings, Automated Logic Controls (ALC) handled the control needs of the ERV and DD. WebCTRL was a web-based platform used to interface with the ALC platform. It displayed the data stored in the ALC from the various sensors located
Figure 5. Linear correlation between both types of sensors’ CO2 readings validated data collected from the commercial-grade sensors.
using plants to reduce energy 27

Figure 6. Control strategy 1 operating time.
Figure 7. Control strategy 2 operating time.
Figure 8. Control strategy 3 operating time.
Figure 9. Control strategy 4 operating time.
Finally, two Aircuity sensors were placed in the INhome. One was placed in the kitchen, representing the ZN IAQ levels, and the other was placed in the return duct downstream from the BW.
experimental Control/Baseline DaysA baseline day with similar weather conditions to the experimental day in which the BW was not installed was established as an experimental control. Criterion for similarity in order of importance included temperature, RH, wind, and sunlight exposure, respectively. Data used to establish the baseline day as an experimental control came from the National Oceanic and Atmospheric Administration’s database for Lafayette, Indiana.
A comparison of the IAQ between the baseline and experimental days was made to verify the proper functioning of the HVAC system in regulating IAQ. The criteria for measuring IAQ were temperature, RH, VOC, and CO2.
Figure 5 illustrates data collected over the same time periods between the research-grade Aircuity sensors and the commercial-grade permanently installed sensors for CO2 levels.
Figure 5 shows that the CO2 levels from the experimental day indicate a strong linear correlation between the research-grade and commercial-grade sensors for both the ZN and the BW. This verified the accuracy of the commercial-grade sensors and allowed them to be used throughout the remainder of the BW testing.
eneRGY analYsIs operating time Figures 6–9 show a side-by-side comparison of component operating time between the experimental and baseline day for each of the four control strategies executed throughout the experiment. In addition, the DD and BW were installed but not in operation (turned off) during the baseline comparison days chosen for each control strategy. This was done to compare how the energy use per HVAC system component was affected before and after a BW installation.
Test 1 shows that the DD ran for approximately 84 hours during the experimental days (Figure 6). This was due to the control strategy used for test 1, but also it may have been impacted by weather conditions during that time frame. Test 2 shows the AHU and ERV operating for a longer amount of time than the other components (Figure 7), whereas tests 3 (Figure 8) and 4 (Figure 9) show relatively similar operating times across each device.
28 journal of purdue undergraduate research: volume 3, fall 2013

Figure 10. Control strategy 1 energy consumption.
Figure 11. Control strategy 2 energy consumption.
Figure 12. Control strategy 3 energy consumption.
Figure 13. Control strategy 4 energy consumption.
energy Consumption Figures 10–13 are similar to the operating time charts in that they show a side-by-side comparison of energy use between the experimental and baseline days for each component, in addition to the overall HVAC system energy consumption.
Control strategies 1 (Figure 10) and 2 (Figure 11) show a marked increase in net energy consumed; the HP, AHU, and ERV each depict an increase in energy consumption for the two control strategies as well. However, although control strategies 3 (Figure 12) and 4 (Figure 13) yielded an increase in net energy consumption, the HP and AHU both show a decrease in energy consumption from the baseline to experimental day.
Figure 14 shows an average of how much the BW cleaned the air from CO2 on a daily basis. Located on the x-axis are the dates the CO2 data was evaluated, and the average CO2 differential is located on the y-axis. The units associated with CO2 are parts per million (ppm).
The area located under the curve signifies the differential between the zone CO2 level and the level after filtering through the BW. This differential represents the amount of clean air the BW produced. To clarify, the average differential for August 24 is just below 30 ppm; this represents that the BW cleaned the zone air by 30 ppm on average during that day.
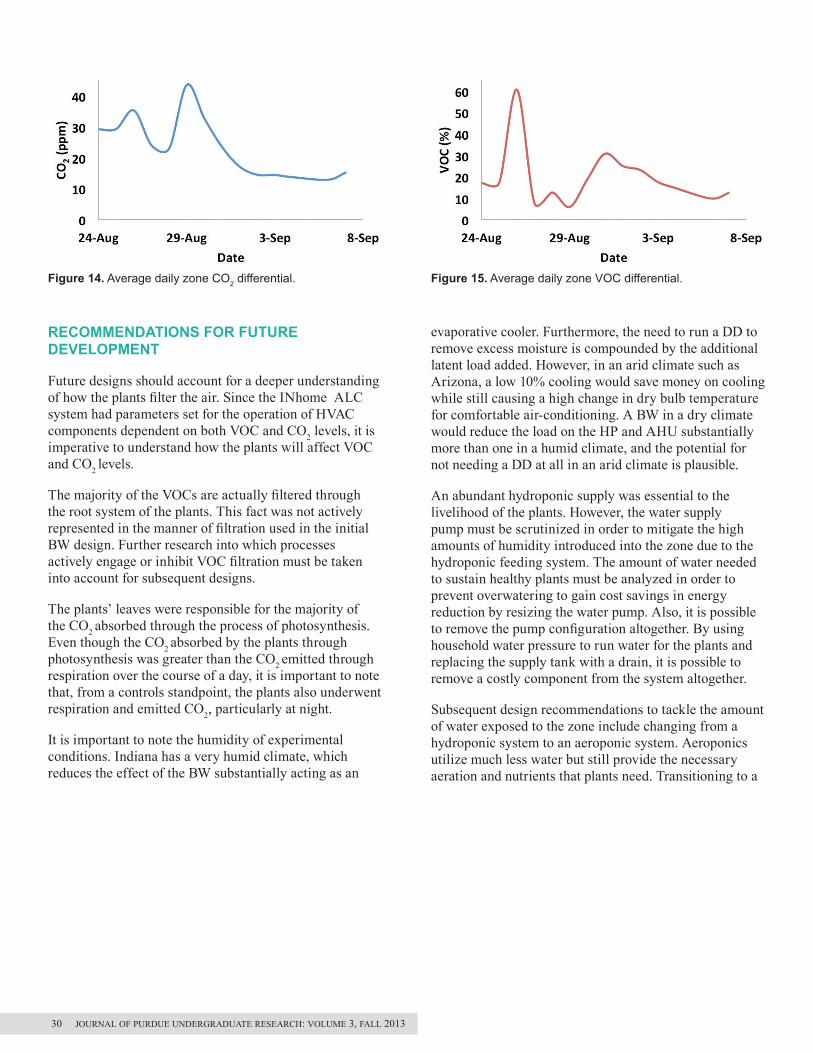
Figure 15 represents, on average, how much the BW cleaned the VOCs from zone air on a daily basis. Located along the horizontal axis are the dates associated with the CO2 data collected, and the average VOC differential is located on the vertical axis. The units associated with VOC are overall percentages of VOC in the air.
Similar to the CO2 chart (Figure 14), the area located under the curve represents the differential between the zone level and the level of VOC after filtering through the BW. For example, on August 26, the average differential was roughly 60%. This means that the VOC levels decreased approximately 60%, on average, throughout that day.
Interpreting the results, one can see that the BW made a positive impact on IAQ. The average clean air produced for the total duration of the experiment for CO2 and VOC levels was 23.44 ppm and 19.52%, respectively. The positive (above zero) differential on both figures indicates that the BW is always filtering CO2 and VOC during the experiment.
using plants to reduce energy 29
ReCoMMenDatIons FoR FutuRe DeVeloPMent
Future designs should account for a deeper understanding of how the plants filter the air. Since the INhome ALC system had parameters set for the operation of HVAC components dependent on both VOC and CO2 levels, it is imperative to understand how the plants will affect VOC and CO2 levels.
The majority of the VOCs are actually filtered through the root system of the plants. This fact was not actively represented in the manner of filtration used in the initial BW design. Further research into which processes actively engage or inhibit VOC filtration must be taken into account for subsequent designs.
The plants’ leaves were responsible for the majority of the CO2 absorbed through the process of photosynthesis. Even though the CO2 absorbed by the plants through photosynthesis was greater than the CO2 emitted through respiration over the course of a day, it is important to note that, from a controls standpoint, the plants also underwent respiration and emitted CO2, particularly at night.
It is important to note the humidity of experimental conditions. Indiana has a very humid climate, which reduces the effect of the BW substantially acting as an
evaporative cooler. Furthermore, the need to run a DD to remove excess moisture is compounded by the additional latent load added. However, in an arid climate such as Arizona, a low 10% cooling would save money on cooling while still causing a high change in dry bulb temperature for comfortable air-conditioning. A BW in a dry climate would reduce the load on the HP and AHU substantially more than one in a humid climate, and the potential for not needing a DD at all in an arid climate is plausible.
An abundant hydroponic supply was essential to the livelihood of the plants. However, the water supply pump must be scrutinized in order to mitigate the high amounts of humidity introduced into the zone due to the hydroponic feeding system. The amount of water needed to sustain healthy plants must be analyzed in order to prevent overwatering to gain cost savings in energy reduction by resizing the water pump. Also, it is possible to remove the pump configuration altogether. By using household water pressure to run water for the plants and replacing the supply tank with a drain, it is possible to remove a costly component from the system altogether.
Subsequent design recommendations to tackle the amount of water exposed to the zone include changing from a hydroponic system to an aeroponic system. Aeroponics utilize much less water but still provide the necessary aeration and nutrients that plants need. Transitioning to a
Figure 14. Average daily zone CO2 differential. Figure 15. Average daily zone VOC differential.
30 journal of purdue undergraduate research: volume 3, fall 2013

system that mitigates water use shows that potential cost savings would be substantial, resulting in an economically viable BW design. However, additional challenges due to the vapor nutrient solution and the system being tied directly into a return air duct are prominent, which require additional research.
Finally, the last recommendation is to carefully examine the prescribed level of outside air for residential areas per the American Society of Heating, Refrigerating, and Air-Conditioning Engineers (ASHRAE) Standard 62.2 (2004), and the exception noted for outdoor ventilation rates labeled 4.1.2 Alternative Ventilation. Although at first glance the BW control strategy conflicts with the prescribed requirements of hourly outdoor ventilation, exception 4.1.2 ensures that the BW control strategy does not conflict with ASHRAE 62.2 expectations for outside air unless the design, which inherently limits the outdoor ventilation rate, is not approved by a licensed design professional. The BW can only be implemented when licensed, which requires quantitative results validating the hypothesis so that it can maintain reasonable levels of IAQ without the need for outdoor ventilation.
ConClusIonsThe BW was introduced to the INhome during the 2011 Solar Decathlon as an ad-hoc implementation of a research project being developed at Purdue University. It was believed to reduce energy use of the HVAC system by reducing the need to mechanically introduce fresh air which is costly to heat and cool. This experiment tested the hypothesis that a BW has potential for reducing energy use in a residential building while maintaining reasonable levels of IAQ.
Data collected from the initial BW design showed the potential for energy savings through IAQ filtration. The findings from this experiment indicated that the BW reduced both the VOC and CO2 levels. While the BW does innately act as an evaporative cooler, lowering energy costs of the HP and AHU, this side effect is not in the same order of magnitude as the high energy costs of the components needed to control the added humidity and run the pump for the water.
The current design was not found to decrease energy consumption of the HVAC system; rather, it consumed considerably more energy due to the added components necessary to operate the BW and maintain zone IAQ. Particularly, the BW pump and DD used in the current configuration were not cost-effective. Recommendations for future designs were given and are being implemented in newer versions of the BW.
aCKnoWleDGMentsThe authors would like to thank Brent Dunham for his efforts to fabricate a Biowall and provide access to the research-grade instrumentation that was used. This research would not have been possible without his assistance.
ReFeRenCesASHRAE. (2004). Standard 62.2: Ventilation and acceptable indoor air quality in low-rise residential buildings. Atlanta, GA: American Society of Heating, Refrigerating, and Air-Conditioning Engineers.Salisbury, F. B., Gitelson, J. I., & Lisovsky, G. M. (1997). BIOS-3 Siberian experiments in bioregenerative life support. BioScience, 47(9), 575–585. http://dx.doi.org/10.2307/1313164
using plants to reduce energy 31