using reverse osmosis membranes to control ion transport
TRANSCRIPT

Using reverse osmosis membranes to control ion transport during water electrolysis
Journal: Energy & Environmental Science
Manuscript ID EE-ART-07-2020-002173.R1
Article Type: Paper
Date Submitted by the Author: 19-Aug-2020
Complete List of Authors: Shi, Le; Penn State, Civil & Environmental EngineeringRossi, Ruggero; Penn StateSON, MOON; Penn State, Civil & Environmental EngineeringHall, Derek; Penn State, EMS Energy InstituteHickner, Michael; Penn State, Department of Materials Science and EngineeringGorski, Christopher; Penn State, Civil and Environmental EngineeringLogan, Bruce; Penn State, Civil & Environmental Engineering
Energy & Environmental Science

1
1 Date: August 17, 20202 Submitted to: Energy Env. Sci. 34 Using reverse osmosis membranes to control ion transport during water electrolysis 56 Le Shi1, Ruggero Rossi1, Moon Son1, Derek M. Hall2, Michael A. Hickner3, Christopher A. Gorski1,7 & Bruce E. Logan1
8 1Department of Civil and Environmental Engineering, The Pennsylvania State University, University Park, PA, USA. 9 2Department of Energy and Mineral Engineering, The Pennsylvania State University, University Park, PA, USA.
10 3Department of Materials Science and Engineering, The Pennsylvania State University, University Park, PA, USA. 111213 The decreasing cost of electricity produced using solar and wind and the need to avoid CO2 emissions 14 from fossil fuels has heightened interest in hydrogen gas production by water electrolysis. Offshore and 15 coastal hydrogen gas production using seawater and renewable electricity is of particular interest, but 16 it is currently economically infeasible due to the high costs of ion exchange membranes and the need 17 to desalinate seawater in existing electrolyzer designs. A new approach is described here that uses 18 relatively inexpensive commercially available membranes developed for reverse osmosis (RO) to 19 selectively transport favorable ions. In an applied electric field, RO membranes have a substantial 20 capacity for proton and hydroxide transport through the active layer while excluding salt anions and 21 cations. A perchlorate salt was used to provide an inert and contained anolyte, with charge balanced 22 by proton and hydroxide ion flow across the RO membrane. Synthetic seawater (NaCl) was used as the 23 catholyte, where it provided continuous hydrogen gas evolution. The RO membrane resistance was 21.7 24 ± 3.5 Ω cm2 in 1 M NaCl and the voltages needed to split water in a model electrolysis cell at current 25 densities of 10-40 mA cm–2 were comparable to those found when using two commonly used, more 26 expensive ion exchange membranes. 272829 Introduction
30 Hydrogen gas accounts for 1% of global energy use,1, 2 with 50 billion kg of gas produced globally each
31 year (~53% for fertilizer). Hydrogen gas production could increase in the future due to its potential uses
32 in transportation and energy storage. Reducing fossil fuel consumption and CO2 emissions associated with
33 H2 production can be accomplished using renewable energy sources, such as solar and wind. Although the
34 cost of H2 produced by water electrolysis is currently dominated by electricity prices, electrolyzer capital
35 costs will become increasingly important in the future.3 To make H2 production by water electrolysis
36 economically competitive to H2 produced from methane, the costs of the membrane (commonly a cation
37 exchange membrane, CEM) and the catalyst layer used in most direct water electrolysis systems must be
Page 1 of 24 Energy & Environmental Science

2
38 decreased, as they contribute to nearly half of the cost of the electrolysis cell stack.4 A second barrier to
39 affordable H2 gas production by water electrolysis is the location of the renewable energy. Offshore and
40 coastal sites are especially of interest for H2 production to link locations with affordable wind or solar
41 arrays with abundant seawater.5-7 However, the direct use of seawater as an electrolyte in contact with
42 the anode results in the production of high concentrations of chlorine gas and other toxic chlorinated
43 compounds (e.g. chlorine, chlorine radicals, and other forms of oxidized chlorine) that can damage
44 membranes.6, 8, 9 Therefore, it is currently necessary to first desalinate water before electrolysis to avoid
45 chloride oxidation and to use either highly acidic CEMs which restrict catalyst use to noble metals or use
46 highly alkaline solutions with anion exchange membranes (AEMs).6, 7, 10, 11 Current efforts to directly use
47 seawater have been primarily directed at developing electrodes with large overpotentials for chloride
48 oxidation to facilitate oxygen evolution,12-14 but this approach has not yet achieved commercial success.
49 Asymmetric electrolyte feeds, using an alkaline KOH anolyte and seawater catholyte has also recently
50 been proposed, but this approach required the use of relatively expensive AEMs that can degrade in
51 alkaline solutions.15-17
52 Here, we demonstrate a different approach for improving the economic viability of water electrolysis
53 using synthetic seawater based on repurposing low-cost reverse osmosis (RO) membranes to replace
54 expensive CEMs. The cost of the RO membranes (<$10 m–2) is an order of magnitude less than CEMs (~
55 $500 – $1000 m–2), providing a path for greatly decreasing membrane costs for water electrolyzer systems.
56 In addition, RO membranes can be highly selective for small ions, allowing transport of protons (diameter
57 of 0.20 nm, in the form of H3O+) and OH– ions (0.22 nm) through the membrane to sustain current
58 generation with an applied potential while excluding the passage of larger ions such as Na+ and Cl– .18, 19
59 The RO membrane can restrict the passage of large salt ions from the anolyte, allowing the use of an
60 asymmetric anolyte that does not result in the generation of chlorine gas and other strong oxidizers (HOCl
61 and OCl–), which could damage the membrane.20 For example, perchlorate salts or acids are often used as
Page 2 of 24Energy & Environmental Science

3
62 electrolytes in electrochemical studies because chlorine is fully oxidized and therefore stable, enabling
63 selective water oxidation by the oxygen evolution reaction to produce only O2. Saline water, such as
64 seawater, can be used as the catholyte without needing to be desalinated as it is kept separated from the
65 anode by the RO membrane. When using these two different electrolytes the anolyte rapidly becomes
66 slightly acidic, increasing the concentration of protons for transport across the membrane, while the
67 catholyte pH increases with hydrogen gas evolution occurring under relatively alkaline conditions. Typical
68 RO membranes can be operated over a pH range of 2-11,21 and thus strongly acidic or alkaline solutions
69 need to be avoided. This approach of using moderately acidic or basic solutions in the presence of other
70 competing anions and cations is fundamentally different from current water electrolysis methods in which
71 both electrolytes are either highly acidic or alkaline and all other ions are excludes from the solutions.
72 While diffusive ion transport in RO membranes has been extensively studied during pressure-driven
73 water desalination,22 relatively little is known on ion transport with an applied electric field in the absence
74 of an appreciable water flux23 as only a few studies have been conducted in the absence of an appreciable
75 water flux.24-26 Because of the unique structure of the thin film composite membrane that retains larger
76 ions, but allows a pressure driven water flux, a thin film membrane has the potential to break the trade-
77 off between ionic conductivity and selectivity that occurs for ion exchange membranes.27, 28 Evidence for
78 the potentially unique applications of RO thin film membranes is provided by results with thin film
79 nanofiltration (NF) membranes that have shown differences in specific ion permeabilities (e.g. Na+ versus
80 Mg2+) in the presence and absence of pressure driven flow,23 and improved performance in flow batteries
81 compared to ion exchange membranes due to better vanadium ion retention coupled with high proton
82 conductivity (3 M H2SO4 electrolyte).29 To examine the potential for using thin film RO membranes for
83 water electrolysis applications we compared the performance of two different commercially available RO
84 membranes (BW 30LE and SW 30HR, DuPont) relative to two different commonly used CEMs (Selemion
85 CMV, Asahi Glass; and Nafion 117, Chemours) in terms of membrane resistance and current densities
Page 3 of 24 Energy & Environmental Science
4
86 relevant for water electrolyzers. Nafion is commonly referred to as a proton exchange membrane (PEM)
87 when used in electrochemical cells, but it conducts other positively charged cations and therefore it more
88 appropriately referred to here as a CEM.30 Thin film RO membranes consist of a very thin active layer that
89 selectively restricts large ion transport while permitting water passage under a pressure gradient, and a
90 highly porous structural layer to support the thin film. The side of the membrane with the active layer
91 usually faces the solution with high salinity to maximize desalination performance.31-33
92
93 Experimental
94 Membrane resistance measurement
95 The ionic resistances of the different membranes were measured using a standard four-electrode
96 method at room temperature.34 All membranes were first immersed in salt solution for 1 day to be
97 equilibrated with the solutions before measurements. The membrane was placed in the middle of cubic
98 shaped cell containing two separate cylindrical chambers. Each chamber filled with 30 mL of a salt solution
99 (NaCl or NaClO4, 0.62 M or 1 M). The membrane area exposed in the aqueous solution was the same as
100 the chamber cross-section (7 cm2). Platinum coated titanium mesh electrodes (4.4 cm2) were placed at
101 each end of the cubic cell (10 cm apart). Current was applied across the cell between two electrodes using
102 a potentiostat (VMP3, Bio-Logic). Two Ag/AgCl reference electrodes (BASi RE-5B, West Lafayette, IN) were
103 located directly adjacent to the membrane (1 cm), on each side of the membrane, in order to record the
104 electric potential difference as a function of current density (over a range of 0.06 to 0.6 mA cm–2,
105 normalized by membrane area) using a digital multimeter. The resistance of the membrane, RM, was
106 determined as follows:
107 RM = Rm+sol – Rsol
Page 4 of 24Energy & Environmental Science

5
108 where Rm+sol is the resistance of the electrolyte solution measured with the membrane, and Rsol is the
109 resistance measured for the electrolyte solution without a membrane. The resistances were determined
110 from the slopes of I-V curves.
111 Electrochemical measurements
112 Hydrogen evolution reaction (HER) studies were carried out in a three-electrode system using a
113 potentiostat (VMP3, Bio-Logic) at room temperature. The cells contained a 10% Pt coated carbon paper
114 (10% Pt/C) as the working electrode, a graphite rod counter electrode, and an Ag/AgCl (3M NaCl)
115 reference electrode. The experimentally applied potential vs. Ag/AgCl potentials were converted to SHE
116 using the following equation:
117 ESHE = EAg/AgCl + 0.197 V
118 Linear sweep voltammetry (LSV) was carried out at 5 mV s-1 between 0 V and –1.4 V (vs. SHE) for the
119 polarization curves. All polarization curves were not iR-compensated. Chronoamperometry (CP) tests
120 were conducted at –1.2V (vs. SHE) for 1 h. The electrolytes were saturated with N2 purging for 30 min
121 before each test. The volume of each electrolyte was 30 mL in each chamber.
122 Water electrolysis tests were conducted in a two-electrode system using two identical 10% Pt/C
123 electrodes (1 cm2) in the same cubic shaped cell with two separate cylindrical chambers. The anode and
124 cathode were separated by the indicated type of membrane. All the current densities for electrolyzer cell
125 performance were normalized by the electrode area (1 cm2) unless otherwise specified.35, 36
126
127 Salt crossover measurements
128 To monitor the cations and anions crossover the different membranes under the same conditions, 1
129 M of KCl was used as the catholyte and 1 M NaClO4 was used as the anolyte. The two-electrode system
130 was used to apply constant current density (10 mA cm–2 or 40 mA cm–2) between anode and cathode for
131 1 h. The catholyte and anolyte solutions were collected and diluted 50 times to measure salt ion
Page 5 of 24 Energy & Environmental Science

6
132 concentrations using ion chromatography (IC, Dionex ICS-1100, Thermo Scientific). Control experiments
133 were conducted under the same conditions but without any applied current. All the measurements were
134 conducted at least two times with different pieces of membrane.
135
136 Membrane stability over time
137 To examine if the transport of ions across the BW membrane was altered over time we conducted
138 chronoamperometry tests at fixed potential of 3.5 or 4.0 V between the anode and cathode for 10 cycles,
139 with 1 hour for each cycle, using a two-electrode setup. Two pieces of BW membrane were used for
140 duplicate tests. To avoid changes in current that could occur due to degradation of the carbon electrodes
141 both electrodes were replaced with new ones for each cycle. KCl (1 M) was used as the catholyte and
142 NaClO4 (1 M) was used as the anolyte. At the end of each cycle, both anolytes and catholytes were
143 collected and diluted 50 times for analysis of the concentration of ions.
144
145 Changes in pH over time
146 During the salt crossover measurements when applying different current density between anode and
147 cathode, the changes in pH of the anolytes and catholytes were monitored simultaneously to observe pH
148 changes during the tests. The final pH was recorded by collecting and mixing the solution. The pH readings
149 will be a little low due to high Na+ concentration in solution. The pH probes (ET042 pH Electrode, eDAQ,
150 Australia) were calibrated before each measurement with standard buffer solutions.
151
152 Gas generation measurements
153 The generated H2 and O2 gases were collected by a drainage method using a lab-made system.35 The
154 two chambers were sealed with epoxy with electrodes exposed area of 1 cm2. The two-electrode system
155 was used to apply constant current density of 40 mA cm–2 for 1 hour, with 1 M NaClO4 as the anolyte and
Page 6 of 24Energy & Environmental Science

7
156 1 M NaCl as the catholyte. The gas volume in the cylinder was recorded every 15 min. The Faradaic
157 efficiency was calculated by comparing the amount of collected gas production with theoretical moles of
158 gas using:
159 𝐹𝐸 =𝑛𝐻2
𝑛𝐶𝐸
160 The theoretical moles of H2 ( ) that could be recovered based on the measured current with the 𝑛𝐶𝐸
161 assumption that all electrons passing through the circuit engage in proton reduction is:
162 𝑛𝐶𝐸 =∫𝑛
𝑖 = 1𝐼𝑖∆𝑡
2𝐹
163 where, is the internal time over which current data are collected, and F=96485 C mole-1 electron is ∆𝑡
164 Faraday’s constant. Each mole of H2 generation requires two moles of electrons.
165
166 Results and discussion
167 Membrane ionic resistances
168 Electrical current generation in conventional water electrolyzers is enabled by the low resistance of
169 the separator or membrane to ion flow, and thus it is critical that alternative membranes, such as RO
170 membranes, have low resistances comparable to CEMs. Using a standard four-electrode approach to
171 measure membrane resistances,37 we discovered that certain RO membranes exhibit sufficiently low ionic
172 resistances in highly saline solutions (Figure S1 and SI). For example, tests using a standard, unmodified
173 brackish water thin film RO membrane (BW), with the active layer facing the cathode (BW/Cat) exhibited
174 a resistance of 21.7 ± 3.5 Ω cm2 at low current densities (< 1 mA cm-2) in a 1 M NaCl electrolyte and 16.8
175 ± 4.8 Ω cm2 in a 1 M NaClO4 electrolyte (Figure 1a, Figure S2). These resistances were reasonably low but
176 somewhat larger than those measured for the Selemion CEM (Sel) of 4.2 ± 1.2 Ω cm2 and Nafion 117 (Naf)
177 of 7.2 ± 0.8 Ω cm2, and a resistance reported (4.89 Ω cm2, Sel) under the same conditions of 1 M NaCl.37
Page 7 of 24 Energy & Environmental Science
8
178 These relatively low RO membrane resistances were not found to be an intrinsic property of all RO
179 membranes. For example, another RO membrane (SW, DuPont Co) had a much larger resistance of 190 ±
180 75 Ω cm2 in 1 M NaCl electrolyte and 190 ± 65 Ω cm2 in 1 M NaClO4 electrolyte with the active layer facing
181 the cathode (SW/Cat). As we discuss below, the low resistances measured here for the BW RO membrane
182 at a low current density (<1 mA cm–2) relative to those desirable for water electrolyzers would not enable
183 the production of large proton gradients on the membrane surface that can be important in maintaining
184 ion balances at higher current densities.
185
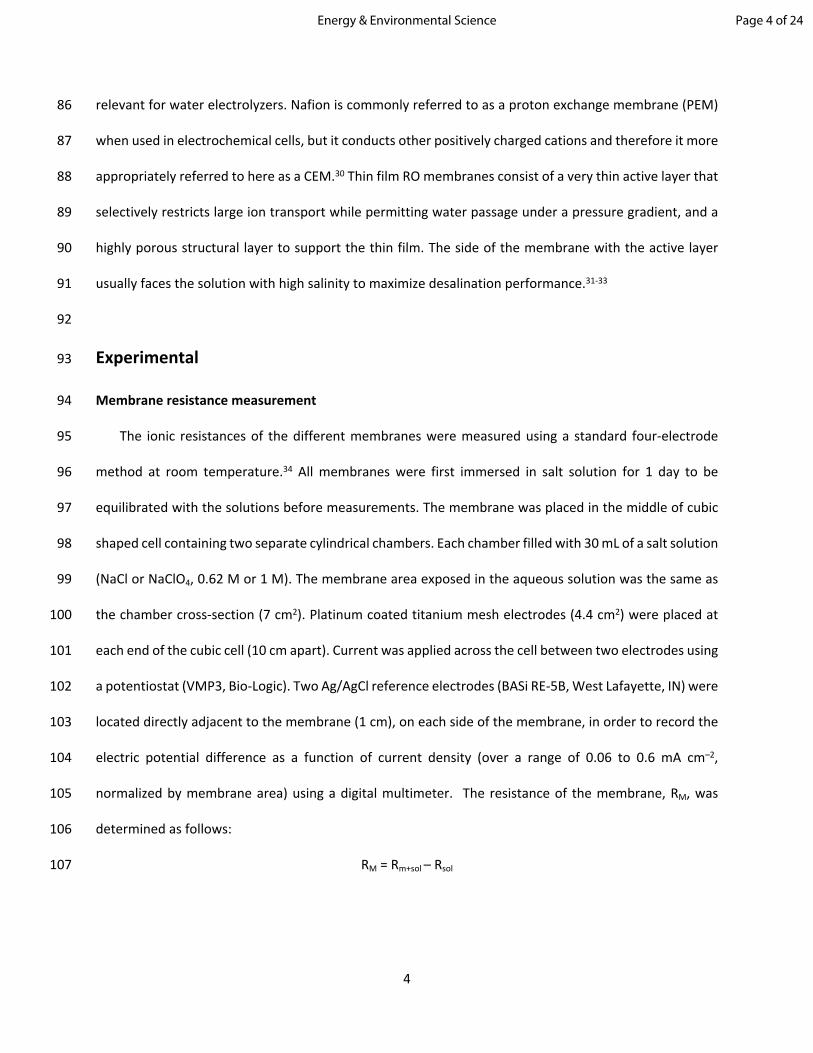
Figure 1. Membrane resistance measured in four-electrode method with different membranes in (a) 1 M NaCl orNaClO4 electrolytes, or (b) 0.62 M NaCl or NaClO4 electrolytes (0.06 to 0.6 mA/cm2, based on membrane area).
186
187 Membrane resistances depended more on the membrane used rather than the orientation of the
188 active layer or the specific electrolyte. Resistances measured using a 1 M NaClO4 electrolyte were similar
189 to those obtained using a 1 M NaCl electrolyte for both RO membranes, independent of membrane
190 orientation (Figure 1a). Lowering the electrolyte concentration to that of seawater (0.62 M NaCl)
191 increased the measured resistances for all membranes (Figure 1b, Figure S2). The resistances were 13.5
192 ± 0.3 Ω cm2 for Sel, 46 ± 18 Ω cm2 for BW/Cat, and 310 ± 170 Ω cm2 for SW/Cat in 0.62 M NaCl electrolyte.
193 The lower ionic resistance of BW membranes suggests this membrane is more permeable to ion transport
194 than the SW membrane due to its thinner active layer,38 which is further examined below. The difference
Page 8 of 24Energy & Environmental Science

9
195 in resistances for the two types of RO membranes suggested that RO membranes could be better designed
196 to enhance ion transport for their use in water electrolyzers; for example, through surface charge
197 modifications or nanoengineering of RO membrane surfaces.27, 39, 40
198
199 Cell performance with RO membranes
200 The overall energy requirements for water electrolysis is a function of the applied voltage, which
201 depends on the cell current, membrane resistances, solution resistances and electrode overpotentials. A
202 linear sweep voltammetry (LSV) of a model electrolysis cell with all four membranes showed that Naf
203 produced the highest current densities at a given potential, with the BW/Cat producing the next highest
204 current densities at an applied potential of 3.5 V (Figure 2a). At a current density of 10 mA cm–2 commonly
205 used to compare overpotentials,35, 36 similar potentials were required for all cases except for the SW/Cat
206 and SW/Ano conditions. There were larger differences between the BW and SW membranes than those
207 due to the orientation of the active layers (Figure 2a). In chronoamperometry (CP) tests at current density
208 of 40 mA cm–2, the required potentials were lowest for the BW/Cat membrane and the Naf compared to
209 the other membranes and test conditions (Figure 2b). Differences in measured potentials were primarily
210 due to differences in mass transfer resistances for each ion species, presumably through the membrane,
211 as the same electrode materials (10% Pt/C electrodes) and electrolytes (1 M NaClO4 anolyte and 1 M NaCl
212 catholyte) were used in these tests.
213
Page 9 of 24 Energy & Environmental Science

10
214
215 Figure 2. Different membranes in two-electrode system by using two identical 10% Pt/C electrodes as working and 216 counter electrodes using (a) LSV with a scan rate of 5 mV/s, and (b) CP with step current density applied (10, 20, 30 217 and 40 mA cm–2), with NaClO4 (1 M) anolyte and NaCl (1 M) catholyte. 218
219 The choice of using RO membranes or ion exchange membranes will impact the specific ions
220 transported across the membrane, as the RO membrane is selective primarily based on ionic size and
221 mobility, while the CEM will primarily transport cations. Interestingly, these differences did not
222 substantially impact cathode performance based on monitoring the individual electrode reactions. When
223 NaCl was used as the catholyte at a concentration representative of seawater (3.5 wt%, 0.62 M), with the
224 anolyte added at the same mass concentration (3.5 wt%, 0.29 M NaClO4), the cathode potential was –1.0
225 V vs. SHE at 10 mA cm-2 with a Tafel slope of 362 mV/dec for Sel and 340 mV/dec for BW/Cat (Figure S4).
226 Using these electrolytes at the same concentration (1 M) decreased the magnitude of applied potential
227 to –0.60 V vs. SHE at 10 mA cm-2, with a decreased Tafel slope of 291 mV/dec for Sel and 236 mV/dec for
228 BW/Cat. The performance of the cathodes used in this study were impacted by solution conditions (Figure
229 S6), as shown by a decrease in the Tafel slope to 181 mV/dec for Selemion and 158 mV/dec for BW/Cat
230 membrane by adding a phosphate buffer to the anolyte and catholyte to improve performance. When a
231 Tafel slope is larger than ~120 mV per decade, overall rates are likely limited by mass transfer rather than
232 electrode kinetics.41 The use of solutions that could be more applicable for a seawater-based electrolyzer
233 (i.e. 0.62 M NaCl catholyte and NaClO4 anolyte) rather than more optimal electrolytes (e.g. higher salt
234 concentrations and buffered solutions) would be expected to reduce mass transport limitations. This
235 comparison of the electrode overpotentials and Tafel slopes does, however, show the similarity of RO and
236 CEM membranes when mass-transport was controlling the performance (i.e. Tafel slopes > 120 mV/dec).
237 An additional chronoamperometry experiment was conducted using 0.62 M NaCl in both chambers for 1
238 h at –1.2 V vs. SHE applied potential (for cathode), producing a current density of 60-90 mA cm-2 (Figure
239 S5). In these tests there was clear evidence of damage to the Selemion membrane due to chlorine
Page 10 of 24Energy & Environmental Science
11
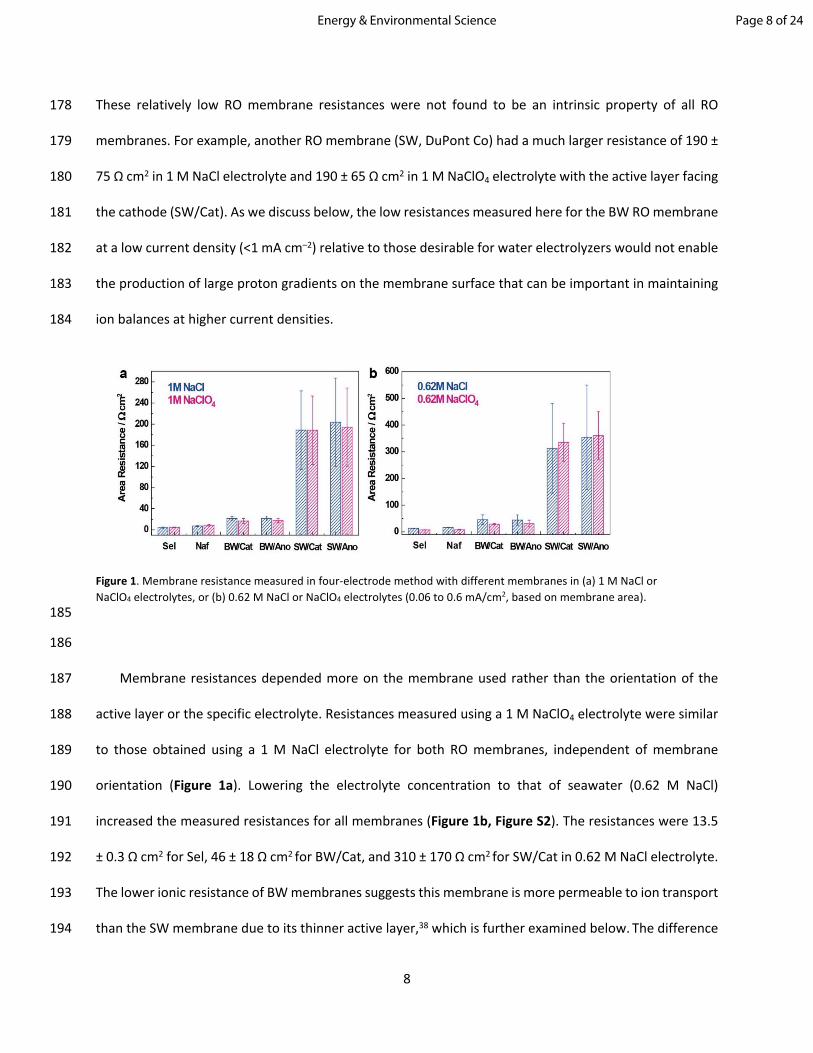
240 evolution from Cl– oxidation in the anolyte, consistent with other studies.20 In contrast, there was no
241 observable membrane damage under the same conditions using the 0.62 M NaClO4 anolyte. This
242 experiment provided direct evidence that evolution of reactive, oxidized chlorine species can be avoided
243 by choosing a contained and unreactive anolyte.
244
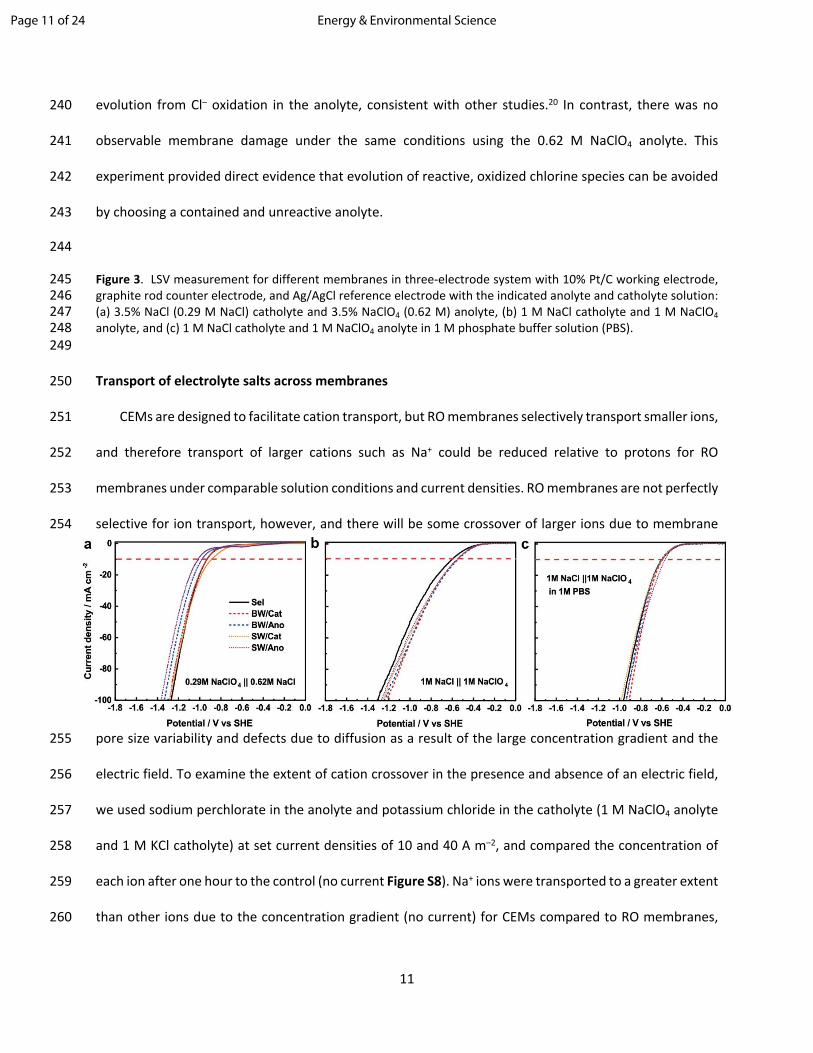
245 Figure 3. LSV measurement for different membranes in three-electrode system with 10% Pt/C working electrode, 246 graphite rod counter electrode, and Ag/AgCl reference electrode with the indicated anolyte and catholyte solution: 247 (a) 3.5% NaCl (0.29 M NaCl) catholyte and 3.5% NaClO4 (0.62 M) anolyte, (b) 1 M NaCl catholyte and 1 M NaClO4 248 anolyte, and (c) 1 M NaCl catholyte and 1 M NaClO4 anolyte in 1 M phosphate buffer solution (PBS). 249
250 Transport of electrolyte salts across membranes
251 CEMs are designed to facilitate cation transport, but RO membranes selectively transport smaller ions,
252 and therefore transport of larger cations such as Na+ could be reduced relative to protons for RO
253 membranes under comparable solution conditions and current densities. RO membranes are not perfectly
254 selective for ion transport, however, and there will be some crossover of larger ions due to membrane
255 pore size variability and defects due to diffusion as a result of the large concentration gradient and the
256 electric field. To examine the extent of cation crossover in the presence and absence of an electric field,
257 we used sodium perchlorate in the anolyte and potassium chloride in the catholyte (1 M NaClO4 anolyte
258 and 1 M KCl catholyte) at set current densities of 10 and 40 A m–2, and compared the concentration of
259 each ion after one hour to the control (no current Figure S8). Na+ ions were transported to a greater extent
260 than other ions due to the concentration gradient (no current) for CEMs compared to RO membranes,
Page 11 of 24 Energy & Environmental Science

12
261 and total Na+ ion transport increased in proportion to the current (Figure 4). With only the concentration
262 difference (no current), the final Na+ concentrations in catholyte were higher using CEMs than RO
263 membranes, with 26.3 ± 2.8 mM for Sel and 13.4 ± 1.3 mM for Naf, with Na+ concentrations < 1.2 mM for
264 the RO membranes (1.02 ± 0.17 mM for BW/Cat and 0.64 ± 0.04 mM for SW/Cat; Figure S8). This same
265 trend of increased Na+ transport with CEMs compared to RO membranes was observed with electric field
266 applied. At 40 A m–2, the transport of Na+ in the direction of the electric field (i.e. towards the cathode)
267 led to 62 ± 8 mM of Na+ (Sel) and 48±2 mM (Naf), compared to a lower range of 17.5 ± 1.6 mM (SW/Cat)
268 to 19.3 ± 2.1 mM (BW/Cat) for the RO membranes (Figure 4). These salt concentrations were reduced
269 with a lower current of 10 A m–2 (42.4 ± 4.8 mM, Sel, 18.5 ± 4.9 mM, Naf, compared to 6.09 ± 0.13 mM,
270 BW/Cat, 5.59 ± 0.35 mM for SW/Cat), indicating enhanced Na+ ion transport due to the electric field.
271 Because ion transport in solution is needed to balance the same applied current, these results indicated
272 that the charge balance was maintained by ions other than Na+ to a greater extent in the RO membranes
273 than in the CEMs.
274
275 Figure 4. (a) Concentration of cations and anions in cell using different membranes after applying a constant current 276 of 40 mA cm-2 between anode and cathode for 1 h: K+ concentration in anolyte (a-1) and Na+ in catholyte (a-2), Cl– 277 in anolyte (a-3) and ClO4
– in catholyte (a-4). K+ in catholyte, Na+ in anolyte, Cl– in catholyte and ClO4– in anolyte were
278 presented in Figure S7. Schematic figure (b) showing ions moving under constant current, with original solution of 279 KCl (1 M) for catholyte and NaClO4 (1 M) for anolyte. KCl was used instead of NaCl (as synthetic seawater) for 280 catholyte in order to indicate the cations transport under different conditions. 281
b
Page 12 of 24Energy & Environmental Science

13
282 The electric field only had a small effect on K+ ion transport towards against the electric field (towards
283 the anode) with all membranes, indicating most of K+ transport was likely due to diffusion not migration.
284 There was still greater K+ ion transport with the CEMs (15.4 ± 0.8 and 8.0 ± 1.6 mM, Sel) than the RO
285 membranes (2.9 ± 1.2 and 0.59 ± 0.13 mM, BW/Cat) (Figures 4, S8, and S9), both with and without an
286 electric field. Diffusion of K+ or Na+ into the opposing electrolyte therefore was due to the large
287 concentration gradients between the two chambers, with greater transport against the electric field due
288 to the higher permeability of positively charged cations through the CEMs.
289 Anion transport was enhanced in the direction of the electric field (towards the anolyte) using RO
290 membranes compared to CEMs which better restrict anion transport. After 1 hour there was 5.1 ± 1.2 mM
291 (SW/Cat) and 15.3 ± 4.4 mM (BW/Cat) of Cl– in the anolyte at 40 mA cm–2, compared to <0.6 mM for the
292 CEMs in all cases (with or without current). Chloride transport was enhanced by the electric field as there
293 was <1mM accumulation of Cl– in control experiments with no current (0.10 ± 0.01 mM, SW/Cat; 0.98 ±
294 0.09 mM, BW/Cat). For ClO4–, ion transport against the electric field resulted in a range of 1.76 ± 0.26 mM
295 (BW/Cat) to 0.09 ± 0.02 mM (SW/Cat) in the catholyte for the RO membranes with 40 mA cm–2. However,
296 in other tests at 10 mA cm–2 (Figure S9), there was little overall enhanced perchlorate ion transport out of
297 the anolyte indicating its transport through the membrane was mainly by diffusion.
298 The fraction of charge that was carried through the membrane to maintain charge balance when a
299 current is applied was calculated by performing an ionic charge balance using the data in Figure 4. Proton
300 production in the anode chamber reduces the anolyte pH, and hydroxide production in the catholyte
301 chamber increases the catholyte pH, as observed for both CEM and RO membranes (Figure S10). The
302 maximum proton concentration in the anolyte was calculated assuming that 100% of the current led to
303 proton production with a 1H+:1e– ratio, and that no protons were transported through the membrane
304 (Max, Figure 5a). Based on the set current (40 mA cm-2) the maximum possible proton concentration was
305 49.7 mM in anolyte. The calculated value was generated by performing a charge balance calculation (Ion
Page 13 of 24 Energy & Environmental Science

14
306 balance, Figure 5a, SI), and the measured concentrations were obtained using a pH electrode of the final
307 electrolyte (Measured, Figure 5a). The calculated proton concentrations remaining in the anolyte were
308 higher than those measured, indicating additional ion transport occurred between the electrolyte
309 chambers either due to ion swapping reactions or membrane imperfections. The measured remaining
310 proton concentrations in the anolyte for all membranes, converted from the measured pH values of final
311 anolytes (Figure S11), were much lower than this maximum, with 27.9 mM for Sel, 22.2 mM for Naf, 13.7
312 for BW/Cat and 20.0 mM for SW/Cat, supporting the passage of protons through both CEMs and RO
313 membranes due to the imposed electric field (Figure 5a).
314
315
316
317 Figure 5. (a) Proton concentrations in the anolyte for different conditions, assuming a 100% Faradaic efficiency (40 318 mA cm–2 for 1 h): maximum proton concentration for no proton transport through membrane (Max); proton 319 concentrations remaining based on measured ion transport of other salt species (Ion balance) and proton 320 concentrations converted from measured pH values at the end of the experiment (Measured). (b) The fraction of 321 charge carried by protons transported through different membranes to sustain the current density of 40 mA cm-2 or 322 10 mA cm-2 for 1 h (1 M NaClO4 anolyte and 1 M KCl catholyte). 323
324 Based on these experiments and additional tests conducted under a lower applied current density (10
325 mA cm-2), we concluded that the selectivity of proton transport is larger for the RO membranes than for
326 the CEMs (Figure 5b and Figure S12). For example, 0.08 mmol of protons were transferred through the
Page 14 of 24Energy & Environmental Science

15
327 Sel membrane, or 5% of the total charges (1.49 mmol) needed to balance charge at 40 mA cm–2. For the
328 RO membranes, 0.6 mmol or 40% of the total charge was proton for the BW/Cat configuration, and 0.88
329 mmol or 59% for SW/Cat configuration at 40 mA cm-2 (details of the calculation are provided in the SI).
330 An additional concern is membrane stability over time in the electrolytes. The stability of the BW
331 membrane relative to maintaining a constant current and changes in passage of ions over time was
332 examined by applying a constant potential of 3.5 V for 5 cycles, followed by 5 more cycles with 4.0 V across
333 the anode and the cathode (10 cycles total, each 1 h long). Examination of the changes in total ions
334 transferred showed that ions transported against the electric field (ClO4– and K+) did not increase in
335 concentration over time based on the lack of significance of the slopes (all with p>0.05) for the final
336 concentrations at the end of each cycle over time (Figure 6), consistent with the results in Figure 4
337 (additional data in Figure S13). The diffusion of perchlorate and potassium ions was similar in amount
338 over all the data suggesting that the active layer was not impaired during the tests. For the two ions
339 transported in the direction of the electric field (Na+ and Cl–) the mass of ions transported there was a
340 slight increase in Cl– ion transport at 3.5 V (p=0.005) but not at 4.0 V d (p=0.101). For Na+ ion transport at
341 both applied voltages there was a small but significant (p=0.027, 3.5 V; p<0.001, 4.0 V) increase in ion
342 transport over time. The reason for this increase was not clear, and this phenomenon requires further
343 investigation. A longer period of time was not examined here as the carbon electrodes used here oxidize
344 over time and thus the system can have changes in performance unrelated to the membrane stability but
345 due to chemical reactions on the carbon electrodes that might impact membrane stability and
346 performance.42
347
Page 15 of 24 Energy & Environmental Science

16
348
Figure 6. The concentration of cations and anions using BW membranes after applying constant potentials of 3.5 V and then 4.0 V (total of 10 cycles, with 1 hour for each cycle): (a) K+ concentration in anolyte, (b) Na+ in catholyte, (c) Cl– in anolyte, and (d) ClO4
- in the catholyte. Two pieces of BW membrane were used for duplicate tests. The * shows that the slope of the linear regression was significant at the p<0.05 level. Details of the statistical analysis are summarized in Table S1.
349 Faradaic product efficiency of the seawater electrolysis
350 A water displacement gas collection system was used to collect the gases produced by the cathode and
351 anode to evaluate gas recoveries for practical applications and Faradaic efficiencies (Figure 7). Gas
352 collection tests were conducted using a 1 M NaCl catholyte and 1 M NaClO4 anolyte. At a set current
353 density of 40 mA cm-2 for 1 h, H2 and O2 were produced at the expected molar ratio (2.13±0.09:1) (Figure
354 7a). A total of 16.0 ± 0.2 mL H2 was obtained within 1 h, showing a Faradaic efficiency of >95 % in all tests
355 with the different membranes. The smaller Faradaic efficiency for O2 evolution could have been due to
356 carbon corrosion of the anode which was not optimized for these membrane-based tests (Figure 7b).42
Page 16 of 24Energy & Environmental Science

17
357
358
359 Engineering RO membranes to function more efficiently in salty water electrolyzers.
360 There is a well-known tradeoff in RO membranes relative to selectivity versus permeability for water
361 flux,27, 28, 39, 43 but this relationship has not been sufficiently examined in the presence of an electric field
362 across the membrane and in the absence of bulk water flow. CEMs achieve selective charge transport of
363 cations over anions, but RO membranes have the advantage of size exclusion to aid transport of protons
364 compared to larger cations. Thus, it was shown here that more Na+ and K+ cations were transferred by
365 CEMs in the presence or absence of current compared to RO membranes (Figure 4). Furthermore, an ion
366 balance demonstrated greater proportion of protons transported through the RO membranes to balance
367 charge than the other ions (Figure 5). Ion transport and ion selectivity in the active layer of an RO
368 membrane, in the absence of pressure-driven water flow, is not understood from the perspective of
369 charge balance when proton transport is favored over larger ion transport (e.g. chloride). Ion transport
370 through separators that are either nonselective or selective on the sizes of large molecules (for example
371 in nanofiltration or ultrafiltration membranes) is fundamentally different from that through RO
Figure 7. (a) Volume of generated H2 and O2 at a constant current of 40 mA cm-2
for 1 h with 1 M NaClO4 anolyte and 1 M NaCl catholyte. (b) Faradaic efficiency of H2 and O2 evolution. The inset picture is the lab-made system with cylinders capturing the gases from the anode and cathode filled with colored water to make the water lines more visible (shown for an experiment with the BW/Cat membrane after 1 h of collection).
Page 17 of 24 Energy & Environmental Science

18
372 membranes which are size selective on the scale of molecular radius. Due to the need for charge balance
373 on both sides of the RO membrane and the high proton generation rate at the anode, the proton gradient
374 at the surface of an RO membrane during water electrolysis is unlike previously studied situations without
375 current generation for situations comparable to nanofiltration membranes where ion transport is due
376 primarily to pressure forces.44
377 Greater selective transport of protons in RO membranes could be achieved through two approaches:
378 reducing defects and adjusting the charge of the membrane surface. The surface charge of RO membranes
379 can be varied. The BW membrane used here has been reported to have a more positive surface charge of
380 the active layer at lower pHs and a more negative surface charge of the active layer at higher pHs than
381 the SW membrane.22, 45 The negative surface charge is believed to be favorable for protons transport,22
382 consistent with our results (Figure 2). When the active layer of the RO membrane faced the catholyte that
383 had a higher pH (BW/Cat and SW/Cat), the overpotential was lower than that obtained with the active
384 layer facing the anolyte which had a lower pH (BW/Ano and SW/Ano). RO membrane coatings, such as
385 polyethylene glycol, polyvinyl acetate, polydopamine, and other strategies have been used to accomplish
386 surface charge engineering of RO and FO membranes.46 The BW membrane is also more permeable due
387 to less polyamide cross-linking than the SW membrane, which could account for greater diffusional
388 transport of all ions using the BW membrane. 18, 19 Therefore, there is much that can be done to better
389 engineering RO and FO membranes to function more effectively for desirable small ion transport in water
390 electrolyzer systems.
391 Another challenge for using RO membranes with seawater is controlling loss of anolyte salts into the
392 catholyte. Sodium perchlorate salts were used here as they are known to be electrochemically stable as
393 they do not lead to more oxidized forms of chlorine. However, other salts could be investigated for the
394 purpose of providing an electrochemically stable environment such as sulfate or other compounds. An
395 additional concern would be whether pH levels became too acidic (<2) in the anolyte or too alkaline (>11)
Page 18 of 24Energy & Environmental Science

19
396 in the catholyte as these could lead to damage of the membrane.21 A low pH can lead to appreciable
397 concentrations of perchloric acid which could potentially damage the polyamide layer, but there is little
398 known about the impact of perchlorate on RO membranes. Others have used thin film polyamide
399 membranes in 3 M H2SO4, but they did not report on membrane stability.29 Compared to other
400 predominant chlorine species (e.g. Cl2, HOCl and OCl–) perchlorate is the least effective oxidizer.47 There
401 will always be some loss of ions from the anolyte into the catholyte as RO membranes do not completely
402 reject salts. However, even if it is not possible to completely eliminate perchlorate transfer into the
403 catholyte, the removal of perchlorate through biological treatment is a relatively simple process.48-51
404 Amending the solution with a substrate such as acetate or even dissolved hydrogen can enable the rapid
405 reduction of perchlorate to chloride in several different types of systems including packed beds, fluidized
406 beds, and hollow fiber membrane bioreactors.49, 52-56
407 The main research approach for directly using seawater has been to focus on using electrode materials
408 that favor the oxygen evolution reaction (OER) over chloride oxidation.12-14 For example, a porous
409 manganese-based electrode was first proposed to selectively enhance the OER in acidic solutions.57 It has
410 also been shown that deposition of MnOx onto IrOx enhances OER selectivity by a blocking mechanism, in
411 which the MnO2 prevents Cl– from reaching the catalytically active IrOx.58 NiFe-based (oxy) hydroxides are
412 currently considered to be one of the most efficient OER catalysts among different non-noble metal
413 catalysts in alkaline electrolytes.59 A multilayer anode of a nickel-iron hydroxide (NiFe) electrocatalyst
414 layer coated on a nickel sulfide (NiSx) layer formed on porous Ni foam (NiFe/NiSx-Ni) can afford superior
415 catalytic activity and corrosion resistance in solar-driven alkaline seawater electrolysis.60 A sandwich-like
416 nanostructured HER catalyst by decorating both sides of nickel phosphide microsheet arrays with nickel
417 cobalt nitride nanoparticles was recently produced to possess impressive stability benefiting from the
418 good chlorine-corrosion resistance in neutral pH seawater.61 These advances in electrode materials will
419 be especially useful when used in concert with an RO membrane as chloride ion transport cannot be
Page 19 of 24 Energy & Environmental Science

20
420 completely eliminated. The leakage of some chloride ions, combined with electrodes that selectively
421 enhance the OER over chloride oxidation, will result in a more robust and effective process.
422 The use of RO or FO membranes in water electrolyzers can have additional benefits other than very
423 low costs compared to CEMs. For example, they could be used to directly provide water into the anolyte
424 chamber to replenish that lost during water electrolysis and like CEMs that are effective at preventing gas
425 transfer between the chambers. A current density of 100 mA cm–2 requires a water flux of 0.34 L m–2 h–1
426 (LMH). By altering the anolyte concentration to act as a draw solution, or through adjusting pressure in
427 the two chambers, it should be possible to add additional water source into the anolyte chamber. This
428 procedure to add water might be best conducted in the absence of current generation to avoid carryover
429 of dissolved H2 into the anode chamber. Just like a CEM, the RO membrane is not just a separator of ions,
430 it can also avoid gas phase transfer between the chambers,62 which is used in CEM water electrolyzers to
431 enable higher pressure hydrogen gas production, but not in alkaline water electrolyzers that usually use
432 a separator which is more permeable to gas transport.
433
434 Conclusions
435 This study presented a first proof-of-concept design by using RO membrane based electrolyzer for
436 direct seawater H2 generation with inert anolyte. By comparing two types of RO membranes (BW and SW)
437 and two types of ion exchange membranes (CEM and Nafion 117), it was found that BW membrane has
438 acceptable performance over the membrane resistance and electrolysis over potential. Overall, there
439 remain challenges for using ion excluding thin film composite membranes such as RO membranes
440 compared to ion exchange membranes that facilitate transport of all like-charged ions. However, the
441 overall cost of the RO membranes compared to ion exchange membranes provides incentive to explore
442 their use in water electrolyzer systems. While the main focus of the studies here is to enable the direct
443 use of seawater in these systems, the comparison between RO membrane and IEM on transport of
Page 20 of 24Energy & Environmental Science

21
444 protons and salt ions in electric field showed that RO membranes possessed promising selectivity of
445 protons over cation salts when using high concentrated electrolytes and the polyamide based thin-film
446 composite membrane as presented here should provide opportunities for their use in conventional water
447 electrolyzer systems based on the use of alkaline solutions.
448449450 Conflicts of Interest451 There are no conflicts to declare.452453 Acknowledgments454 This research was funded by the Stan and Flora Kappe endowment, Penn State University, the National 455 Science Foundation grant CBET-2027552, and by USAID and NAS through Subaward 2000010557. Any 456 opinions, findings, conclusions, or recommendations expressed in this article are those of the authors 457 alone, and do not necessarily reflect the views of USAID or NAS. 458459 References460 1. Essential Chemical Industry, 461 http://www.essentialchemicalindustry.org/chemicals/hydrogen.html, (accessed May 7, 2020).462 2. B. E. Logan, Environ. Sci. Technol. Lett., 2019, 6, 257-258.463 3. D. V. Esposito, Joule, 2017, 1, 651-658.464 4. A. T. Mayyas, M. F. Ruth, B. S. Pivovar, G. Bender and K. B. Wipke, Manufacturing cost analysis 465 for proton exchange membrane water electrolyzers, Report NREL/TP-6A20-72740 United States 466 10.2172/1557965 NREL English, ; National Renewable Energy Lab. (NREL), Golden, CO (United 467 States), 2019.468 5. S. Dresp, F. Dionigi, S. Loos, J. Ferreira de Araujo, C. Spöri, M. Gliech, H. Dau and P. Strasser, Adv. 469 Energy Mat., 2018, 8, 1800338.470 6. S. Dresp, F. Dionigi, M. Klingenhof and P. Strasser, ACS Energy Lett., 2019, 4, 933-942.471 7. W. Tong, M. Forster, F. Dionigi, S. Dresp, R. Sadeghi Erami, P. Strasser, A. J. Cowan and P. Farràs, 472 Nature Energy, 2020, DOI: 10.1038/s41560-020-0550-8.473 8. Y. Yang, J. Shin, J. T. Jasper and M. R. Hoffmann, Environ. Sci. Technol., 2016, 50, 8780-8787.474 9. M. Stolov and V. Freger, Environ. Sci. Technol., 2019, 53, 2618-2625.475 10. K. E. Ayers, E. B. Anderson, C. Capuano, B. Carter, L. Dalton, G. Hanlon, J. Manco and M. 476 Niedzwiecki, ECS Transactions, 2019, 33, 3-15.477 11. M. Bernt, A. Hartig-Weiß, M. F. Tovini, H. A. El-Sayed, C. Schramm, J. Schröter, C. Gebauer and H. 478 A. Gasteiger, Chemie Ingenieur Technik, 2020, 92, 31-39.479 12. F. Dionigi, T. Reier, Z. Pawolek, M. Gliech and P. Strasser, ChemSusChem, 2016, 9, 962-972.480 13. S.-H. Hsu, J. Miao, L. Zhang, J. Gao, H. Wang, H. Tao, S.-F. Hung, A. Vasileff, S. Z. Qiao and B. Liu, 481 Advanced Materials, 2018, 30, 1707261.482 14. R. K. B. Karlsson and A. Cornell, Chem. Rev., 2016, 116, 2982-3028.483 15. S. Dresp, T. Ngo Thanh, M. Klingenhof, S. Brückner, P. Hauke and P. Strasser, Energy Env. Sci., 484 2020, 13, 1725-1729.485 16. S. K. Jeong, J. S. Lee, S. H. Woo, J. A. Seo and B. R. Min, Energies, 2015, 8, 7084-7099.
Page 21 of 24 Energy & Environmental Science

22
486 17. J. Fan, S. Willdorf-Cohen, E. M. Schibli, Z. Paula, W. Li, T. J. G. Skalski, A. T. Sergeenko, A. 487 Hohenadel, B. J. Frisken, E. Magliocca, W. E. Mustain, C. E. Diesendruck, D. R. Dekel and S. 488 Holdcroft, Nature Commun., 2019, 10, 2306.489 18. S.-J. Kim, S. Kook, B. E. O'Rourke, J. Lee, M. Hwang, Y. Kobayashi, R. Suzuki and I. S. Kim, J. Mem. 490 Sci., 2017, 527, 143-151.491 19. S.-J. Kim, D. Han, H.-W. Yu, B. E. O'Rourke, Y. Kobayashi, R. Suzuki, M. Hwang and I. S. Kim, 492 Desal., 2018, 432, 104-114.493 20. M. Son, T. Kim, W. Yang, C. A. Gorski and B. E. Logan, Environ. Sci. Technol., 2019, 53, 8352-8361.494 21. Dupont, FilmTec™ reverse osmosis membranes technical manual, 2020.495 22. K. Kezia, J. Lee, W. Ogieglo, A. Hill, N. E. Benes and S. E. Kentish, J. Mem. Sci., 2014, 459, 197-496 206.497 23. P. Nativ, N. Fridman-Bishop and Y. Gendel, J. Mem. Sci., 2019, 584, 46-55.498 24. V. Freger and S. Bason, J. Mem. Sci., 2007, 302, 1-9.499 25. S. Bason, Y. Oren and V. Freger, J. Mem. Sci., 2007, 302, 10-19.500 26. S. Bason, Y. Oren and V. Freger, J. Mem. Sci., 2011, 367, 119-126.501 27. J. R. Werber, A. Deshmukh and M. Elimelech, Environ. Sci. Technol. Lett., 2016, 3, 112-120.502 28. G. M. Geise, M. A. Hickner and B. E. Logan, ACS Appl. Mat. Interfac., 2013, 5, 10294-10301.503 29. Q. Dai, Z. Liu, L. Huang, C. Wang, Y. Zhao, Q. Fu, A. Zheng, H. Zhang and X. Li, Nature Commun., 504 2020, 11, 13.505 30. K. Hongsirikarn, J. G. Goodwin, S. Greenway and S. Creager, J. Power Sources, 2010, 195, 7213-506 7220.507 31. G. T. Gray, J. R. McCutcheon and M. Elimelech, Desal., 2006, 197, 1-8.508 32. M. Elimelech and W. A. Phillip, Science, 2011, 333, 712-717.509 33. T. Y. Cath, M. Elimelech, J. R. McCutcheon, R. L. McGinnis, A. Achilli, D. Anastasio, A. R. Brady, A. 510 E. Childress, I. V. Farr, N. T. Hancock, J. Lampi, L. D. Nghiem, M. Xie and N. Y. Yip, Desal., 2013, 511 312, 31-38.512 34. G. M. Geise, A. J. Curtis, M. C. Hatzell, M. A. Hickner and B. E. Logan, Environmental Science & 513 Technology Letters, 2014, 1, 36-39.514 35. C. Bai, S. Wei, D. Deng, X. Lin, M. Zheng and Q. Dong, Journal of Materials Chemistry A, 2017, 5, 515 9533-9536.516 36. J. Lai, S. Li, F. Wu, M. Saqib, R. Luque and G. Xu, Energy Env. Sci., 2016, 9, 1210-1214.517 37. G. M. Geise, A. J. Curtis, M. C. Hatzell, M. A. Hickner and B. E. Logan, Environ. Sci. Technol. Lett., 518 2014, 1, 36-39.519 38. N. Fridman-Bishop and V. Freger, J. Mem. Sci., 2017, 540, 120-128.520 39. A. P. Straub, C. O. Osuji, T. Y. Cath and M. Elimelech, Environ. Sci. Technol., 2015, 49, 12551-521 12559.522 40. X.-H. Ma, Z.-K. Yao, Z. Yang, H. Guo, Z.-L. Xu, C. Y. Tang and M. Elimelech, Environ. Sci. Technol. 523 Lett., 2018, 5, 123-130.524 41. M. Chatenet, J. Benziger, M. Inaba, S. Kjelstrup, T. Zawodzinski and R. Raccichini, J. Power 525 Sources, 2020, 451, 227635.526 42. L. M. Roen, C. H. Paik and T. D. Jarvi, Electrochemical and Solid-State Letters, 2004, 7, A19.527 43. G. M. Geise, D. R. Paul and B. D. Freeman, Progress in Polymer Science, 2014, 39, 1-42.528 44. J. Wang, D. S. Dlamini, A. K. Mishra, M. T. M. Pendergast, M. C. Y. Wong, B. B. Mamba, V. Freger, 529 A. R. D. Verliefde and E. M. V. Hoek, J. Mem. Sci., 2014, 454, 516-537.530 45. E. Idil Mouhoumed, A. Szymczyk, A. Schäfer, L. Paugam and Y. H. La, J. Mem. Sci., 2014, 461, 531 130-138.532 46. G. Hurwitz, G. R. Guillen and E. M. V. Hoek, J. Mem. Sci., 2010, 349, 349-357.533 47. F. A. Cotton and G. Wilkinson, Advanced Inorganic Chemistry (5th ed.), Wiley-Interscience, 1988.
Page 22 of 24Energy & Environmental Science

23
534 48. B. E. Logan, J. Wu and R. F. Unz, Water Res., 2001, 35, 3034-3038.535 49. S. G. Lehman, M. Badruzzaman, S. Adham, D. J. Roberts and D. A. Clifford, Water Res., 2008, 42, 536 969-976.537 50. S. Sevda, T. R. Sreekishnan, N. Pous, S. Puig and D. Pant, Bioresour. Technol., 2018, 255, 331-339.538 51. P. B. Hatzinger, Environ. Sci. Technol., 2005, 39, 239A-247A.539 52. J. C. Brown, R. D. Anderson, J. H. Min, L. Boulos, D. Prasifka and G. J. G. Juby, Journal - AWWA, 540 2005, 97, 70-81.541 53. B. E. Logan and D. LaPoint, Water Res., 2002, 36, 3647-3653.542 54. R. Nerenberg, B. E. Rittmann and I. Najm, Journal American Water Works Association, 2002, 94, 543 103-114.544 55. B. Min, P. J. Evans, A. Chu and B. E. Logan, Water Res., 2004, 38, 47-60.545 56. H. Zhang, M. A. Bruns and B. E. Logan, Environ. Microbiol., 2002, 4, 570-576.546 57. J. E. Bennett, Int. J. Hydrogen Energy, 1980, 5, 401-408.547 58. J. G. Vos, T. A. Wezendonk, A. W. Jeremiasse and M. T. M. Koper, J. Am. Chem. Soc., 2018, 140, 548 10270-10281.549 59. L. Yu, L. Wu, B. McElhenny, S. Song, D. Luo, F. Zhang, Y. Yu, S. Chen and Z. Ren, Energy Env. Sci., 550 2020, DOI: 10.1039/D0EE00921K.551 60. Y. Kuang, M. J. Kenney, Y. Meng, W.-H. Hung, Y. Liu, J. E. Huang, R. Prasanna, P. Li, Y. Li, L. Wang, 552 M.-C. Lin, M. D. McGehee, X. Sun and H. Dai, Proc. Nat. Academy Sci., 2019, 116, 6624-6629.553 61. L. Yu, L. Wu, S. Song, B. McElhenny, F. Zhang, S. Chen and Z. Ren, ACS Energy Lett., 2020, 5, 554 2681-2689.555 62. J. S. Louie, I. Pinnau and M. Reinhard, J. Mem. Sci., 2008, 325, 793-800.556557
Page 23 of 24 Energy & Environmental Science

24
558 Broader context559 Hydrogen gas generation is essential for fertilizer production and other uses, but it currently is a major 560 contributor to greenhouse gas emissions from fossil fuels. Hydrogen gas can be produced through water 561 electrolysis and renewable solar or wind energy, but capital costs for water electrolyzers need to be 562 reduced. Offshore and coastal sites for hydrogen production are good locations for obtaining inexpensive 563 wind and solar energy and abundant seawater, but chloride ions in seawater generate toxic chlorine gas 564 that damages water electrolyzer membranes. It is shown here that reverse osmosis membranes used for 565 seawater desalination are highly permeable to proton transport, and thus provide performance that is 566 similar to ion exchange membranes that are 10 to 100 times more expensive. RO membranes pass protons 567 through small pores that are efficient at exclusion of larger ions. Therefore, they can be used to contain 568 salts in anolyte that do not generate chlorine gas, while seawater can be used in the catholyte for 569 hydrogen gas production. These results show that that by using appropriate RO membranes and anolyte, 570 the costs of water electrolysis membranes can be reduced while facilitating the use of contained 571 electrolytes that avoid unwanted chemical reactions. 572
Page 24 of 24Energy & Environmental Science